Sample Category Title
Consolidation Not Going According to Plan
Market picture
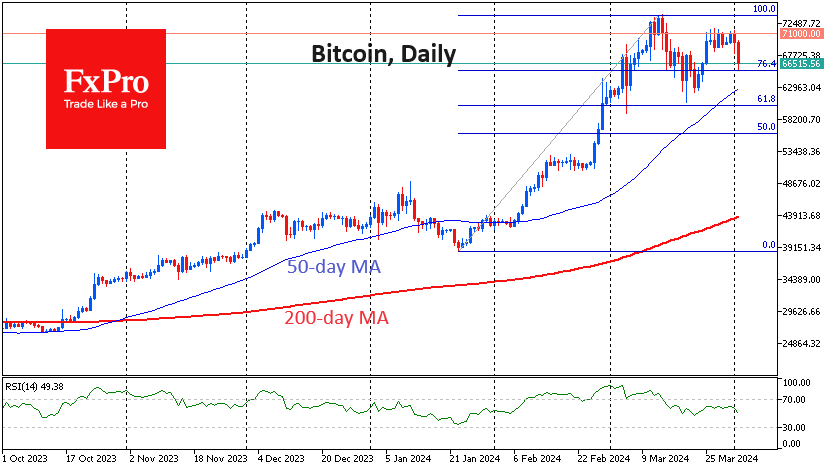
The crypto market lost 4% in 24 hours, falling to a capitalisation of $2.53 trillion. Bitcoin (-3.7%), Ethereum (-4.5%) and BNB (-3.5%) are all down by the same amount. Solana (-6.4%) and Doge (-7.9%) are lagging the market, not to mention the systematically weak Avalanche (-7% for the day and -17% for 7 days) and Cardano (-4.5% for the day and -19% for 30 days).
A promising consolidation has yet to bear fruit. For Bitcoin, the bullish chart picture has not changed: we see only an extension of the consolidation after the rally from the January lows to mid-March. The next key support area is $62.8-63.0K, where the 50-day moving average and the lows of the corrective pullback in March are centred.
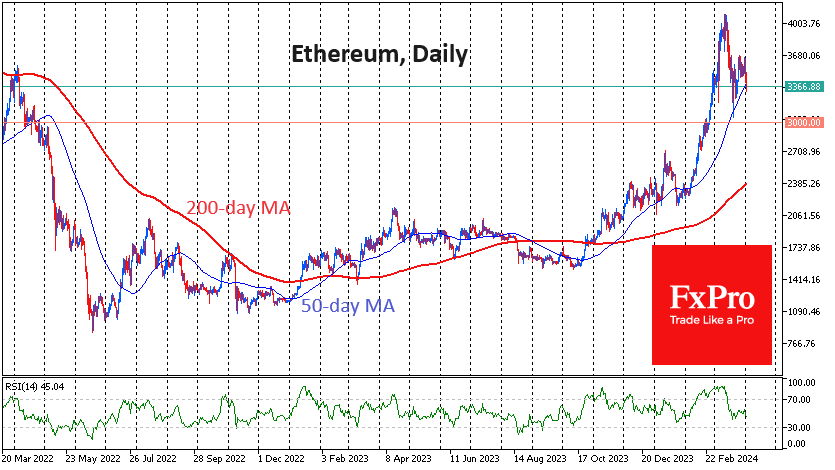
Ethereum has been testing the 50-day MA since the beginning of the day, which actively played the role of support in March. It has been rising steadily since the end of last year, but too much distance from it has caused corrections on more than one occasion.
News background
According to CoinShares, investments in crypto funds rose by $862 million last week, following a record outflow of $942 million the week before. Investments in Bitcoin rose by $865 million, while those in Solana rose by $6 million, and those in Ethereum fell by $19 million. Against the backdrop of bitcoin’s recovery to $70,000, assets under management (AuM) increased from $88.2 billion to $97.9 billion, CoinShares noted.
According to Arkham Intelligence, Tether increased its bitcoin reserves by 8,888 BTC ($618 million) to 75,354 BTC ($5.23 billion), making it the seventh largest Bitcoin holder.
The Tron Foundation has filed a motion in a New York federal court to dismiss a lawsuit brought by the US SEC alleging that Tron’s crypto assets and BitTorrent are unregistered securities. Tron’s lawyers argue that the SEC’s jurisdiction does not extend to transactions that take place on global platforms outside the US.
Telegram released an update that allows owners of channels with more than 1,000 subscribers to receive 50% of ad revenue in the Toncoin (TON).
Pound Stabilizes as Shop Inflation Drops
The British pound is steady on Tuesday after starting the week with losses. In the European session, GBP/USD is trading at 1.2563, up 0.09%. On Monday, the pound fell 0.57% and dropped as low as 1.2539, its lowest level since February 14.
UK shop inflation eases to 1.3%
Inflation in UK stores fell to 1.3% y/y in March, according the British Retail Consortium (BRC). This was below the 2.5% rise in February and the market estimate of 2.2% and was the lowest level since December 2021. The BRC also reported that food price inflation fell to 3.7% y/y in March, its lowest level since April 2022. This was the 10th straight month that food prices inflation has decelerated.
The data points to headline inflation continuing to fall and has raised expectations for a rate cut from the Bank of England. The markets have priced in a quarter-point cut in June at 62%, with an outside chance of an initial quarter-point cut in May. The BoE has stuck to its script of “higher for longer”, maintaining rates at 5.25% for five straight times, but the March meeting signaled a possible shift in policy.
Governor Bailey said at the March meeting that the UK was “on the way” to winning the battle against inflation but signaled that rate cuts could be on the way. As well, eight MPC members voted to pause and one voted to lower rates at the March meeting, while at the previous meeting, two members voted in favor of a rate hike. The UK releases the March inflation report on April 16th and this release will likely have a significant impact on the BoE’s rate path.
GBP/USD Technical
- GBP/USD is testing support at 1.2605. Below, there is support at 1.2552
- There is resistance at 1.2704 and 1.2757
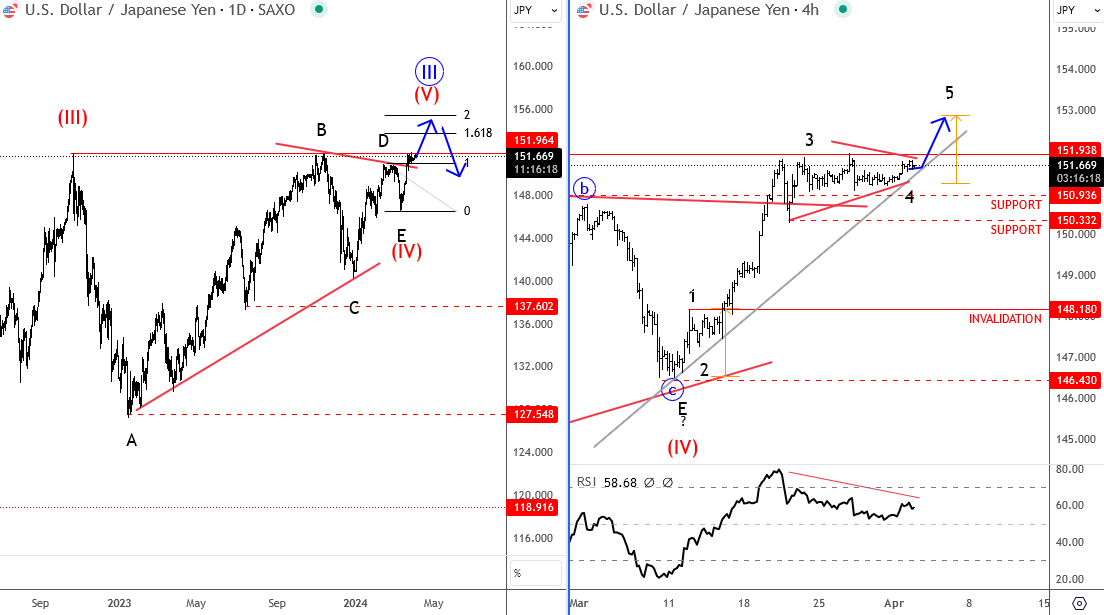
Elliott Wave Analysis on USD/JPY: Correction Within Uptrend
JPY came down across the board, even though BOJ decided to end its ultra-loose policy, by raising rates for 10bp in March. USDJPY is coming higher anyhow, with price breaking some very important trendline connected from 2023 highs. It can even represent part of a bullish triangle which is finished now, so USDJPY has room for much more gains, especially after current sideways price pattern. It looks like a wave four triangle here on 4h time frame, so more upside, and possibly final leg up can show up at the start of the month. Ideally wave 5 will hit 153.00 where bulls can slow down a bit.
WTI Oil: Brightening Demand Outlook Continues to Inflate the Price
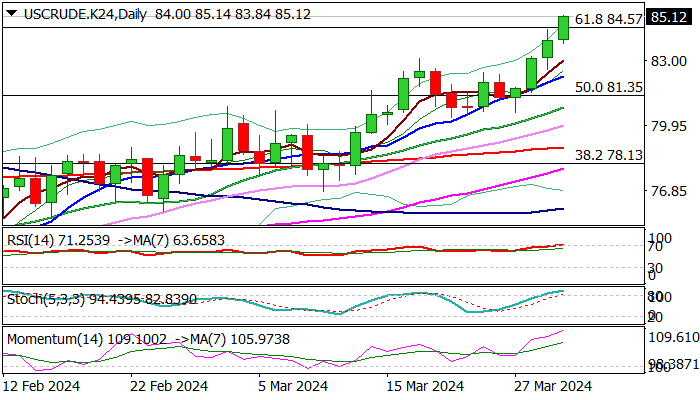
WTI oil price continues to trend higher and hit five-month high on Tuesday, probing above $85.00 barrier for the first time since late October.
The last bull-leg extends into fourth consecutive day, underpinned by brightening demand outlook on firmer than expected China’s and US economic data, as well as drop in OPEC oil production in February.
Fresh bullish signal is developing on daily chart after the price broke above pivotal Fibo barrier at $84.57 (61.8% retracement of $95.00/$67.70 downtrend), with close above this level to confirm signal and contribute to support from bullish daily technical studies.
Bulls eye immediate target at $85.87 (Oct 27 high), guarding $88.56 (Fibo 76.4%).
Former top ($8310) and rising 10DMA ($82.24) should contain corrective dips to offer better buying opportunities.
Res: 85.87; 87.00; 88.56; 90.00.
Sup: 84.57; 83.58; 83.10; 82.24.
EUR/USD outlook: Bears Eye 2024 low
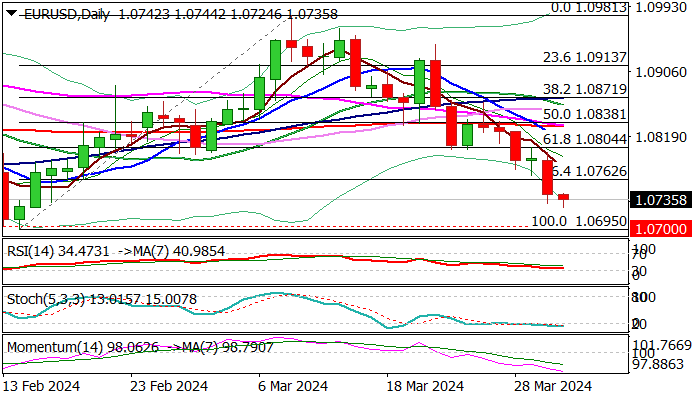
The Euro fell to new multi-week low early Tuesday, weighed by firm dollar and recent dovish comments from ECB policymakers, who see four rate cuts in 2024.
Monday’s 0.4% drop and close below 1.0762 (Fibo 76.4% of 1.0695/1.0981 upleg), adds to bearish near-term outlook and unmasks key support at 1.0695 (2024 low, posted on Feb 14).
Strengthening negative momentum on daily chart and MA’s in bearish setup (10/200DMA death cross and converged 55/200DMA’s about to form bear-cross) point to bearish technical picture, though oversold conditions may slow bears for consolidation.
Broken pivotal supports at 1.0800 zone (daily cloud base / Fibo 61.8%) reverted to solid barriers which should keep the upside protected.
Traders look fresh signals from today’s release of German CPI data and Eurozone inflation report on Wednesday.
Res: 1.0762; 1.0804; 1.0834; 1.0861.
Sup: 1.0724; 1.0695; 1.0611; 1.0585.
UK PMI manufacturing finalized at 50.3, signaling first growth since July 2022
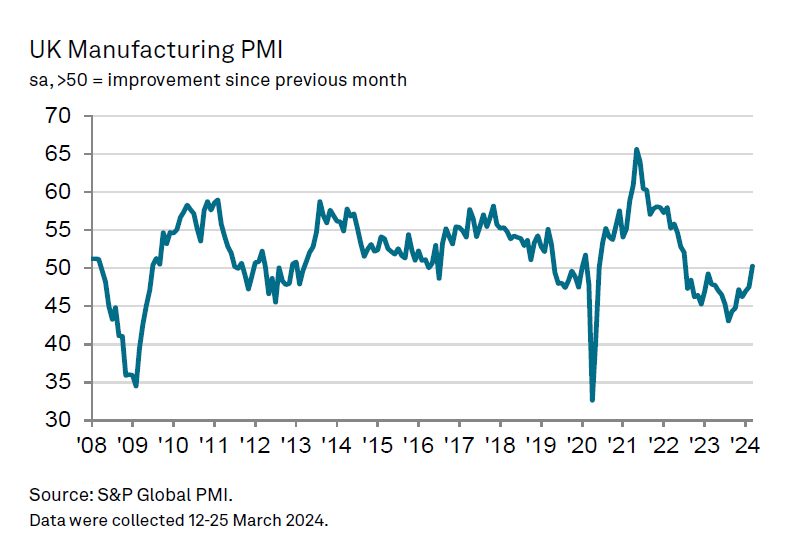
UK PMI Manufacturing was finalized at 50.3 in March, climbing from February's 47.5 to mark a 20-month high. This development represents the sector's first move above the critical 50.0 threshold since July 2022, indicating a tentative resurgence in manufacturing activity.
Rob Dobson, Director at S&P Global Market Intelligence, highlighted, "The end of the first quarter saw UK manufacturing recover from its recent doldrums." This recovery is attributed primarily to revival in production and new orders, spurred by strengthening domestic demand. Despite the growth being characterized as hesitant, following year-long downturns, the shift towards expansion signals a turning point for the sector.
The resurgence in demand has also buoyed manufacturers' confidence, with positive sentiment reaching an 11-month peak. Remarkably, 58% of companies surveyed anticipate increase in their output over the coming year.
However, challenges persist, including "weak export performance and supply chain stresses," which continue to hinder the sector's full recovery potential. The EU market, in particular, has been identified as the "main drag" on overseas demand, compounded by ongoing issues in the Red Sea impacting supply chains.
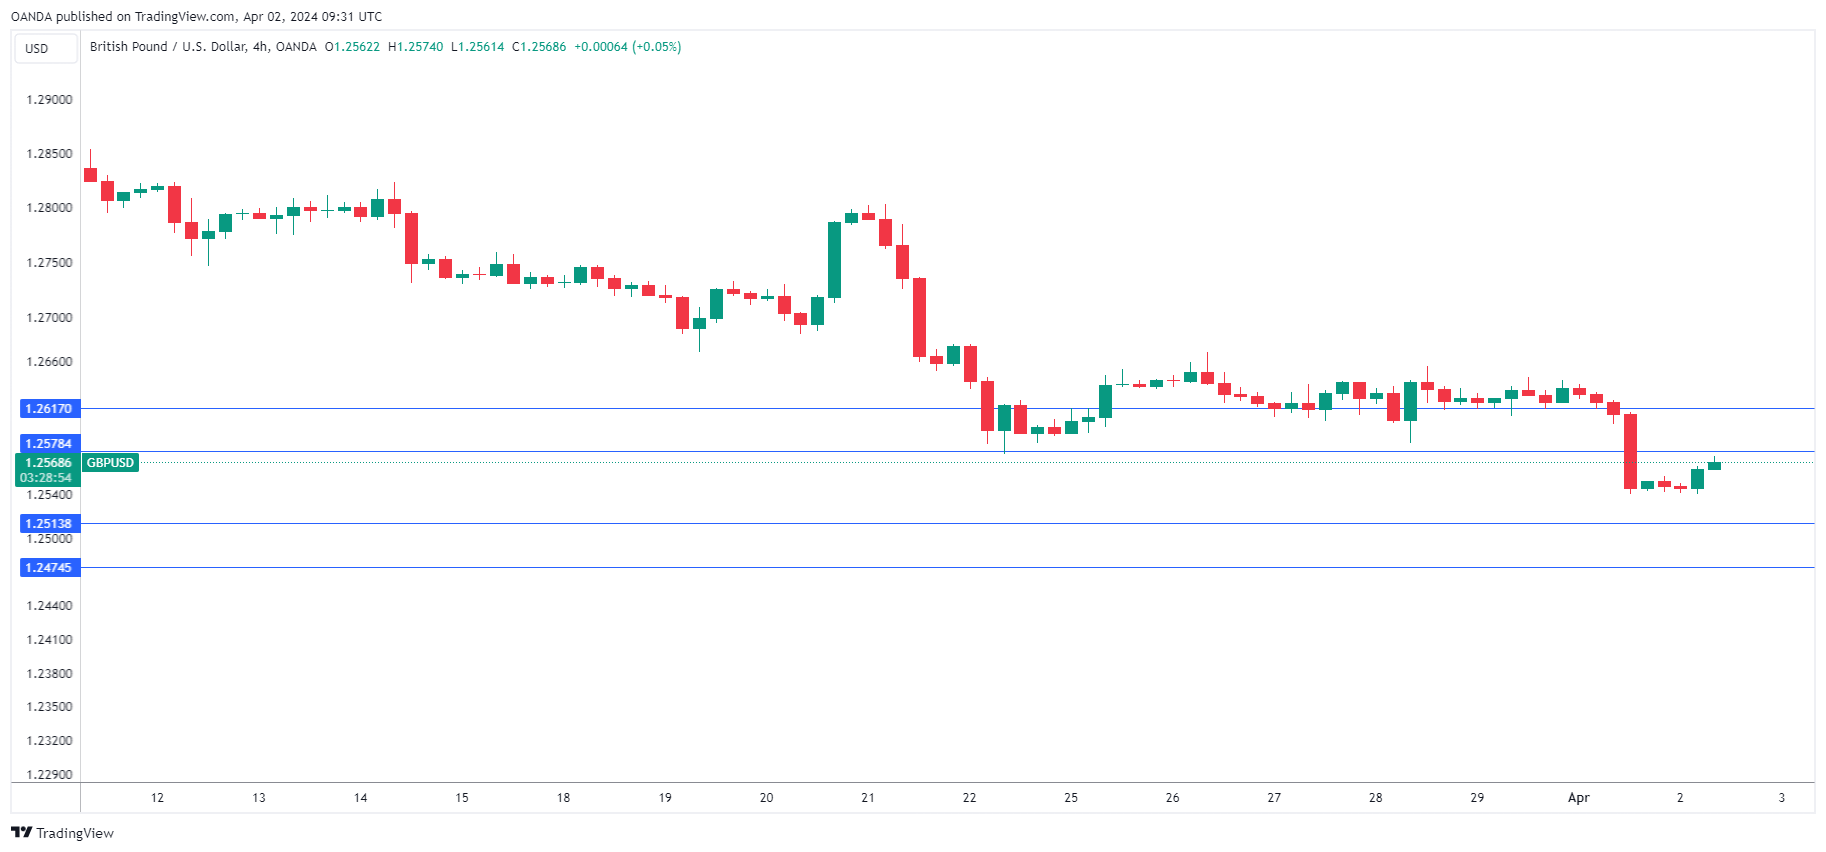
GBPUSD Starts April With a Drop
- GBPUSD moves sharply down on the first trading day of April
- 2024 neutral trajectory valid above 1.2500
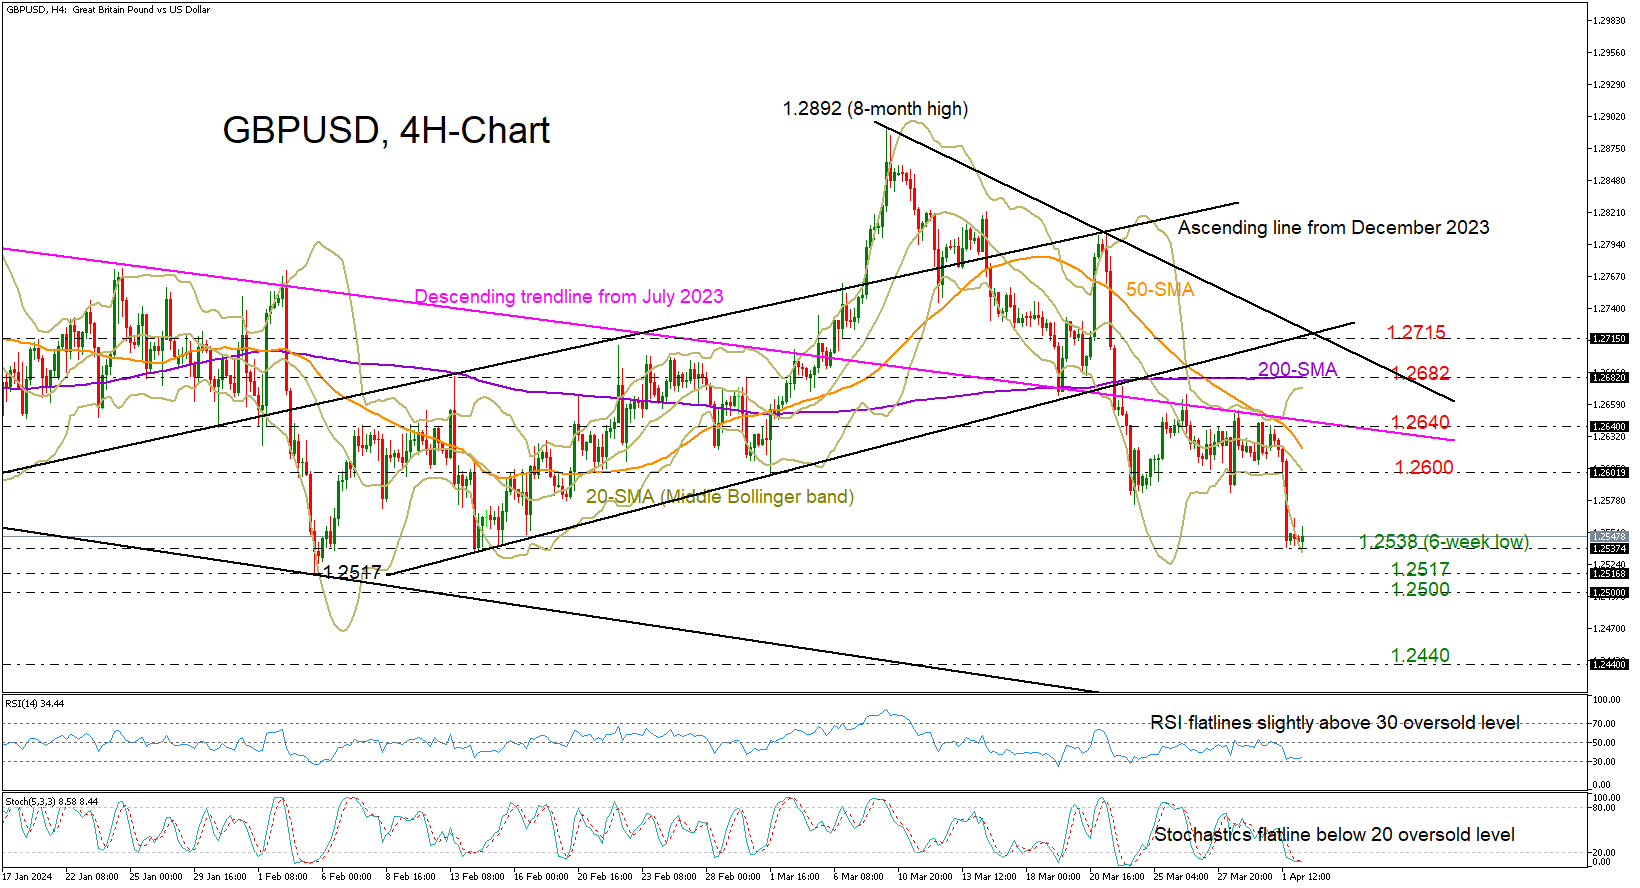
GBPUSD plummeted to a six-week low of 1.2538 as investors returned from the Easter holiday break, re-establishing the downward pattern from the March high.
Given the price's position at the bottom of the 2024 range and around the lower Bollinger band, it will be intriquing to observe if the pair can avoid a bearish breakout even after getting another rejection from the December 2023 descending trendline.
Should sellers maintain control, the price might initially examine February’s low of 1.2517 and the 1.2500 psychological number before plunging towards the key 1.2440 constraining zone. Additional losses from there could soften somewhere between the 1.2400 round level and the tentative support line drawn from December 21 at 1.2380.
In the event the pair builds a firm base around 1.2538, traders might shift their attention to the 1.2600 mark, where the 20-period simple moving average (SMA) is located. A decisive move higher could face another challenging session near the December resistance line at 1.2640. The bulls will have to overcome that bar to meet the flattening 200-period SMA at 1.2680, a break of which is expected to direct the price towards the broken ascending trendline at 1.2715.
In summary, GBPUSD had a rough start to the month, though hopes for a rebound may not evaporate unless the pair exits its 2024 neutral trajectory below the 1.2500 region.
Eurozone PMI manufacturing finalized at 46.1, two largest cylinders out of action
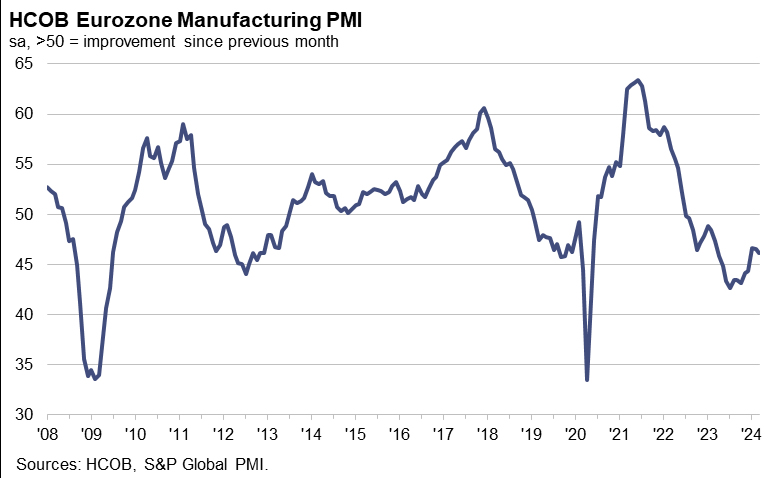
Eurozone PMI Manufacturing was finalized at 46.1 in March, down from February's 46.5. Disparities across member countries continued, with Greece achieving a 25-month high at 56.9, Italy at 12-month high at 50.4, and Spain dipped slightly to 5.1.4. Meanwhile, Germany recorded a 5-month low at 41.9, and France fell to 46.2.
Cyrus de la Rubia, Chief Economist at Hamburg Commercial Bank, provided a grim outlook based on the latest PMI figures, suggesting that the recession in Eurozone's manufacturing sector is likely to persist.
De la Rubia noted that Eurozone's manufacturing industry, heavily reliant on the collective output of Germany, France, Italy, and Spain—known as the Euro-4 countries—faces significant challenges as Germany and France experience notable downturns. While Italy and Spain showed signs of recovery in March and February, respectively, their improvements have yet to offset the overall sector's decline.
While that the pace of decrease in incoming orders has slowed in the first quarter, yet the industry still records a net loss in orders compared to the previous months. This trend raises concerns that the sector may soon exceed the longest contraction spell for incoming new orders recorded during the euro crisis from 2011 to 2013. Such a scenario underscores the difficulties facing a swift reversal in manufacturing activity across Eurozone.
EURJPY Pulls Back Towards Crucial Trendline
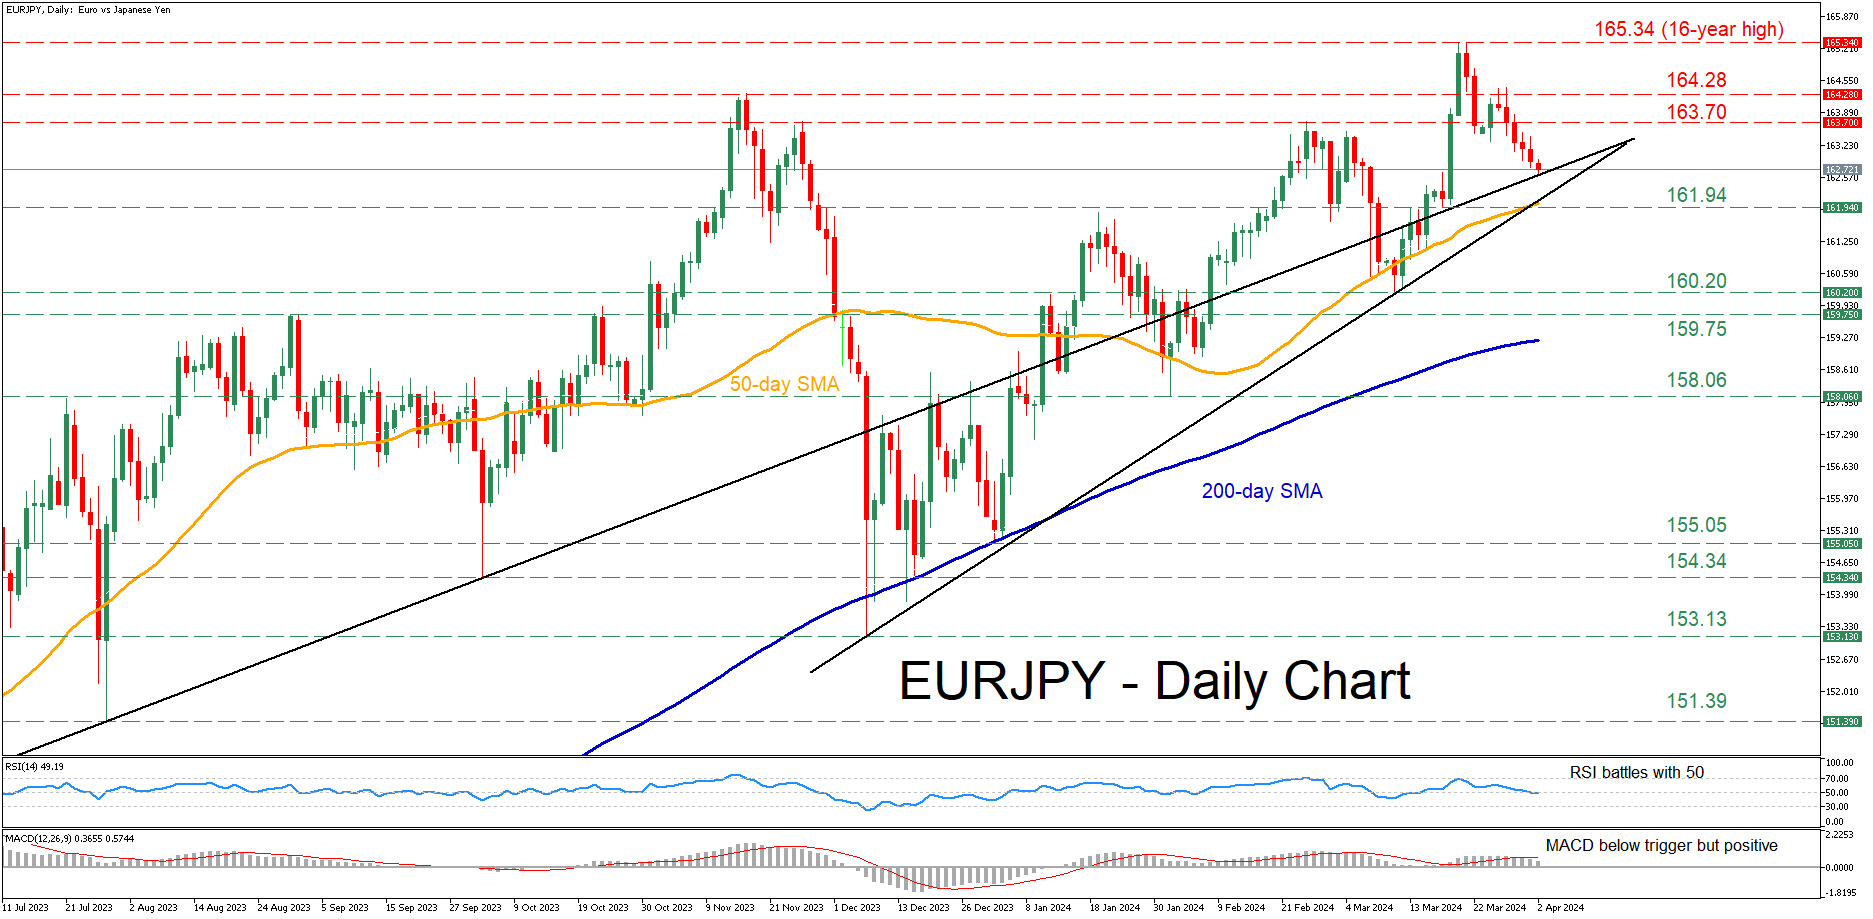
- EURJPY retraces lower following a 16-year peak
- Tests ascending trendline drawn from July 2023
- Oscillators suggest weakening momentum
EURJPY had been in a steady advance since December 2023, peaking at a fresh 16-year high of 165.34 on March 20. Since then, the pair has been undergoing a downside correction, with the upward sloping trendline that connects higher lows since July 2023 currently acting as a strong support.
Should the trendline fail to hold its ground, the pair could slide towards the recent support of 161.94, which lies very close to the 50-day simple moving average (SMA). A violation of that zone could pave the way for the Mach bottom of 160.20. Further declines might then cease at the August-October resistance region of 159.75, which might serve as support in the future.
On the flipside, bullish actions could propel the price towards the February peak of 163.70. Conquering that barricade, the bulls may attack the 2023 high of 164.28. If that barrier fails, the price could ascend to revisit its 16-year high of 165.34.
In brief, EURJPY has been on the retreat in the past few sessions, experiencing a solid setback from its recent 16-year peak. For the bears to gain confidence for a sustained decline, the pair needs to break below the 50-day SMA.
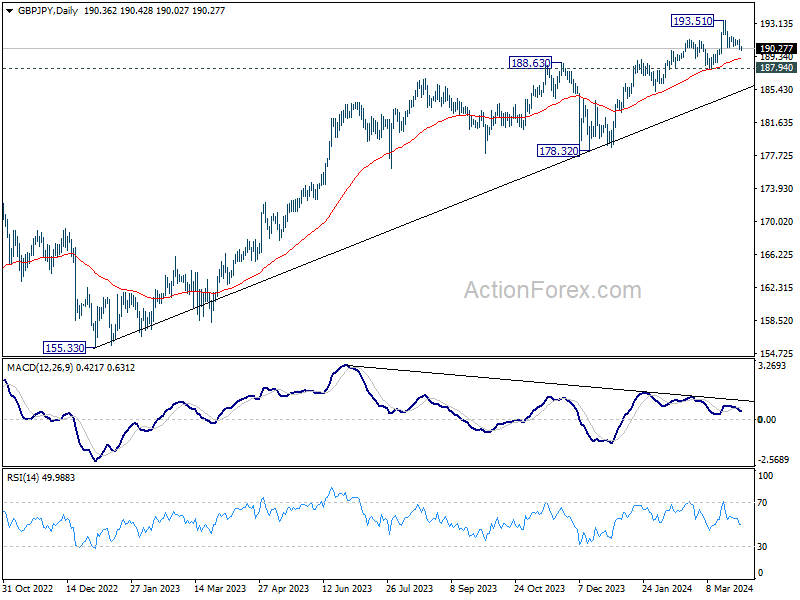
GBP/JPY Daily Outlook
Daily Pivots: (S1) 189.90; (P) 190.63; (R1) 191.08; More.....
Intraday bias in GBP/JPY is mildly on the downside as fall from 193.51 short term top extends. Deeper decline would be seen towards 187.94 structural support. On the upside, break of 191.65 minor resistance will turn bias back to the upside for retesting 193.51.
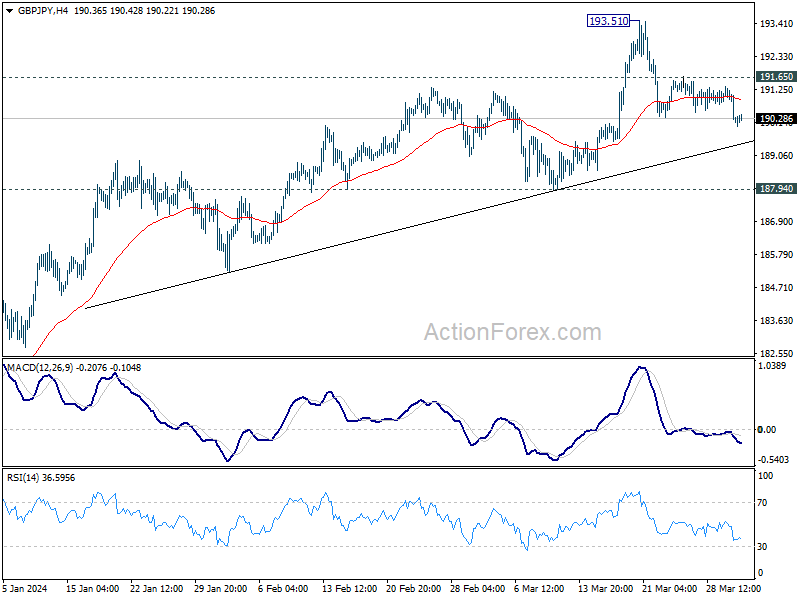
In the bigger picture, current rally is part of the up trend from 123.94 (2020 low), and is in progress for long term resistance (2015 high). Break of 187.94 support is needed to be the first sign of medium term topping. Otherwise, outlook will remain bullish in case of retreat.