

Sample Category Title
GBP/USD Mid-Day Outlook
Daily Pivots: (S1) 1.2662; (P) 1.2681; (R1) 1.2704; More...
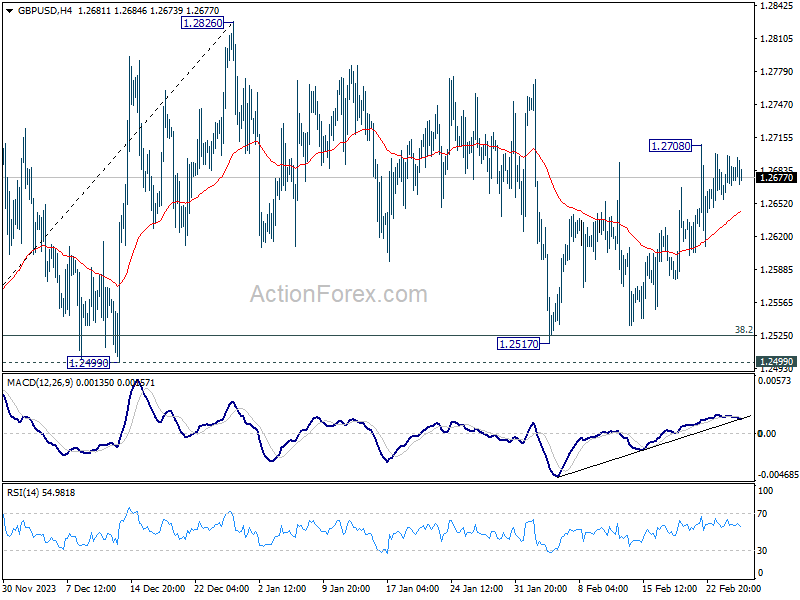
No change in GBP/USD's outlook and intraday bias remains neutral. On the upside, break of 1.2708 resistance will indicate that correction from 1.2826 has completed. Intraday bias will be back on the upside for retesting 1.2826. Nevertheless, decisive break of 1.2499 will argue that whole rise from 1.2036 has completed and turn near term outlook bearish.
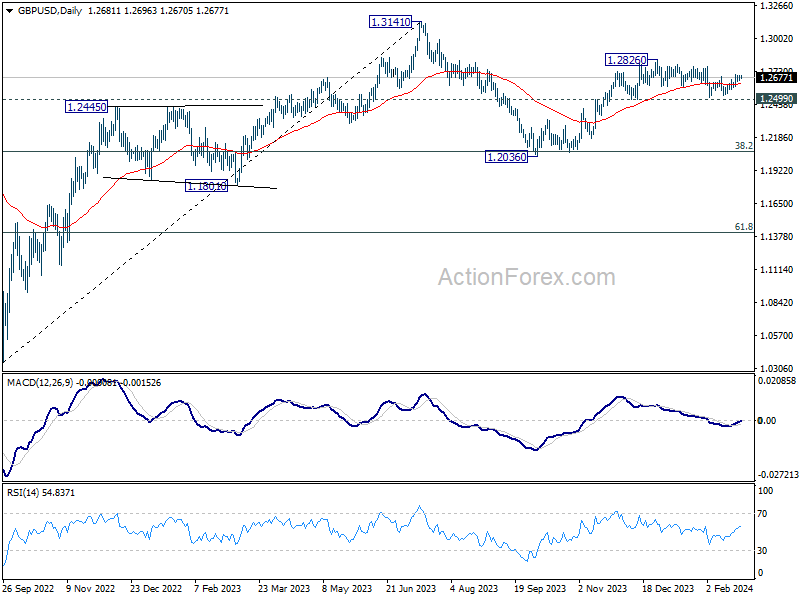
In the bigger picture, price actions from 1.3141 medium term top are seen as a corrective pattern to up trend from 1.0351 (2022 low). Rise from 1.2036 is seen as the second leg, which could be still in progress. But upside should be limited by 1.3141 to bring the third leg of the pattern. Meanwhile, break of 1.2499 support will argue that the third leg has already started for 38.2% retracement of 1.0351 (2022 low) to 1.3141 at 1.2075 again.
USD/JPY Mid-Day Outlook
Daily Pivots: (S1) 150.39; (P) 150.61; (R1) 150.94; More...
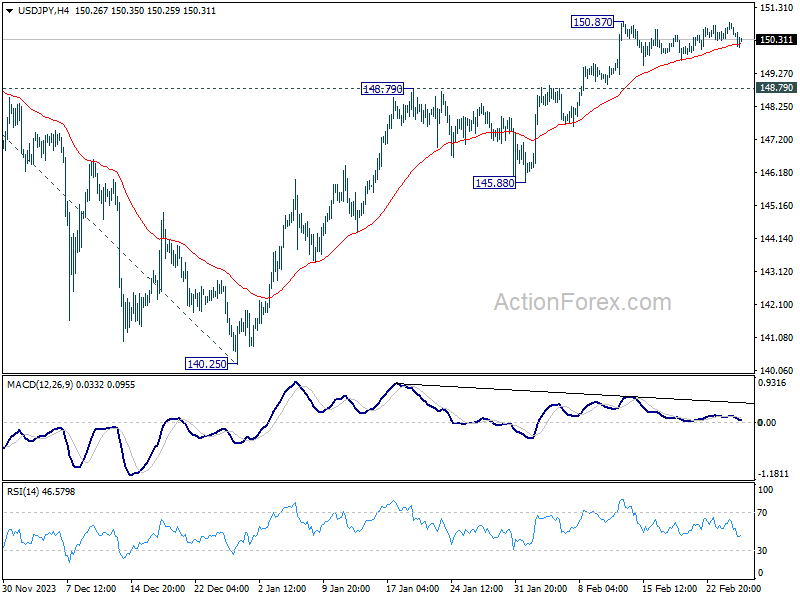
Range trading continues in USD/JPY below 150.87 and intraday bias stays neutral. In case of deeper retreat, downside should be contained by 148.79 resistance turned support to bring rebound. On the upside, break of 150.87 will resume 140.25 to 151.89/93 key resistance zone. Decisive break there will confirm larger up trend resumption of 155.50 projection level next.
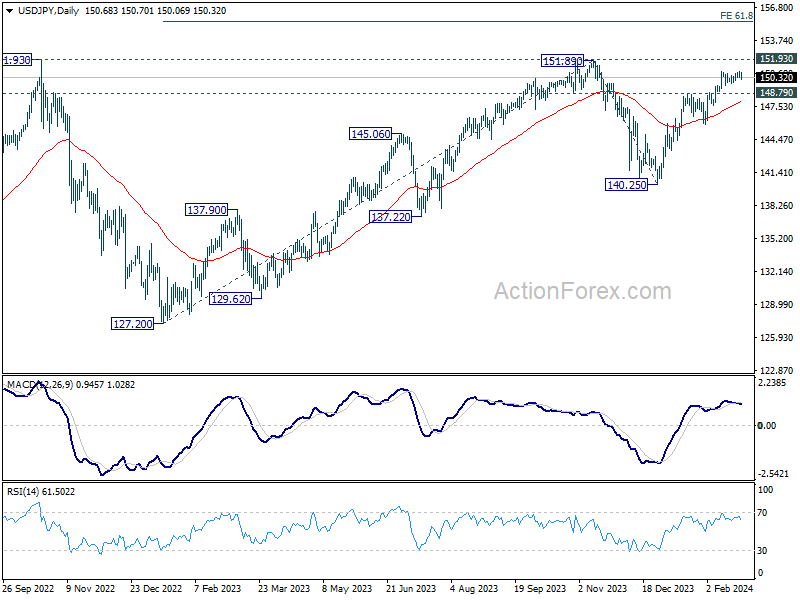
In the bigger picture, rise from 140.25 is seen as resuming the trend from 127.20 (2023 low). Decisive break of 151.89/.93 resistance zone will confirm this bullish case and target 61.8% projection of 127.20 to 151.89 from 140.25 at 155.50. However, break of 148.79 resistance turned support will delay this bullish case, and extend the corrective pattern from 151.89 with another falling leg.
USD/CHF Mid-Day Outlook
Daily Pivots: (S1) 0.8785; (P) 0.8803; (R1) 0.8819; More....
Intraday bias in USD/CHF remains neutral as consolidation from 0.8884 is still in progress. With 0.8727 resistance turned support intact, further rally is expected. On the upside, above 0.8884 will resume the rally from 0.8332 to 100% projection of 0.8332 to 0.8727 from 0.8550 at 0.8954. However, sustained break of 0.8727 will dampen this bullish view, and turn bias back to the downside for 0.8550 support instead.
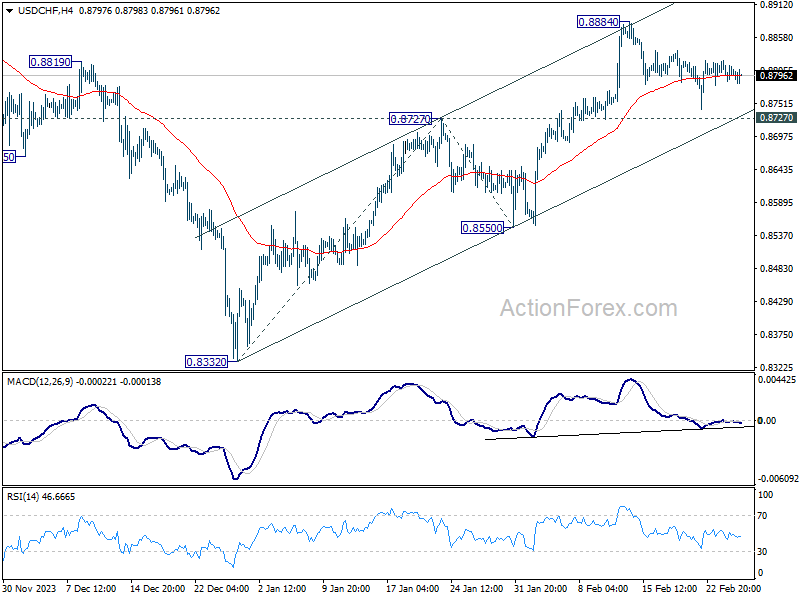
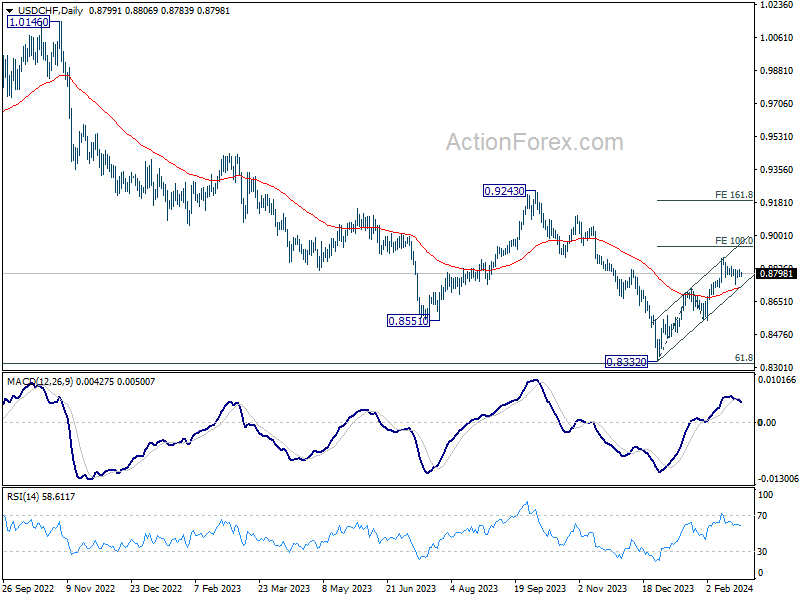
In the bigger picture, a medium term bottom should be formed at 0.8332, on bullish convergence condition in W MACD, just ahead of 0.8317 long term fibonacci support. It's still early to decide if the larger down trend from 1.0146 (2022 high) is reversing. But further rise should be seen to 0.9243 resistance even as a correction.
Yen Maintain Gains But Faces Momentum Hurdle, Dollar Indifferent to Weak Durable Goods
As the market transitions into early US session, Yen remains the best performer of the day, riding on Japan's stronger-than-anticipated CPI data. Despite the positive undercurrent, Yen has yet to find decisive buying momentum, suggesting that most traders are still on the sideline. Meanwhile, Australian Dollar trails as the second strongest for now, followed by Swiss Franc and Canadian Dollar.
Conversely, New Zealand Dollar finds itself at the bottom, with market participants on edge as they anticipate the upcoming RBNZ rate decision. While most economists lean towards a rate hold as the likely outcome, the potential for a surprise hike keeps traders on their toes. Kiwi's response could be notably volatile in either case. Sterling and Euro are also underperforming. Dollar is also soft, despite showing minimal reaction to disappointing durable goods orders data.
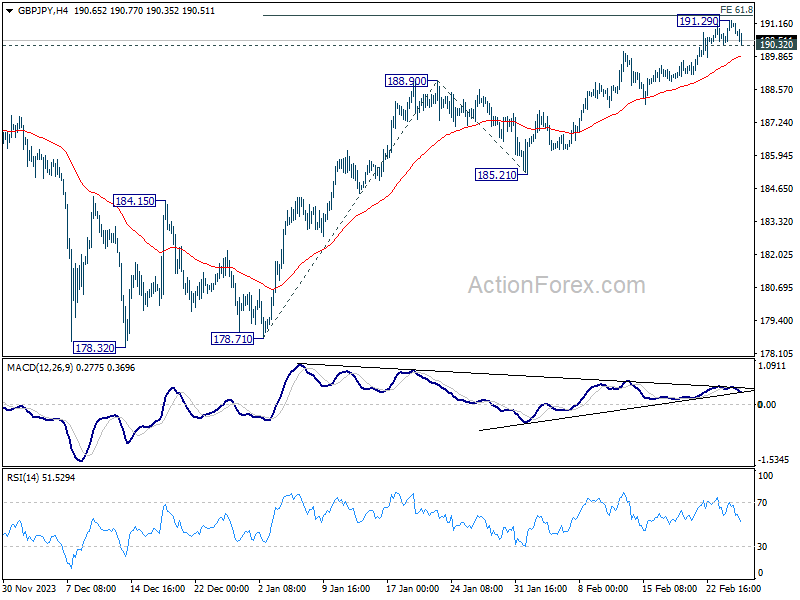
Technically, break of 190.32 minor support in GBP/JPY will argue that a short term top was formed at 191.29, just ahead of 61.8% projection of 178.71 to 188.90 from 185.21 at 191.50. Considering bearish divergence condition too, that could also mark the completion of a five-wave impulsive rally from 178.32. Further break of 55 4H EMA (now at 189.87) could open up deeper correction back to 185.21/188.90 support zone.
In Europe, at the time of writing, FTSE is down -0.14%. DAX is up 0.41%. CAC is down -0.05%. UK 10-year yield is up 0.0091 at 4.103. Germany 10-year yield is down -0.015 at 2.432. Nikkei rose 0.01%. Hong Kong HSI rose 0.94%. China Shanghai SSE rose 1.29%. Singapore Strait Times fell -0.44%. Japan 10-year JGB yield rose 0.0048 to 0.95.
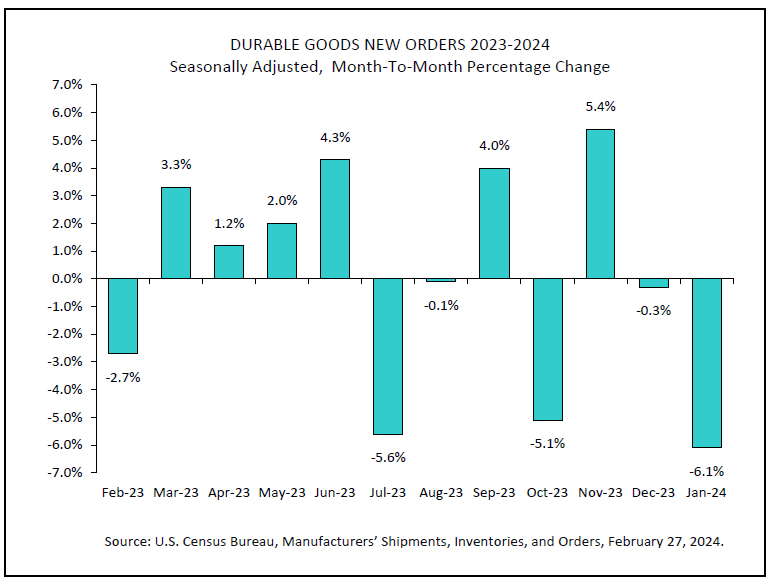
US durable goods orders down -6.1% mom, ex-transport orders fall -0.3% mom
US durable goods orders fell -6.1% mom to USD 276.7B in January, worse than expectation of -4.4% mom. Ex-transport orders fell -0.3% mom to USD 186.9B, below expectation of 0.3% mom rise. Ex-defense orders fell -7.3% mom to USD 260.2B. Transportation equipment orders were down -16.2% mom to USD 89.8B, down three of the last four months, led the overall decline.
Germany's Gfk consumer sentiment rises slightly to -29
Germany Gfk Consumer Sentiment for March ticked up from -29.6 to -29.0, matched expectations. In February, economic expectations rose from -6.6 to -6.4. Income expectations improved notably from-20.0 to -4.8. Willingness to buy fell from -14.8 to -15.0. Willingness to save jumped from 14.0 to 17.4.
Rolf Bürkl, a consumer expert, highlighted the prevailing uncertainty among consumers, driven by persistently high prices and dimming economic projections for Germany. German government's downgrade of its growth forecast for 2024 from an initial 1.3% down to a mere 0.2% underscores the challenges ahead.
Core inflation in Japan eases to 2%, but surpasses expectations
Japan's CPI core (all items ex food) slowed from 2.3% yoy to 2.0% yoy, above expectation of 1.9% yoy. This marks the third consecutive month of decline, reaching the lowest level in 22 months and aligning precisely with BoJ's inflation target of 2%.
The headline CPI also saw a decrease, moving from 2.6% to 2.2% yoy. Nevertheless, CPI core-core (ex-food and energy) showed only modest improvement, edging down from 3.7% to 3.5% yoy.
A significant factor contributing to the overall CPI's decline a -12.1% yoy drop in energy prices, resulting from government interventions to mitigate utility bills through subsidies for oil wholesalers. In contrast, food prices saw 5.9% yoy increase, while accommodation fees surged by 26.9% yoy.
The latest inflation data should fortify the argument for BoJ to terminate its negative interest rate policy soon. However, the decisive factor for the exact timing—be it March or April—hinges on the forthcoming wage negotiations between large enterprises and unions scheduled for March 13.
NZIER forecasts no further RBNZ hike, eyes mid-2025 cuts
In its latest Quarterly Predictions, NZIER noted there are "signs of further easing in inflation pressures" in New Zealand. But the pivotal question for RBNZ is whether this easing is "occurring at a fast enough pace" to bring inflation back to target band of 1-3%.
"Based on the balance of risks, we expect "no further OCR increases in this cycle," NZIER said.
Highlighting the New Zealand economy's "resilience," NZIER acknowledges the potential for inflation to persist above RBNZ's target, suggesting a "cautious approach" from the central bank, gearing towards understanding the "lag effects of the monetary policy tightening" already implemented.
Meanwhile, NZIER forecasts RBNZ OCR cuts to start mid-2025, "once it is confident it has reined in inflation sufficiently to keep it around the 2 percent inflation target mid-point over the coming year."
USD/CHF Mid-Day Outlook
Daily Pivots: (S1) 0.8785; (P) 0.8803; (R1) 0.8819; More....
Intraday bias in USD/CHF remains neutral as consolidation from 0.8884 is still in progress. With 0.8727 resistance turned support intact, further rally is expected. On the upside, above 0.8884 will resume the rally from 0.8332 to 100% projection of 0.8332 to 0.8727 from 0.8550 at 0.8954. However, sustained break of 0.8727 will dampen this bullish view, and turn bias back to the downside for 0.8550 support instead.
In the bigger picture, a medium term bottom should be formed at 0.8332, on bullish convergence condition in W MACD, just ahead of 0.8317 long term fibonacci support. It's still early to decide if the larger down trend from 1.0146 (2022 high) is reversing. But further rise should be seen to 0.9243 resistance even as a correction.
Economic Indicators Update
| GMT | Ccy | Events | Actual | Forecast | Previous | Revised |
|---|---|---|---|---|---|---|
| 23:30 | JPY | National CPI Y/Y Jan | 2.20% | 2.60% | ||
| 23:30 | JPY | National CPI ex Fresh Food Y/Y Jan | 2.00% | 1.90% | 2.30% | |
| 23:30 | JPY | National CPI ex Food & Energy Y/Y Jan | 3.50% | 3.70% | ||
| 00:01 | GBP | BRC Shop Price Index Y/Y Jan | 2.50% | 2.90% | ||
| 07:00 | EUR | Germany Gfk Consumer Confidence Mar | -29 | -29 | -29.7 | -29.6 |
| 09:00 | EUR | Eurozone M3 Money Supply Y/Y Jan | 0.10% | 0.20% | 0.10% | |
| 13:30 | USD | Durable Goods Orders Jan | -6.10% | -4.40% | 0.00% | |
| 13:30 | USD | Durable Goods Orders ex Transport Jan | -0.30% | 0.30% | 0.50% | |
| 14:00 | USD | S&P/CS Composite-20 HPI y/y Dec | 6.10% | 6.00% | 5.40% | |
| 14:00 | USD | Housing Price Index M/M Dec | 0.10% | 0.10% | 0.30% | |
| 15:00 | USD | Consumer Confidence Feb | 114.9 | 114.8 |
US durable goods orders down -6.1% mom, ex-transport orders fall -0.3% mom
US durable goods orders fell -6.1% mom to USD 276.7B in January, worse than expectation of -4.4% mom. Ex-transport orders fell -0.3% mom to USD 186.9B, below expectation of 0.3% mom rise. Ex-defense orders fell -7.3% mom to USD 260.2B. Transportation equipment orders were down -16.2% mom to USD 89.8B, down three of the last four months, led the overall decline.
Gold (XAUUSD) Macro Forecast: Under Pressure Below 2030
Fundamental Environment
The price of gold is rising after a slight previous decline and remains near the high of the last two weeks. This trend is attributed to the weakness of the US dollar, influenced by a new decrease in US Treasury bond yields. Additionally, geopolitical tensions in the Middle East continue to support demand for the metal as a haven.
However, the price of gold is expected to be limited due to expectations of a firmer stance by the Federal Reserve. Recent FOMC meeting minutes and comments from Fed officials suggest a willingness to keep interest rates high, which could boost Treasury bond yields and strengthen the dollar. This could discourage aggressive bets in favour of gold.
Attention will be paid this week to key US macroeconomic data, such as durable goods orders and the consumer confidence index, which will be released today, Tuesday, February 27. The Personal Consumption Expenditures (PCE) Price Index on Thursday is shaping up to be a crucial event that could influence Fed outlooks and, consequently, the direction of the gold price.
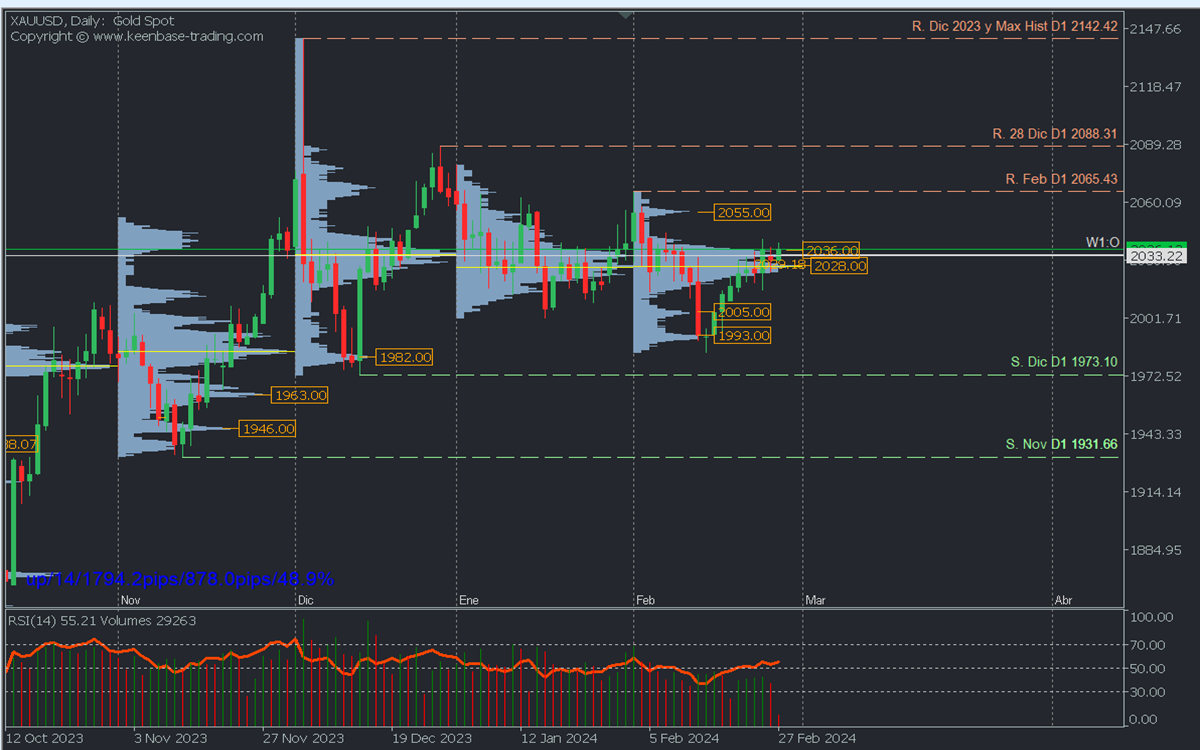
Daily Chart Analysis. Volume Profile and Structure.Macro Situation: BullishTechnical Structure:
XAUUSD continues within a macro bullish trend, even after reaching the historic high in December at 2142.42. The last relevant support is the November low at 1931.66. The current consolidation has not yet reversed this trend until the last mentioned support is decisively broken or confirmed with two movements.
Volume Profile Structure: The consolidation has left high volume concentrations in common areas between December and February. POCs* are around 2033/2028 in the monthly volume profile, forming a distribution zone from where sales will be activated in the short term if prices fall and remain below the mentioned POCs. This confirms the accumulation of sell orders, opening the door to further decline.
Corrective Bearish Scenario: This scenario will be activated with prices below 2028/2025, seeking February buying zones in high-volume nodes between 2005 and 1993. A decisive break will indicate bear dominance and continue the descent towards the buying zones and support levels, such as the December volume node around 1982 and the December support at 1973.10.
Bullish Scenario: In an environment of uncertainty, the gold rebound in the coming months cannot be ruled out if fundamentals support buying liquidity. This will be evident in the price chart with quotes above the volume concentration between 2030/2035. The first February selling zone, around 2055, may reactivate bears to defend that zone and cause a new decline towards 2033, where a new rebound or a further decline will be determined.
Only the decisive break of the selling zones indicates bullish dominance, and the challenge and break of the high volume node at 2055 and resistances 2065.43 and 2088.3 are required, only to consider the possibility of gold covering the volume inefficiency (Gap in the profile) left on December 4 until reaching the current historic high at 2142.42.
The oscillating RSI around the midpoint currently confirms the bullish momentum of the last few days with ascending vertical volume and exhaustion in the last two days. This indicates local consolidation awaiting key USD fundamentals.
What is the possibility of an extension of the bearish correction to challenge a change?
If prices acquire greater bearish strength and leave decisive breaks in their path, the price will likely continue to decline in the coming months towards the high volume nodes of November between 1963 and 1946. This could occur before reaching the key November support at 1931.66 and reversing the trend after its confirmed break with a second minimum.
This macro scenario must be accompanied by a fundamental environment of the absence of high-impact geopolitical events that provoke risk aversion and the consequent rush towards gold as a haven asset.
*Uncovered POC: POC = Point of Control: It is the level or zone where the highest volume concentration occurred. If previously, from it, there was a bearish movement, it is considered a selling zone and forms a resistance zone. On the contrary, if previously, there was a bullish impulse, it is considered a buying zone, usually located at lows, forming support zones.
I always publish daily intraday analyses on Gold (XAUUSD) on the telegram channel: FBS Analysis in Spanish.
Japanese Yen Benefits from Hopes of Change in BoJ Approach
Japanese consumer inflation slowed from 2.6% y/y to 2.2% y/y in January. The data was slightly higher than the expected 2.1%, providing temporary support for the Yen, which rose 0.4% after the release, pushing USDJPY back to 150.10.
Prices excluding food slowed to 2.0% year-on-year, the lowest since March 2022 and back to the BoJ’s target. However, an even less volatile measure excluding food and energy slowed to 3.5% from 3.7% in January. These are still the highest levels since the early 1980s, so they warrant the regulator’s attention.
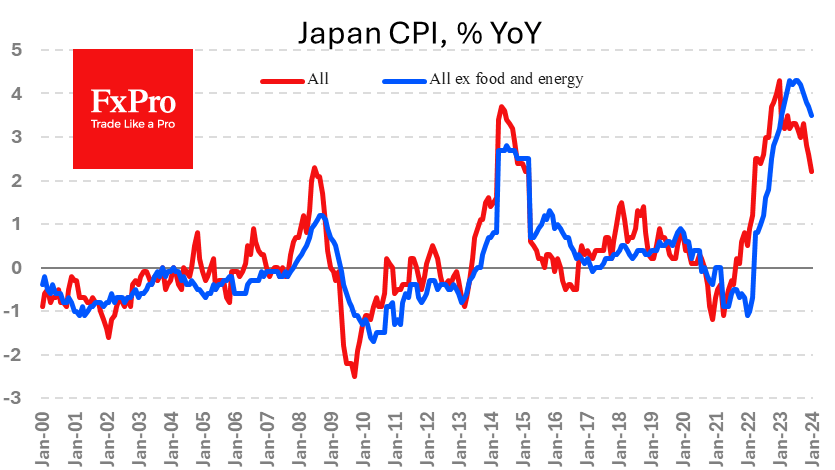
The inflation data also helped push Japanese 2-year government bond yields to their highest levels since 2011.
The latest inflation figures have raised expectations of imminent changes in monetary policy. Observers are predicting that the zero-interest-rate policy will be abandoned as early as April this year. The strengthening of these expectations supports the yen by narrowing the yield spread between yen-denominated debt and other reserve currencies.
At the same time, Japan has repeatedly surprised with its passivity in recent years, so it is worth remaining sceptical about its ability to make real changes. This is doubly true when the Fed, the ECB and the Bank of England pick their moment to start cutting interest rates. Fears that the yield spread will narrow too quickly could lead the Bank of Japan to opt for inaction once again.
GBP/USD Yawns as UK Shop Inflation Declines
- UK shop inflation falls to 2.5%
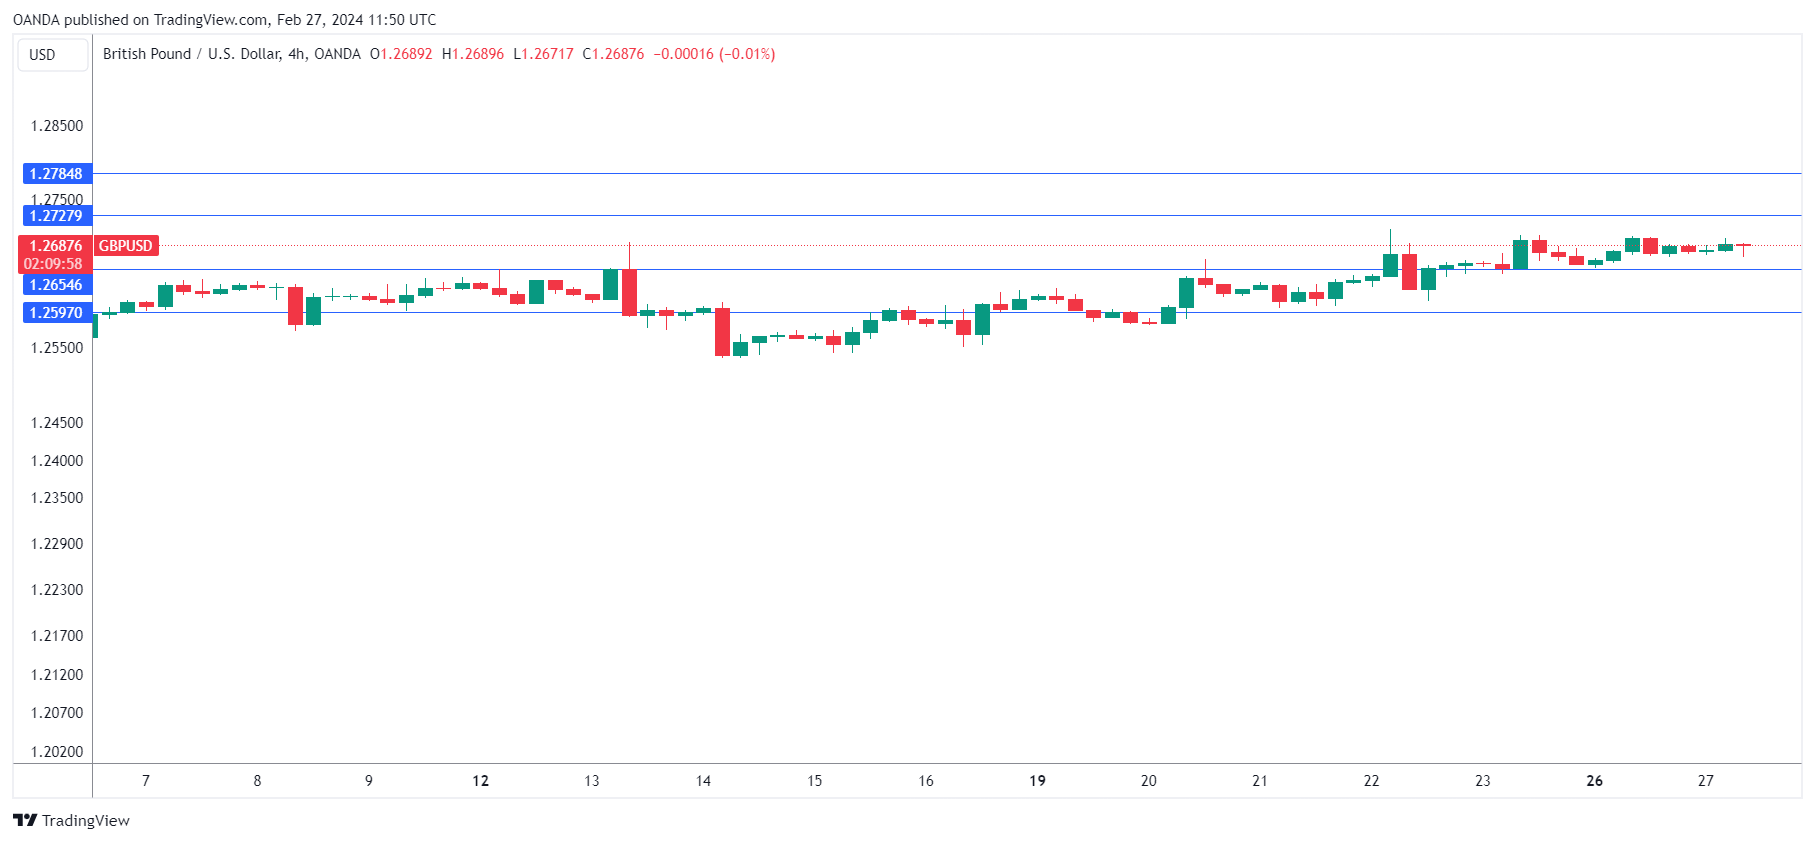
The British pound is drifting on Tuesday. In the European session, GBP/USD is trading at 1.2683, down 0.03%.
Shop price, food inflation heads lower
UK shop inflation doesn’t usually make headlines but today’s release was further evidence that inflation is on a downward trend. The British Retail Consortium (BRC) Shop Price index rose 2.5% y/y in February, down from 2.9% in January. This marked the ninth straight monthly decline and was the lowest level since March 2022. The BRC also reported that food inflation dropped sharply in January, from 6.1% to 5.1%.
The data follows the January CPI report, which remained at 4%, lower than the market estimate of 4.1%. Food and energy prices have been falling and wage growth has been easing. These are encouraging signs for the Bank of England, but inflation still remains double the Bank of England’s target of 2%, which means that the battle to rein in inflation is far from over.
The BoE has maintained the cash rate at 5.25% since August and meets next on March 21. Governor Bailey has been pushing back against expectations of a rate cut later this year but may have signaled a pivot in policy earlier this month. Bailey told a parliamentary committee last week that it was “not unreasonable” for investors to bet on rate cuts later this year. Earlier this month, Bailey said that high rates were “under review” but the BoE was concerned that inflation could rebound even if it fell to 2%.
GBP/USD Technical
- There is resistance at 1.2728 and 1.2785
- 1.2654 and 1.2597 are providing support
USD/JPY: Bulls to Remain in Play While Holding Above Broken Fibo Barrier
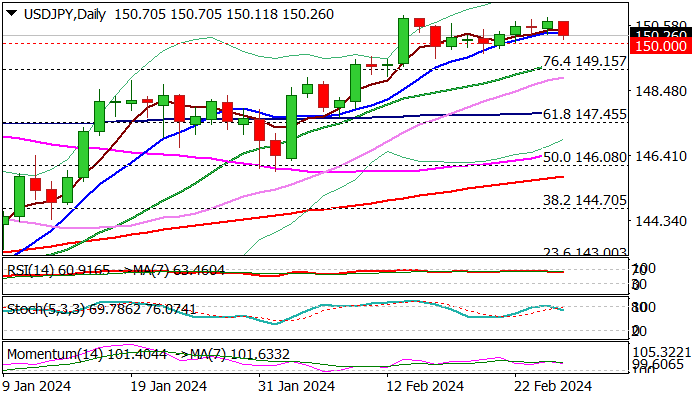
USDJPY eases on Tuesday as traders reacted on overbought daily studies, but dips are likely to be limited and mark a healthy correction of larger uptrend.
Technical picture on daily chart remains bullish (strong positive momentum / moving averages in bullish configuration) keeping in play expectations for final push towards key barriers at 150.90/94 (peaks of 2023 and 2022 respectively).
Bullish outlook is supported by the fact that the pair holds above broken pivotal barriers at 150.00/149.15 (psychological / Fibo 76.4% of 151.90/140.25) for the third week and near-term action is expected to remain biased higher while these supports contain dips.
Initial support at 150.18 (daily Tenkan-sen) has been cracked but so far without clear break, guarding 150.00 level and 149.41/15 (20DMA / Fibo 76.4%).
Only sustained break of 149.15 would neutralize bulls and open way for deeper correction of 140.25/150.88 rally.
A number of economic releases from the US these days (focus is on Q4 GDP and PCE index) are expected to provide fresh signals.
Res: 150.29; 150.64; 150.88; 151.43.
Sup: 150.00; 149.41; 149.15; 148.39.
Bitcoin Tears the Bears Apart Again
Market picture
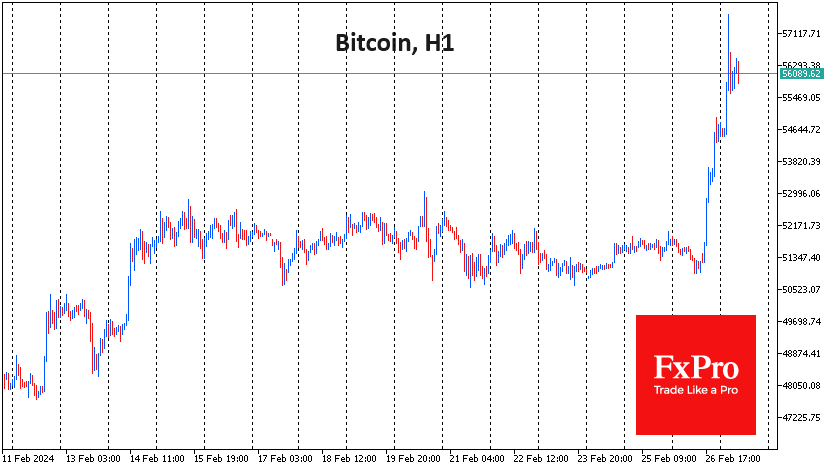
The price of the leading cryptocurrency rose decisively during active trading in the US, and in the illiquid Asian session, we saw a wave of stop orders triggered, which at times took the price to $57.8K. Such high levels were last seen in December 2021.
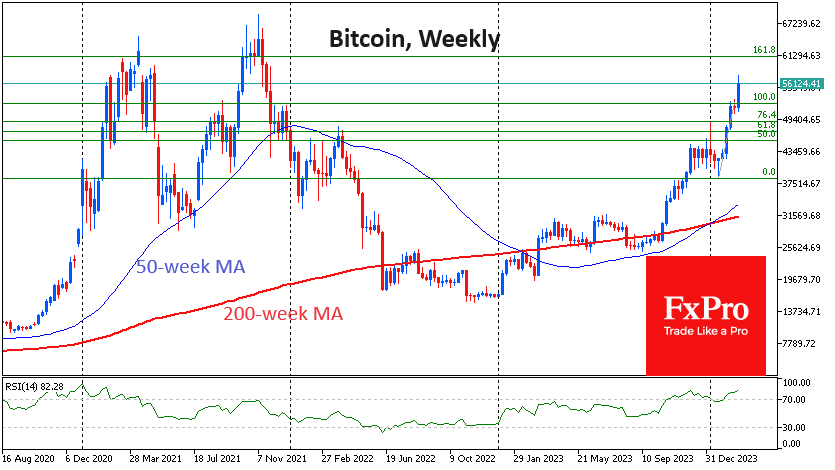
Nevertheless, bitcoin sees no significant barriers to growth to levels just above $60K. Bitcoin can quickly go there or around the historical highs at $69K, but the subsequent growth may require a few months of consolidation.
Growth breeds optimism, and now there is a proliferation of predictions that the price will soon reach six figures. In our view, the chances of a price rise above $100K exceed 50% in the 9–12-month horizon. And if markets come under pressure from an economic slowdown, it could take more than a year to reach a new level.
News background
According to CoinShares, investment in crypto funds rose by $598 million last week, following a record $2.452 billion inflow the week before, the fourth consecutive week of growth. Investments in bitcoin rose by $570 million, Ethereum by $17 million, and Solana fell by $3 million. Investments in funds that allow shorting bitcoin increased by $4 million.
Inflows into crypto funds have exceeded $5.7 billion since the beginning of the year, with total assets under management (AuM) rising to $68.3 billion, although still far from the record high of $87 billion reached in November 2021.
Bitcoin is gaining popularity as a haven asset in countries with persistently high inflation, Bitfinex noted. Macroeconomic risks this year make it relevant to buy the first cryptocurrency, gold, and silver.
According to BitMEX Research, trading volume in the spot bitcoin ETF market exceeded $50 billion. Mike Novogratz, CEO of Galaxy Digital, commented on the growing interest of institutional investors in the cryptocurrency market.
LookIntoBitcoin notes that the value of bitcoin is being affected by the upcoming halving in April, as well as the imbalance between demand for the asset and its availability in the cryptocurrency market.
According to The Block, the cumulative amount raised by crypto and blockchain companies from venture capitalists since 2017 has exceeded $90 billion, with DeFi, infrastructure, NFT/gaming and Web3 attracting the most interest.
MicroStrategy acquired an additional 3,000 BTC, said founder Michael Saylor. MicroStrategy owns 193000 BTCs worth approximately $6.09 billion (average price $31,544).