Sample Category Title
GBP/JPY Daily Outlook
Daily Pivots: (S1) 187.07; (P) 187.78; (R1) 188.42; More...
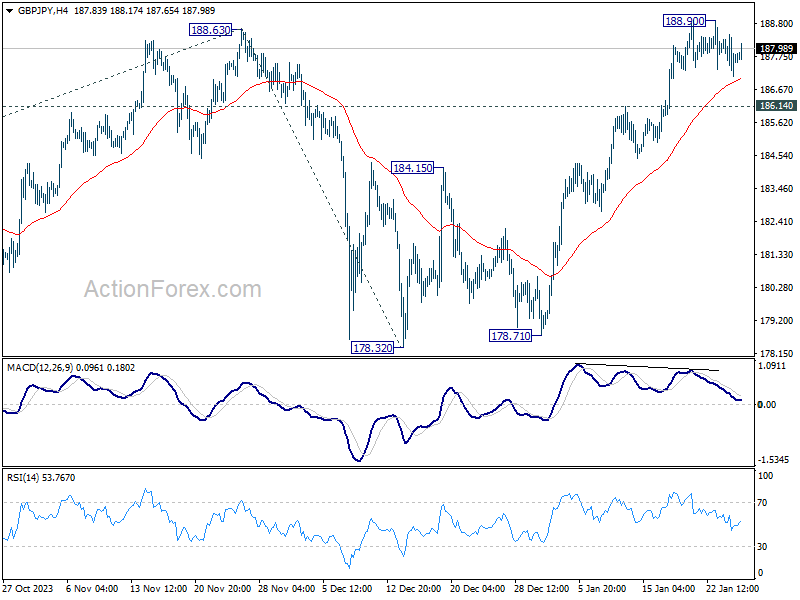
GBP/JPY is extending the consolidation pattern from 188.90 and intraday bias stays neutral. Further rally is expected as long as 186.14 resistance turned support holds. On the upside, break of 188.90, and sustained trading above 188.63 will confirm up trend resumption. Next target is 38.2% projection of 155.33 to 188.63 from 178.32 at 191.04. However, break of 186.14 will turn bias to the downside for deeper pullback.
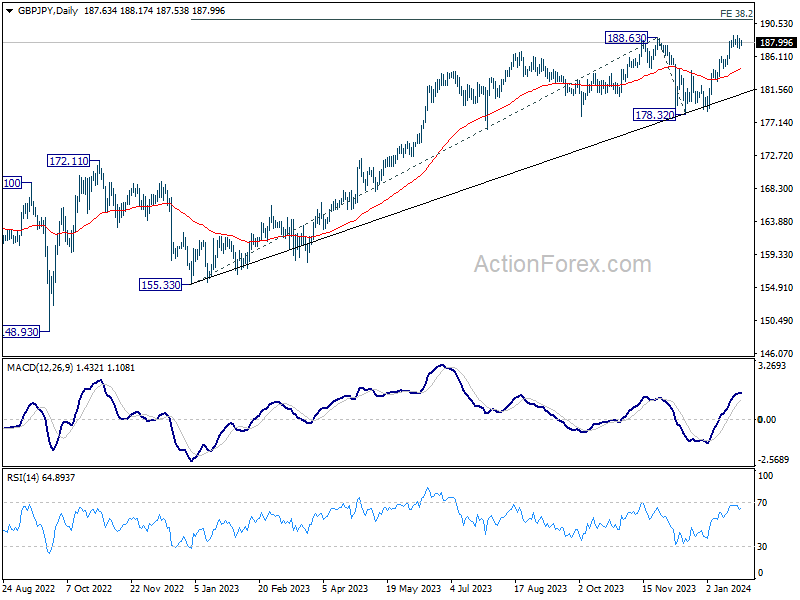
In the bigger picture, up trend from 123.94 (2020 low) in in progress. Medium term outlook will stay bullish as long as 178.32 support holds. Next target is 195.86 long term resistance (2015 high).
EUR/JPY Daily Outlook
Daily Pivots: (S1) 160.01; (P) 160.54; (R1) 161.10; More...
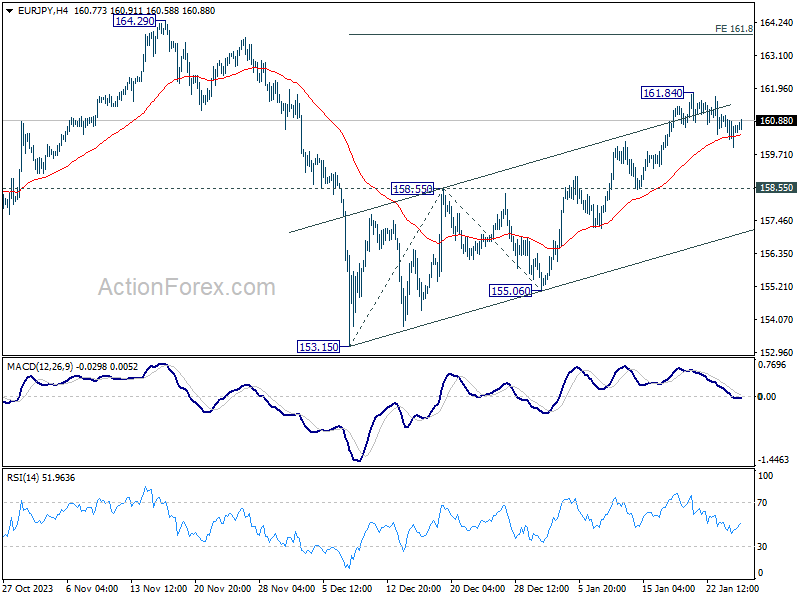
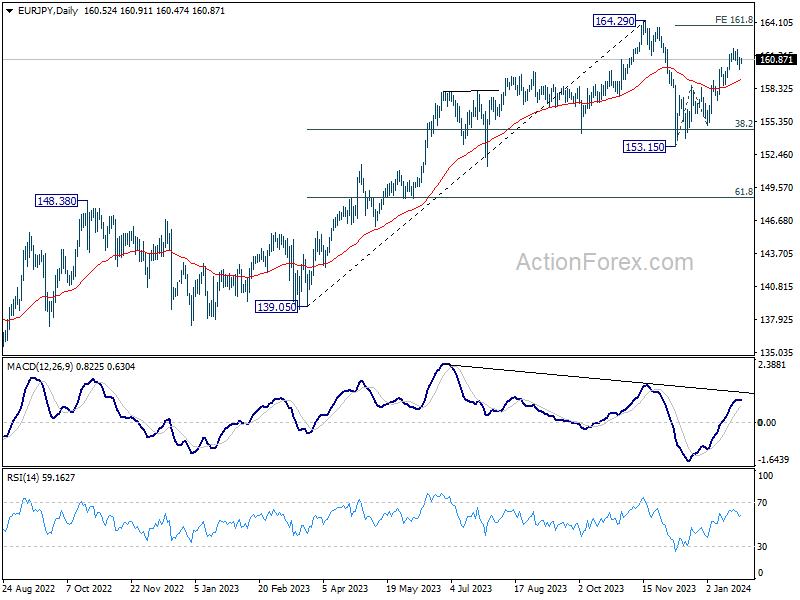
Intraday bias in EUR/JPY stays neutral as consolidation from 161.84 is still in progress. Further rally is expected as long as 158.55 resistance turned support holds. On the upside, break of 161.84 will resume whole rally from 153.15 to 161.8% projection of 153.15 to 158.55 from 155.06 at 163.79, which is close to 164.29 high.
In the bigger picture, price actions from 164.29 medium term top are seen as a correction to rise from 139.05 only. As long as 148.48 resistance turned support holds (2022 high), larger up trend from 114.42 (2020 low) is expected to resume through 164.29 at a later stage.
EUR/GBP Daily Outlook
Daily Pivots: (S1) 0.8539; (P) 0.8551; (R1) 0.8565; More...
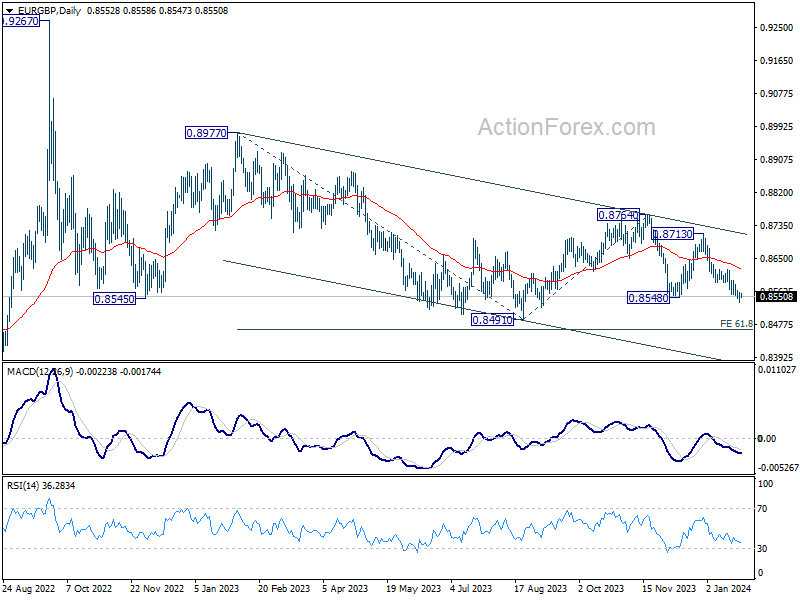
EUR/GBP's decline is still in progress despite loss of downside momentum. Intraday bias stays on the downside. Current fall from 0.8713 is part of the larger down trend. Deeper decline should be seen to 0.8491 low, and then 0.8464 projection level. On the upside, above 0.8591 minor resistance will turn intraday bias neutral and bring consolidations again.
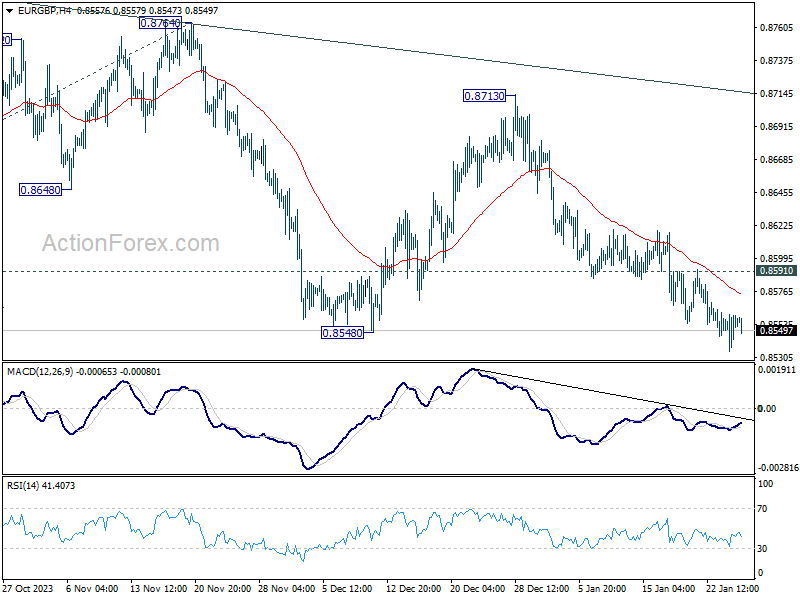
In the bigger picture, fall from 0.8764 is seen as another leg in the whole down trend from 0.9267 (2022 high). Outlook will stay bearish as long as 0.8713 resistance holds. Break of 0.8491 will target 61.8% projection of 0.8977 to 0.8491 from 0.8764 at 0.8464.
EUR/CHF Daily Outlook
Daily Pivots: (S1) 0.9372; (P) 0.9410; (R1) 0.9430; More...
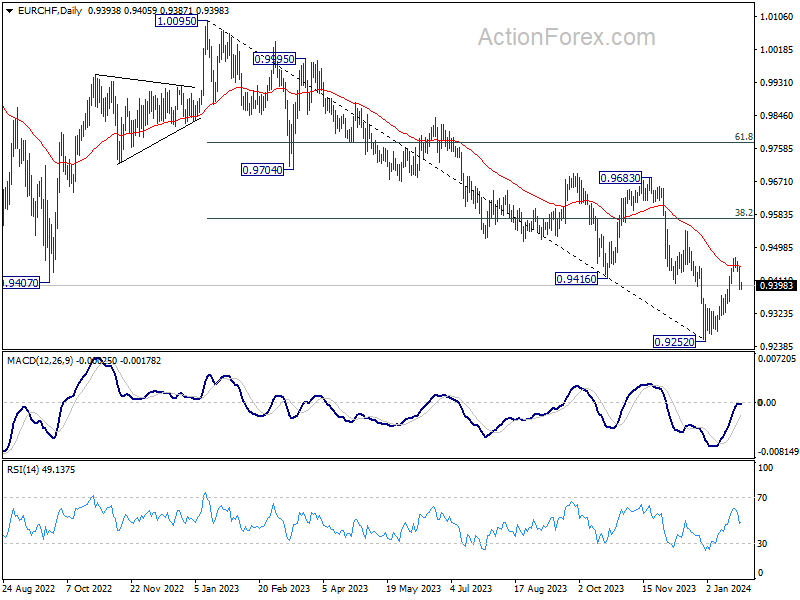
EUR/CHF's break of 0.9404 minor support suggests rejection by 55 D EMA (now at 0.9447). Intraday bias is back on the downside for deeper pull back. But downside should be contained above 0.9252 low to bring rebound. On the upside, above 0.9471 will resume the rebound from 0.9252, as a correction to whole decline from 1.0095. Next target will be 38.2% retracement of 1.0095 to 0.9252 at 0.9574.
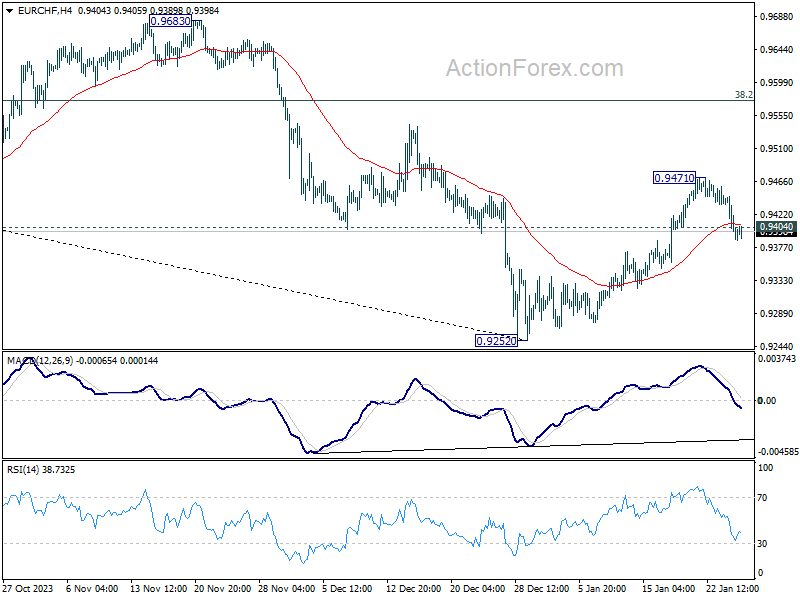
In the bigger picture, medium term outlook remains bearish as long as 0.9683 resistance holds. Current fall from 1.2004 (2018 high) is part of the multi-decade down trend. Another decline is in favor after rebound from 0.9252 completes. However, firm break of 0.9683, and sustained trading above 55 W EMA (now at 0.9659) will argue that EUR/CHF is already in a medium term rally, even as a corrective move.
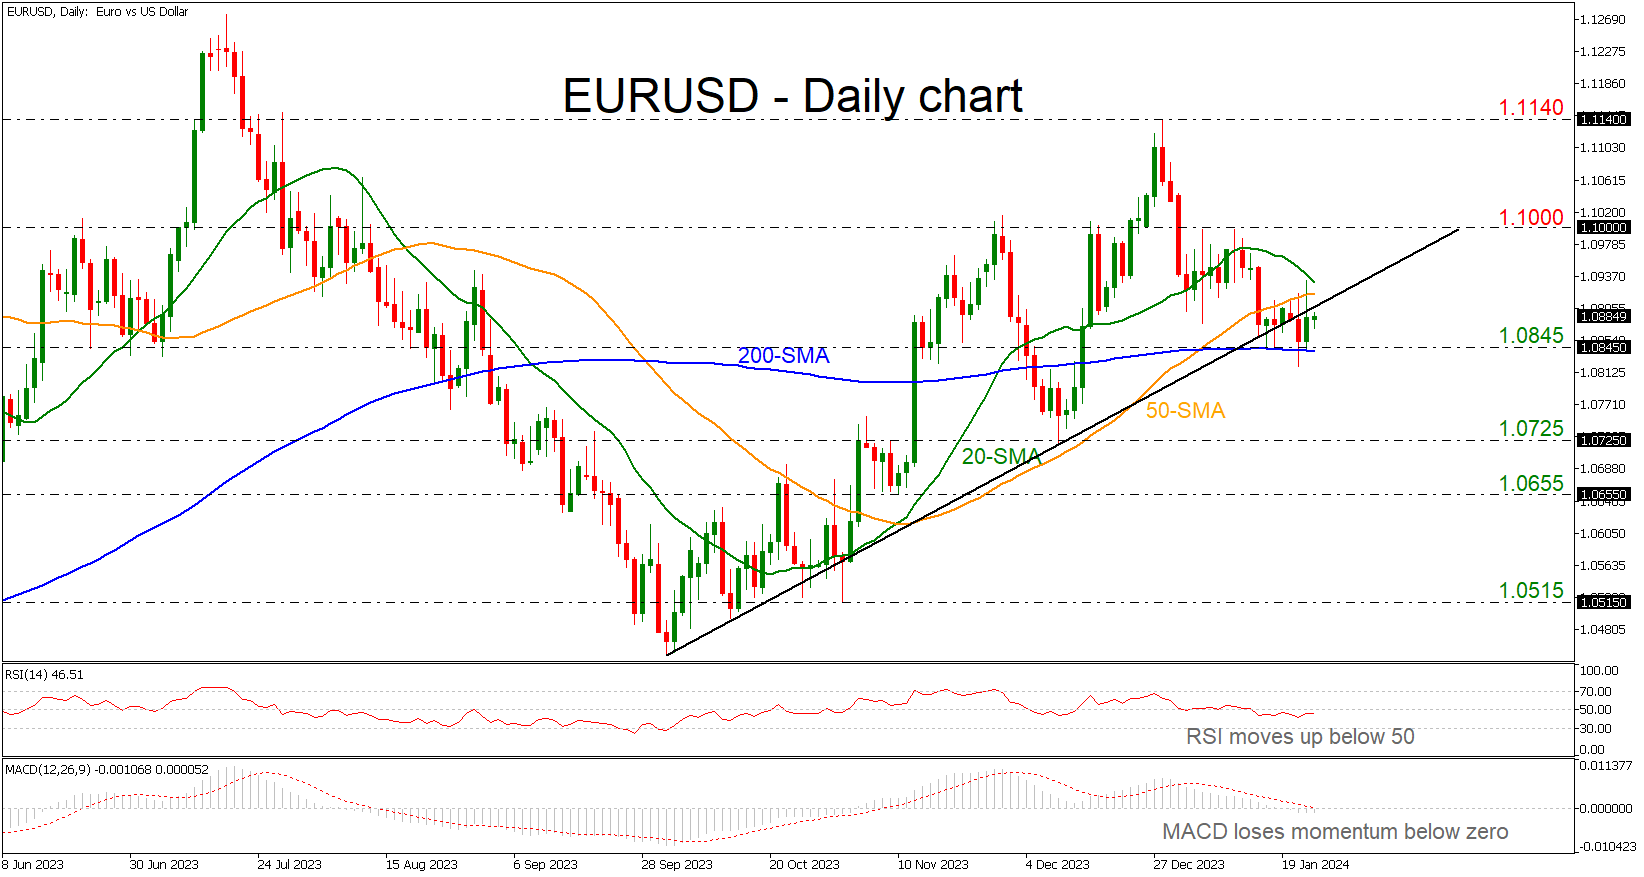
Is EURUSD Ready to Climb Back Above the Uptrend Line?
- EURUSD rebounds off 200-day SMA
- But, remains beneath the rising trend line
- Technical signals are mixed
EURUSD finds strong support at the 200-day simple moving average (SMA), which overlaps with the 1.0845 barrier. The pair is currently holding beneath the medium-term ascending trend line but the fact that it is still above the aforementioned support is raising optimism for a potential upside move.
However, the technical oscillators are showing mixed signals in the market. The RSI is ticking slightly higher in the negative region, while the MACD is extending its bearish momentum beneath its trigger and zero lines.
In the event the pair re-activates its uptrend, the next target will be the 50- and then the 20-day SMAs around 1.0920. Even higher, the bulls might head for the 1.1000 psychological number, which has been a key resistance over the last three weeks ahead of the 1.1140 high.
On the downside, the 1.0845 support has been guarding selling forces over the past week. Hence, a step beneath that line might produce fresh negative volatility, likely squeezing the price towards the 1.0725 hurdle. Another defeat there could add more fuel to the bearish wave, bringing the 1.0655 barrier immediately under the spotlight.
Overall, EURUSD is moving horizontally in the very short-term timeframe and any movement beneath the 200-day SMA could switch the bigger outlook to a bearish one.
Hang Seng Index Technical: Countertrend Rebound in Play But Not Major Bottoming
- Short-term positive animal spirits have resurfaced in China and Hong Kong stock markets stoked by additional liquidity injection from PBoC and the creation of a “stabilization fund”.
- Long-term prospects are still dim as a liquidity trap scenario cannot be ruled out in the real economy due to weak consumer and business sentiment.
- Watch the next intermediate resistances at 16,525 and 17,130 on the Hang Seng Index.
“Desperate times, calling for desperate measures” as China’s top policymakers are trying to stall the continuation of the horrendous decline seen in the China and Hong Kong stock markets since the start of the new year reinforced by China Premier Li Qiang’s speech in Davos last week that implied that China leadership is comfortable with the current pace of growth trajectory in China which in turn has dampened hopes of more forceful fiscal and monetary stimulus measures in 2024.
At the start of this week, the China and Hong Kong benchmark stock indices extended their losses with a decline of -2.3% seen on the Hang Seng Index, almost hitting the October 2022 low.
Additional liquidity injection from PBoC
Thereafter, a slew of stimulative policies has been announced in the past two days; the step-up progress of the establishment of a 2 trillion yuan “stabilization fund” to prop up China equities, and the upcoming 50 basis points cut on China’s major banks’ reserve requirement ratio (RRR) on 5 February before the Lunar New Year holidays; the steepest single RRR cut implementation in the past two years.
China and Hong Kong equities have managed to see a minor positive turnaround since Tuesday, 23 January as the CSI 300 has gained by +2.7% with the Hang Seng Index (+5.2%), Hang Seng TECH Index (+5%), and Hang Seng China Enterprises Index (+5.9%) triggered by the return of short-term positive animal spirits and possible short covering activities as a media outlet reported yesterday that China’s securities regulator had asked some hedge fund managers to restrict short selling via the stock index futures.
Potential countertrend rebound sequences in progress
In the short term from a technical analysis perspective, the China and Hong Kong benchmark stock indices may see a series of countertrend rallies within their respective major downtrend phases as all of them are still trading below their respective key 200-day moving averages. Also, their current year-to-date performances are still reflecting losses at this time of the writing; CSI 300 (-3.3%), Hang Seng Index (-5.1%), Hang Seng TECH Index (-12%), and Hang Seng China Enterprises Index (-5.3%).
A liquidity trap scenario cannot be ruled out
In a longer-term perspective, there is still no clarity at this juncture to indicate that China and Hong Kong benchmark stock indices have hit major bottoming inflection points as additional liquidity injections need to be accompanied by fiscal stimulus policies (direct subsidies) that can directly trigger a boost to consumer and business sentiment that is causing the crux of this ongoing deflationary risk spiral in China.
Hence, additional liquidity created in the banking system without an uptick in consumer & business sentiment (demand-pull effect) may lead to a lack of demand for bank loans which can create a “liquidity trap” scenario in China that reinforces the current deflationary risk spiral.
Watch the next intermediate resistances at 16,525 and 17,130
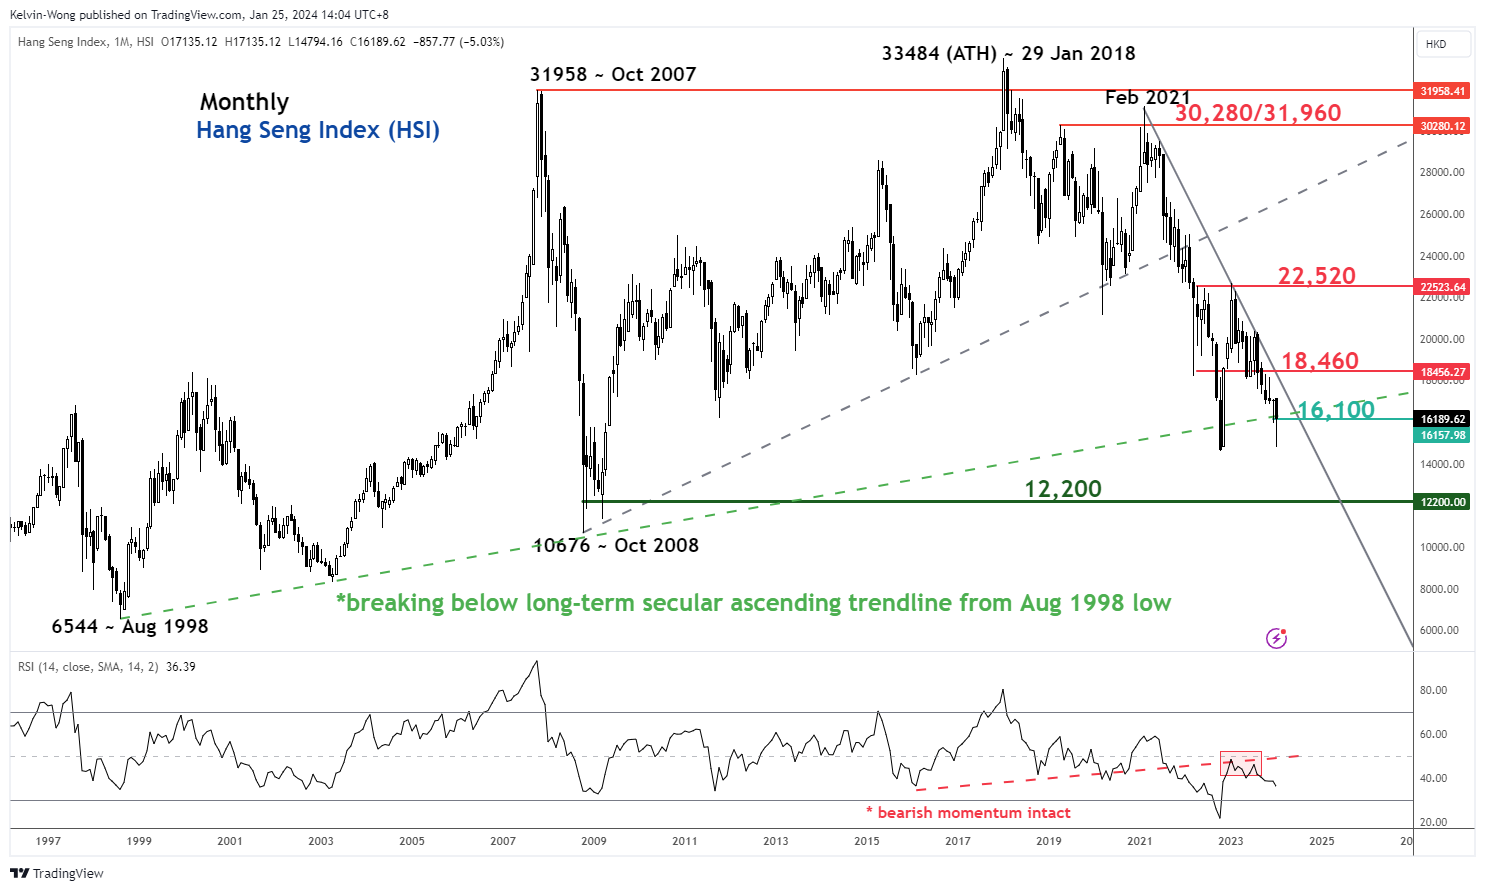
Fig 1: Hang Seng Index long-term secular trend as of 25 Jan 2024 (Source: TradingView, click to enlarge chart)
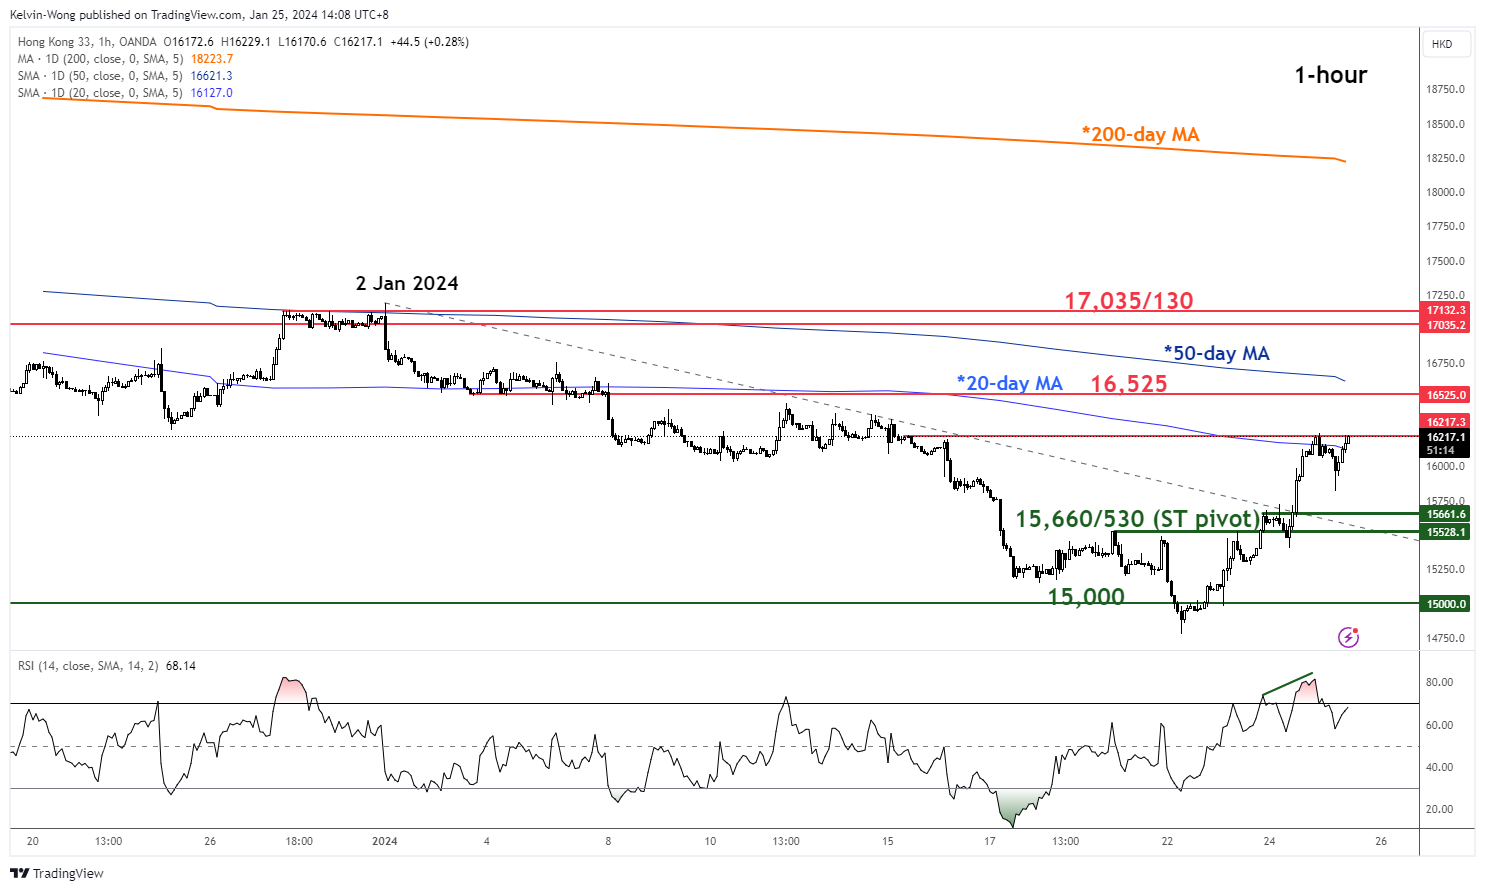
Fig 2: Hang Seng Index minor short-term trend as of 25 Jan 2024 (Source: TradingView, click to enlarge chart)
Current price actions of the Hang Seng Index are now attempting to reintegrate back above the 16,100 key long-term pivotal support (also the ascending trendline in place since the August 1998 Asian Financial Crisis low).
In the shorter term as depicted by the hourly chart, there are positive elements to support a further potential extension of the ongoing countertrend rebound, the Index has staged a bullish breakout above its minor descending trendline from the 2 January 2024 high and the hourly RSI momentum indicator is still exhibiting positive configuration without a bearish divergence condition at its overbought region.
Watch the 15,660/530 key short-term pivotal support with the next intermediate resistances coming in at 16,525 and 17,035/130 (also close to the 38.2% Fibonacci retracement of the major downtrend from the 31 July 2023 high to 22 January 2024 low).
However, failure to hold at 15,530 invalidates the bullish tone to expose the next intermediate support at 15,000.
EUR/USD Daily Outlook
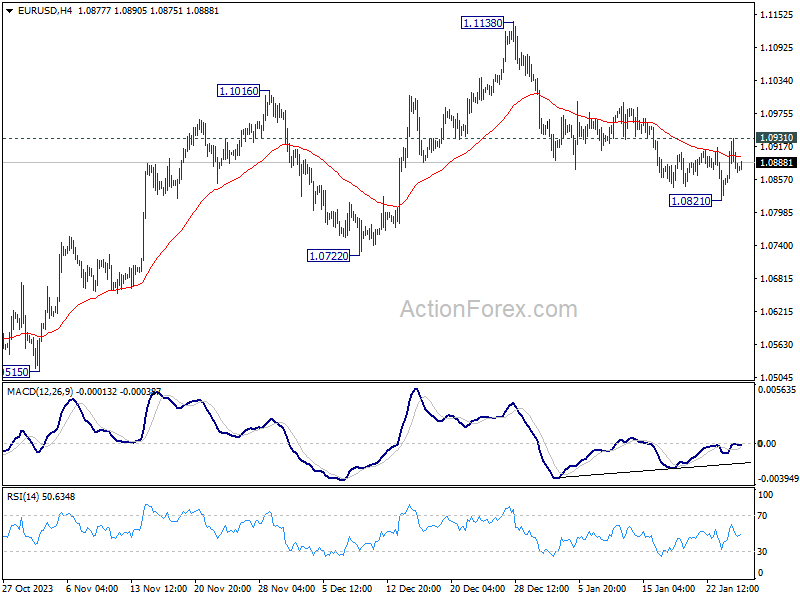
Daily Pivots: (S1) 1.0843; (P) 1.0888; (R1) 1.0929; More...
Intraday bias in EUR/USD stays neutral first, as it quickly retreated after brief breach of 1.0915 minor resistance. On the downside, break of 1.0821 will resume the fall from 1.1138 to 1.0722 support. On the upside, above 1.0931 will resume the rebound towards 1.1138 resistance.
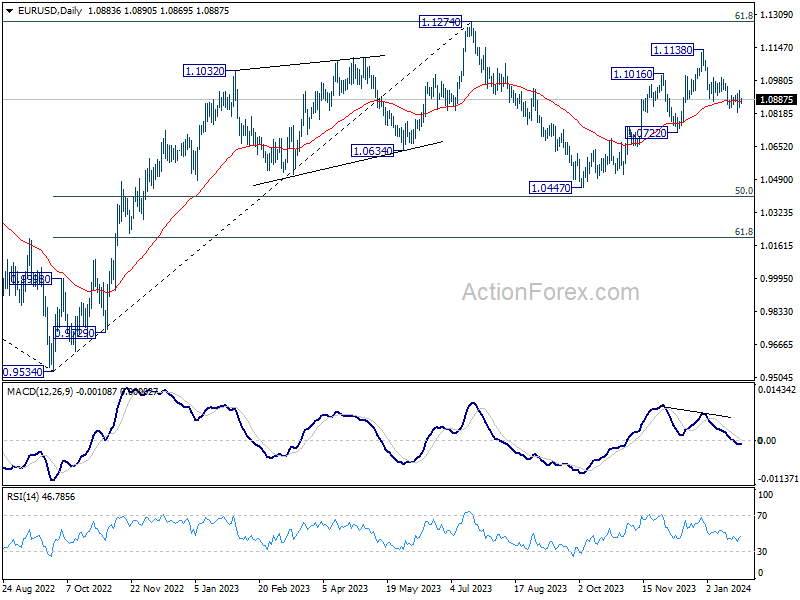
In the bigger picture, price actions from 1.1274 are viewed as a corrective pattern to rise from 0.9534 (2022 low). Rise from 1.0447 is seen as the second leg. While further rally could cannot be ruled out, upside should be limited by 1.1274 to bring the third leg of the pattern. Meanwhile, sustained break of 1.0722 support will argue that the third leg has already started for 1.0447 and below.
GBP/USD Daily Outlook
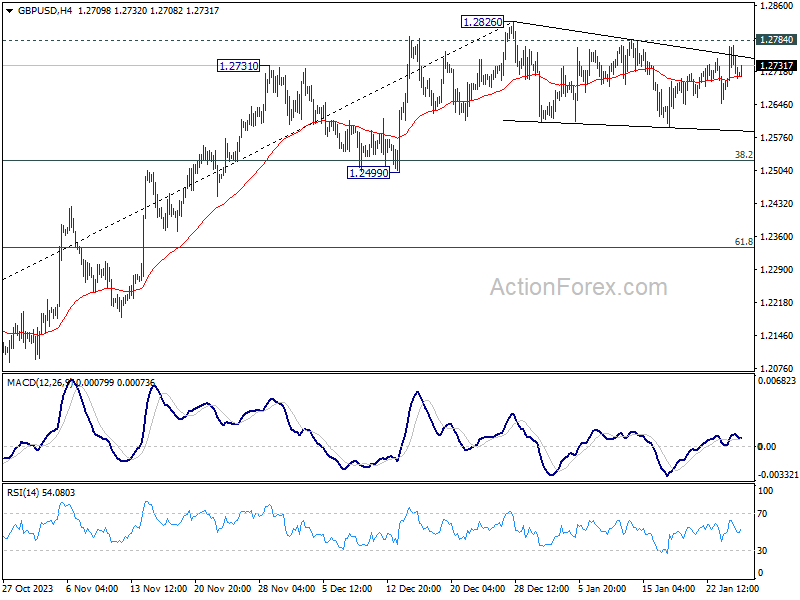
Daily Pivots: (S1) 1.2676; (P) 1.2726; (R1) 1.2774; More...
Intraday bias in GBP/USD stays neutral first as consolidation from 1.2826 is still extending. Deeper pull back cannot be ruled out. But downside should be contained above 1.2499 support to bring rebound. On the upside, firm break of 1.2784 resistance will suggest that consolidation pattern has completed. Further rise should be seen through 1.2826 to resume the rise from 1.2036. Next target will be 1.3141 high.
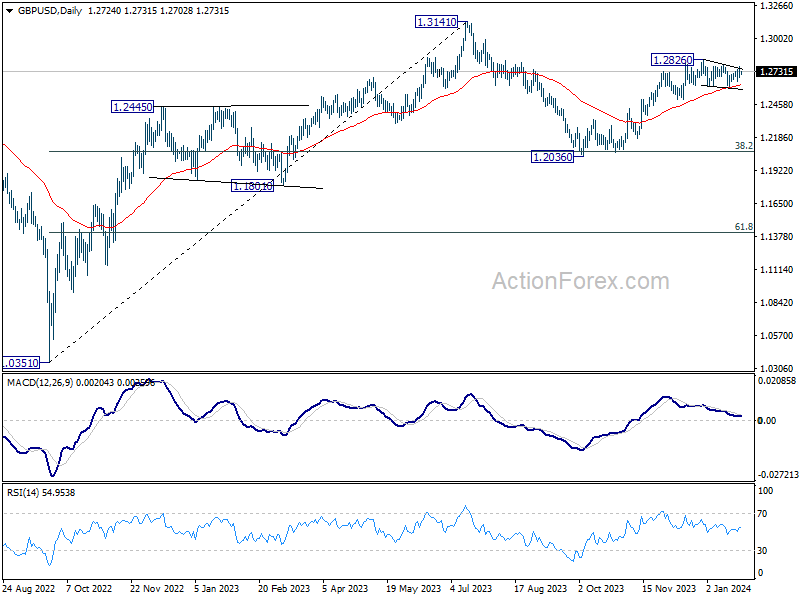
In the bigger picture, price actions from 1.3141 medium term top are seen as a corrective pattern to up trend from 1.0351 (2022 low). Rise from 1.2036 is seen as the second leg that's in progress. Upside should be limited by 1.3141 to bring the third leg of the pattern. Meanwhile, break of 1.2499 support will argue that the third leg has already started for 38.2% retracement of 1.0351 (2022 low) to 1.3141 at 1.2075 again.
USD/CHF Daily Outlook
Daily Pivots: (S1) 0.8587; (P) 0.8648; (R1) 0.8690; More....
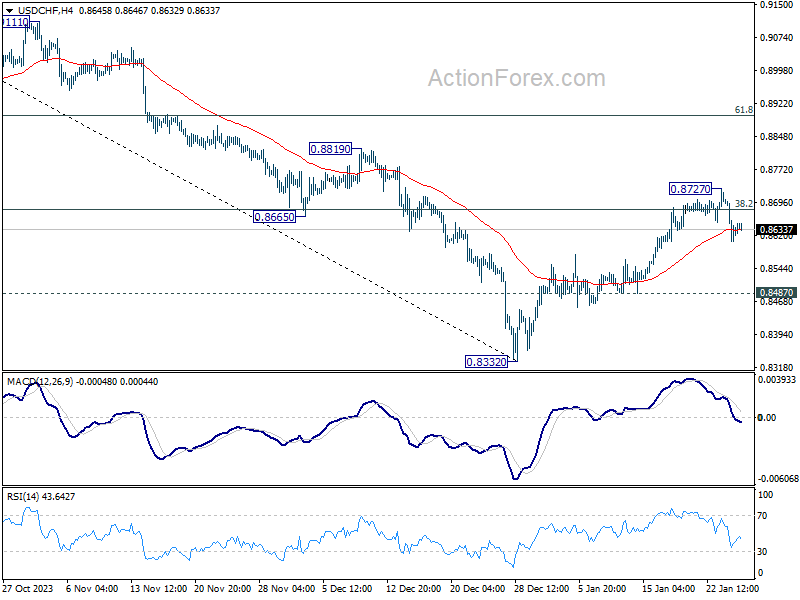
Intraday bias in USD/CHF remains mildly on the downside for 0.8487 minor support. Break there will argue that rebound from 0.8332 has completed at 0.8727, after rejection by 55 D EMA (now at 0.8686). Deeper fall would be seen to retest 0.8332 low. On the upside, firm break of 0.8727 will resume the rebound to 61.8% retracement of 0.9243 to 0.8332 at 0.8995.
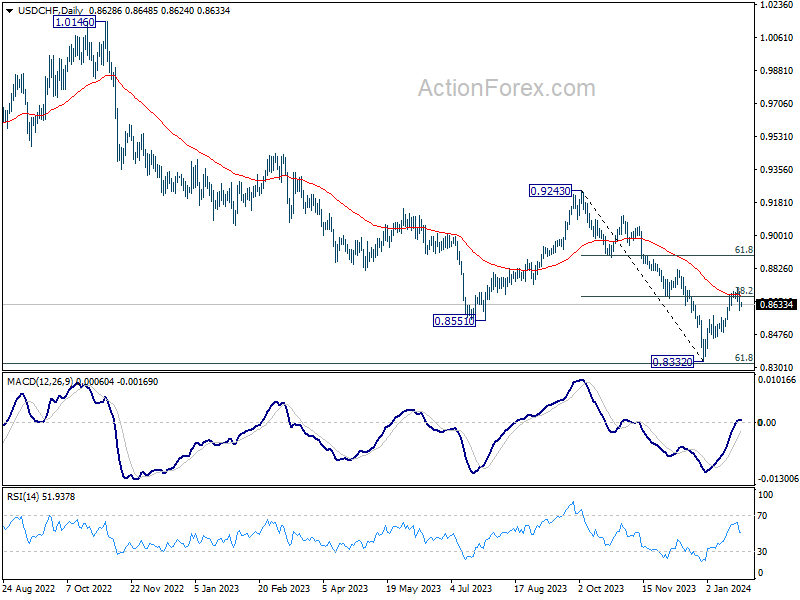
In the bigger picture, while rebound from 0.8332 could be strong, there is no clear sign of medium term bottoming yet. This rebound is tentatively seen as a corrective move for now. Also, outlook will stay bearish as long as 0.9243 resistance holds. Larger down trend from 1.0146 (2022 high) should resume through 0.8332 low at a later stage.
USD/JPY Daily Outlook
Daily Pivots: (S1) 146.63; (P) 147.54; (R1) 148.44; More...
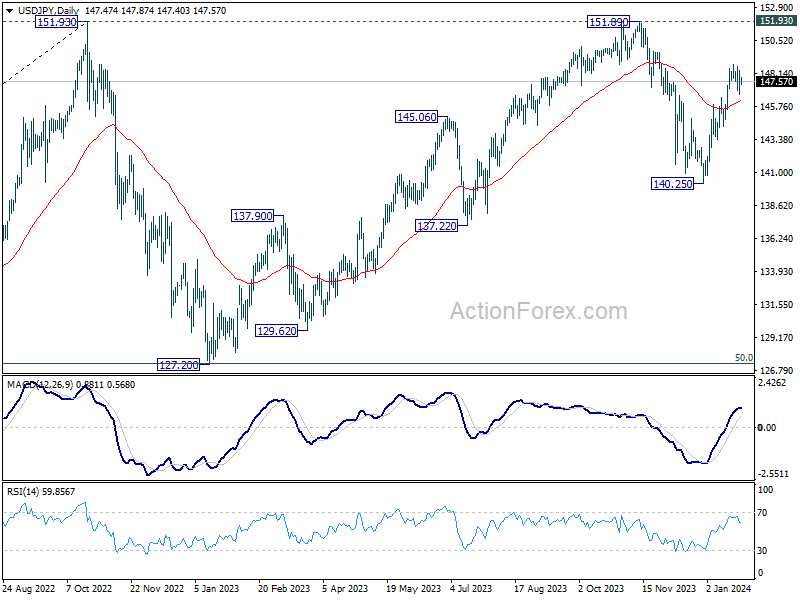
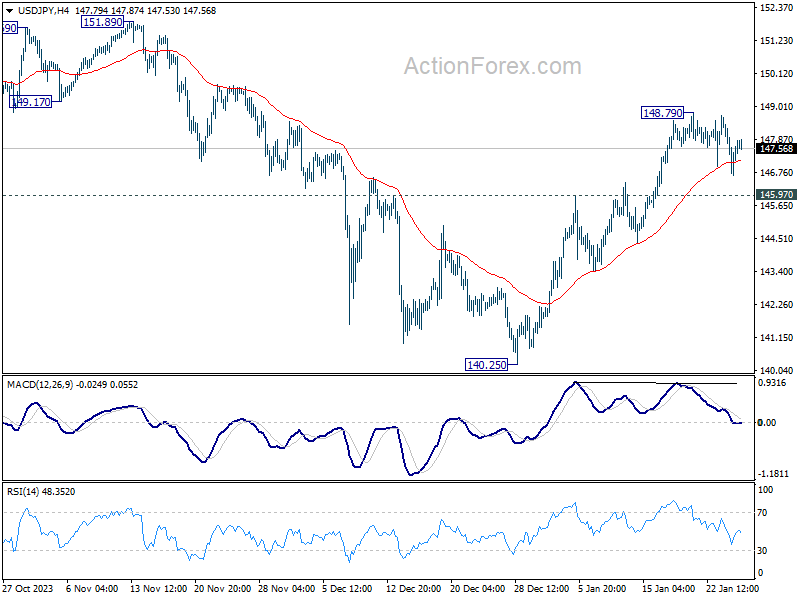
Intraday bias in USD/JPY remains neutral as consolidation from 148.79 is extending. As long as 145.97 support holds, further rally is in favor. Corrective fall from 151.89 should have completed at 140.25 already. Break of 148.79 will resume the rise from there for retesting 151.89/93 key resistance zone.
In the bigger picture, stronger than expected rebound from 140.25 dampened the original bearish review. Strong support from 55 W EMA (now at 141.89) is also a medium term bullish sign. Fall from 151.89 could be a correction to rise from 127.20 only. Decisive break of 151.89/93 will confirm resumption of long term up trend. This will now be the favored case as long as 140.25 support holds.