Sample Category Title
AUD/USD: Mixed Technical Picture Eyes US Inflation Data for Direction Signal
AUDUSD edged higher in early Thursday’s trading, underpinned by much better than expected Australian trade data and risk mode in stock markets.
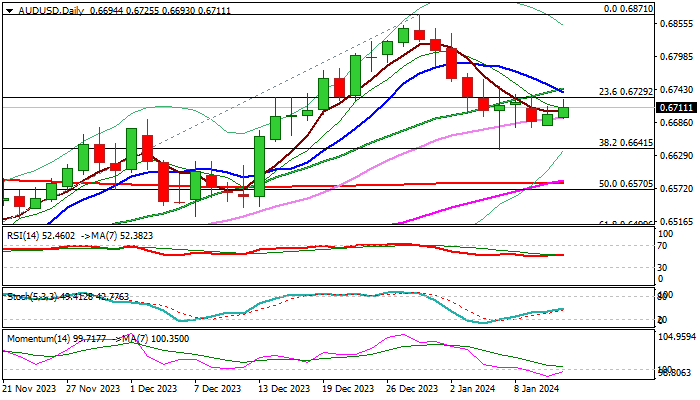
Strong rejection of the pullback from 0.6871 (Dec 28 peak) and pivotal Fibo support at 0.6641 (38.2% of 0.6270/0.6871 rally points to still strong bids, though more work at the upside will be required to generate an initial signal that the corrective phase (0.6871/0.6641) is coming to its end.
Daily studies are mixed, with 10/20DMA bear cross and 14-d momentum, weighing on near-term action, while 55/200DMA golden cross and north heading stochastic and RSI provide support.
Look for initial bullish signal on sustained break of 0.6730/40 zone (double-Fibo barrier / 10/20DMA’s) which would add to bullish bias and open way for stronger recovery.
Conversely, loss of immediate support (0.6677 higher base) would weaken near-term structure for attack at lower pivot at 0.6641, loss of which would risk deeper pullback.
US inflation data (due later today) are key event of the day and expected to provide fresh direction signal.
Res: 0.6729; 0.6755; 0.6782; 0.6800.
Sup: 0.6677; 0.6641; 0.6581; 0.6570.
Nikkei 225 Sets 21st Century High
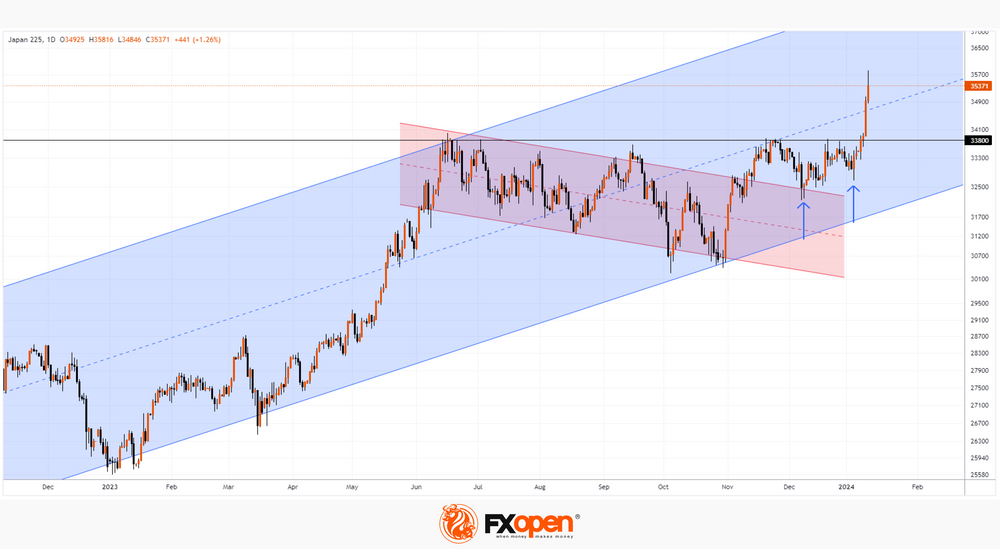
As the chart shows, this morning the Nikkei 225 price exceeded 35,700, its highest level in decades.
The Nikkei 225 index reached its all-time high on December 30, 1989, at 38,957.44 points. This was against the backdrop of Japan's economic boom, which began in the 1980s and continued until the early 1990s.
Nikkei 225 growth is supported by lower inflation:
→ in Japan: the latest data showed an annual inflation rate of 2.8% — lower than a series of more than 10 previous values, all of which were above 3%. This reduces fears that the Bank of Japan will raise interest rates and limit its current economic stimulus policies.
→ In the USA. Today, we remind you that at 16:30 GMT+3 inflation data in the USA will be published. It is also expected to show a slowdown in inflation. Therefore, market participants believe in a reduction in Fed rates, which can give impetus to the development of companies.
The NIKKEI chart shows that:
→ the price is in an upward trend (marked by a blue channel);
→ the price has overcome the correction period (marked by a red channel), which can be interpreted as a flag figure;
→ on December 7, the price tested the upper border of the flag (shown by the first arrow);
→ on January 4, the price formed a higher low (shown by the second arrow);
→ has overcome the median line of the channel (blue dotted line).
Indicators show overbought, the long upper shadow on the last candle indicates that the bears are activating, so a pullback should not come as a surprise. The median line could help the bulls consolidate their progress, and the 33,800 level should now be regarded as important support.
This article represents the opinion of the Companies operating under the FXOpen brand only. It is not to be construed as an offer, solicitation, or recommendation with respect to products and services provided by the Companies operating under the FXOpen brand, nor is it to be considered financial advice.
Finally! The SEC Approves all 11 Applications for Bitcoin ETFs
The following ETFs can start operating today:
- Blackrock's iShares Bitcoin Trust (IBIT)
- ARK 21Shares Bitcoin ETF (ARKB)
- WisdomTree Bitcoin Fund (BTCW)
- Invesco Galaxy Bitcoin ETF (BTCO)
- Bitwise Bitcoin ETF (BITB)
- VanEck Bitcoin Trust (HODL)
- Franklin Bitcoin ETF (EZBC)
- Fidelity Wise Origin Bitcoin Trust (FBTC)
- Valkyrie Bitcoin Fund (BRRR)
- Grayscale Bitcoin Trust (GBTC)
- Hashdex Bitcoin ETF (DEFI)
Despite the regulatory approval of the first spot Bitcoin ETFs in US history, the head of the US Securities and Exchange Commission (SEC) Gary Gensler has not changed his critical attitude towards cryptocurrencies. Thus, the regulator sees signs of illegally issued securities in many cryptocurrencies that operate on the Proof-of-Stake (PoS) algorithm.
According to Gensler, the regulator was forced to approve the applications due to “changed circumstances.” This is likely a reference to the recent litigation where Grayscale filed a request with the Commission to transform its Bitcoin fund into a spot ETF. The judge then concluded that the regulator had wrongfully rejected the company's application.
Gensler also warned investors about the numerous risks associated with Bitcoin.
Meanwhile:
→ Funds whose applications have been approved are reducing fees one after another, trying to win the competition for investors.
→ Bank of England (BOE) Governor Andrew Bailey, speaking before the Treasury Committee of the United Kingdom Parliament, called Bitcoin ineffective.
→ Cryptocurrency exchange apps have become unavailable in India due to the introduction of stricter legislation governing cryptocurrencies.
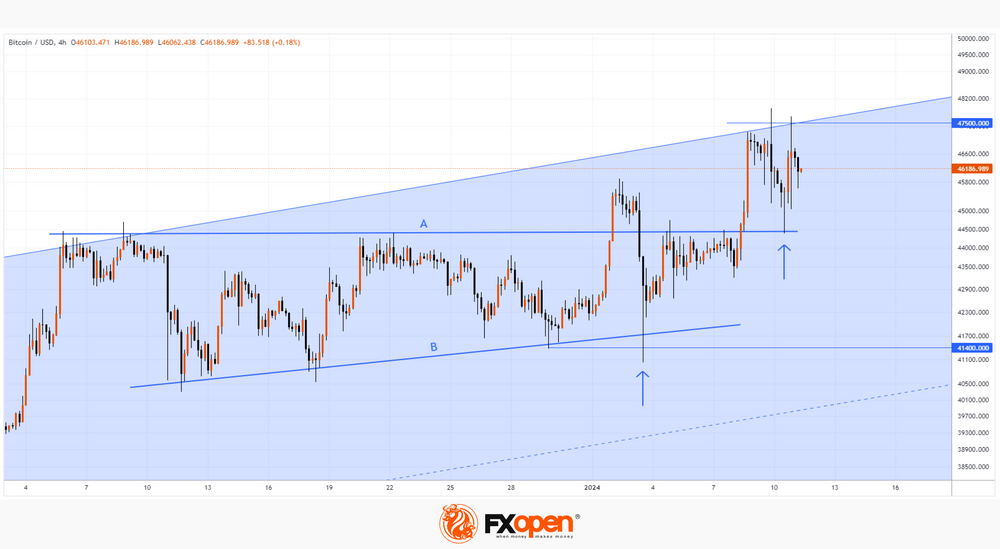
The chart shows that the price of BTC/USD did not change much after the official SEC decision. This highlights that the price of Bitcoin on exchanges has already taken into account the high probability of ETF approval.
We wrote earlier that Bitcoin is starting the year with bullish sentiment.
Note that:
→ The price of Bitcoin has reached the upper limit of the long-term channel (shown in blue, it is shown more fully in the post at the link above). Technically, resistance to growth should be expected from the upper border, which is, in principle, observed on the chart.
→ On January 2, the bulls tried to break through the A-B consolidation zone, but failed.
→ On January 3, there was an attempt at a bearish breakout (shown by an arrow), and it also turned out to be unsuccessful.
→ Recent price action shows that line A (44,400) is now acting as support.
Fundamentally, the price could be pushed higher by news that demand for new ETFs is exceeding expectations. But even if the price continues to rise on the new impulse, it will face the psychological mark of 50k per coin — it is possible that a false bullish breakout of the round figure will occur.
This article represents the opinion of the Companies operating under the FXOpen brand only. It is not to be construed as an offer, solicitation, or recommendation with respect to products and services provided by the Companies operating under the FXOpen brand, nor is it to be considered financial advice.
USDCHF Steady Within Bearish Channel
- USDCHF retains a neutral pace ahead of US CPI inflation
- Encouraging signals detected, but rally above 0.8600 required
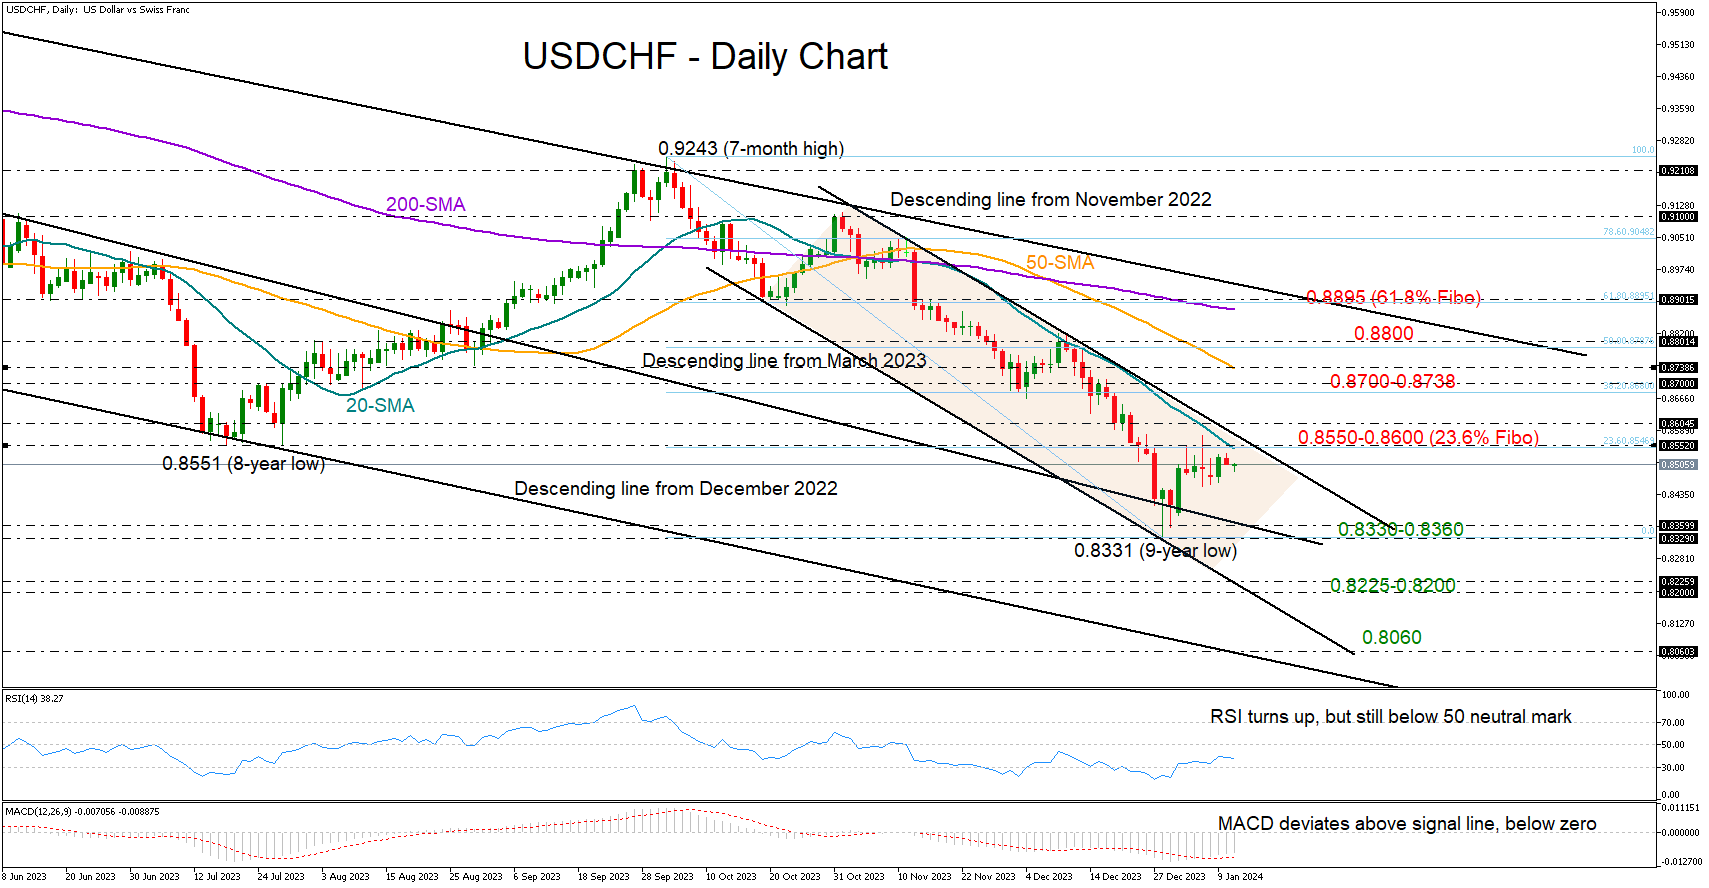
USDCHF has been gently moving sideways, unable to post durable gains above the 0.8500 level after the bounce off a nine-month low of 0.8331 at the end of 2023.
Both the RSI and the MACD have been trending up over the past week, reflecting improving sentiment in the market. Yet, the former is still some distance below its 50 neutral mark, indicating some persisting discomfort as investors eagerly wait for the US CPI inflation figures to reassess their rate cut bets later today at 13:30 GMT.
The area between the 20-day simple moving average (SMA) at 0.8550 and the 0.8600 round level, which encapsulates the 23.6% Fibonacci retracement of the latest downfall and November’s resistance trendline, will be closely watched on the upside. A successful penetration higher could reach the 0.8700 mark and the 50-day SMA, while higher, the bulls will attempt to pierce through the 0.8800 number to test the 200-day SMA and the important 61.8% Fibonacci region of 0.8895.
Should the bears take over, support could immediately come from the descending trendline from March 2023 at 0.8360 and December’s trough of 0.8331. A step lower is expected to test the channel’s lower boundary within the 0.8225-0.8200 region. If that floor cracks as well, the sell-off might expand to 0.8060, where the descending line from December 2022 is positioned.
All in all, USDCHF is holding a neutral status in the short-term picture and a bearish one in the medium-term as the downtrend from October remains valid. A decisive close above 0.8600 could raise the odds for a bullish trend reversal. Otherwise, the bears could push for new lower lows.
WTI Crude Oil Remains Within Descending Channel
- WTI oil holds beneath 20-day SMA
- 200-day SMA looks like significant resistance
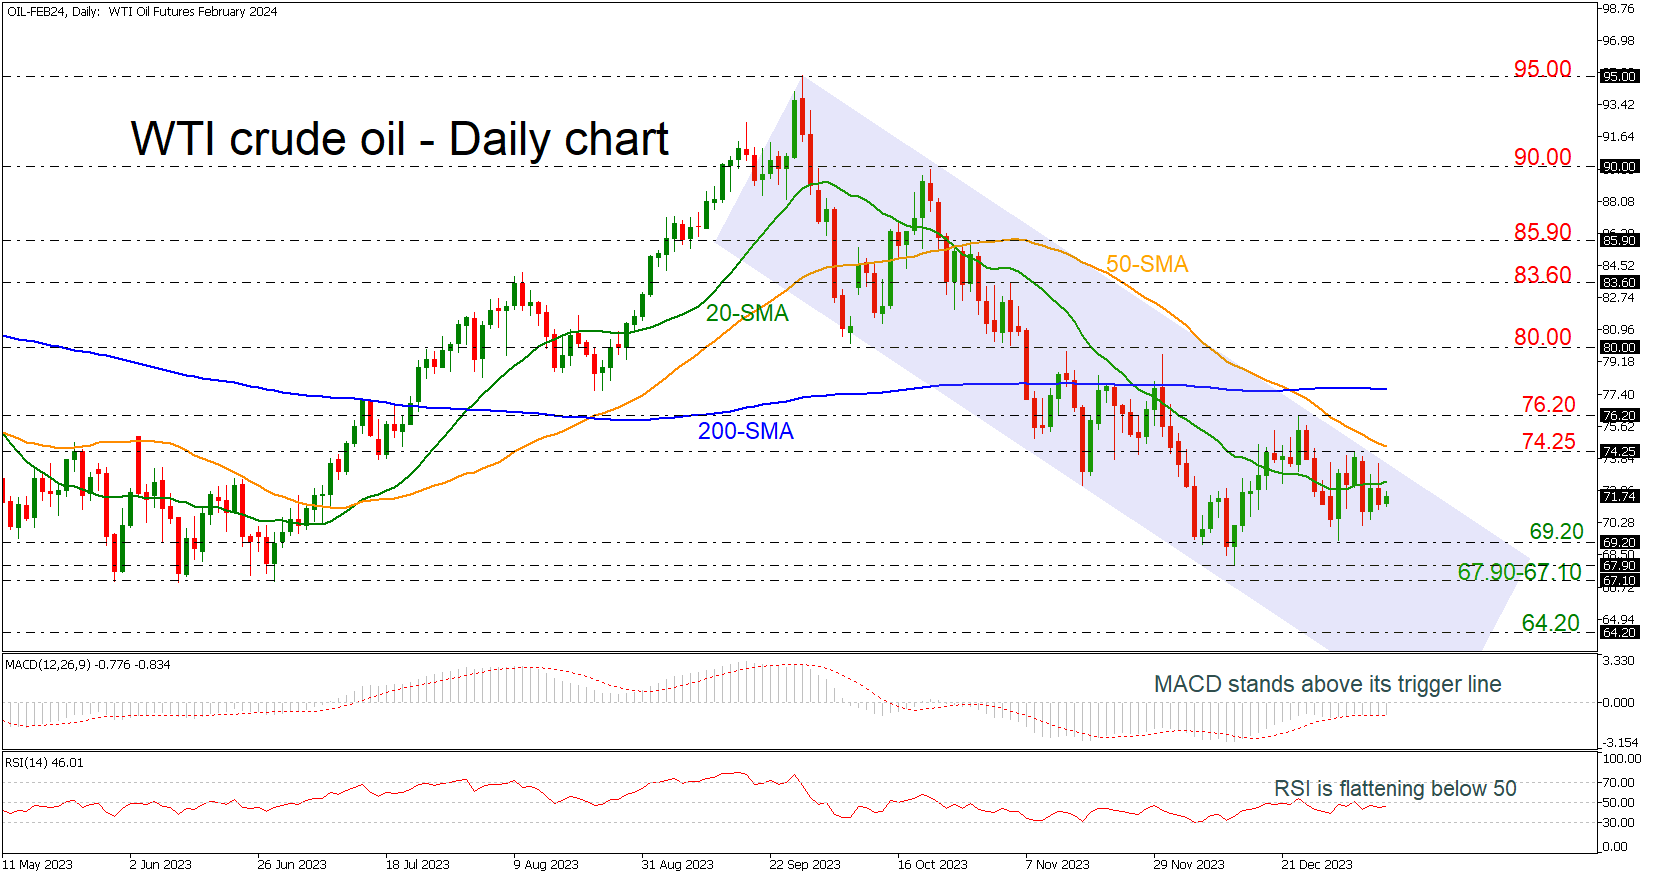
WTI crude oil futures with delivery in February have been developing within a descending channel since the end of September. Currently, the market is holding beneath the 20-day simple moving average (SMA) and near the 72.00 number with strong resistance being the 74.25 barrier as well.
The MACD oscillator is travelling above its trigger line in the negative region, while the RSI is moving horizontally beneath the neutral threshold of 50. Both indicate a weakening momentum in price and only a move towards their positive territories may show some signs for recovery.
In case the price jumps above the 74.25 resistance, which is near the 50-day SMA, and breaks the channel to the upside then it may hit the 76.20 barrier and more importantly the 200-day SMA at 77.63. A successful move above this line would open the door for a bullish correction until the 80.00 psychological mark.
On the other hand, a move lower could find immediate support at 69.20 ahead of the restrictive region of 67.90-67.10. Even lower, the 64.20 barricade may halt bearish actions, remaining within the downside pattern.
All in all, oil prices are clearly in a negative direction in the medium term and only a climb above the 200-day SMA may raise optimism for an upside recovery.
Is Oil Headed for Another Supply War?
- Oil prices remain under pressure despite Middle East crisis
- Risk of another supply war between US and OPEC is rising
- Outlook for oil seems negative as supply outpaces demand
Oil unable to capitalize on geopolitical tensions
Oil prices have taken a beating in recent months, falling by around 23% since late September despite a series of production cuts from the OPEC+ cartel that were meant to reduce supply and stabilize prices. Concerns that the Israel-Hamas war could spiral into a regional conflict that impacts supply have also done little to support prices.
That's mostly because oil supply has not fallen on a global level. While OPEC+ has taken repeated steps to decrease its production, foreign producers like the United States have raised their own output, countering those efforts.
Crude production in the US is currently at a record high of 13.2 million barrels a day and has the capacity to rise much further, as the number of active drilling rigs remains fairly low. Hence, OPEC may have taken some barrels out of the market, but the US has put them back in, which explains why investors have paid no attention.
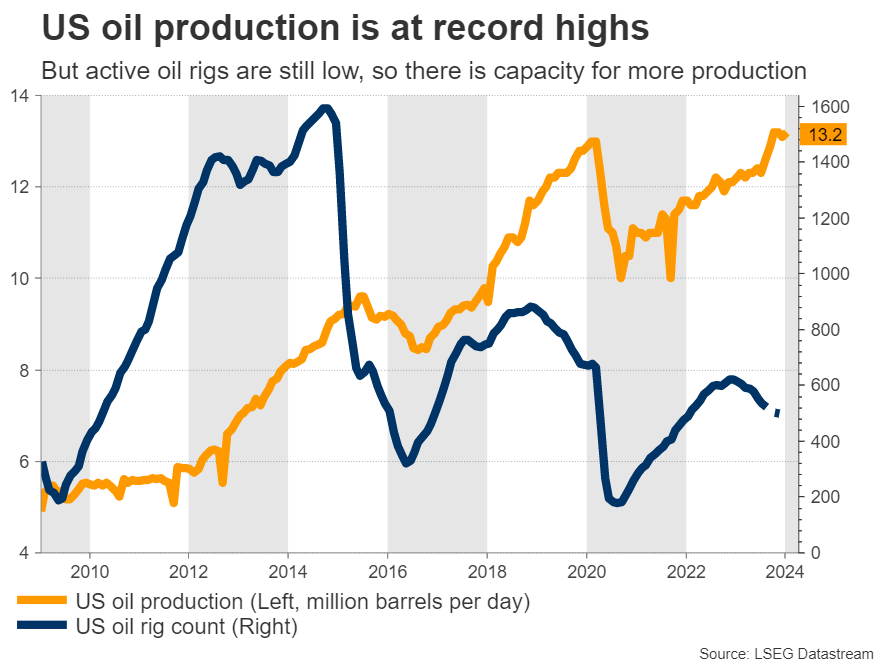
Similarly, the crisis in Gaza has only sparked fears about oil supply being lost - it hasn't actually affected physical markets. Some missile attacks against ships in the Red Sea have raised the cost of transportation, but have not taken any crude supply offline yet.
Meanwhile, the demand outlook is deteriorating. The world's largest oil importer - China - reported an annual decline in its crude imports in November, as the economy grapples with a painful slowdown in its manufacturing and construction sectors. Reflecting this shift, the US Energy Information Administration has warned that it expects slower oil demand growth in 2024 and 2025.
Is another supply war brewing?
With US oil production at record highs and likely to keep rising, there is a clear risk of another supply war taking place, as OPEC+ attempts to defend its market share. Previous episodes of rising US production were met with aggressive increases in OPEC+ supply, which flooded the market with oil and pushed prices down so that American producers became unprofitable, forcing them to exit.
This happened twice over the past decade, in 2014 and early 2020. Both instances were characterized by a dramatic increase in global supply and a collapse in oil prices. The situation today appears eerily similar. Saudi Arabia just announced it will cut the price at which it sells crude, which is essentially a strategy to undercut foreign producers and defend its market share.
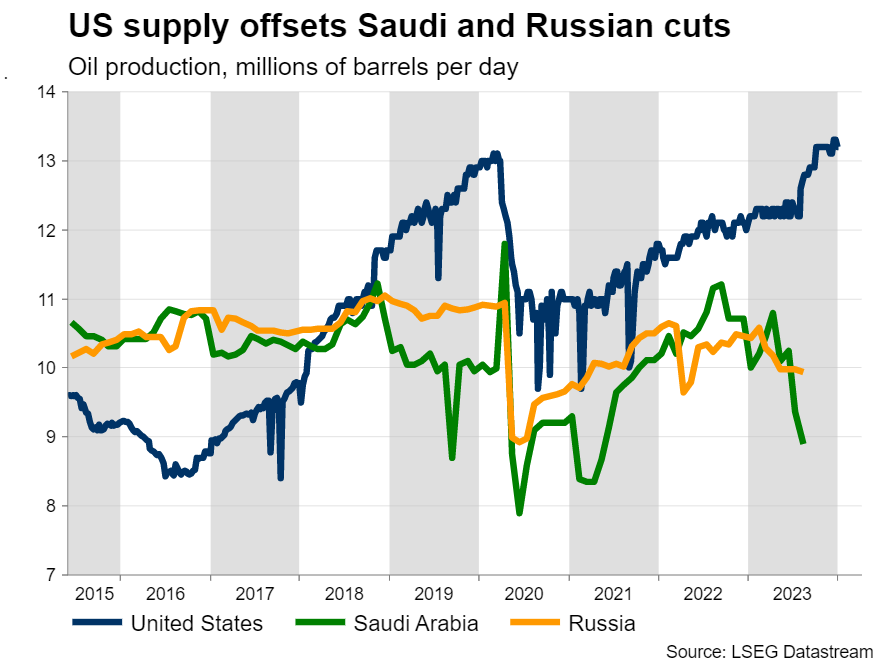
Naturally, market participants are concerned that the next step might be to raise production, abandoning the disciplined approach that OPEC has pursued in recent years. That could lead to a period of oversupply that is devastating for prices, especially if a weaker macroeconomic environment suppresses demand.
Picture is gloomy overall
All told, the outlook for oil prices seems gloomy in the coming months. The mismatch between abundant supply and lackluster demand could keep oil prices under pressure for some time, or at least stand in the way of any massive rallies.
Of course, there are some upside risks. An escalation in the Middle East that includes nations such as Lebanon or Iran joining the conflict would be bullish for oil prices. Similarly, a strong economic recovery in China could help lift demand. However, neither of these scenarios appears likely. There is little political appetite for a wider conflict in the Middle East, while China has not rolled out sufficient stimulus measures to kickstart its economy.
As such, the downside risks dominate, especially when accounting for the possibility of a ceasefire in Ukraine. Some recent reports suggest the Russians have quietly signaled they are open to such an outcome. Considering that the war has been frozen for months now and that military support for Ukraine is slowly fading, a ceasefire later this year is very plausible, with negative consequences for oil prices.
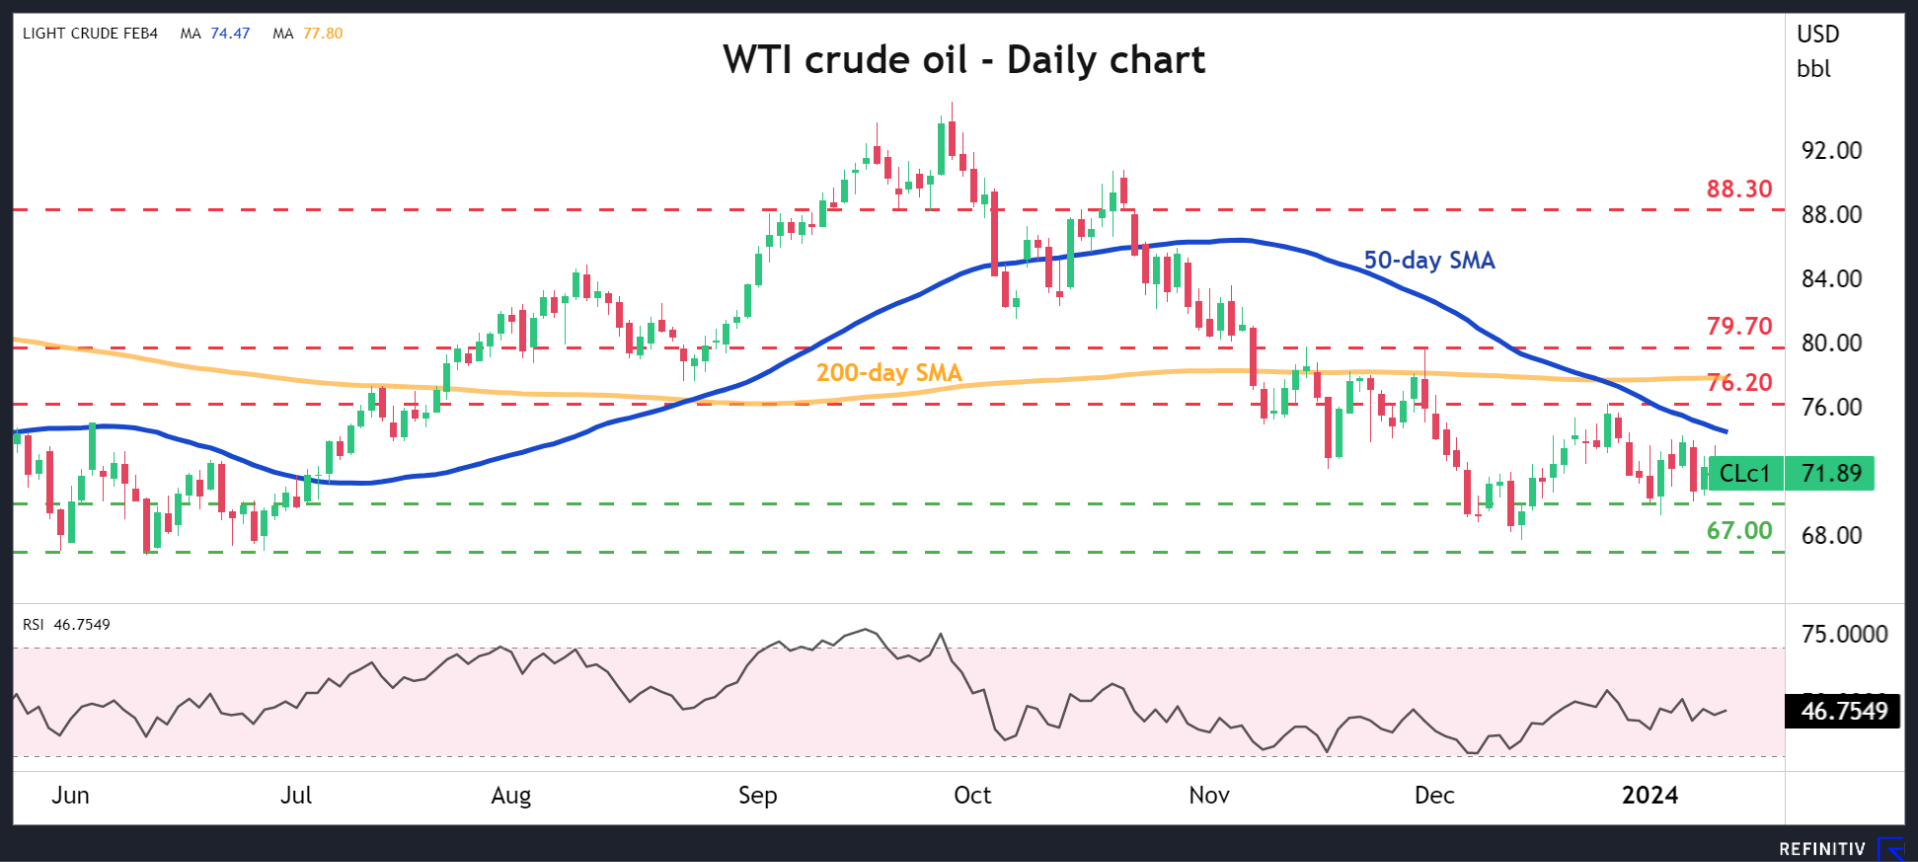
Looking at the charts, WTI crude oil has been in a steady decline over the last three months. If the drop persists, the most important region to watch on the downside is around $67.00 per barrel, an area that halted multiple selloffs last year. On the upside, buyers would need a decisive move above $76.20 to regain confidence about a potential reversal.
Rising (US) Yields Should Provide a Bottom for Dollar
Markets
ECB’s Schnabel triggered some unexpected market action yesterday. The German board member lived up to her hawkish reputation by noting that talk about rate cuts is premature. That’s more so because the recent decline in bond yields, exactly because of rate cut expectations, have loosened financial conditions more than thought. Combined with sentiment indicators bottoming out and (geopolitical) upside risks to inflation which is seen at target not before 2025, there’s a need to remain vigilant. Her comments were not at all groundbreaking but picked up by the market nonetheless in another sign the recent yield correction was overdone. German yields eventually rose 0.2-3.9 bps with the front underperforming as money markets pared ECB cutting bets. NY Fed Williams in an uninspiring late-session speech said rates are currently high enough but expects the Fed to maintain a restrictive stance for some time. US yields whipsawed but ended near the intraday highs with less than 2 bps gains at the long end. The $37bn 10-y auction carried a slight tail but demand was solid nevertheless. The 10-y yield closed above the 4% pivot. EUR/USD rose to 1.0973 from 1.0931. Euro strength was combined with USD weakness. The latter’s (changed) reaction function to oil was also visible for all to see yesterday. Brent dropped $2 intraday after a surprise buildup in US stockpiles, with knock on effects on the dollar. The yen fell to USD/JPY 145.76 amid fading expectations for a turn in BoJ monetary policy. The weak JPY is a boon to Japanese stocks though. The Nikkei 225 gapped higher to a new 34-y high this morning. The rest of Asian-Pacific markets is also trading with some proper gains. The US dollar as well as the euro lose out against most G10 peers.
We may finally get some fireworks on markets today with the US CPI number scheduled for release. Consensus expects the headline figure to pick up from 0.1% m/m to 0.2% m/m. This should bring the y/y from 3.1% in November to 3.2% in December. Core inflation is seen at a monthly 0.3% while keeping the disinflation process still in check y/y (from 4% to 3.8%). We draw comfort from the market reaction to Schnabel’s speech and stick to the view that anything but a big downward surprise should keep yields supported. We look out whether the 10-y yield gains further traction north of 4% to call off the immediate downside alert and turn the technical picture more neutral. Rising (US) yields should provide a bottom for the dollar, especially if equity optimism fades somewhat. The S&P 500 is nearing strong resistance around the 4800 barrier. EUR/USD first reference to the downside is located at 1.0875.
News & Views
The Bank of Korea kept its policy rate unchanged at 3.5%. It’s been at that level for a year now. The policy statement dropped the (hawkish) reference that additional rate hikes might be needed. The BoK will nevertheless maintain a restrictive policy stance for a sufficiently long period of time until the Board is confident that inflation will converge to the 2% target. The change of tone comes as inflation continues to slow (3.2% Y/Y in December) with external risks regarding oil prices and the Israel-Hamas conflict having eased. Prematurely lowering the base rate risks stimulating inflation expectations and a new rise in actual inflation. To complement the high policy rate, the BoK decided to temporarily increase the amount of financial support to regional SME’s. At its next meeting, the BoK will have a new set of economic projections which could trigger a further finetuning of policy guidance for 2024.
The US Securities and Exchange Commission for the first time approved exchange-traded funds that invest directly in Bitcoin in what can be a pivotal moment for cryptocurrency markets. First funds are expected to start trading as soon as today. Spot bitcoin ETF’s had been available in other markets, but US access opens up direct access for a large share of the investor community. The SEC approval marks a U-turn after rejecting earlier application for almost a decade because of manipulation and fraud risks.
US Headline Inflation Could Rise Modestly from 3.1% to 3.2% in December
Optimism is on the menu ahead of today’s much-awaited US inflation report. The US 10-year yield tipped a toe below the 4% level, the S&P500 came at a spitting distance to the December peak level as technology stocks led gains. Nvidia hit a fresh record, MAMA stocks advanced to an ATH as well, as Meta jumped more than 3.50%.
Optimism in the stock markets will likely continue if today’s US inflation report comes in sufficiently soft. A consensus of analyst estimates on Bloomberg hints that US headline inflation may have gently increased from 3.1% to 3.2% in December, while core inflation has certainly eased from 4% to 3.8% - the slowest pace since May 2021. Data in line, or ideally softer than expected, will keep the Federal Reserve (Fed) doves in charge of the market and could further boost appetite in stocks and bonds. The ongoing tensions in the Red Sea region and the rising cost of moving goods – and their potential impact on consumer prices – will remain on the back of our minds, but disinflation remains the base case scenario for 2024 due to weakening demand, and until there is stronger data-based evidence that the geopolitical situation is bad for inflation, investors won’t let go of the beautiful upside swing that the market caught into last year’s end.
In summary, if inflation data from the US turns out to be suitably mild, it could serve as the final element needed to propel the S&P500 to a new record.
The US dollar is softer across the board this morning. The EURUSD could find a suitable reason to surpass the 1.10 mark, with weak potential to extend gains above this level, however, given the morose economic outlook in the eurozone and the sputtering German growth. The USDJPY rallied past the 145 level as a former Bank of Japan (BoJ) board member said that the BoJ is completely ready to exit the negative rates but that the normalization won’t be like the aggressive ones that we saw in the rest of the developed world; it will likely be very slow instead. Regardless, the upside potential in the USDJPY is seen limited and the long Japanese yen is pointed at as the most obvious trade of the year. But when everyone is looking somewhere, action tends to happen elsewhere.
Exploding debt issuance
Appetite for newly issued bonds is very strong at the start of this year as investors continue to rush into the bond markets in expectation of interest rate cuts. In this context, Spain received a record EUR 130bn of bids for its 10-year bond earlier this week, this Tuesday was also a record day of bond issuance in the primary market across Europe and the US’ $52bn auction for 3-year notes also setlled at 4.10% - some 100bp below the October peak.
Furthermore, the global debt supply will increase in the next few months, with the US, the UK, the Eurozone and Japan due to sell a net $2.1 trillion worth of new bonds to finance their 2024 spending plans. That’s a 7% increase compared to last year. The problem is, the central banks are no longer buying the new government debt – on the contrary, they reduce their massive balance sheets. Therefore, the over-supply of bonds could soon overweigh the rate cut bets – which are already more than fully priced in – and the latter could throw a floor under the bond yields, shift focus to the exploding debt levels and oblige stock investors to look elsewhere to extend the equity rally – like earnings.
Earnings
Big US banks will be going to the earnings confessional today. They are expected to annouce an increase in bad loans, and results will likely be mixed. But overall, earnings expectations are encouraging for the S&P500 stocks, and first results from the semi conductors look encouragin for today’s most hyped AI and chip stocks. Samsung posted its smallest proft decline in the last five quarters and TSM’s Q4 revenue beat estimates of a decline. Yes, it’s not excellent, but it’s encouraging, because at the same time, the global chip sales rose for the first time in more than a year as the chip glut eased, investors expect demand for high performance, AI chips to pick up momentum as every company from L’Oreal to Walmart are now rushing to AI to propose new and more efficient services to their clients, and high estimates point that Nvidia’s sales could go up to $20bn in the latest quarter. So yes, Nvidia keeps climbing like my fave free solo climber Alex Honnold.
Keep selling
Crude oil gains remained limited yesterday as the EIA data posted a surprise 1.3-mio-barrel build in US oil inventories last week – a report that was not in line with the API – and it happens. Oil traders look to sell the tops in an effort to push the price of barrel below the $70pb mark.
All Eyes on US Inflation
In focus today
The most important release today will be the US December CPI. We look for a modest uptick in headline inflation to +0.2% m/m SA (Nov +0.1% m/m) driven mostly by less negative energy contribution while core inflation is set to remain relatively stable at +0.3% m/m SA (Nov +0.3% m/m). The main focus will be on underlying components of inflation, especially on the services sector.
In Sweden, Riksbank vice governor Per Jansson who - as we read it - has shifted from being the most hawkish member to becoming the most dovish member, is scheduled for a speech on the economy and current monetary policy at 15:00 CET.
Economic and market news
What happened overnight: Things were generally quiet overnight, as markets look ahead to the release of the US CPI. On geopolitics, the UN Security Council has passed a resolution that calls for an immediate stop to the Houthi attacks on Red Sea vessels. The Nikkei 225, Japan's benchmark equity index, had another strong day. As of this morning, it was up by 2%, hitting a 34-year high. Bitcoin found support on the back of the US Securities and Exchange Commission approving ETFs holding the digital asset.
What happened yesterday: Markets continued to temper expectations on a March rate cut by the ECB, after ECB Vice-President Guindos said in a speech that he expected the pace of disinflation to "slow down in 2024, and to pause temporarily at the beginning of the year", and ECB member Isabel Schnabel said it was "too early to discuss rate cuts" in a Q&A on X. In December, a March-cut was fully priced in, while markets now attach a 40% probability of a cut. We stick to our expectations of a first rate cut in June.
The yen continued to weaken against major currencies during yesterday's session, with USD/JPY breaking above the 145 level after data showed weak wage growth in November.
We got a range of Scandinavian data yesterday. In Sweden, November data showed the GDP indicator advancing (+0.2 % mom) for the second month in a row, suggesting the Q4 print will eventually show an expanding economy. That said, retail sales, consumption and production all fell back, but note October data instead was revised higher. Norwegian core inflation was slightly lower than expected at 5.5% y/y (consensus: 5.6%). The initial market reactions were fairly muted with EUR/NOK continuing to trade around the 11.30 mark. In Denmark, headline inflation was 0.7% y/y in December, with food prices in particular posing a drag.
Equities: Risk appetite picked up a bit on Wednesday. Equities were generally higher, led by the US (S&P 0.6% vs Stoxx 600 -0.2%). The reason for the US outperformance was once again a growth-driven preference. Again, big tech were the stand-outs. This was not an overly risky session. Other cyclicals, such as industrials, materials and banks, did only okay. Likewise, small caps continued to underperform. The wait-and-see mode will be over today as US inflation figures are due and earnings results kick off tomorrow. US futures are slightly higher into the numbers. The Japanese rally continues, with Nikkei 225 gaining another 2% this morning (+5% so far this year!).
FI: Global yields ended marginally higher in a quite uneventful macro session. The high level of issuance remains a main driver for FI markets these days. Short-end EGB yields rose as the pricing of ECB rate cuts in 2024 continues to fade, while the long end of the curve was close to unchanged. The 5Y5Y EUR inflation swap rate faded some 3bp as prices for natural gas and oil continued declining.
FX: Yesterday's FX session was primarily characterised by the weakening of the JPY amid higher rates and disappointing Japanese data. The EUR was among the best performers yet EUR/USD remained below the 1.10 figure. In the Scandies both EUR/NOK and EUR/SEK ended the sessions slightly higher.
GBP/JPY Daily Outlook
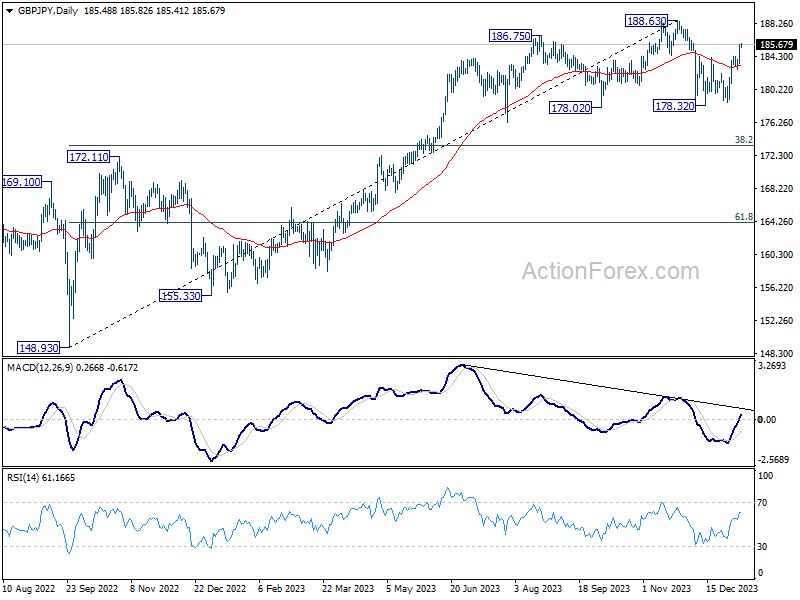
Intraday bias in GBP/JPY remains on the upside at this point. Rebound from 178.32 is in progress for retesting 188.63 high. On the downside, break of 182.73 support is needed to indicate completion of the rebound. Otherwise, further rally will remain in favor in case of retreat.
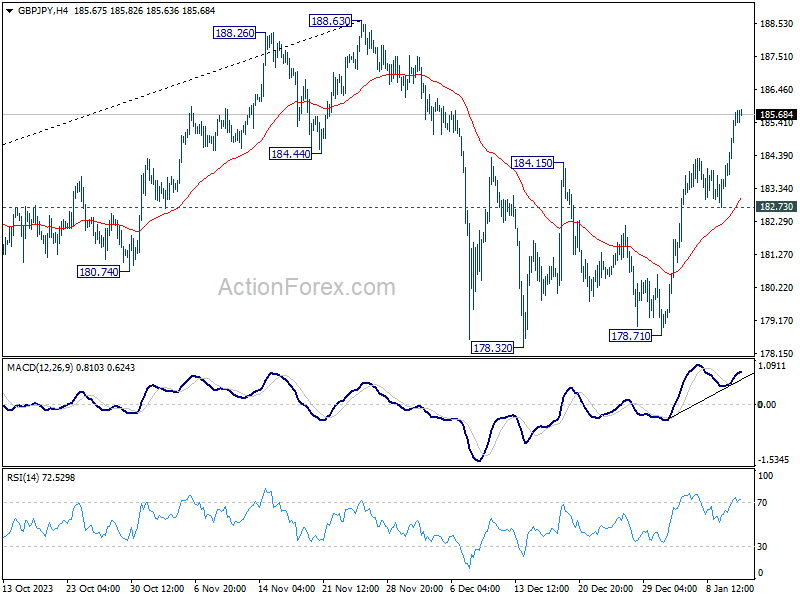
In the bigger picture, price actions from 188.63 medium term top are seen as a correction to the up trend from 148.93 (2022 low) only. As long as 172.11 resistance turned support holds, larger up trend from 123.94 (2020 low) is still in favor to resume through 188.63 at a later stage.