Sample Category Title
EUR/JPY Daily Outlook
Daily Pivots: (S1) 158.47; (P) 159.22; (R1) 160.68; More...
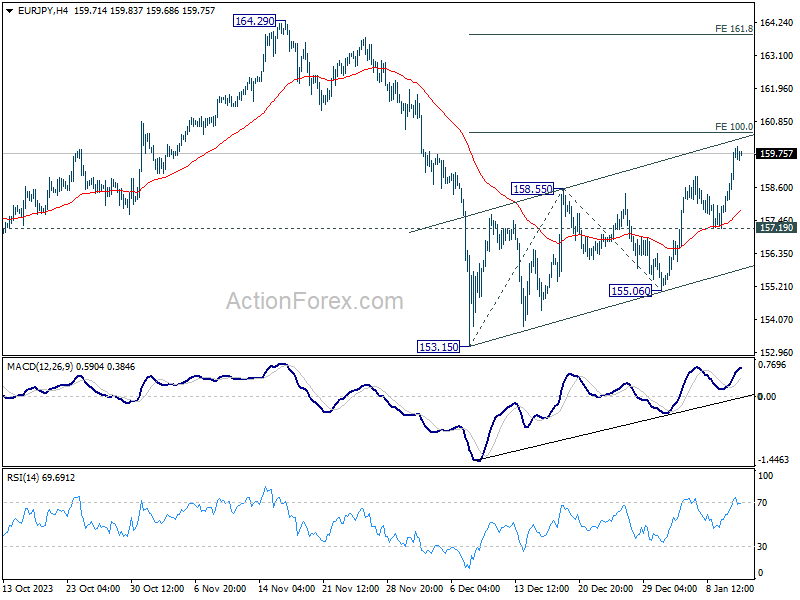
Intraday bias in EUR/JPY stays on the upside at this point. Current rebound from 153.15 is in progress for 100% projection of 153.15 to 158.55 from 155.06 at 160.46. Firm break there will target 161.8% projection at 163.79. For now, further rise will remain in favor as long as 157.19 support holds, in case of retreat.
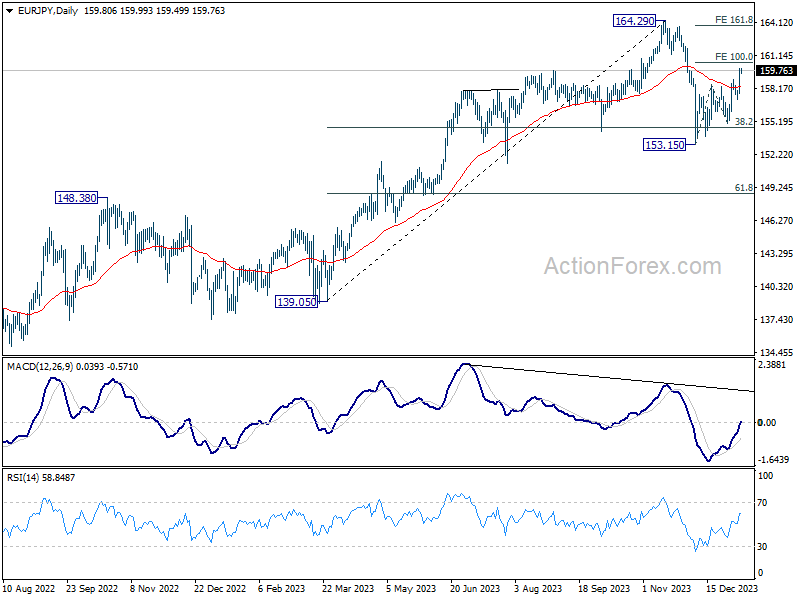
In the bigger picture, price actions from 164.29 medium term top are tentatively seen as a correction to rise from 139.05 for now. As long as 148.48 resistance turned support holds (2022 high), larger up trend from 114.42 (2020 low) could still resume through 164.29 at a later stage.
EUR/GBP Daily Outlook
Daily Pivots: (S1) 0.8598; (P) 0.8609; (R1) 0.8623; More...
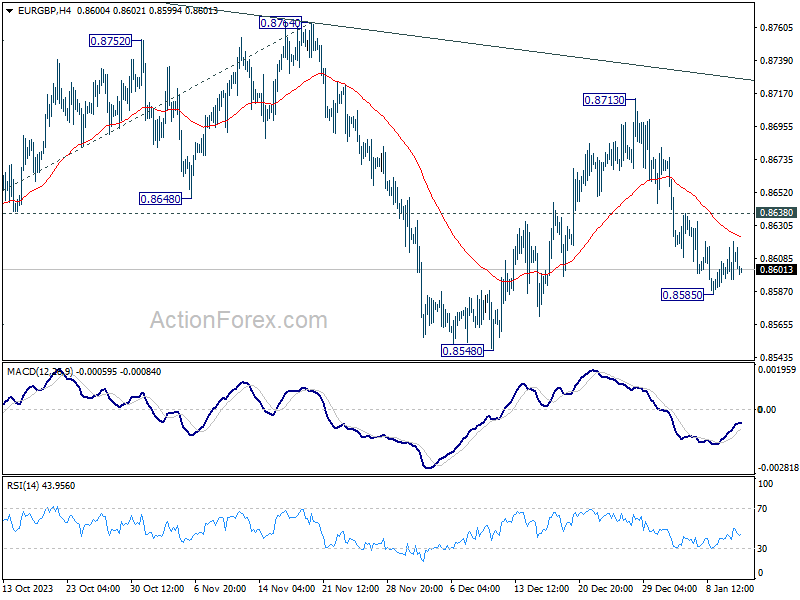
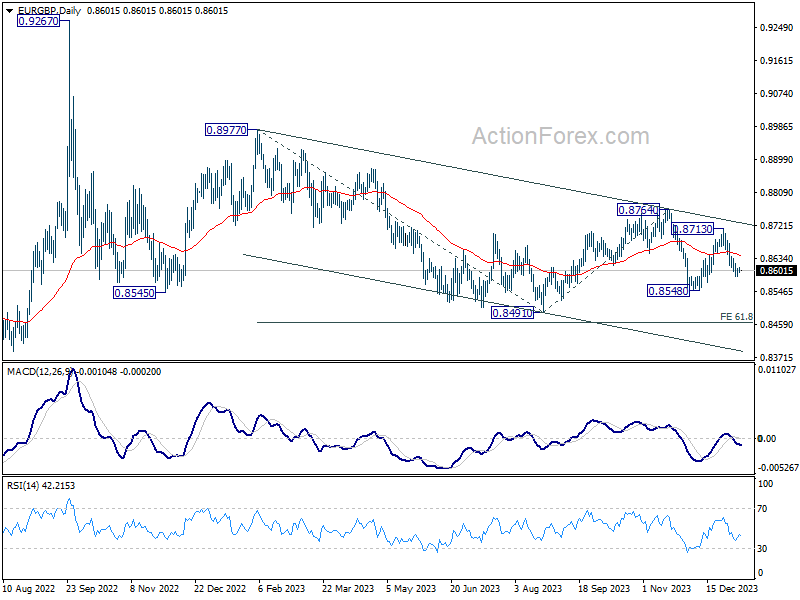
Intraday bias in EUR/GBP remains neutral for the moment. Further decline is in favor with 0.8638 minor resistance intact. On the downside, break of 0.8585 will resume the fall from 0.8713 to 0.8548 support first. Break there will target 0.8491 low next. However, break of 0.8638 will turn bias to the upside for stronger rebound.
In the bigger picture, fall from 0.8764 is seen as another leg in the whole down trend from 0.9267 (2022 high). Outlook will stay bearish as long as 0.8764 resistance holds. Break of 0.8491 will target 61.8% projection of 0.8977 to 0.8491 from 0.8764 at 0.8464.
EUR/AUD Daily Outlook
Daily Pivots: (S1) 1.6297; (P) 1.6331; (R1) 1.6382; More...
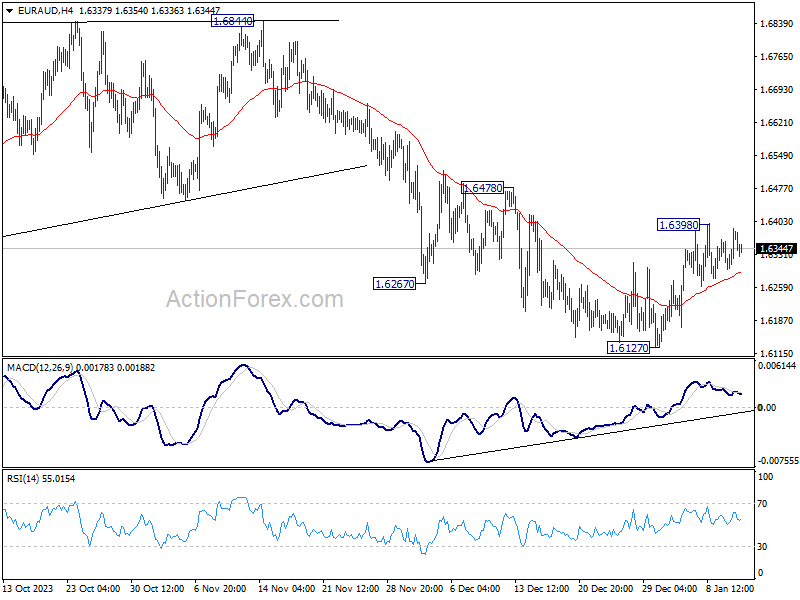
Intraday bias in EUR/AUD remains neutral and risk stays on the upside as long as 1.6127 support holds. Above 1.6398 will resume the rebound to 1.6478 resistance. Firm break there will argue that whole correction from 1.7062 has completed, and target 1.6844 resistance for confirmation. Nevertheless, break of 1.6127 will resume the corrective fall to 1.6000 fibonacci level.
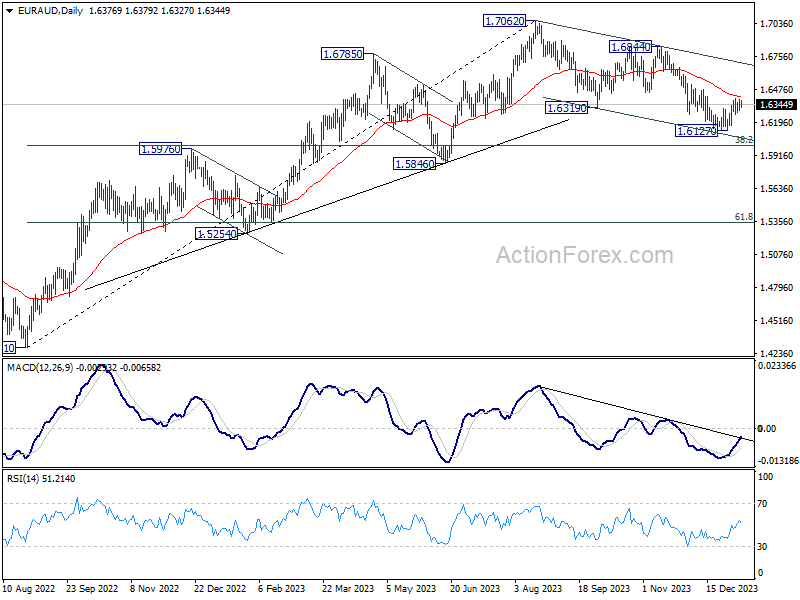
In the bigger picture, fall from 1.7062 medium term top is seen as correction to the up trend from 1.4281 (2022 low). Strong support should be seen around 1.5846 and 38.2% retracement of 1.4281 to 1.7062 at 1.6000 bring rebound. Break of 1.6844 will argue that this up trend is ready to resume through 1.7062 high.
EUR/CHF Daily Outlook
Daily Pivots: (S1) 0.9317; (P) 0.9331; (R1) 0.9349; More...
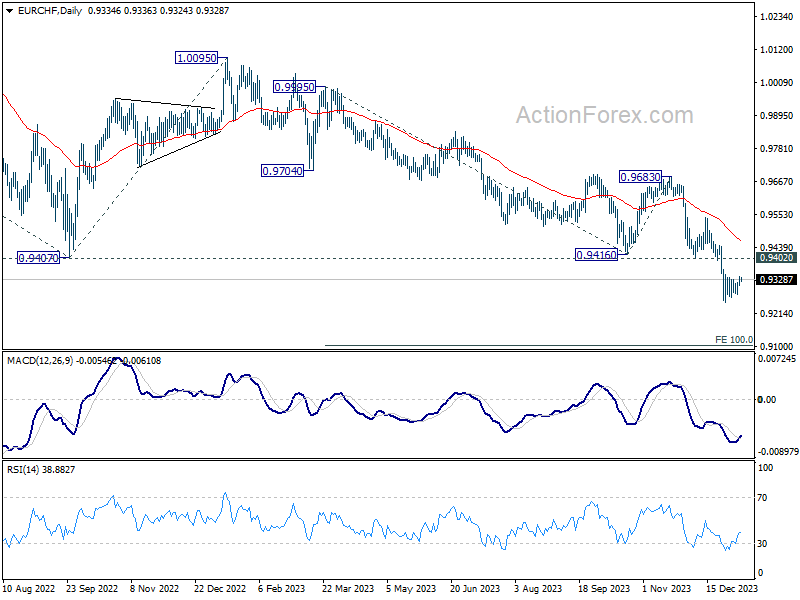
No change in EUR/CHF's outlook as consolidation from 0.9252 is still in progress. While stronger recovery cannot be ruled out, outlook will stay bearish as long as 0.9402 support turned resistance holds. On the downside, break of 0.9252 will resume larger down trend to 100% projection of 0.9995 to 0.9416 from 0.9683 at 0.9104 next.
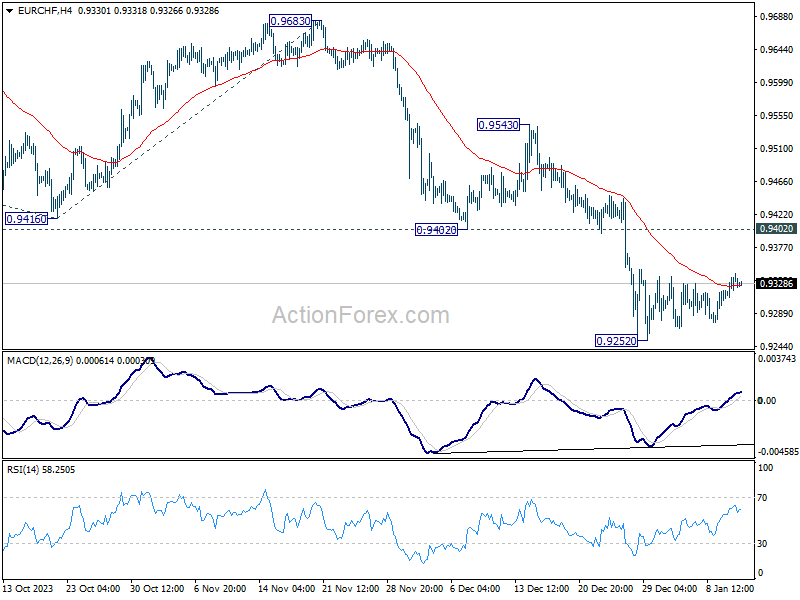
In the bigger picture, medium term outlook remains bearish as long as 0.9683 resistance holds. Current fall from 1.2004 (2018 high) is part of the multi-decade down trend. Next target is 61.8% projection of 1.1149 (2020 high) to 0.9407 from 1.0095 at 0.9018.
Easing Liquidity Conditions May Provide Interim Support for China and Hong Kong Stock Markets
- China’s credit impulse has remained on a slow upward trajectory since July 2023.
- Key China’s central bank (PBoC) official has signalled a further accommodating monetary policy in 2024.
- Growth in China’s services activities expanded in December 2023.
- Watch the 16,100 key long-term secular support on the Hang Seng Index.
China and Hong Kong stock markets have been in the doldrums for the past four years since the pandemic crisis added by a heightened deflationary risk inflicted on China’s economy due to persistent weakness in the property market in the past two years.
Both have started the new year on a weak footing with China’s CSI 300 benchmark stock index slipping to a year-to-date loss of -4.2% at this time of the writing and hitting its lowest level since 2018. Similar dismal performances are seen in the Hong Kong stock market; Hang Seng Index (-4.2%), Hang Seng Tech Index (-7.3%), and Hang Seng China Enterprises Index (-4.6%) over a similar period.
Despite the lingering risk of the entrenched deflationary spiral, ongoing corruption, and regulatory clampdowns in China’s private and public sectors that spooked foreign investors, there has been some sign of “economic light shining in the dark tunnel”; the official NBS Non-Manufacturing PMI and Caixin Services PMI for December indicated a slight growth uptick in services activities for December with new orders grew the most in seven months in the report compiled by Caixin.
Secondly, the Bloomberg Credit Impulse Index for China, a measurement of credit/liquidity growth has been on a slow upward trajectory since July 2023 (24.10 in July to 25.97 printed on November 2023).
China’s credit impulse is on the rise
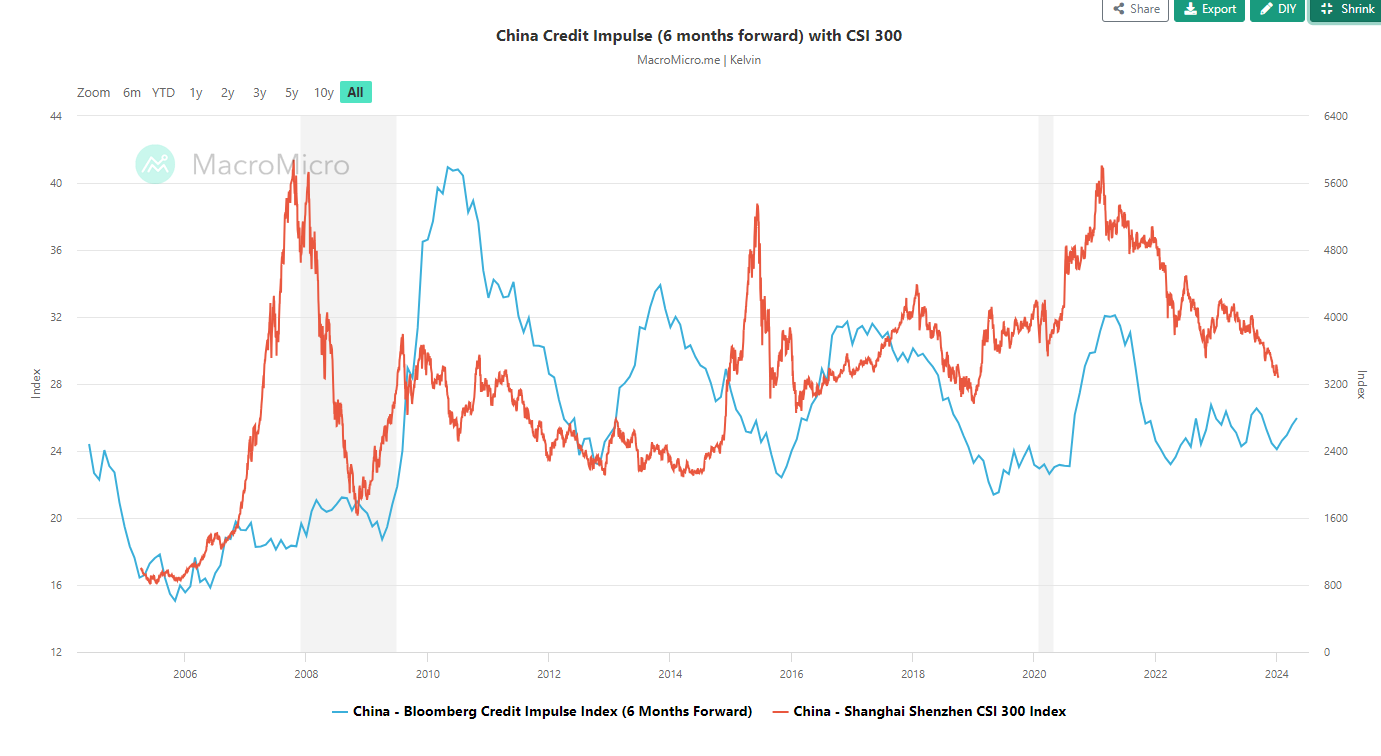
Fig 1: Bloomberg China Credit Impulse Index & CSI 300 as of 11 Jan 2024 (Source: Macro Micro, click to enlarge chart)
Interestingly, if we shift the Bloomberg Credit Impulse Index for China six months forward, its movement does exhibit a direct correlation with the CSI 300 Index which implies a continuation uptick in credit impulse may translate to a similar upward directional movement in the CSI 300 going forward (see Fig 1).
In addition, a key China’s central bank (PBoC) official signalled earlier this week that PBoC may lower the reverse ratio requirements for Chinese banks in 2024 which translates to a potential further accommodative monetary policy stance. Also, the downside pressure inflicted on the yuan via an accommodating monetary policy is likely to be reduced in 2024 as the US central bank, the Fed may start to embark on a dovish pivot path for interest rate cuts in the US.
Hence, it may lead to a further rebound in credit impulse which in turn stokes potential bullish short-term animal spirits back into the China and Hong Kong stock markets.
16,100 remains the key long-term secular support on the Hang Seng Index
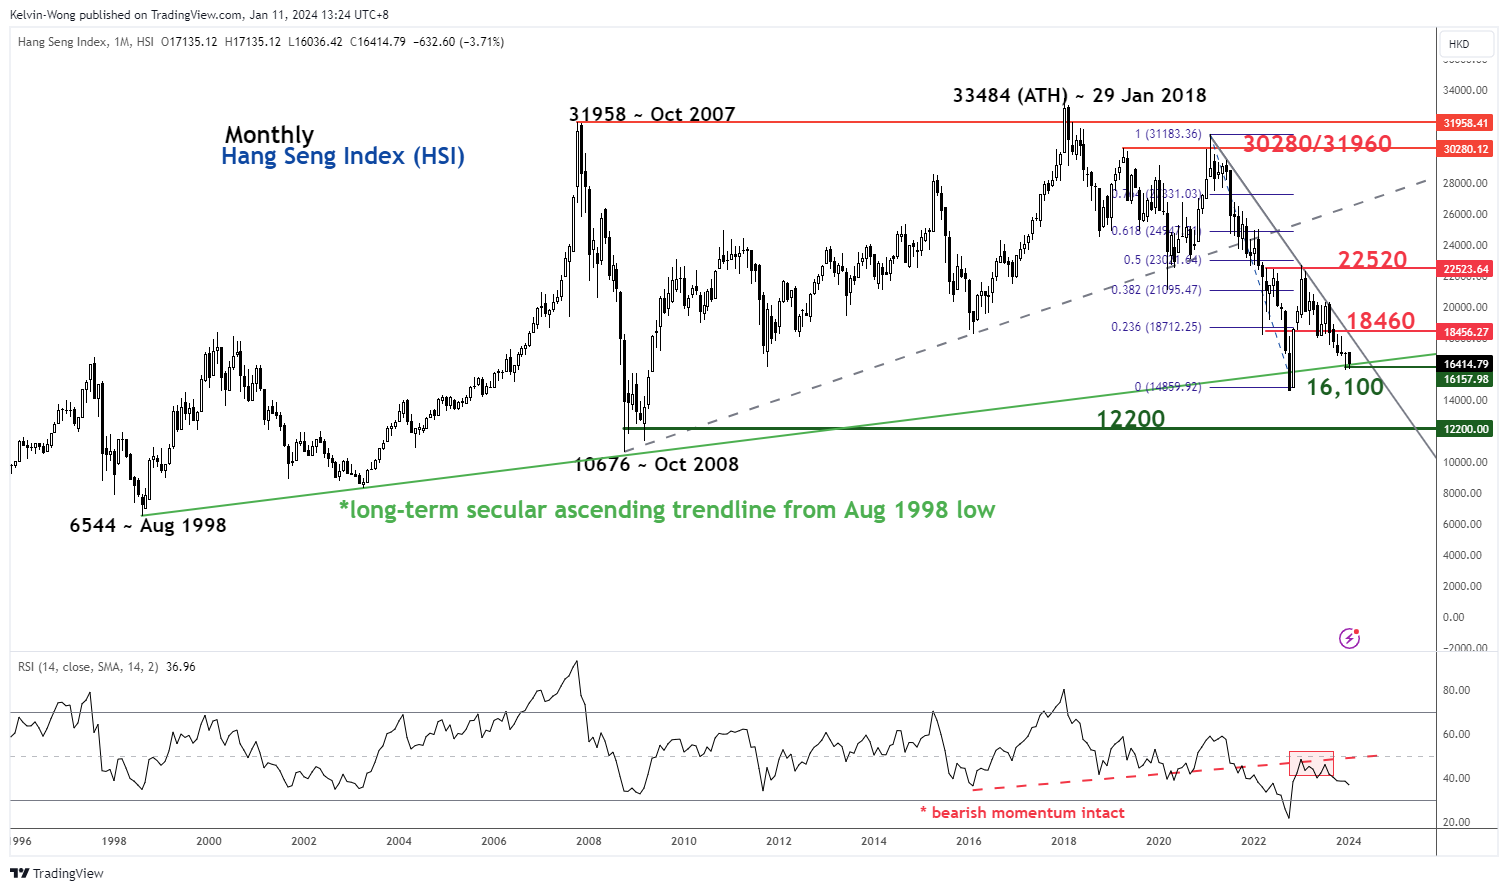
Fig 2: Hang Seng Index long-term secular trend as of 11 Jan 2024 (Source: TradingView, click to enlarge chart)
The ongoing weakness seen in the Hang Seng Index (HSI) has managed to be contained above the 16,100 key long-term secular pivot support which is defined by its ascending trendline that led to a prior significant recovery after every major bearish correction since August 1998, the onslaught inflicted by the Asian Financial Crisis.
To see a much more potentially heightened bullish animal spirits feedback loop in the Hong Kong stock market, the HSI needs to clear above its major resistance at 18,460 which is the descending trendline in place since the February 2021 major swing high where the two important events took shaped around that period; the strict business practices regulations imposed on China Big Tech firms and a series of Covid related lock-down measures enacted in China.
USD/CAD Daily Outlook
Daily Pivots: (S1) 1.3363; (P) 1.3383; (R1) 1.3399; More...
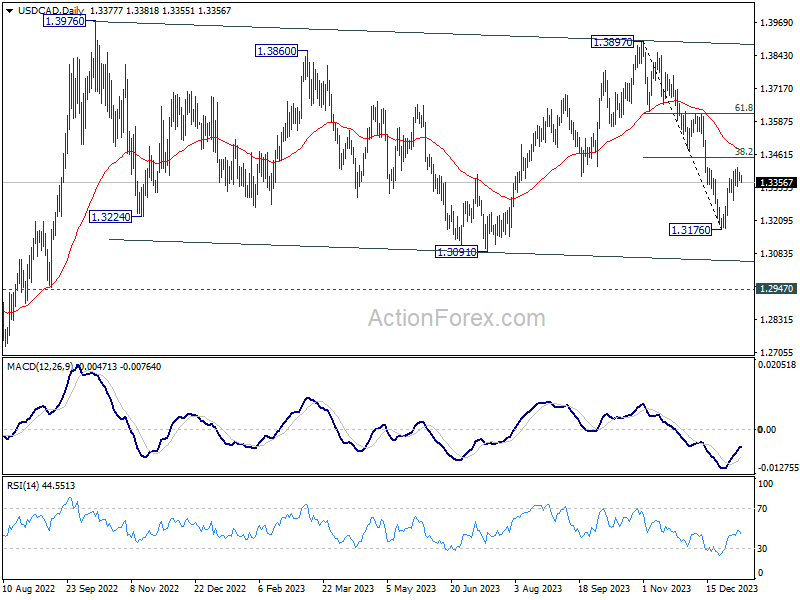
Intraday bias in USD/CAD is turned neutral with current retreat. But further rally is in favor as long as 1.3286 minor support holds. Above 1.3413 will resume the rebound from 1.3176 to 38.2% retracement of 1.3897 to 1.3176 at 1.3451. Firm break there will pave the way to 61.8% retracement at 1.3622. On the downside, however, break of 1.3286 will turn bias back to the downside for 1.3176 low instead.
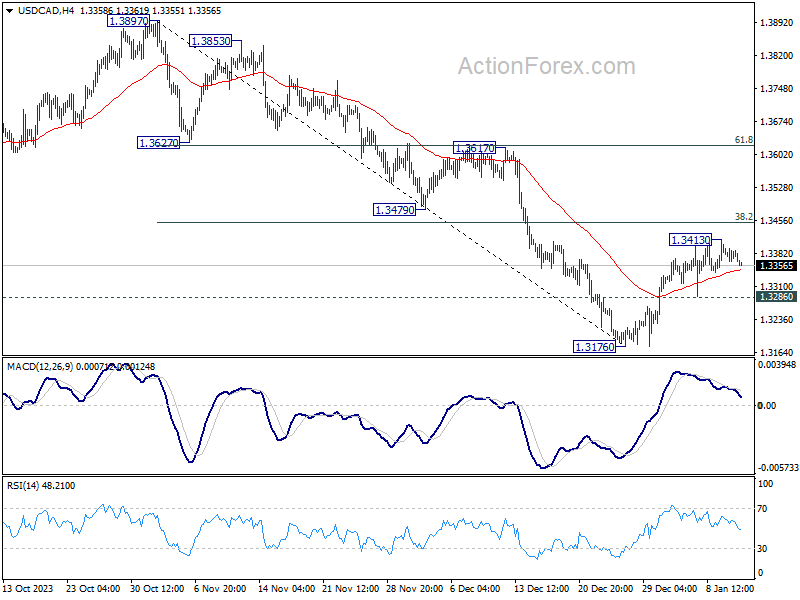
In the bigger picture, price actions from 1.3976 (2022 high) are viewed as a corrective pattern only. While fall from 1.3897 could still extend through 1.3091, strong support should emerge above 1.2947 resistance turned support to bring rebound. Overall, larger up trend from 1.2005 (2021 low) is still expected to resume at a later stage.
AUD/USD Daily Report
Daily Pivots: (S1) 0.6682; (P) 0.6698; (R1) 0.6715; More...
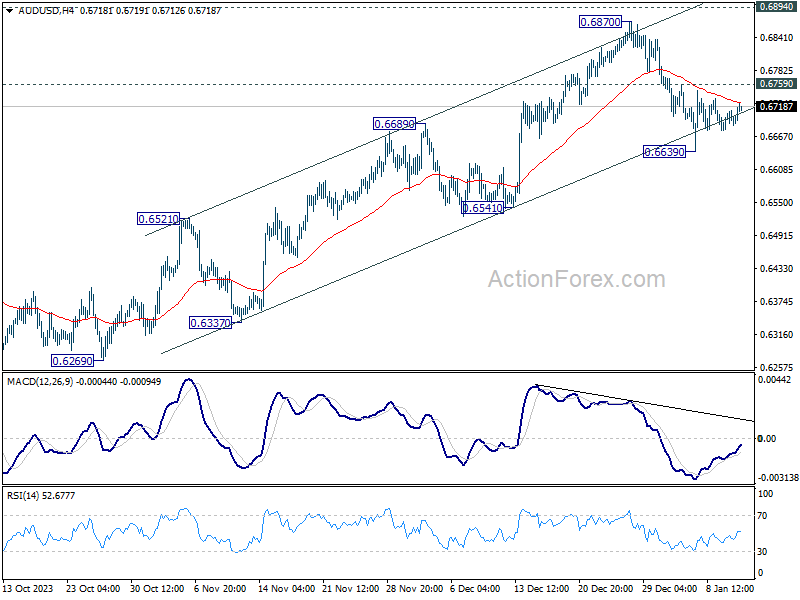
Intraday bias in AUD/USD remains neutral and outlook is unchanged. On the downside, break of 0.6639 will resume the fall from 0.6870 short term top to 0.6541 support next. On the upside, though, break of 0.6759 minor resistance will suggest that the pull back has completed already. Intraday bias will be turned back to the upside for 0.6870 resistance.
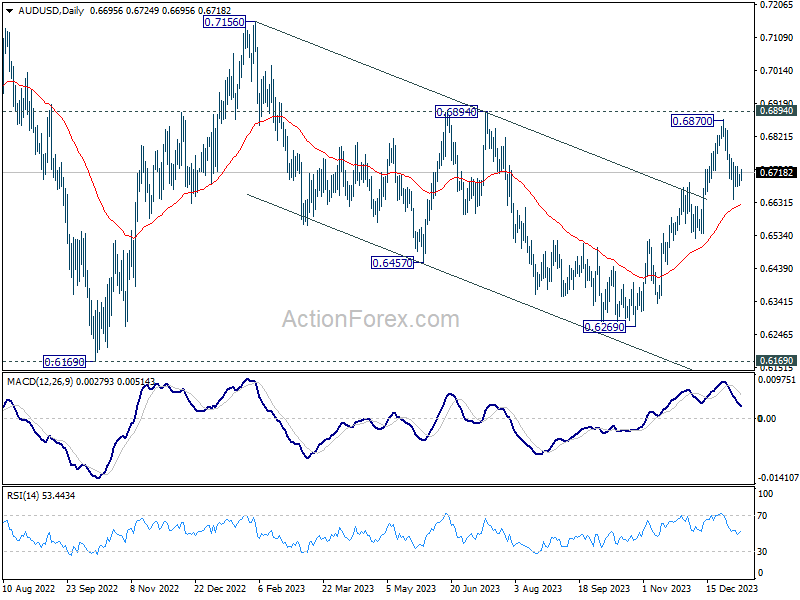
In the bigger picture, price actions from 0.6169 (2022 low) could be just a medium term corrective pattern to the down trend from 0.8006 (2021 high). Rise from 0.6269 is seen as the third leg of the pattern that could target 0.7156 on break of 0.6894 resistance. For now, range trading should be seen between 0.6169 and 0.7156 (2023 high), until further developments.
USD/JPY Daily Outlook
Daily Pivots: (S1) 144.78; (P) 145.31; (R1) 146.29; More...
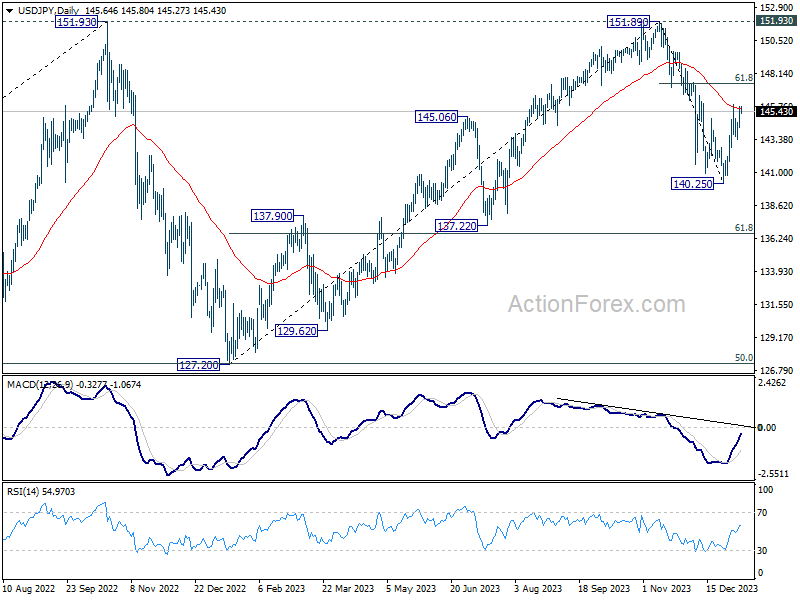
Range trading continues in USD/JPY below 145.97 and intraday bias remains neutral. On the upside, above 145.97 will resume the rebound from 140.25. But upside should be limited by 61.8% retracement of 151.89 to 140.25 at 147.44. On the downside, below 143.17 minor support will turn bias back to the downside for retesting 140.25 low.
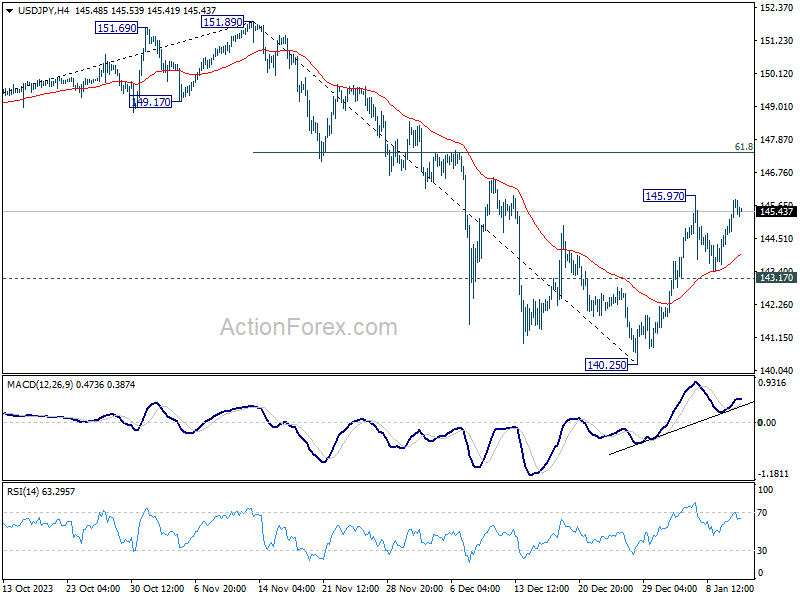
In the bigger picture, for now, fall from 151.89 is still seen as the third leg of the corrective pattern from 151.89. Another decline through 140.25 will target 61.8% retracement of 127.20 to 151.89 at 136.63. Sustained break there will pave the way to 127.20 support (2022 low). However, firm break of 147.44 fibonacci resistance will dampen this view and bring retest of 151.89 instead.
USD/CHF Daily Outlook
Daily Pivots: (S1) 0.8498; (P) 0.8518; (R1) 0.8528; More....
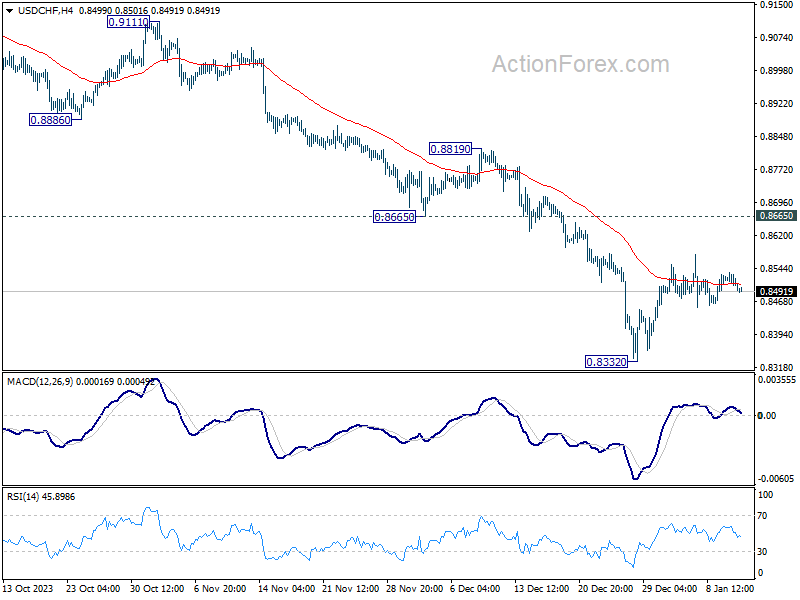
USD/CHF is still extending the consolidation from 0.8332 and intraday bias remains neutral. Stronger recovery cannot be ruled out. But outlook will stay bearish as long as 0.8665 support turned resistance holds. On the downside, break of 0.8332 will resume larger fall from 0.9243 to 0.8257 projection level.
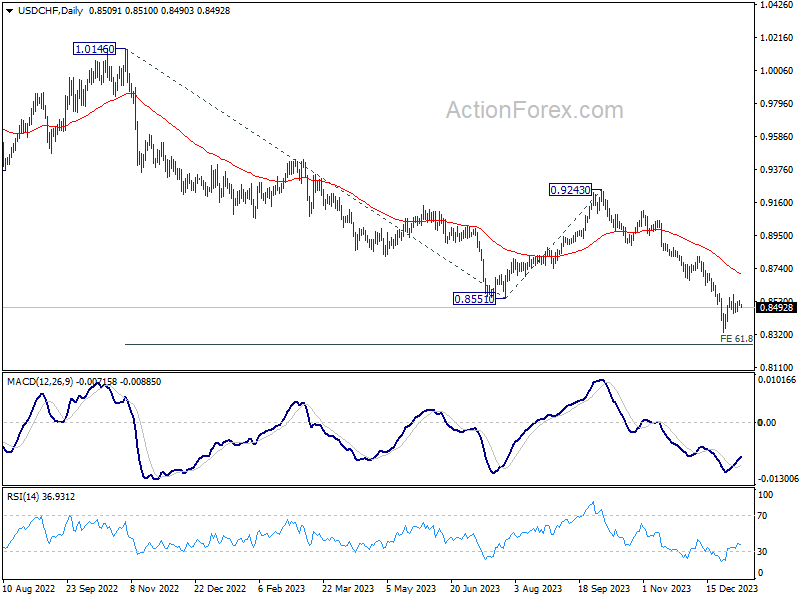
In the bigger picture, the down trend from 1.0146 (2022 high) is in progress. Next target is 61.8% retracement of 1.0146 to 0.8551 from 0.9243 at 0.8257. Sustained break there could prompt downside acceleration to 100% projection at 0.7648. This will now remain the favored case as long as 0.8819 resistance holds.
GBP/USD Daily Outlook
Daily Pivots: (S1) 1.2704; (P) 1.2724; (R1) 1.2762; More...
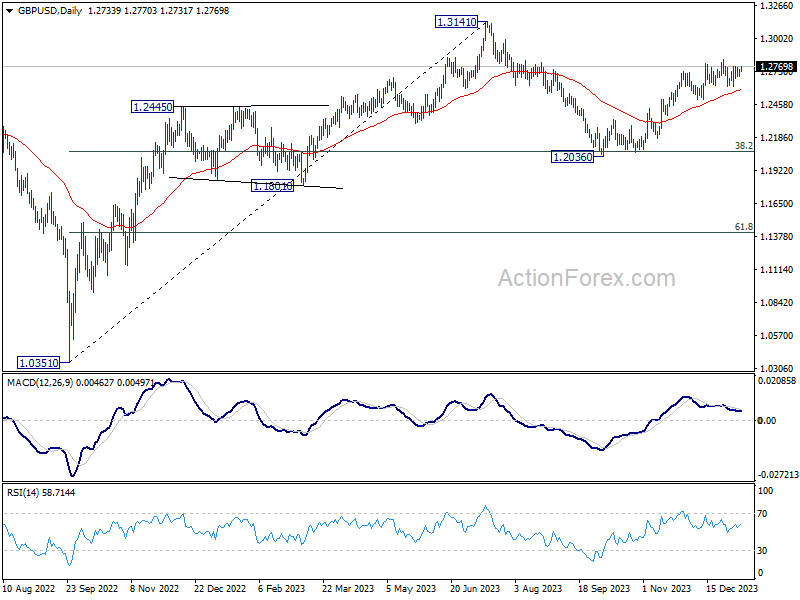
Intraday bias in GBP/USD remains neutral as range trading is still in progress. On the upside, decisive break of 1.2826 high will resume whole rally from 1.2036. Nevertheless, break of 1.2611 will bring deeper correction to 1.2499 support instead.
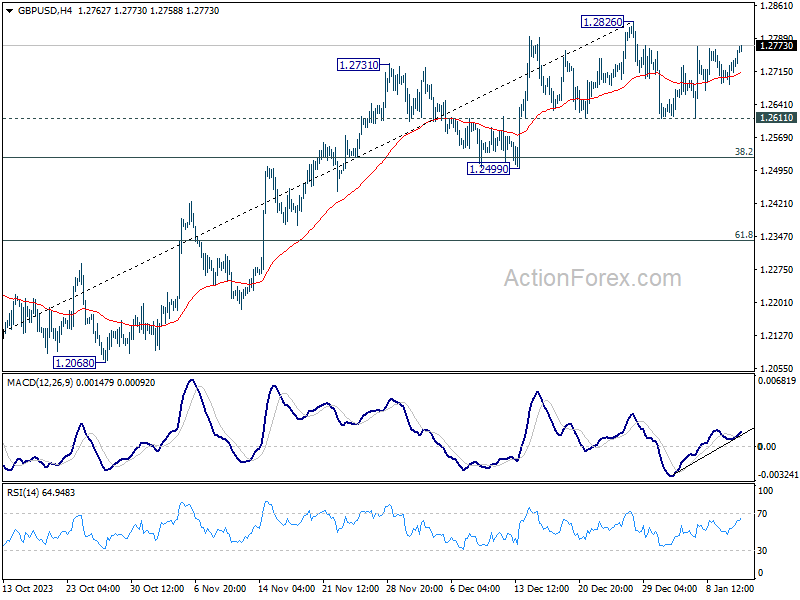
In the bigger picture, price actions from 1.3141 medium term top are seen as a corrective pattern to up trend from 1.0351 (2022 low). Rise from 1.2036 is seen as the second leg that's in progress. Upside should be limited by 1.3141 to bring the third leg of the pattern. Meanwhile, break of 1.2499 support will argue that the third leg has already started for 38.2% retracement of 1.0351 (2022 low) to 1.3141 at 1.2075 again.