

Sample Category Title
USD/JPY Mid-Day Outlook
Daily Pivots: (S1) 141.31; (P) 142.08; (R1) 142.61; More...
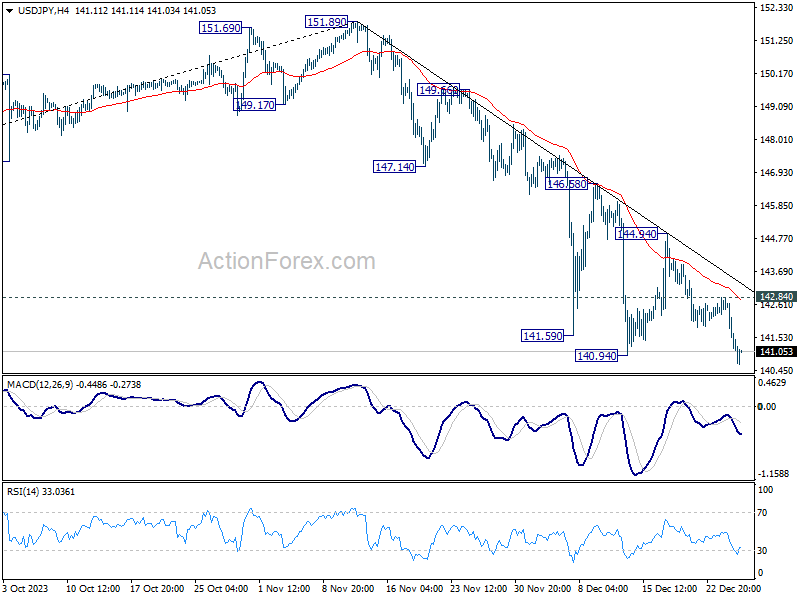
USD/JPY's break of 140.94 indicates resumption of fall from 151.89. Intraday bias is now on the downside. Next target is 136.63. fibonacci level. On the upside, above 142.84 minor resistance will turn intraday bias neutral gain. But recovery should be limited below 144.94 resistance to bring another decline.
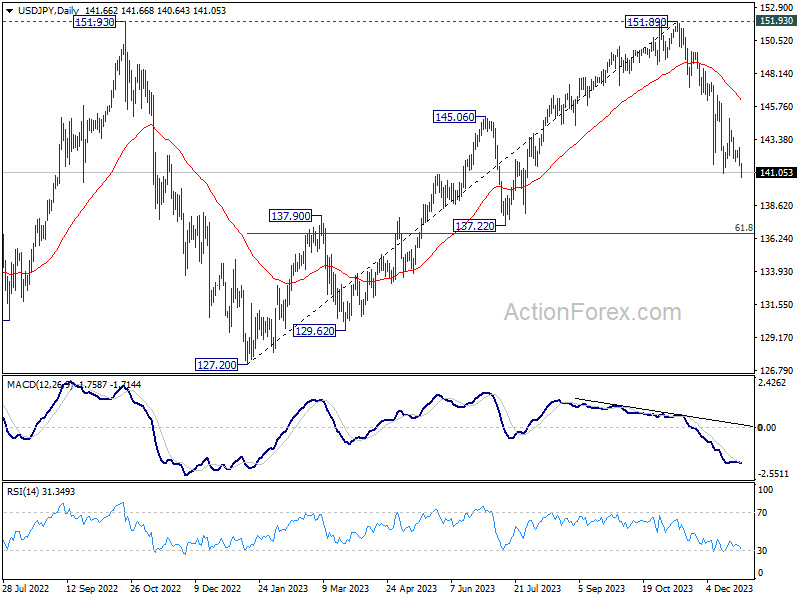
In the bigger picture, fall from 151.89 is seen as the third leg of the corrective pattern from 151.93 (2022 high). Deeper decline would be seen to 61.8% retracement of 127.20 to 151.89 at 136.63, sustained break there will pave the way to 127.20 support (2022 low). This will now remain the favored as long as 146.58 resistance holds.
Yen and Swiss Franc Rally in Subdued Markets; Downside Acceleration in GBP/CHF
Japanese Yen and Swiss Franc are standing out with significant rallies in otherwise relatively subdued markets today. Yen resumed its near-term rise against the Dollar, reaching its highest level in five months. Simultaneously, Swiss Franc has achieved its highest level in over a decade, excluding the spike seen in 2015.
While Dollar remains the weakest performer for the week, its selloff against currencies like the Sterling, Canadian Dollar, and Australian Dollar appears to be decelerating slightly. Euro remains firm, although it's underperforming against Yen and Franc. But the Sterling is noticeably underperforming compared to its European peers.
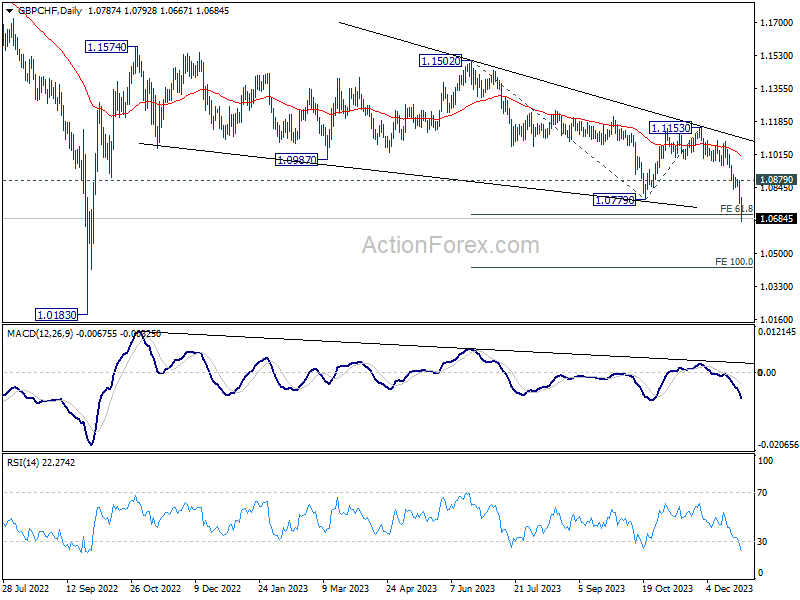
Technically, GBP/CHF's decline accelerates further to as low as 1.0667 so far. 61.8% projection of 1.1502 to 1.0779 from 1.1153 at 1.0706 is take out. Near term outlook will stay bearish as long as 1.0879 resistance holds. Next target is 100% projection at 1.0430.
In Europe, at the time of writing, FTSE is up 0.05%. DAX is down -0.19%. CAC is down -0.41%. Germany 10-year yield is up 0.035 at 1.931. UK 10-year yield is up 0.062 at 3.497. Earlier in Asia, Nikkei fell -0.42%. Hong Kong HSI rose 2.52%. China Shanghai SSE rose 1.38%. Singapore Strait Times rose 1.38%. Japan 10-year JGB yield fell -0.0056 to 0.593.
US initial jobless claims rises to 218k, vs exp 204k
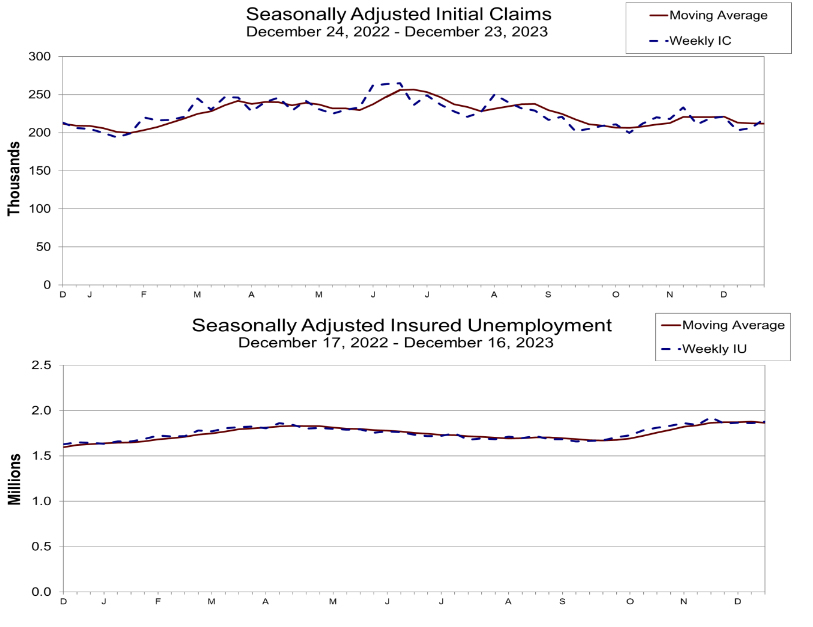
US initial jobless claims rose 12k to 218k in the week ending December 23, above expectation of 204k. Four-week moving average of initial claims fell -250 to 212k.
Continuing claims rose 14k to 1875k in the week ending December 16. Four-week moving average of continuing claims fell -12.5k to 1865k.
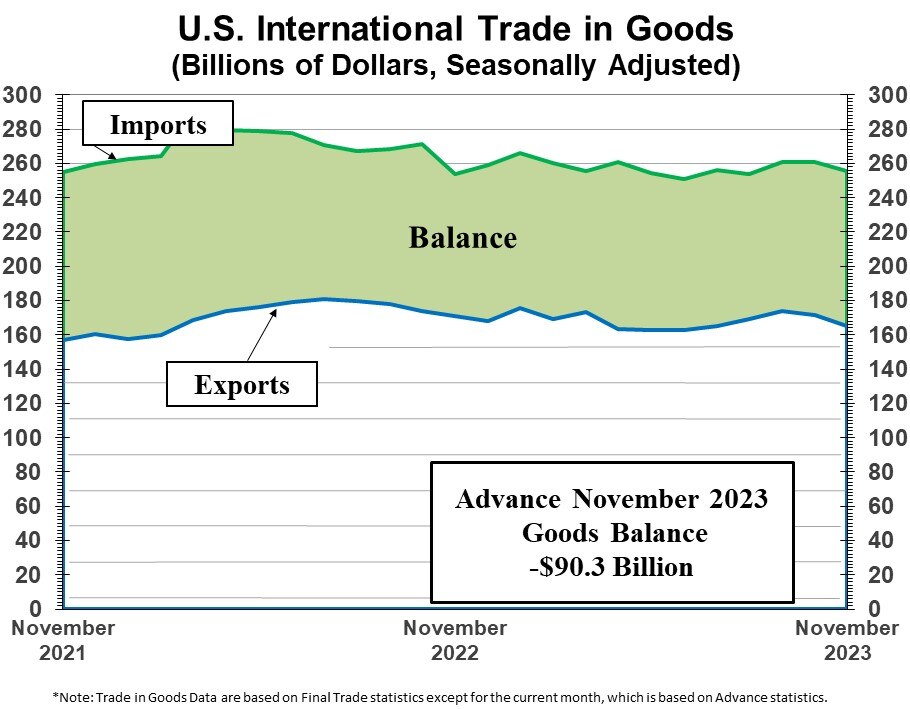
US goods trade deficit widens slightly to USD -90.3B in Nov
US goods export fell -3.6% mom to USD 165.1B in November. Goods imports fell -2.1% mom to USD 255.4B. Goods trade deficit widened from USD -89.6B to USD -90.3B, slightly larger than expectation of USD -89.5B.
Wholesale inventories fell -0.2% mom to USD 895.7B. Retail inventories fell -0.1% mom to USD 794.9B.
ECB's Holzmann cautions against expectations of 2024 rate cuts
ECB Governing Council member Robert Holzmann emphasized there should be no presumption of rate reductions in the coming year.
Holzmann stated, "Even if the ECB is past an unprecedented series of ten consecutive rate increases, there is also for the year 2024 no guarantee of rate reductions."
Further reinforcing this cautious approach, Holzmann remarked on the current status of inflation and the ECB's policy measures, "Monetary policy normalization is already showing its impact on slowing inflation, but it would still be premature to think about rate cuts."
Japan's industrial production down -0.9% mom, continues to seesaw indecisively
Japan's industrial production fell -0.9% mom in November, marking the first decrease in three months. This drop, however, was less severe than the expected -1.6% mom decline. A notable factor in the contraction was -2.5% mom fall in motor vehicle production. Among the 15 sectors surveyed, 11 reported decreased production, while four sectors experienced increases.
Index of industrial shipments also dropped by -1.3% mom, aligning with overall decline in industrial production. Conversely, Index of inventories saw a marginal increase of 0.1% mom.
The Ministry of Economy, Trade and Industry maintained its assessment of industrial output as "fluctuating indecisively." Looking ahead, manufacturers expect a rebound in output by 6.0% mom in December, followed by -7.2% mom decrease in January 2023.
An METI official said, "We'll continue to monitor the impact of the global economic downturn and rising prices".
In separate release, retail sales data painted a more positive picture. Sales in November rose 5.3% yoy, exceeding forecast of 5.0% yoy, and marked the 21st consecutive month of expansion since March 2022. On a month-on-month basis, retail sales grew 1.0%, following 1.7% growth in October.
USD/JPY Mid-Day Outlook
Daily Pivots: (S1) 141.31; (P) 142.08; (R1) 142.61; More...
USD/JPY's break of 140.94 indicates resumption of fall from 151.89. Intraday bias is now on the downside. Next target is 136.63. fibonacci level. On the upside, above 142.84 minor resistance will turn intraday bias neutral gain. But recovery should be limited below 144.94 resistance to bring another decline.
In the bigger picture, fall from 151.89 is seen as the third leg of the corrective pattern from 151.93 (2022 high). Deeper decline would be seen to 61.8% retracement of 127.20 to 151.89 at 136.63, sustained break there will pave the way to 127.20 support (2022 low). This will now remain the favored as long as 146.58 resistance holds.
Economic Indicators Update
| GMT | Ccy | Events | Actual | Forecast | Previous | Revised |
|---|---|---|---|---|---|---|
| 23:50 | JPY | Industrial Production M/M Nov P | -0.90% | -1.60% | 1.30% | |
| 23:50 | JPY | Retail Trade Y/Y Nov | 5.30% | 5.00% | 4.20% | 4.10% |
| 13:30 | USD | Initial Jobless Claims (Dec 22) | 218K | 204K | 205K | 206K |
| 13:30 | USD | Goods Trade Balance (USD) Nov P | -90.3B | -89.5B | -89.6B | |
| 13:30 | USD | Wholesale Inventories Nov P | -0.20% | -0.20% | -0.40% | |
| 15:00 | USD | Pending Home Sales M/M Nov | 1.10% | -1.50% | ||
| 15:30 | USD | Natural Gas Storage | -80B | -87B | ||
| 15:30 | USD | Crude Oil Inventories | -2.7M | 2.9M |
US initial jobless claims rises to 218k, vs exp 204k
US initial jobless claims rose 12k to 218k in the week ending December 23, above expectation of 204k. Four-week moving average of initial claims fell -250 to 212k.
Continuing claims rose 14k to 1875k in the week ending December 16. Four-week moving average of continuing claims fell -12.5k to 1865k.
US goods trade deficit widens slightly to USD -90.3B in Nov
US goods export fell -3.6% mom to USD 165.1B in November. Goods imports fell -2.1% mom to USD 255.4B. Goods trade deficit widened from USD -89.6B to USD -90.3B, slightly larger than expectation of USD -89.5B.
Wholesale inventories fell -0.2% mom to USD 895.7B. Retail inventories fell -0.1% mom to USD 794.9B.
AUD/USD Eyes Chinese PMIs
- China releases PMIs on Saturday
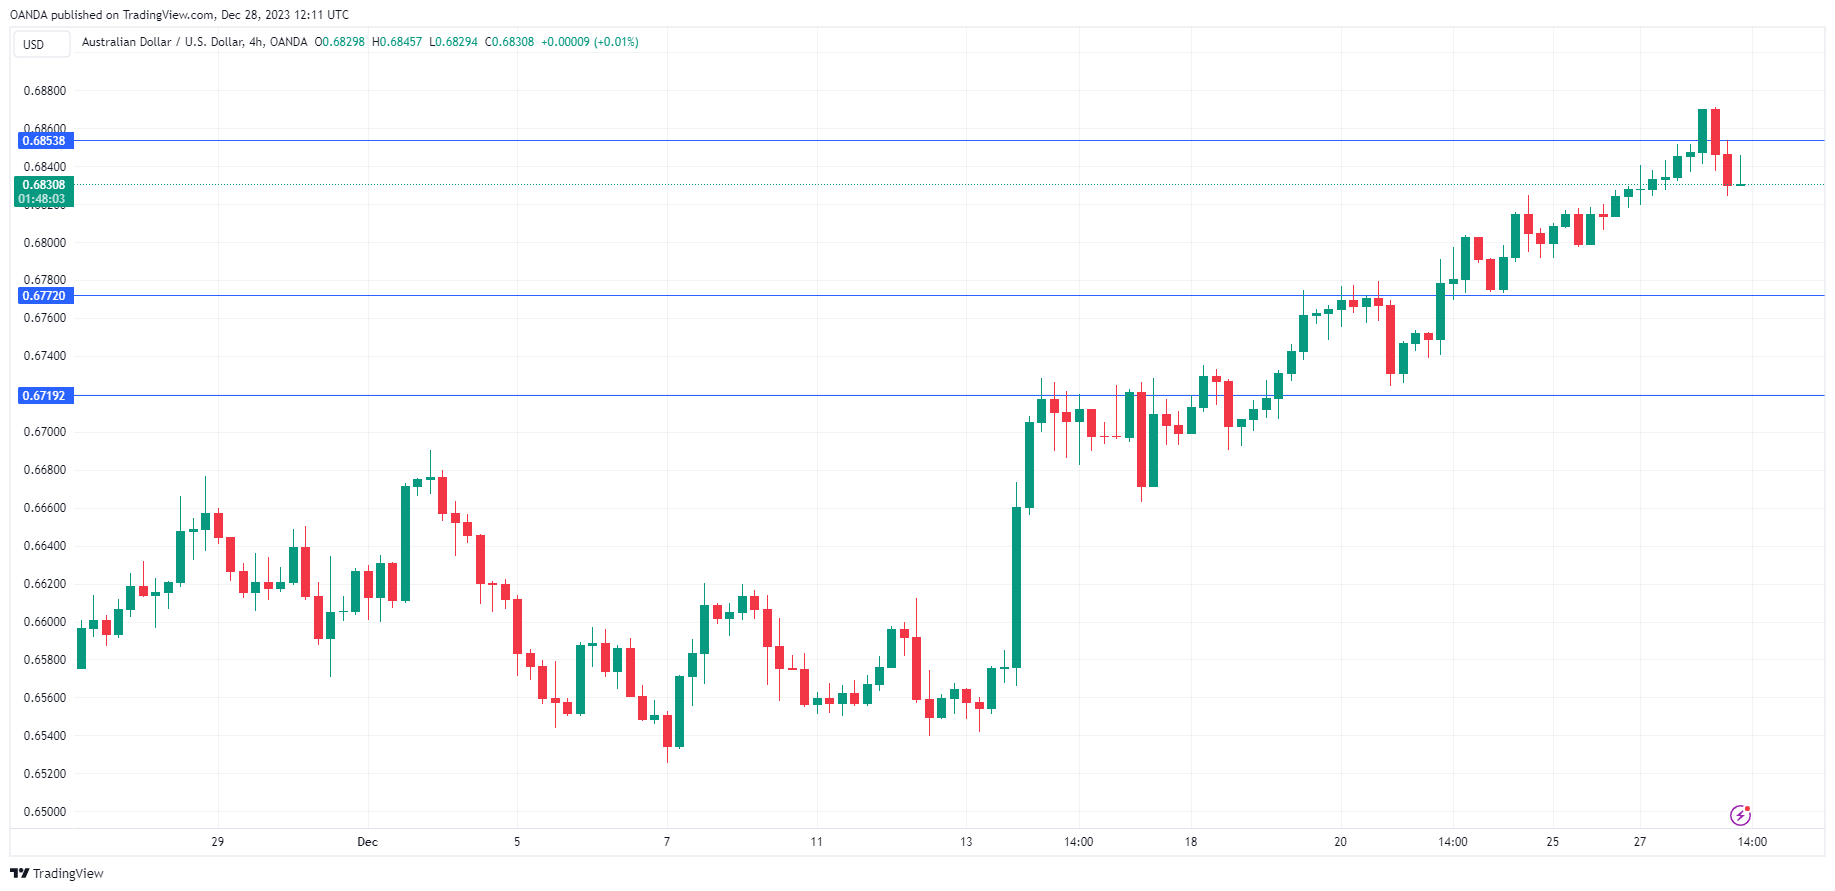
The Australian dollar has edged lower on Thursday. In the European session, AUD/USD is trading at 0.6833, down 0.21%. Earlier today, the Aussie climbed as high as 0.6871, its highest level since July.
Risk appetite rise boosts Aussie
The US dollar has hit rough times and the Australian dollar has taken full advantage, surging 7.8% since November 1st. The US dollar has fallen sharply against the other major currencies over the past two months, as the markets expect the Federal Reserve to cut interest rates up to six times next year. Fed members have cautioned that the market is getting ahead of itself but don’t expect markets to dampen expectations after Fed Chair Powell pencilled in three rate cuts in 2024 at the December meeting.
There are no Australian events this week but the risk-on mood in the financial markets has boosted the Australian dollar, which is headed for a third straight winning week. Investors will be keeping an eye on Chinese PMIs which will be released on Saturday. China’s recovery has been patchy and the slowdown has resulted in deflation in the world’s number two economy. The manufacturing sector has been mired in contraction for most of this year and non-manufacturing expansion has been steadily falling and has stagnated over the past two months.
The PMI releases could have a strong impact on the direction of the Australian dollar early next week, as China is Australia’s largest export market. If the PMIs are stronger than expected, the Aussie could get a lift. Conversely, a weak PMI report would likely weigh on the Australian dollar.
The US labour market has remained strong despite the Federal Reserve’s steep rate-tightening cycle. Unemployment claims will be released later today, with a market consensus of 205,000, compared to last week’s reading of 210,000. The Fed is under pressure to lower interest rates early in 2024 but the robust labour market is complicating such a move, as jobs remain plentiful and workers are spending which is helping keep inflation high.
AUD/USD Technical
- AUD/USD tested resistance at 0.6853 earlier. Next, there is resistance at 0.6906
- 0.6772 and 0.6719 are providing support
ECB’s Holzmann cautions against expectations of 2024 rate cuts
ECB Governing Council member Robert Holzmann emphasized there should be no presumption of rate reductions in the coming year.
Holzmann stated, "Even if the ECB is past an unprecedented series of ten consecutive rate increases, there is also for the year 2024 no guarantee of rate reductions."
Further reinforcing this cautious approach, Holzmann remarked on the current status of inflation and the ECB's policy measures, "Monetary policy normalization is already showing its impact on slowing inflation, but it would still be premature to think about rate cuts."
Japanese Yen Keeps on Rolling
- Japanese retail sales climb but industrial production declines
- Japanese gain rises sharply
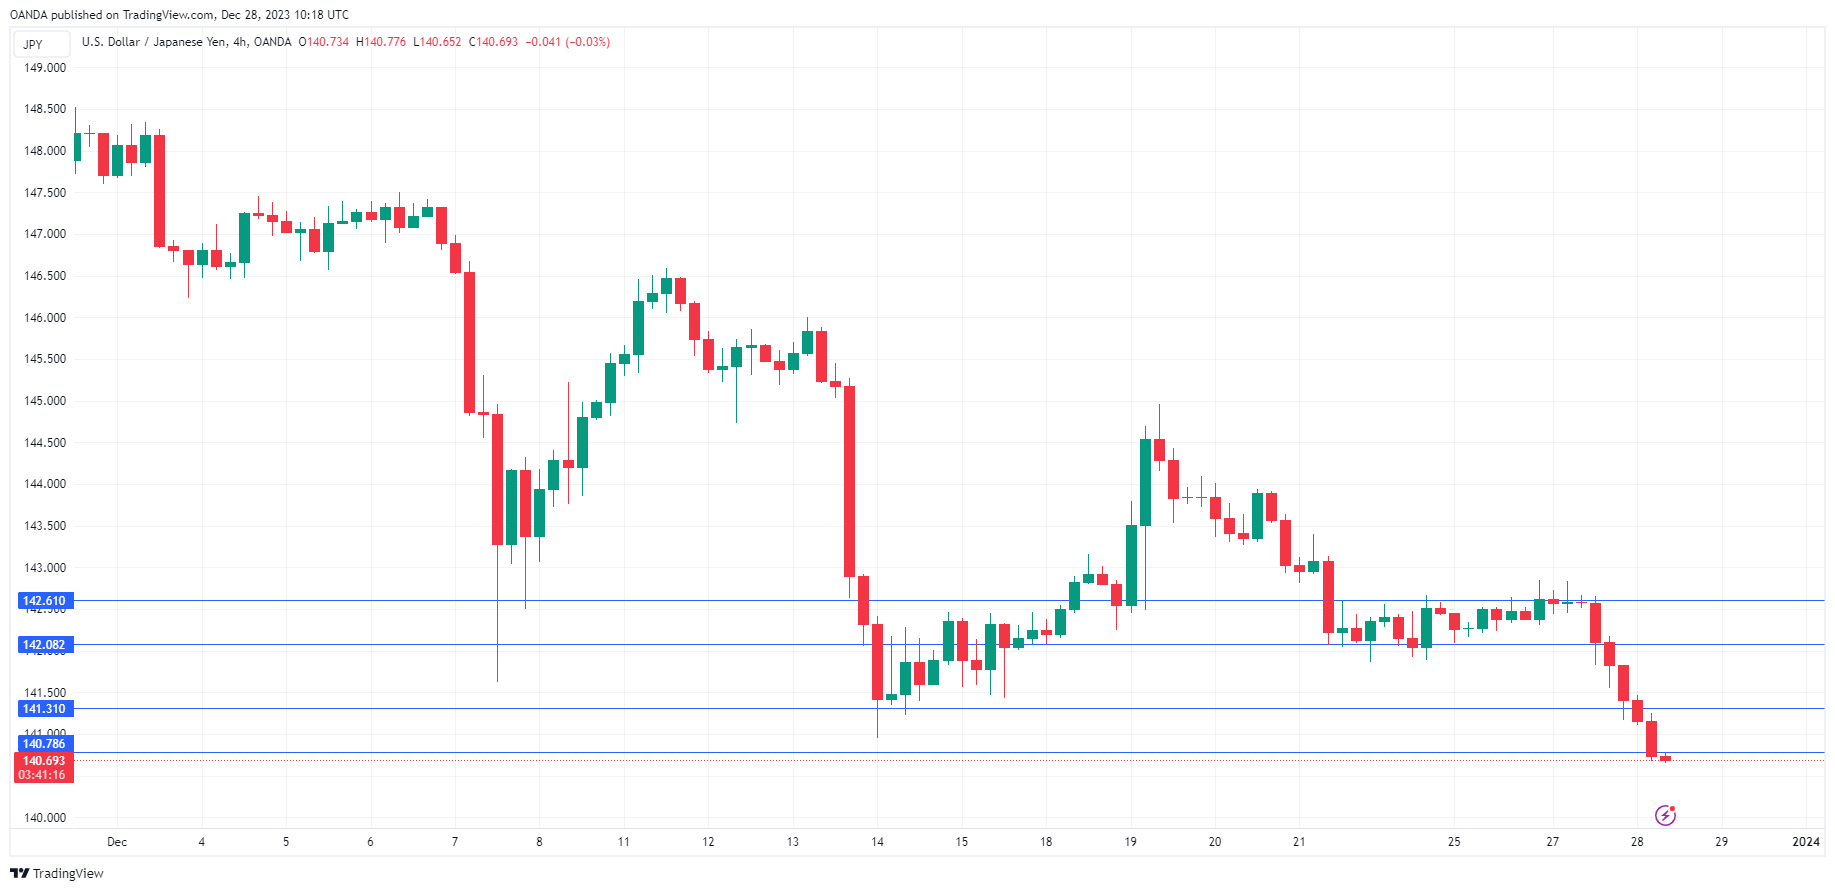
The Japanese yen has posted sharp gains on Thursday. In the European session, USD/JPY is trading at 140.66, down 0.82%.
Japanese retail sales beat forecast
Japanese releases were a mixed bag today. Retail sales impressed with a gain of 5.3% y/y in November, following a downwardly revised 4.1% gain in October and beating the market consensus of 5.0%. Monthly, retail sales climbed 1%, rebounding from a 1.6% decline in October.
The news was not as cheery on the manufacturing front, as Industrial Production declined by 0.9% m/m in November, compared to a 1.3% gain in October. Still, this was above the market consensus of -1.6%.
The mixed data is indicative of an uneven recovery. Consumer spending is solid and the service sector is expanding, while manufacturing is mired in a slump.
There has been feverish speculation that the Bank of Japan will exit its ultra-loose policy, but the BoJ will want to see stronger growth before making any dramatic shifts, which could include lifting rates into positive territory. The markets have circled January and April has strong possibilities for a move, but I would lean towards April, as the annual wage negotiations in March will help determine if inflation is sustainable. Let’s not forget that the BoJ has caught the markets off guard in the past with changes to policy and a move at the January meeting cannot be completely discounted.
In the US, the Federal Reserve has all but declared that the rate-tightening cycle is over. Fed Chair Jerome Powell has jumped on the rate-cutting bandwagon and has signalled that the Fed expects to trim rates three times in 2024. The markets are more bullish and have priced in six rates, starting as early as March. This has led some Fed members to caution that the markets are getting ahead of themselves and that rate cuts are not necessarily imminent..
USD/JPY Technical
- USD/JPY has pushed below support at 141.38 and is testing support at 140.78. The next support level is 140.01
- There is resistance at 142.08 and 142.61
AUDUSD Extends Recovery; Crucial Double Top in Sight
- AUDUSD hits a fresh five-month peak on Thursday
- But oscillators have been in overbought levels for several sessions
- Can the rally resume or are we heading for a pullback?
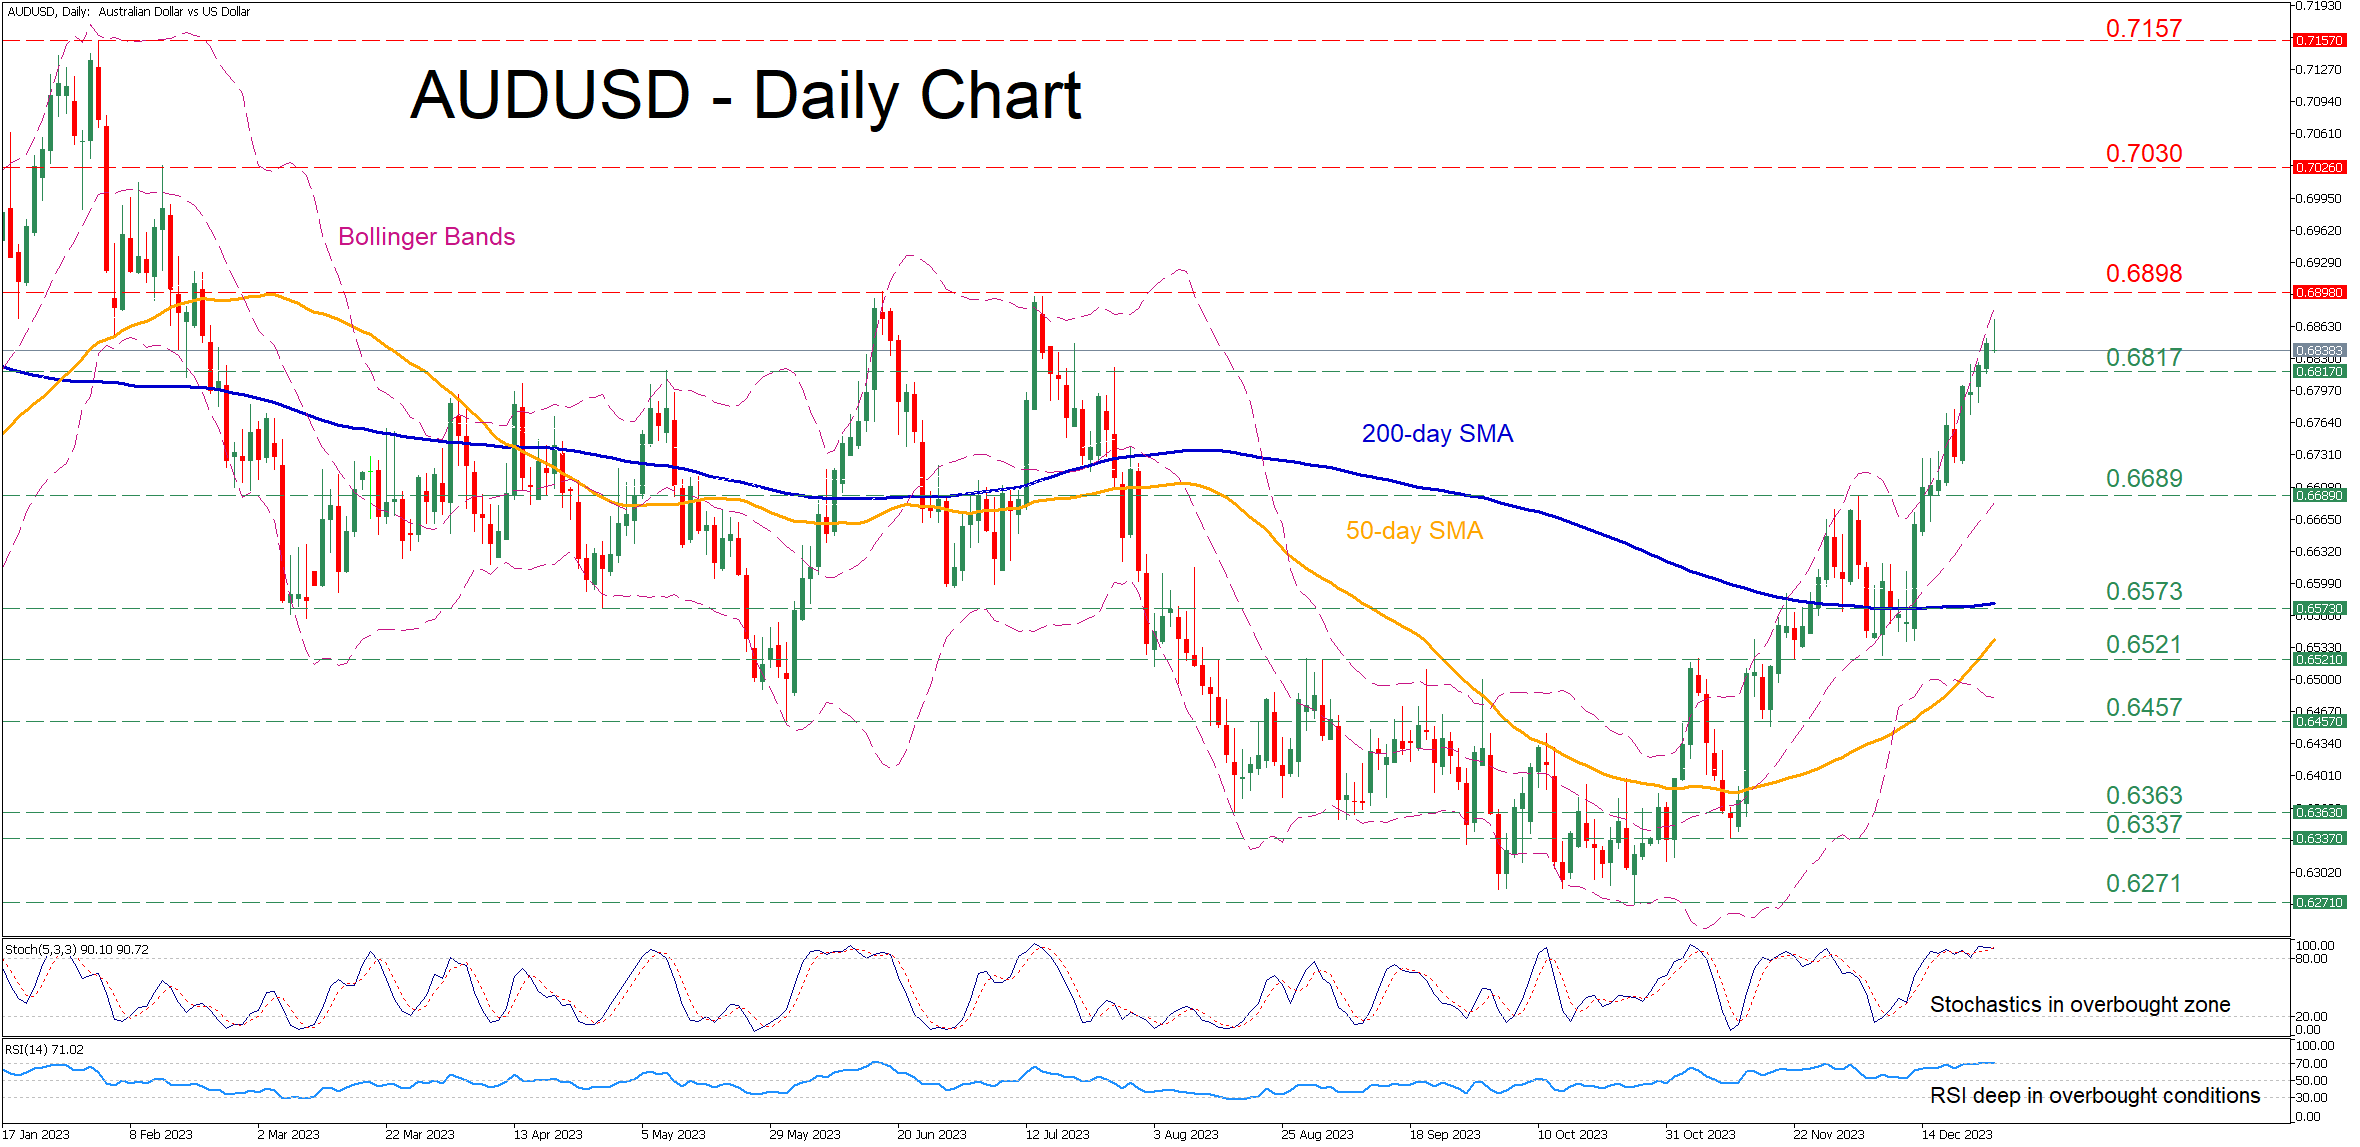
AUDUSD has been staging a solid recovery following its 2023 bottom of 0.6271 in October, generating a clear structure of consecutive higher highs. However, the risk of an impending correction is more than evident as both the RSI and stochastics have been within their overbought areas for the past few sessions.
If the pair manages to resume its short-term uptrend, immediate resistance could be found at the double top of 0.6898 registered this summer. Jumping above that zone, the price might encounter strong resistance at 0.7030. Should that barricade also fail, the spotlight could turn to the 2023 peak of 0.7157.
On the flipside, in case of a pullback, the previous resistance of 0.6817 could now serve as initial support. A violation of that territory could open the door for the 0.6689 hurdle. Further retreats might then cease at the April support of 0.6573, which overlaps with the 200-day simple moving average (SMA).
Overall, AUDUSD has been in a recovery mode for the past few months, but the short-term oscillators are starting to warn of an overstretched advance. Meanwhile, the ascending 50-day SMA is closing the gap with the 200-day SMA, where a potential golden cross could add more fuel to the short-term rally.
Gold Enjoys Another Rally
- Gold edges higher, surpasses 2,075 level
- Festive period fueling gold rally amidst low liquidity
- Momentum indicators support the current move
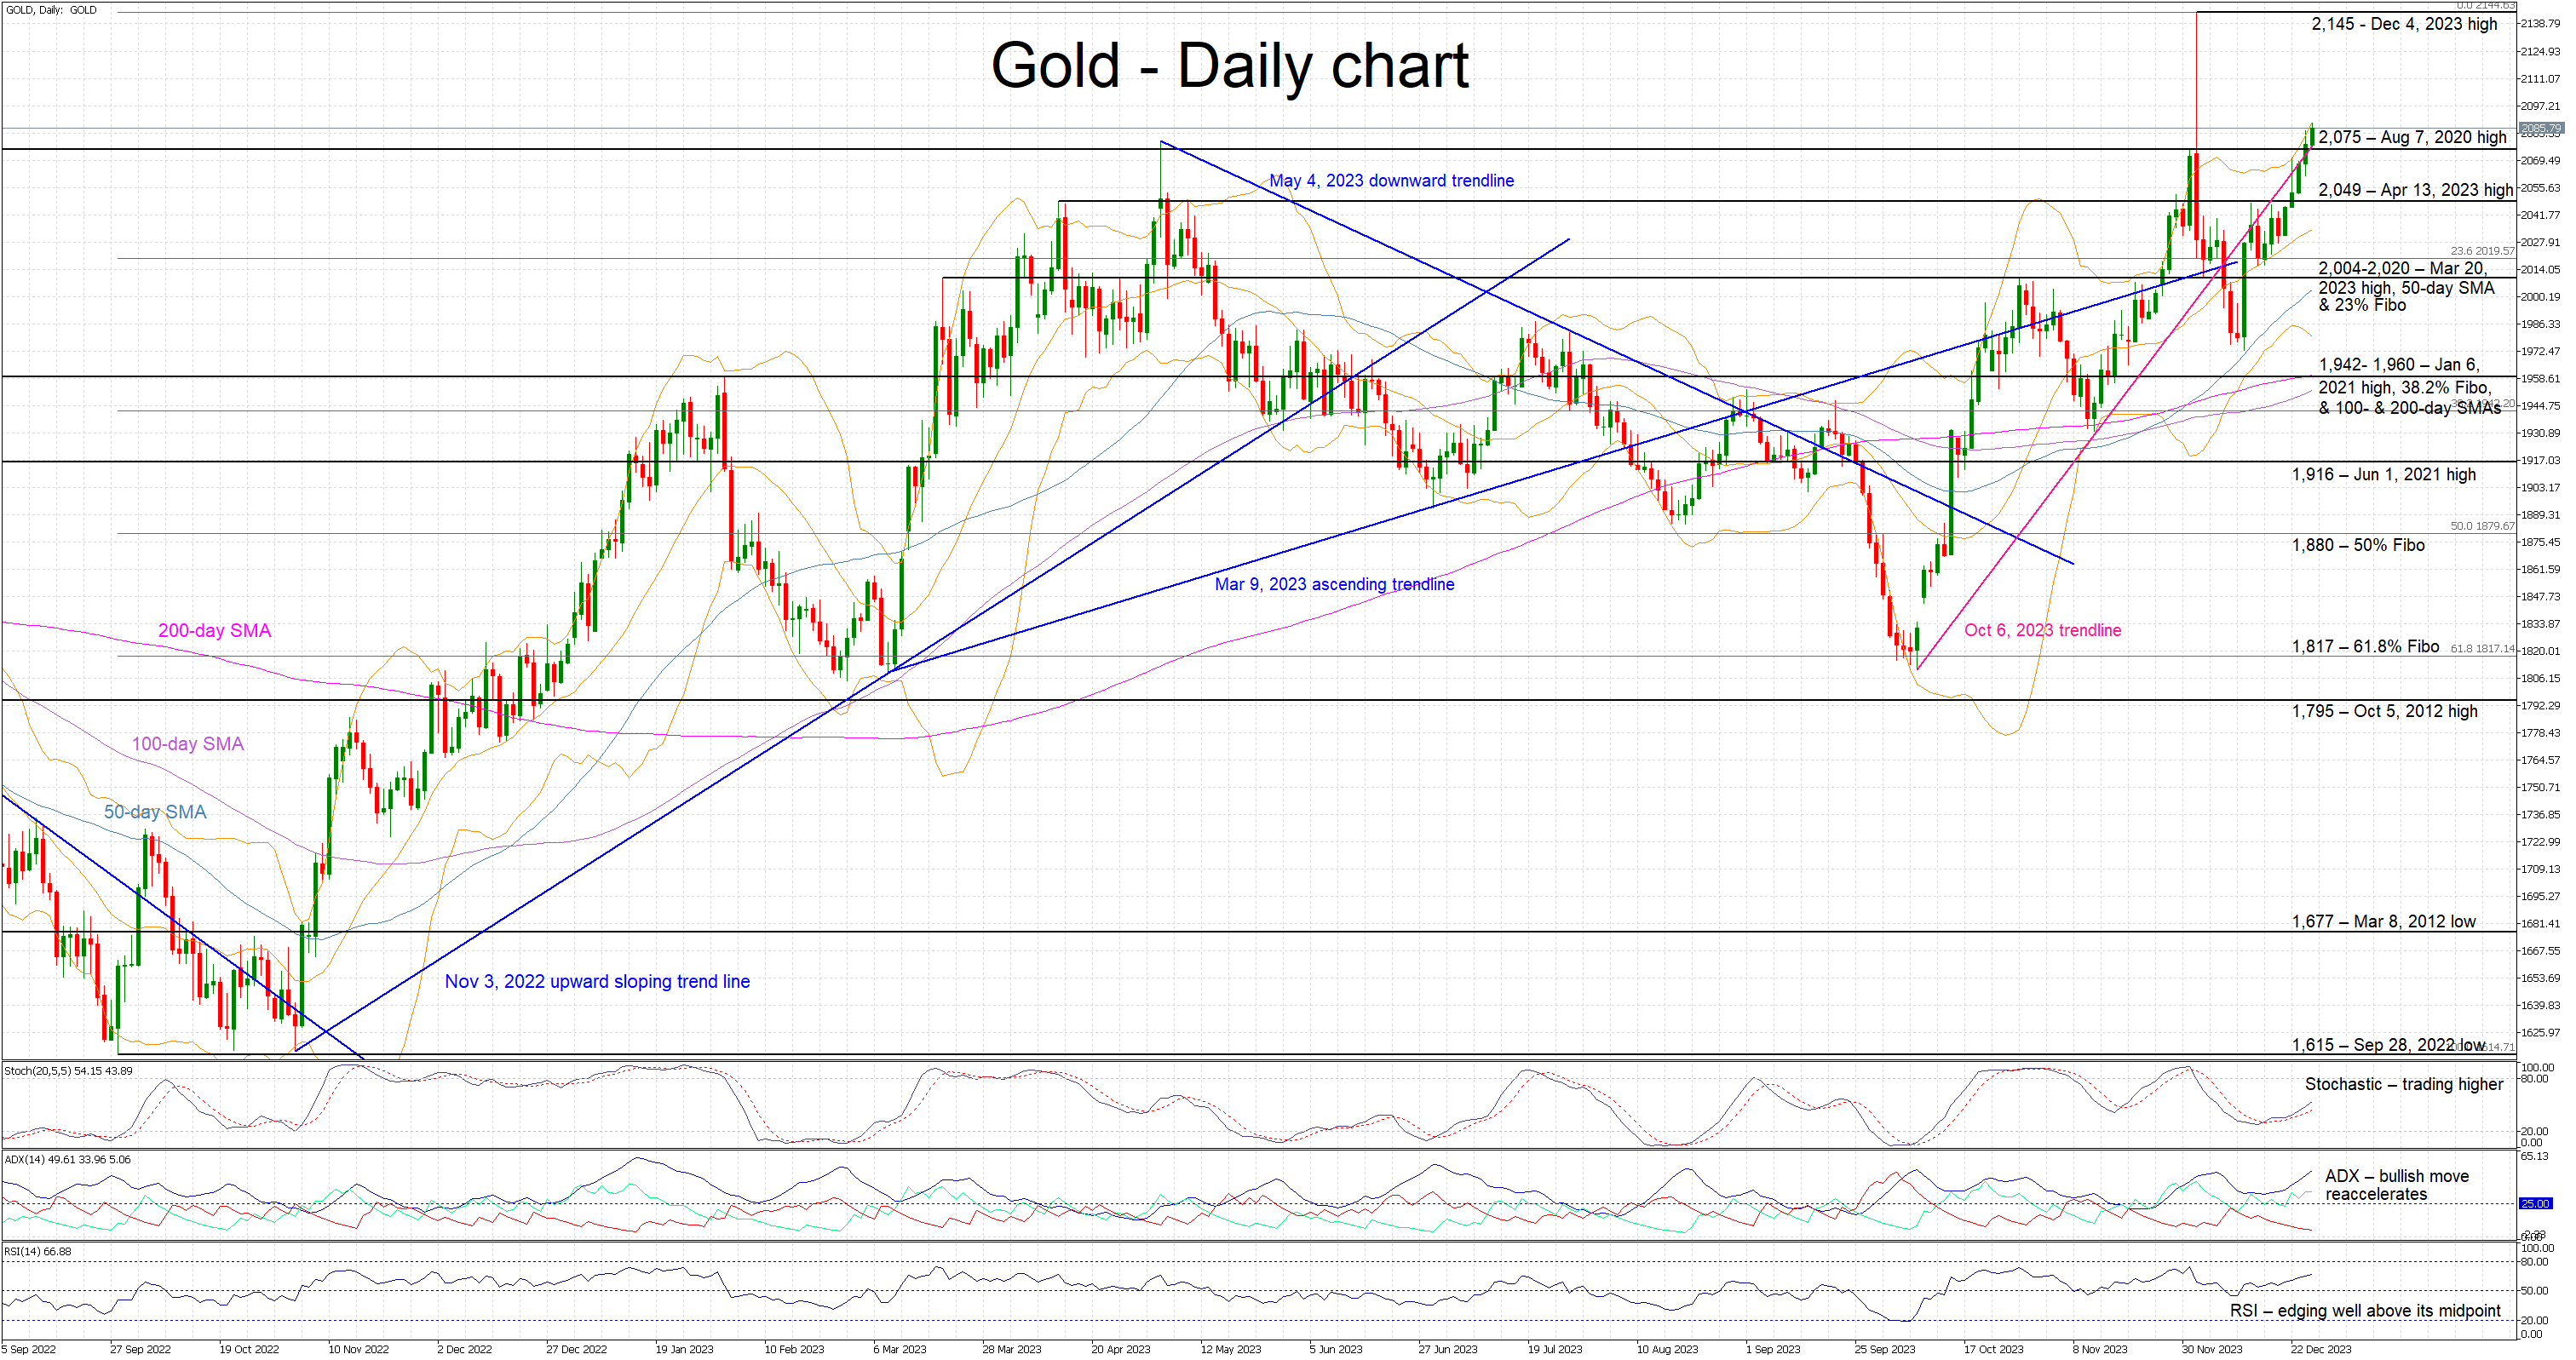
Gold is trading higher again today, recording the fifth consecutive green candle, as the low-liquidity festive period appears to be fueling demand for the precious metal. Gold is currently around 6% higher than the December 13 trough as it managed to surpass the 2,075 level and has returned above the October 6, 2023 trendline, after spending almost 20 days below it.
In the meantime, the momentum indicators are endorsing the current move higher. The RSI is rising towards its November highs, signaling an increasing bullish tendency in the market. Similarly, the Average Directional Movement Index (ADX) has made a higher high, confirming the strong bullish trend in gold. More importantly, the stochastic oscillator has crossed above its moving average (MA) and it is moving aggressively towards its overbought territory.
Should the bulls remain hungry, they could try to keep gold above the August 7, 2020 high of 2,075 and they then gradually stage a move, which might not be as straightforward as it sounds, towards the all-time high of 2,145.
On the flip side, the bears are keen to put a stop to the current upleg. They could try to defend the 2,075 level and then have a go at breaking below the April 13, 2023 high at 2,049. If successful, they could then push gold towards the busier 2,004-2,020, which is populated by the March 20, 2023 high, the 50-day simple moving average (SMA) and the 23.6% Fibonacci retracement of September 28, 2022 – December 4, 2023 uptrend.
To sum up, gold bulls remain in control of the market amidst a low liquidity period with the bears appearing unable, up to now, to react to the consecutive green candles.
ETH/USD Analysis: New Record of the Year
Today, the price of Ethereum exceeded the level of 2,440 per token, thereby setting a new high for 2023. It is noteworthy that the price of Bitcoin did not support the bullish sentiment, continuing to fluctuate around the USD 43,000 level for the fifth day.
What is the reason for the growth of ETH/USD from a fundamental point of view? There is no obvious trigger in the media, so we can only make assumptions:
→ market participants considered ETH an undervalued asset against the backdrop of the growth of Bitcoin and Solana;
→ perhaps buyers assume that after the expected approval of applications for the BTC ETF, the ETH ETF story will be next?
→ Santa's rally and the positive sentiment associated with it.
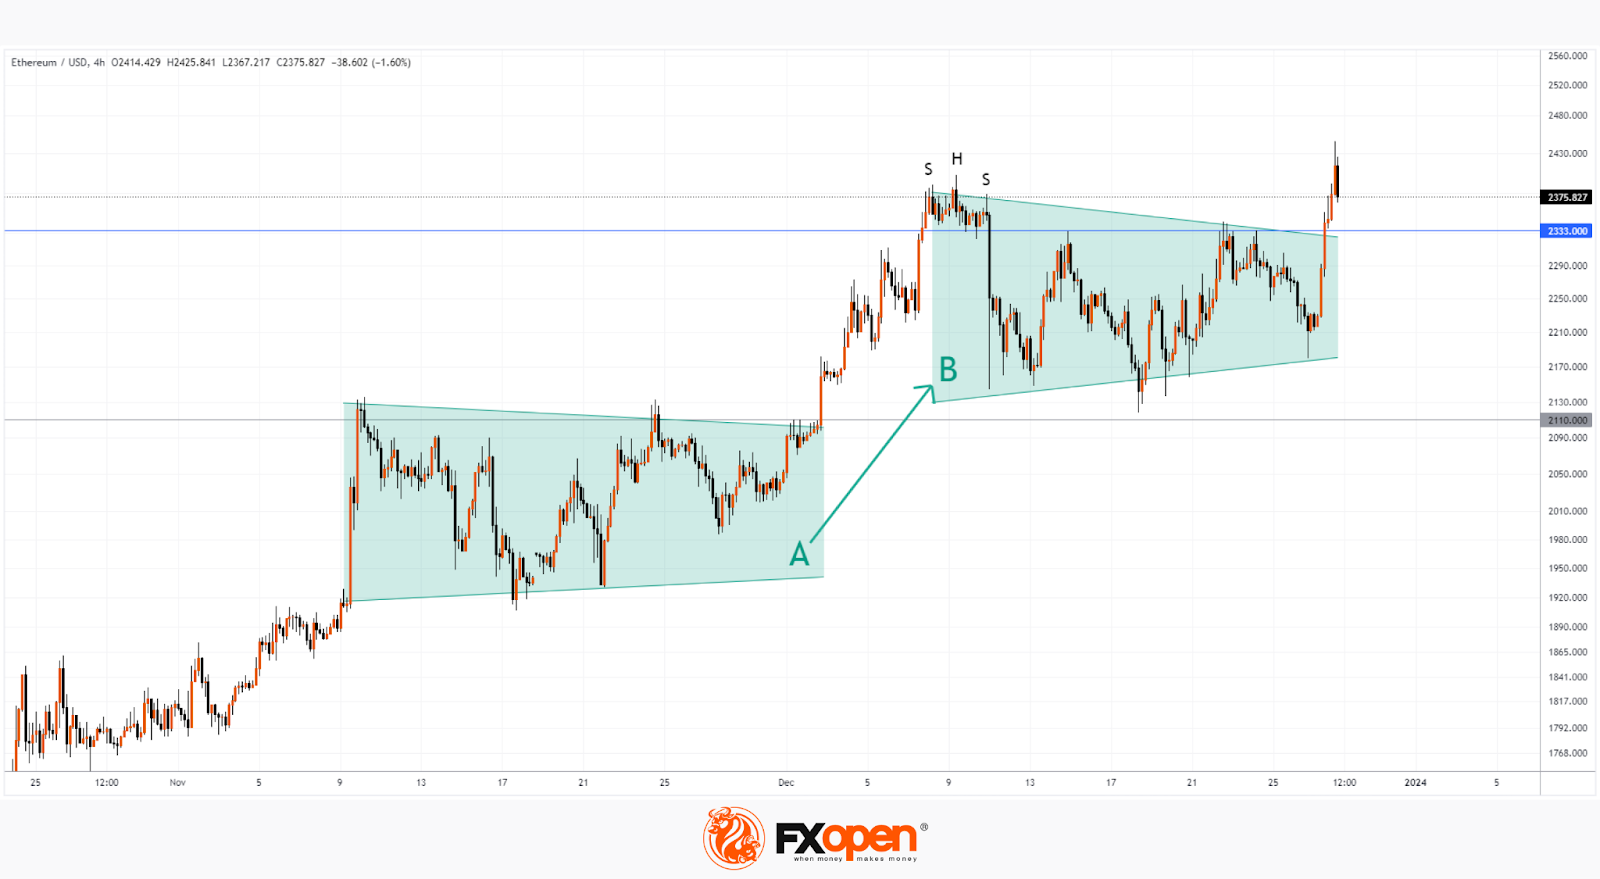
From a technical point of view, the price of ETH/USD moved up beyond the balance period “B”, where the forces of supply and demand were balanced. The bullish momentum was maintained, with upward momentum above the 2,333 level attracting followers and forcing short sellers to take losses. According to on-chain analytical platforms, in just one hour, at the peak of growth, USD 14 million of bearish positions were liquidated on cryptocurrency exchanges—there was a short squeeze in the market to some extent.
What's next? Will the price be able to form a new balance period “C”, which will be above the period “B” (similar to the trend “A” → “B”)?
This morning, on the 4-hour chart, a bearish engulfing pattern is forming, which may result in a false breakout of the previous top on December 9, when the SHS pattern was formed — this is not a very optimistic development of events.
However, as long as the price remains above the level of 2,333, there is reason to believe that the market is on the way to forming a balance “C”, which is above the balance “B” - similar to what happened with the level of 2,110. A bearish breakdown of the level of 2,333 and a return to the zone balance “B” will mean an alarming signal: buyers have lost strength, and therefore the next breakdown of balance “B” may occur in a downward direction.
This article represents the opinion of the Companies operating under the FXOpen brand only. It is not to be construed as an offer, solicitation, or recommendation with respect to products and services provided by the Companies operating under the FXOpen brand, nor is it to be considered financial advice.