Sample Category Title
GBP/JPY Daily Outlook
Daily Pivots: (S1) 180.70; (P) 182.02; (R1) 182.76; More...
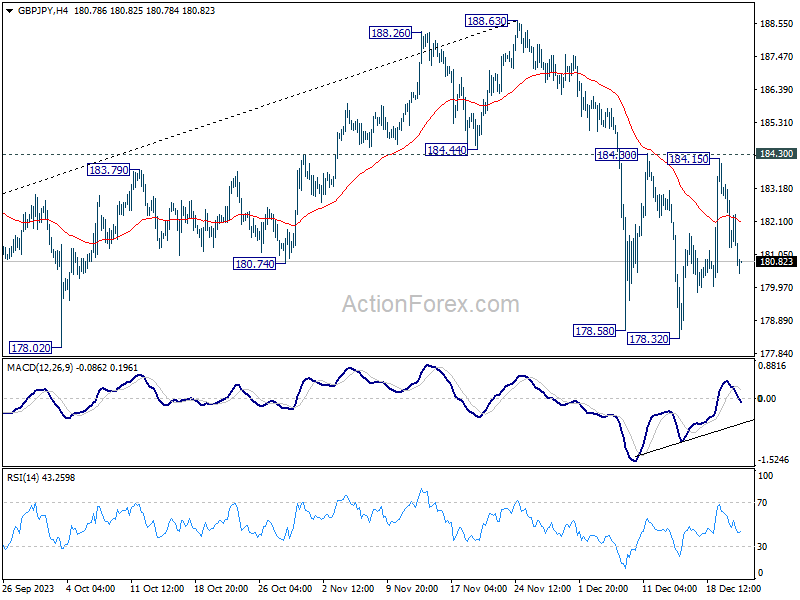
GBP/JPY's fall from 184.15 extends lower today but overall it's staying in range above 178.32. Intraday bias remains neutral and further decline is expected. On the downside, break of will resume the decline from 188.63 and target 38.2% retracement of 148.93 to 188.63 at 173.46. However, decisive break of 184.30 will argue that pull back from 188.63 has completed and bring retest of this high.
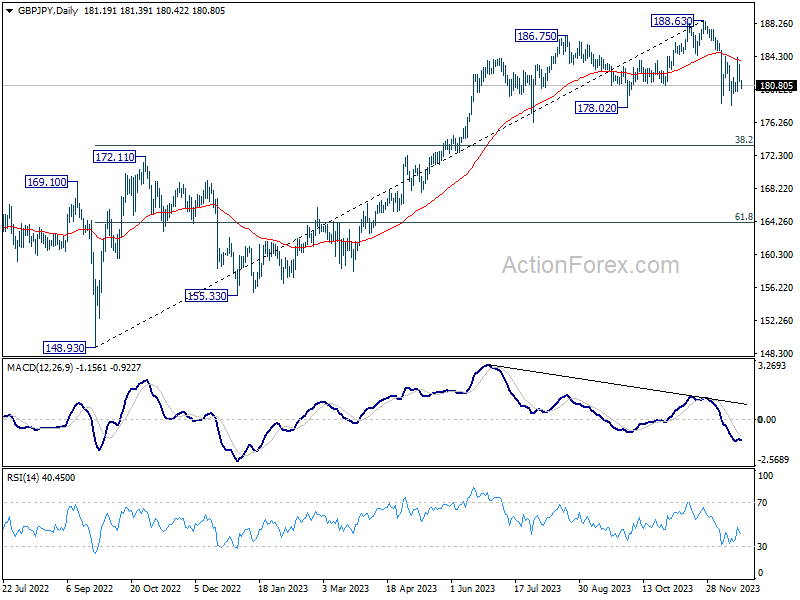
In the bigger picture, price actions from 188.63 medium term top are currently seen as a correction to the up trend from 148.93 (2022 low) only. As long as 172.11 resistance turned support holds, larger up trend from 123.94 (2020 low) is still in favor to resume through 188.63 at a later stage.
Yen Rebounds on Upgraded Growth Forecasts, Global Risk-On Sentiment Eases
Yen rebounds broadly in today's Asian trading session, buoyed by optimistic revisions in Japan's economic growth forecasts. The government, in its semi-annual economic report, upgraded its growth projections for both the current and next fiscal years. Forecast for fiscal 2023 was raised from 1.3% to 1.6%, while projection for fiscal 2024 saw an increase from 1.2% to 1.3%. Furthermore, core inflation in Japan is anticipated to slow down from current fiscal year's rate of 3.0% to 2.5% in the next fiscal year. That is, core inflation is projected to stay above BoJ's 2% target.
Despite Yen's recovery today, it remains the weakest performer for the week. Nevertheless, the currency's post-BoJ selloff seems to have concluded, setting the stage for a period of consolidation. While a new high for Yen is unlikely, the range for near-term consolidation seems to have been established. Meanwhile, Sterling is the second weakest currency, largely due to the sell-off triggered by the latest UK CPI data yesterday. Dollar follows as the third weakest. On the other end of the spectrum, Swiss Franc has shown remarkable strength, becoming the best performer this week. Australian Dollar and the New Zealand Dollar are also showing firmness, while Euro and Canadian are mixed.
A notable development was observed in the stock market overnight, with DOW having a significant pullback after hitting new record high. This movement may reflect broader trend of position adjustments by investors as the year-end holiday season approaches. If this trend continues, the Aussie could lose its upward momentum and may enter a phase of consolidation as well.
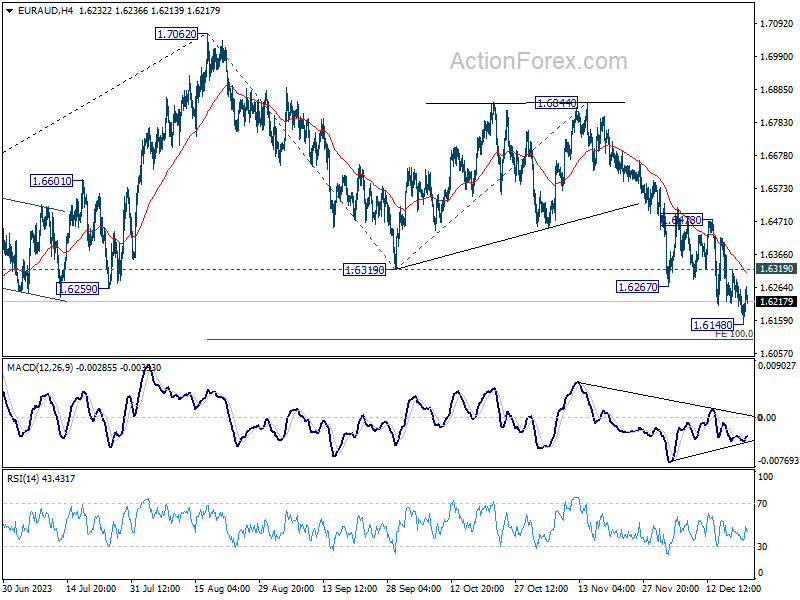
Technically, break of 1.6319 resistance in EUR/AUD would indicate short bottoming just ahead of 100% projection of 1.7062 to 1.6319 from 1.6844 at 1.6106, on bullish convergence condition in 4H MACD. Stronger rebound would then be seen to 1.6478 resistance.
In Asia, at the time of writing, Nikkei is down -1.56%. Hong Kong HSI is down -0.03%. China Shanghai SSE is up 0.34%. Singapore Strait Times is up 0.22%. Overnight, DOW fell -1.27%. S&P 500 fell -1.47%. NASDAQ fell -1.50%. 10-year yield fell -0.045 to 3.877.
Fed's Harker: Cautious path to future rate cuts, inflation fight continues
Philadelphia Fed President Patrick Harker, in a local radio interview overnight, shared expressed that while there will be a need to lower interest rates eventually, this shift should not happen "right away" or "too fast."
Harker stated, "I've been in the camp of, let's hold rates where they are for a while, let's see how this plays out, we don't need to raise rates anymore."
Looking ahead, Harker acknowledged the necessity of reducing rates, saying, "it's important that we start to move rates down." However, he emphasized a gradual approach: "we don't have to do it too fast, we're not going to do it right away, it's going to take some time."
Harker also added a note of caution regarding the economic outlook, particularly concerning inflation. "Let me be clear: The job on inflation is not done, but we are moving in the right direction, things are starting to look better and better."
BoC minutes indicate greater confidence in current monetary policy restrictiveness
Summary of BoC's December 6 meeting showed members collectively agreed "the likelihood that monetary policy was sufficiently restrictive to achieve the inflation target had increased."
However, members also unanimously agreed that "risks to the inflation outlook remained." Hence, BoC did not rule out the possibility of further interest rate hikes.
To effectively assess underlying inflationary pressures, BoC members agreed to focus on several key economic indicators. These include the balance of supply and demand in the economy, wage growth, corporate pricing behavior, and inflation expectations.
It's clarified that while these indicators are not intermediate targets, they "provided helpful information on where inflation is headed."
ECB's Kazaks sees mid-2024 rate cuts, urges caution on early reduction
ECB Governing Council member Martins Kazaks, in an interview overnight, indicated that the most likely period for rate reductions could be around the "middle of next year", specifically pointing to June or July as probable months.
However, Kazaks expressed caution about reducing rates too soon, stating, "But in the spring at the current moment that's too early." He also noted a disparity between his outlook and market expectations, particularly concerning the possibility of an initial rate cut in March, which he views as overly "optimistic".
Kazaks also noted that interest rates are likely to remain at 4% for a while before any reduction is considered.
GBP/JPY Daily Outlook
Daily Pivots: (S1) 180.70; (P) 182.02; (R1) 182.76; More...
GBP/JPY's fall from 184.15 extends lower today but overall it's staying in range above 178.32. Intraday bias remains neutral and further decline is expected. On the downside, break of will resume the decline from 188.63 and target 38.2% retracement of 148.93 to 188.63 at 173.46. However, decisive break of 184.30 will argue that pull back from 188.63 has completed and bring retest of this high.
In the bigger picture, price actions from 188.63 medium term top are currently seen as a correction to the up trend from 148.93 (2022 low) only. As long as 172.11 resistance turned support holds, larger up trend from 123.94 (2020 low) is still in favor to resume through 188.63 at a later stage.
Economic Indicators Update
| GMT | Ccy | Events | Actual | Forecast | Previous | Revised |
|---|---|---|---|---|---|---|
| 07:00 | GBP | Public Sector Net Borrowing (GBP) Nov | 13.2B | 14.0B | ||
| 13:30 | CAD | Retail Sales M/M Oct | 0.80% | 0.60% | ||
| 13:30 | CAD | Retail Sales ex Autos M/M Oct | 0.50% | 0.20% | ||
| 13:30 | USD | Initial Jobless Claims (Dec 15) | 220K | 202K | ||
| 13:30 | USD | GDP Annualized Q3 | 5.20% | 5.20% | ||
| 13:30 | USD | GDP Price Index Q3 | 3.60% | 3.60% | ||
| 13:30 | USD | Philadelphia Fed Manufacturing Survey Dec | -3 | -5.9 | ||
| 15:30 | USD | Natural Gas Storage | -82B | -55B |
BoC minutes indicate greater confidence in current monetary policy restrictiveness
Summary of BoC's December 6 meeting showed members collectively agreed "the likelihood that monetary policy was sufficiently restrictive to achieve the inflation target had increased."
However, members also unanimously agreed that "risks to the inflation outlook remained." Hence, BoC did not rule out the possibility of further interest rate hikes.
To effectively assess underlying inflationary pressures, BoC members agreed to focus on several key economic indicators. These include the balance of supply and demand in the economy, wage growth, corporate pricing behavior, and inflation expectations.
It's clarified that while these indicators are not intermediate targets, they "provided helpful information on where inflation is headed."
AUD/USD Rally Pauses, Traders Cautious As US GDP Approaches
Key Highlights
- AUD/USD gained traction above the 0.6700 resistance zone.
- A connecting bullish trend line is forming with support near 0.6745 on the 4-hour chart.
- EUR/USD and GBP/USD are consolidating above key support zones.
- The US GDP could grow 5.2% in Q3 2023.
AUD/USD Technical Analysis
The Aussie Dollar started a steady increase above the 0.6620 level against the US Dollar. AUD/USD broke many hurdles near 0.6650 and 0.6700 to enter a positive zone.

Looking at the 4-hour chart, the pair settled above the 0.6700 level, the 100 simple moving average (red, 4 hours), and the 200 simple moving average (green, 4 hours).
Finally, there was a tiny bearish reaction near the 0.6775 level. The pair seems to be consolidating gains ahead of the US GDP release. There is also a connecting bullish trend line forming with support near 0.6745 on the same chart.
The next major support is 0.6690, below which the pair might decline and test the 100 simple moving average (red, 4 hours) at 0.6630.
On the upside, immediate resistance is near the 0.6775 level. The next key resistance is near the 0.6800 level. A close above the 0.6800 zone could open the doors for more upsides. The next stop for the bulls might be 0.6880.
Looking at EUR/USD, the pair struggled to clear the 1.1000 resistance and seems to be consolidating gains above 1.0860.
Economic Releases
- US Initial Jobless Claims - Forecast 215K, versus 202K previous.
- US Gross Domestic Product for Q3 2023 (Preliminary) – Forecast 5.2% versus previous 5.2%.
ECB’s Kazaks sees mid-2024 rate cuts, urges caution on early reduction
ECB Governing Council member Martins Kazaks, in an interview overnight, indicated that the most likely period for rate reductions could be around the "middle of next year", specifically pointing to June or July as probable months.
However, Kazaks expressed caution about reducing rates too soon, stating, "But in the spring at the current moment that's too early." He also noted a disparity between his outlook and market expectations, particularly concerning the possibility of an initial rate cut in March, which he views as overly "optimistic".
Kazaks also noted that interest rates are likely to remain at 4% for a while before any reduction is considered.
Fed’s Harker: Cautious path to future rate cuts, inflation fight continues
Philadelphia Fed President Patrick Harker, in a local radio interview overnight, shared expressed that while there will be a need to lower interest rates eventually, this shift should not happen "right away" or "too fast."
Harker stated, "I've been in the camp of, let's hold rates where they are for a while, let's see how this plays out, we don't need to raise rates anymore."
Looking ahead, Harker acknowledged the necessity of reducing rates, saying, "it's important that we start to move rates down." However, he emphasized a gradual approach: "we don't have to do it too fast, we're not going to do it right away, it's going to take some time."
Harker also added a note of caution regarding the economic outlook, particularly concerning inflation. "Let me be clear: The job on inflation is not done, but we are moving in the right direction, things are starting to look better and better."
NZDUSD Wave Analysis
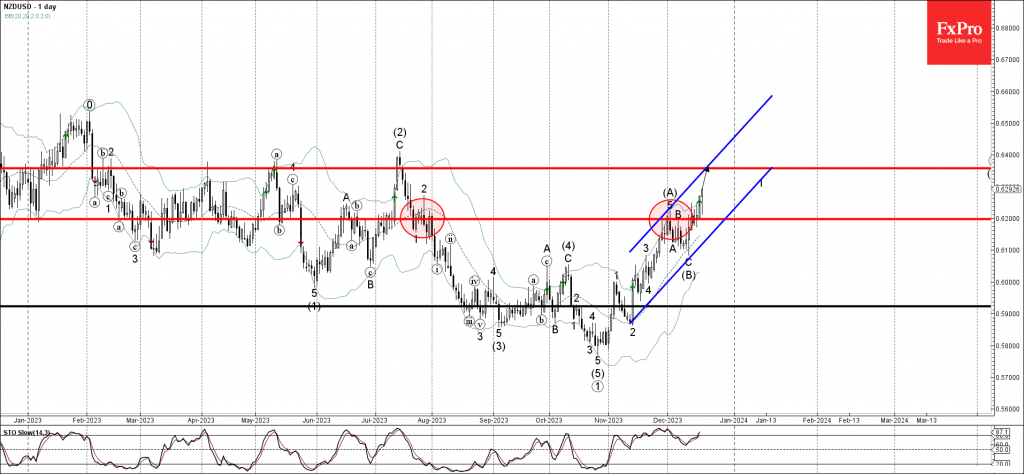
- NZDUSD broke key resistance level 0.6200
- Likely to rise to resistance level 0.6360
NZDUSD currency pair under the bullish pressure after breaking the key resistance level 0.6200 (which has been reversing the price from the end of July).
The breakout of the resistance level 0.6200 accelerated the active minor impulse wave 1 of the medium-term upward impulse wave (C).
NZDUSD can be expected to rise further to the next resistance level 0.6360 (former resistance from April, March and July).
GBPNZD Wave Analysis
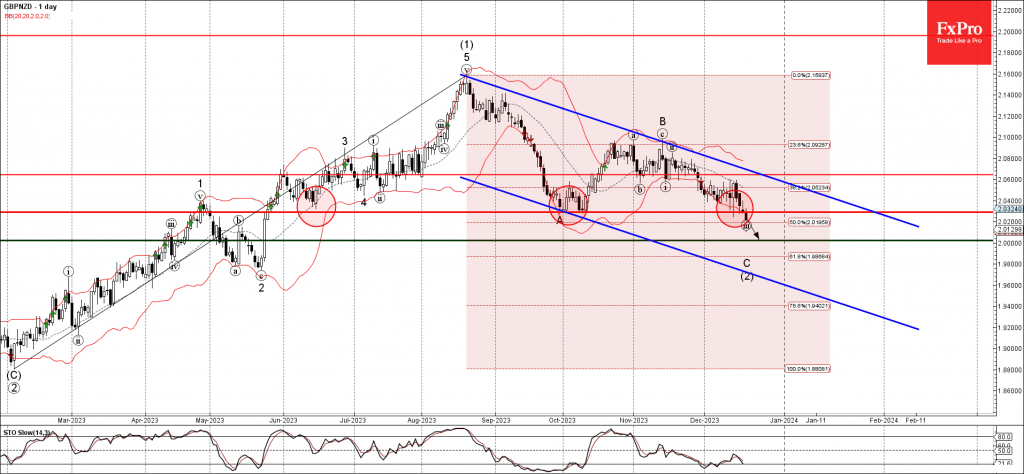
- GBPNZD broke key support level 2.0290
- Likely to fall to support level 2.0000
GBPNZD currency pair recently broke the key support level 2.0290 (which has been reversing the price from the middle of June).
The breakout of the support level 2.0290 coincided with the breakout of the 50% Fibonacci correction of the upward impulse from April.
Given the strongly bearish sterling sentiment, GBPNZD can be expected to fall further to the next round support level 2.0000.
CHFJPY Pulls Back From Record Highs
- CHFJPY has lost some ground over the last month
- Yet, overall picture remains overwhelmingly positive
- Decisive break below 160 level needed to change that
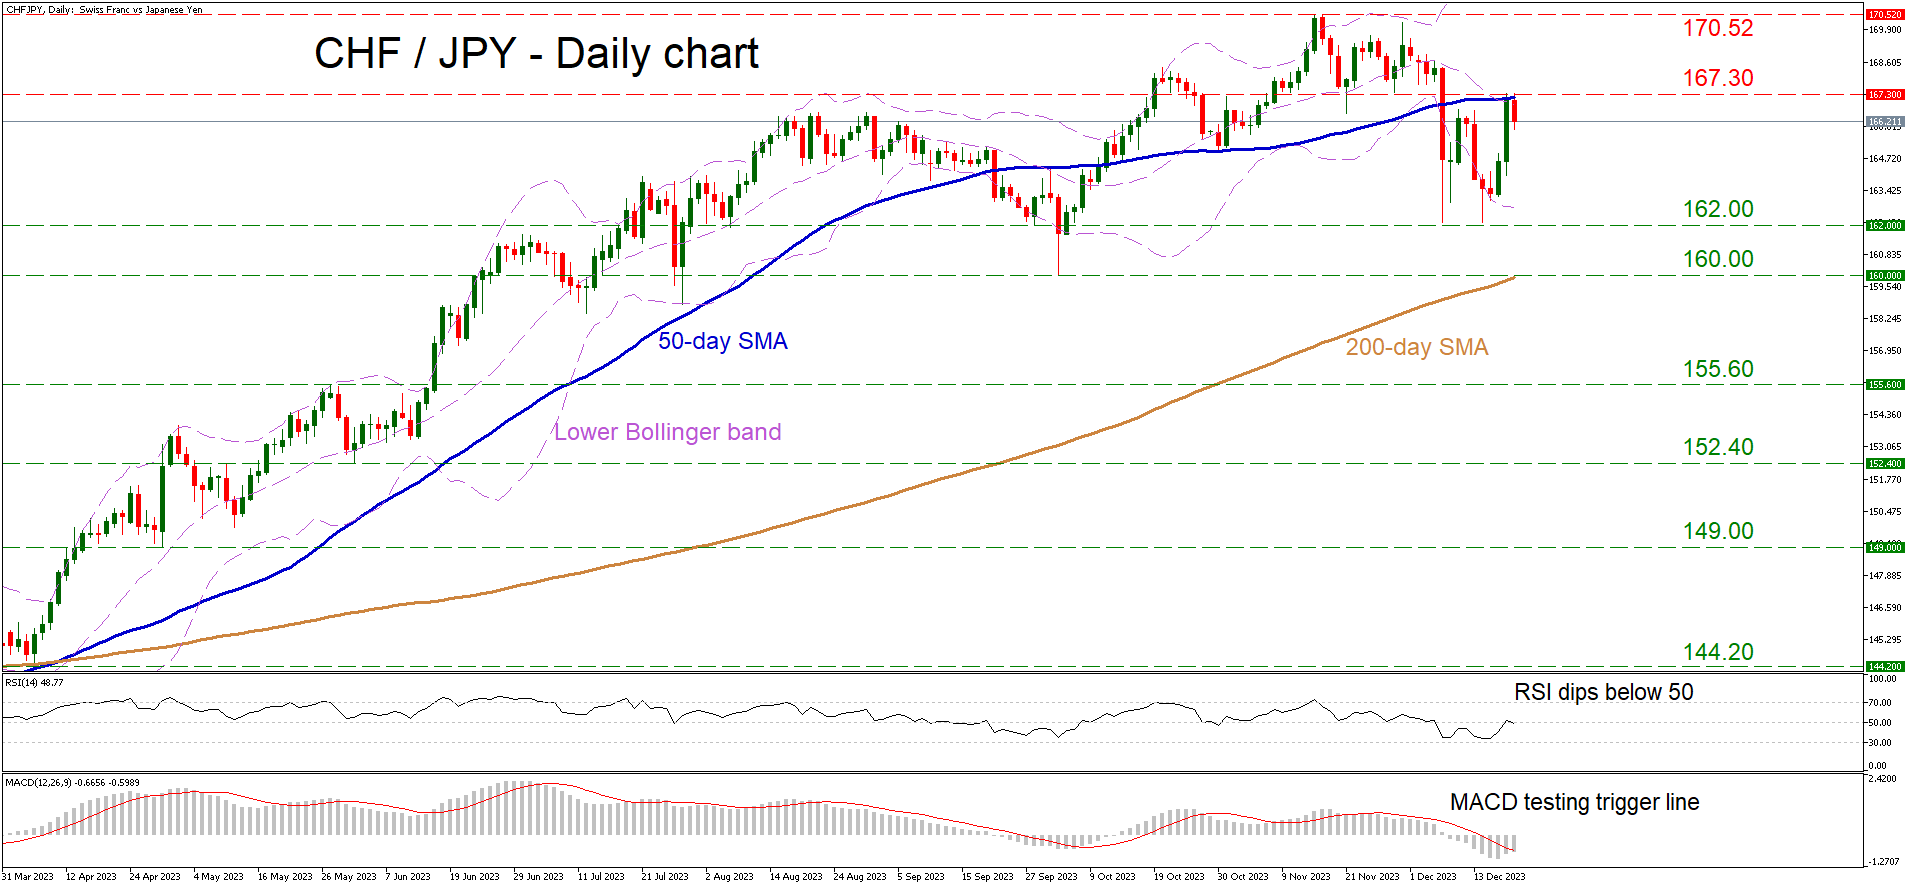
CHFJPY suffered a minor retreat in recent weeks, after hitting a record high back in November. That said, the structure of higher highs and higher lows remains in force, which suggests that the market remains in a broader uptrend.
Momentum oscillators are near their neutral levels, providing few clues about what comes next. The RSI is around its 50 level, and although the MACD is still negative, it is currently trying to surpass its red trigger line.
In case buyers take back the wheel, their first test will take place around 167.30, a region that also encompasses the 50-day simple moving average (SMA). If they slice above it, that could open the way towards the record high of 170.52. Another move higher from there would bring the market into uncharted territory, turning the focus to round psychological numbers such as 175.00 as potential resistance areas.
On the flipside, a selloff could see the pair drop towards the 162.00 territory, which halted the declines twice this month. If sellers are powerful enough to drive the pair lower, an even bigger battle could take place near the 160.00 area, which is where the 200-day SMA is located as well.
In a nutshell, despite the latest retreat, the broader trend remains resolutely positive. A move below 160.00 is needed to change that.
NZDUSD Climbs to Fresh 5-month High, Eyes 0.6300 Level
- NZDUSD headed for eighth straight day of gains
- Bullish momentum continues to strengthen
- But is it at risk of a negative correction?
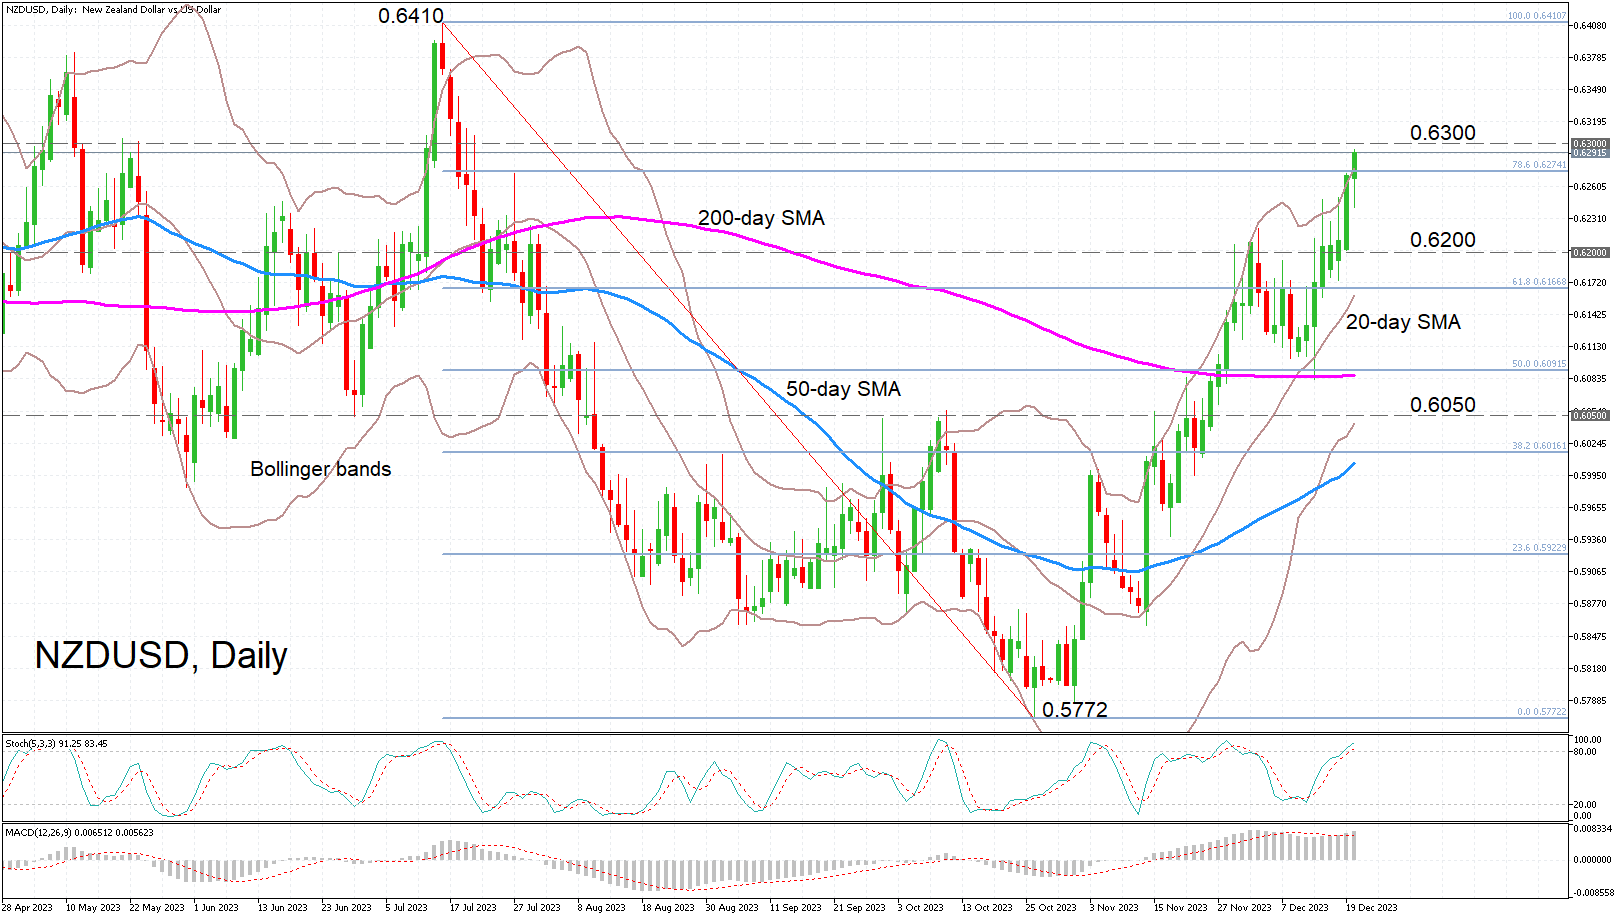
NZDUSD reached a fresh five-month high of 0.6293 on Wednesday, as its bullish streak shows no sign of easing. The momentum indicators are looking dangerously overbought but a reversal may not be imminent and the current upswing could continue for a little bit longer.
The stochastics have crossed into the overstretched zone but the %K and %D lines remain positively aligned, while the MACD has managed to rise back above its red signal line.
However, there is a more prominent warning sign from the upper Bollinger Band, which has been trying to put a lid on the rally for the past few sessions. If the price finally succumbs to this impediment, it could pull back towards the 0.6200 level, before retreating towards the middle Bollinger band, which is also the 20-day simple moving average (SMA) and near the 61.8% Fibonacci retracement of the July-October downtrend.
A dip below the 20-day SMA, currently at 0.6160, the decline could extend until the 0.6050 region, which encompasses the highs from September, October and November, as well as the lower Bollinger band.
But in the event that the bulls keep on powering ahead, there could be further trouble at the 0.6300 handle, which needs to be overcome if the rally is to advance towards the July top of 0.6410.
All in all, despite the rising risk of a downside correction, both the short- and medium-term picture for NZDUSD is resoundingly positive. Only a fall below the lower Bollinger band would undermine the bullish structure, while a climb above the July peak would place the uptrend on an even more sustainable footing.