Sample Category Title
USD/CAD Daily Outlook
Daily Pivots: (S1) 1.3330; (P) 1.3350; (R1) 1.3388; More...
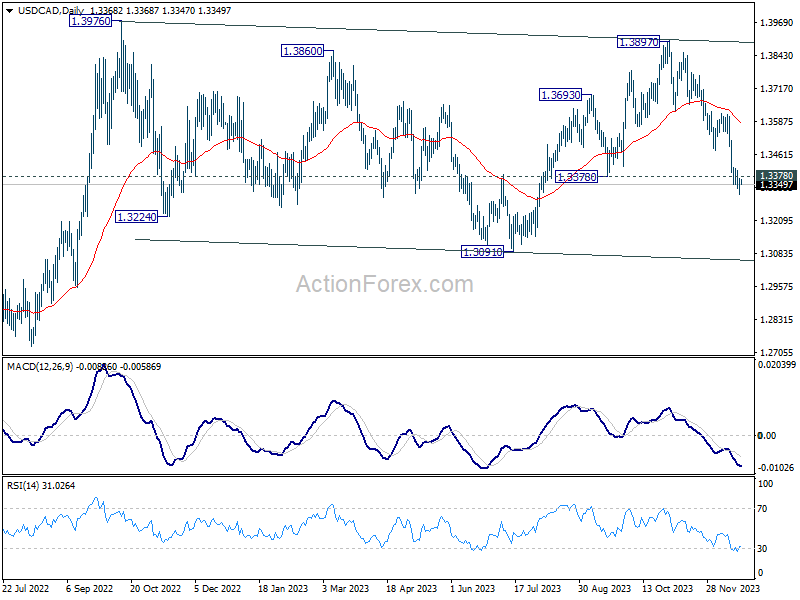
Further decline is expected in USD/CAD as long as 1.3408 minor resistance holds. Fall from 1.3897 would target a retest on 1.3091 support. Nevertheless, break of 1.3408 will indicate short term bottoming, and turn bias back to the upside for stronger rebound.
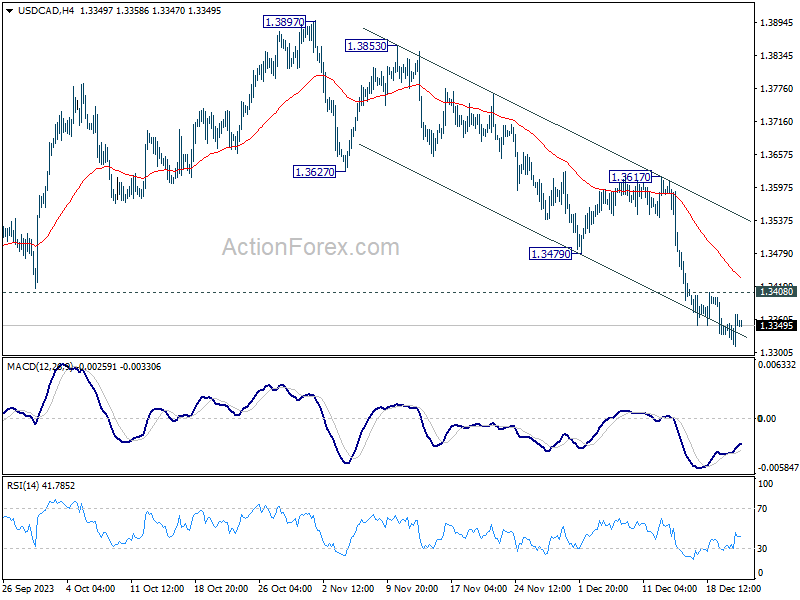
In the bigger picture, outlook is mixed up by deeper then expected fall from 1.3897. But after all, price actions from 1.3976 (2022 high) are viewed as a corrective pattern that's in progress. Larger up trend from 1.2005 (2021 low) is still expected to resume at a later stage as long as 1.2947 resistance turned support holds.
Cracks
We start feeling the cracks in market optimism: the bonds extended their rally yesterday after the inflation data in Britain surprised to the downside, but major US indices saw a sharp retreat. A 12% plunge in FedEx – which acts like a gauge of economic activity, the overbought market conditions in major global stock indices and the awareness that a further fall in bond yields weaken the idea of soft landing triggered a much-needed retreat in equity valuations.
The British FTSE 100 is fueled by a dovish shift in Bank of England (BoE) expectations, cheap sterling and returning appetite for energy stocks. Appetite for the Stoxx 600 is limited near last week’s peak, while the S&P500 recorded a sharp fall from near ATH, and Nasdaq 100 also saw a sharp retreat after hitting a fresh ATH earlier in the session. European futures are in the red, while US futures are in the green.
We know that a further correction in equity valuations is on the cards. We just don’t know what the trigger will be.
A positive breakout?
The barrel of US crude is still working on clearing the $74/75 resistance. Yesterday’s rising US inventories somehow broke the positive momentum. But strengthening trend and momentum indicators hint that a positive breakout is possible, and a potential rally could send the barrel of crude to 200-DMA, which stands a touch below the $78pb. Yet the upside is seen limited as any significant rally in oil prices will boost global inflation expectations, crush the dream of seeing the central banks call the end of policy tightening and increase recession odds. And rising recession odds are negative for oil.
Enjoy while it lasts
Investors could still enjoy a soft US inflation read for November, and the latter could keep the bond rally intact into Xmas. If that’s the case, the US dollar will remain under pressure. The latter will allow the euro to extend its gains against the US dollar. The pair could make another attempt on the 1.10 mark. For those who love pure tech plays, the current cup and handle formation in the EURUSD is a bullish technical formation and could be interesting for entering fresh long positions. But note that fundamentally, the euro’s strength against the US dollar is not perfectly deserved. The strong US economy calls for a hawkish Federal Reserve (Fed) reaction, the soft European growth and falling inflation call for a dovish European Central Bank (ECB) stance. But what we see today is the exact opposite. So, if the central bankers and the market come back to their senses, the EURUSD should not rally above 1.10. But it may take time before the rectification happens. Today’s US growth number could remind us that the US economy grew more than 5% in Q3.
EUR/CHF Daily Outlook
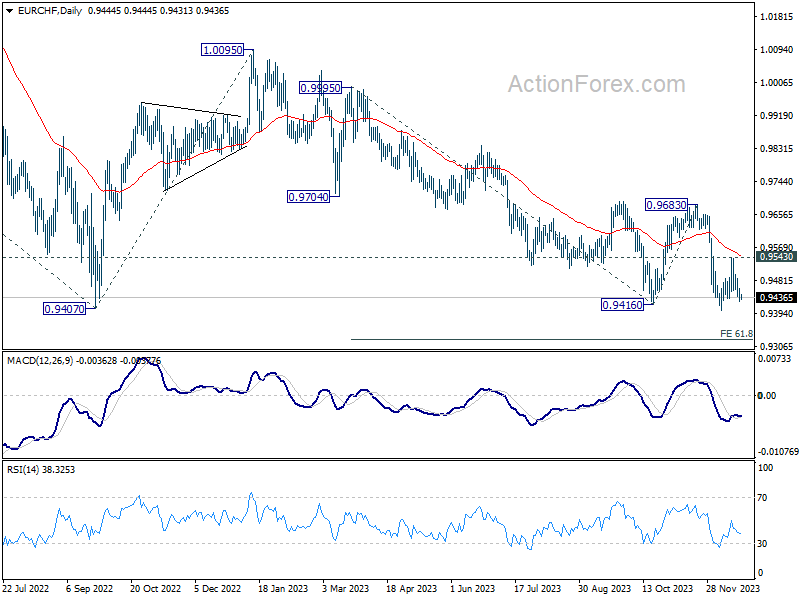
Daily Pivots: (S1) 0.9424; (P) 0.9443; (R1) 0.9460; More...
Intraday bias in EUR/CHF remains neutral at this point. Consolidation from 0.9402 could extend further. But deeper decline is expected with 0.9543 resistance intact. On the downside, firm break of 0.9407 will confirm larger down trend resumption. Next target is 61.8% projection of 0.9995 to 0.9416 from 0.9683 at 0.9325. However, sustained break of 0.9543 will bring further rally back to 0.9683 resistance instead.
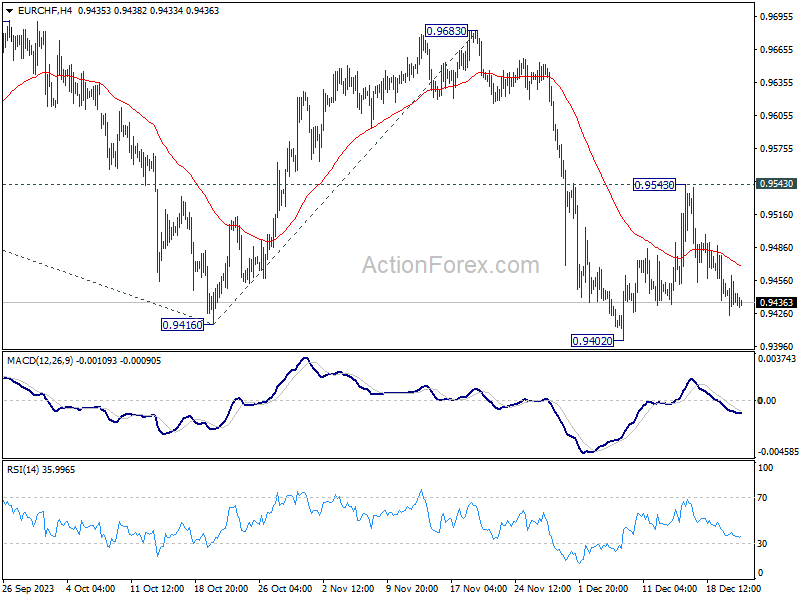
In the bigger picture, medium term outlook remains bearish as long as 0.9683 resistance holds. Firm break of 0.9407 (2022 low) will resume long term down trend. Next target will be 61.8% projection of 1.1149 (2020 high) to 0.9407 from 1.0095 at 0.9018.
EUR/GBP Daily Outlook
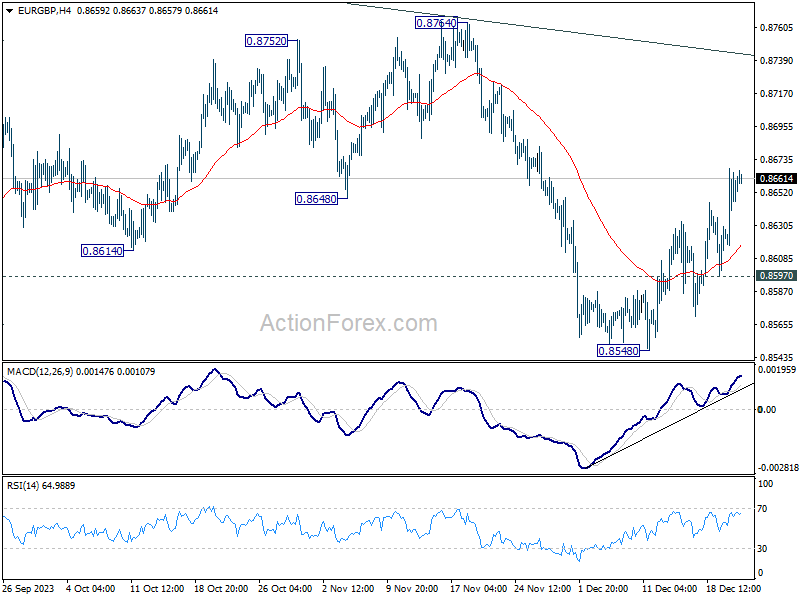
Daily Pivots: (S1) 0.8628; (P) 0.8648; (R1) 0.8679; More....
Intraday bias in EUR/GBP remains on the upside at this point. Rebound from 0.8548 would target 0.8764 key resistance next. On the downside, however, break of 0.8597 will turn bias back to the downside for 0.8548 support instead.
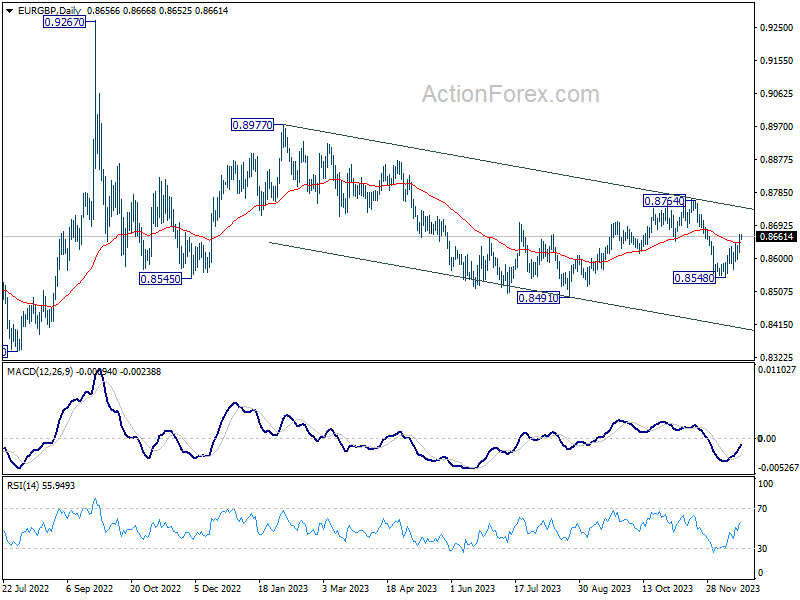
In the bigger picture, current development suggests that down trend from 0.9267 (2022 high) is still in progress. This decline is seen as the third leg of the pattern from 0.9499 (2020 high). Break of 0.8201 will target 100% projection of 0.9499 to 0.8201 from 0.9267 at 0.7969. In any case, outlook will stay bearish as long as 0.8764 resistance holds.
EUR/AUD Daily Outlook
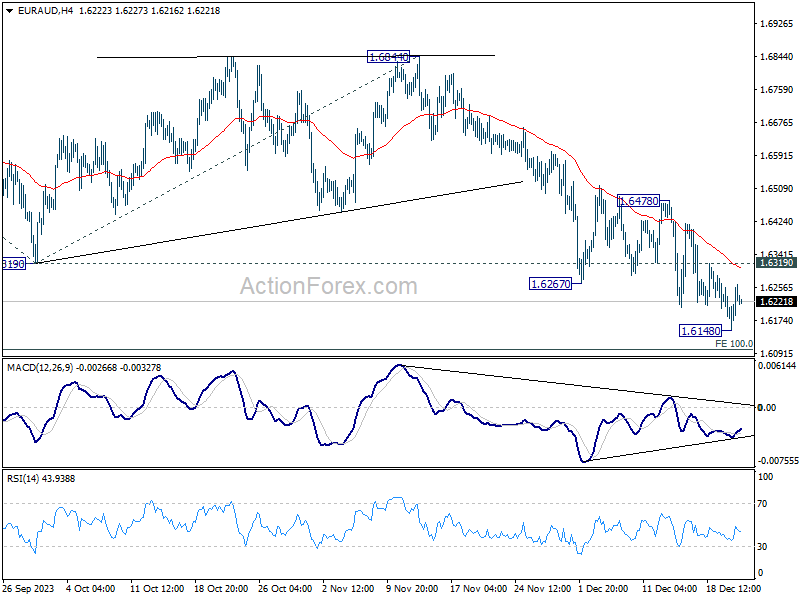
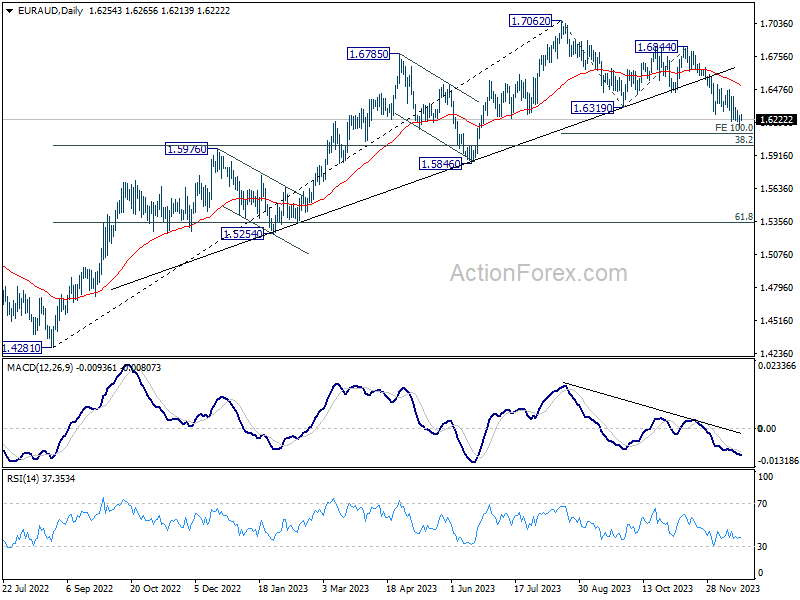
Daily Pivots: (S1) 1.6186; (P) 1.6223; (R1) 1.6297; More...
Intraday bias in EUR/AUD is turned neutral first with current recovery. On the upside, break of 1.6319 resistance will now indicate short term bottoming, on bullish convergence condition in 4H MACD. Intraday bias will be back on the upside for 1.6478 resistance. Nevertheless, on the downside, below 1.6148 will resume recent decline for 100% projection of 1.7062 to 1.6319 from 1.6844 at 1.6106.
In the bigger picture, fall from 1.7062 medium term top is seen as correcting the whole up trend from 1.4281 (2022 low). Deeper decline would be seen to 38.2% retracement of 1.4281 to 1.7062 at 1.6000. Strong support could be seen there to bring rebound on first attempt. But risk will stay on the downside as long as 1.6844 resistance holds. Sustained break of 1.6000 would bring further fall to 61.8% retracement at 1.5343.
EUR/JPY Daily Outlook
Daily Pivots: (S1) 156.55; (P) 157.33; (R1) 157.88; More..
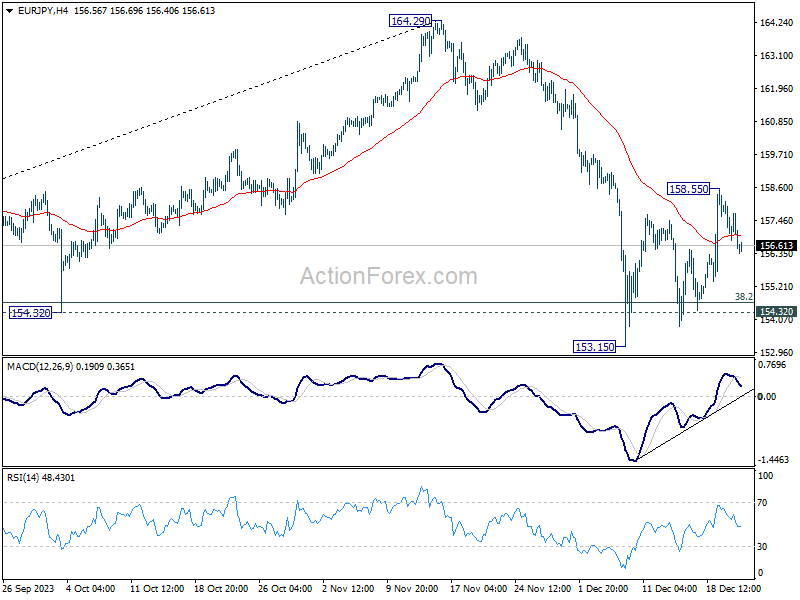
EUR/JPY retreated after hitting 158.55 and intraday bias is turned neutral first. On the upside, above 158.55 will resume the rebound from 153.15 to 55 D EMA (now at 158.82). On the downside, break of 153.15 will resume whole fall from 164.39 to 61.8% retracement of 139.05 to 164.29 at 148.69.
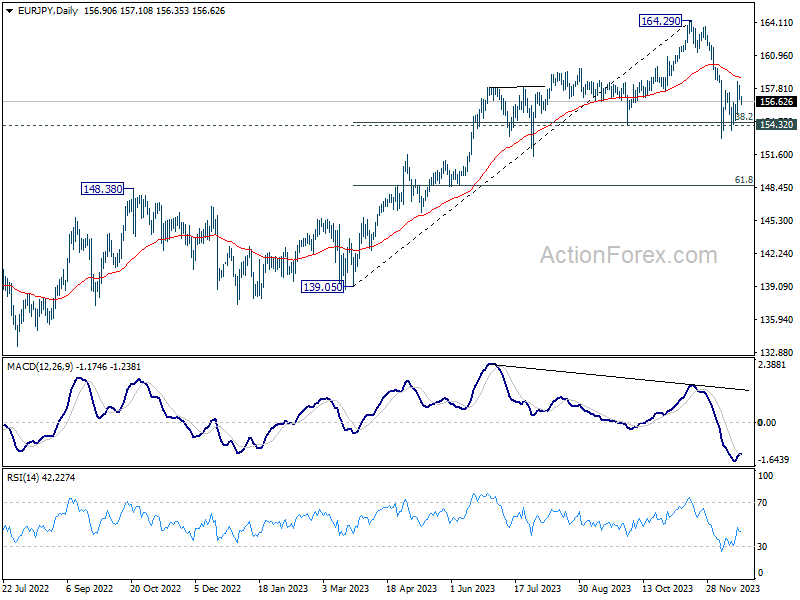
In the bigger picture, price actions from 164.29 medium term top are tentatively seen as a correction to rise from 139.05 for now. As long as 148.48 resistance turned support holds (2022 high), larger up trend from 114.42 (2020 low) could still resume through 164.29 at a later stage.
EU Agrees on New Fiscal Rules
In focus today
Not much on the data calendar before Christmas. In Sweden, markets will take a close look at NIER's December survey. In particular retail trade and private services price plans will be scrutinized for further signs of moderation. Any widening cracks in confidence or hiring plans are also in focus.
In Norway, unemployment rate for December will be released.
Overnight, we will get November inflation print from Japan. Consensus expects headline inflation to fall to 2.8% y/y from 3.3% in October.
The 60 second overview
Risk sentiment: Market's risk sentiment weakened unexpectedly last night with equities turning lower, yields still falling and USD regaining some strength. This marked a shift from the rally sparked by last week's FOMC meeting, where equities, bond markets and cyclical FX all appreciated on the expectation of looming rate cuts. Yesterday's macro data was not particularly downbeat however, with UK inflation surprising to the downside and consumer sentiment recovering both in the euro area and the US. Even so, the Fed's Harker cautioned that he has heard signals of 'things starting to soften faster than data suggests' and that 'a lot of things could thwart a soft landing'. ECB's Knot noted that a rate cut in H1 2024 remains unlikely based on today's information and Lane reminded that markets should not extrapolate the November's positive inflation surprise for what's to come.
EU fiscal rules: Yesterday evening, the EU economy and finance ministers struck a deal on a new set of fiscal rules for the EU. The new rules include stricter overall limits on spending while it provides leeway for countries to invest in key EU priorities like defence and the green transition and allow structural reforms. The old thresholds of a maximum public deficit of 3% of GDP and the 60% debt to GDP remain. Countries with debt over 90% of GDP must trim it by 1 percentage point per year, while countries with debt between 60% and 90% need to make half that effort. Countries that both breach the 60% and 3% thresholds must aim at cutting deficits to 1.5% of GDP by improving the structural balance with 0.4% of GDP each year. Enforcement of the new rules will be tougher and countries that deviates from their spending plans will have to reduce spending by 0.5% of GDP per year. However, a last-minute concession won by France secured that for such countries interest payments will be excluded from the calculation in 2025-27. 16 out of 27 EU countries will not comply with either the deficit target or debt to GDP threshold next year according to the EU Commission estimates. Thus, we should expect an overall tighter fiscal stance in the EU next year. Among the larger countries this will especially affect spending plans in France, Italy and Belgium.
Equities: Global equities lower yesterday as the US cash session went from positive to sharply negative in the afternoon. No obvious trigger and all sectors were lower with no relation to cyclicality or rates etc. The only go to explanation being, the very strong rally leading up to this. Hence it looks like investors said too far too fast and therefor took some chips of the table. We have seen these dynamics before and typically don't recommend chasing sudden shifts unless the fundamental drivers have shift. That was not the case yesterday where we got very solid macro data and yet another set of benign inflation prints.
In US yesterday -1.3%), S&P 500 -1.5%, Nasdaq -1.5% and Russell 2000 -1.9%.
Most Asian markets are lower this morning while China moving against the trend. European futures are lower while US once are higher.
FI: European yields ended lower across the board with a parallel of about 4-5bp supported by the weak UK inflation print in the morning. This took 10y Bund yields below the 2% mark. Intra euro area spreads remaining broadly stable into the holiday period. With only a couple trading days left and no tier 1 data releases scheduled, we may be in for similar sessions with low liquidity period similar to yesterday. Also today, there is no key data releases on the agenda. Yesterday's comments from ECB's Knot on rate cuts in the first half is rather unlikely was disregarded by markets.
FX: In majors, EUR/USD moved slightly lower yesterday, yet still in the mid-1.09s. EUR/GBP hold on to gains after the UK inflation surprise, trades at 0.8660. USD/JPY has continued lower after recent test of 145 and is now below 143. In Scandies, NOK/SEK gave up some of recent days gains as EUR/NOK recovered to above 11.30 whereas and EUR/SEK remains under pressure at around 11.12. NOK/SEK still holds above 0.98.
Credit: The December holiday slowdown has hit the credit market with limited new issue activity and only small changes to spreads. iTraxx Main was unchanged at 60bp while iTraxx Xover was 2bp wider at 323bp.
Nasdaq 100 Technical: Potential Start of Minor Corrective Decline
- Bearish reversal candlestick formed yesterday, its steepest daily loss since 27 October 2023.
- Odds now have skewed towards a potential minor corrective decline sequence within a medium-term uptrend phase.
- Watch the 16,800 key short-term resistance.
The price actions of the US Nas 100 Index (a proxy for the Nasdaq 100 futures) have continued to rally and surpassed the 16,590 short-term resistance as highlighted in our previous analysis and the former 16,772 all-time high printed on 22 November 2021.
It continued to inch higher yesterday, 20 December during the first half of the US session where it rallied by +0.3% intraday and printed a fresh all-time high of 16,898. But it could not maintain its initial bullish momentum and reversed down to end the US session with a daily loss of -1.37%
Steepest daily loss since 27 October 2023
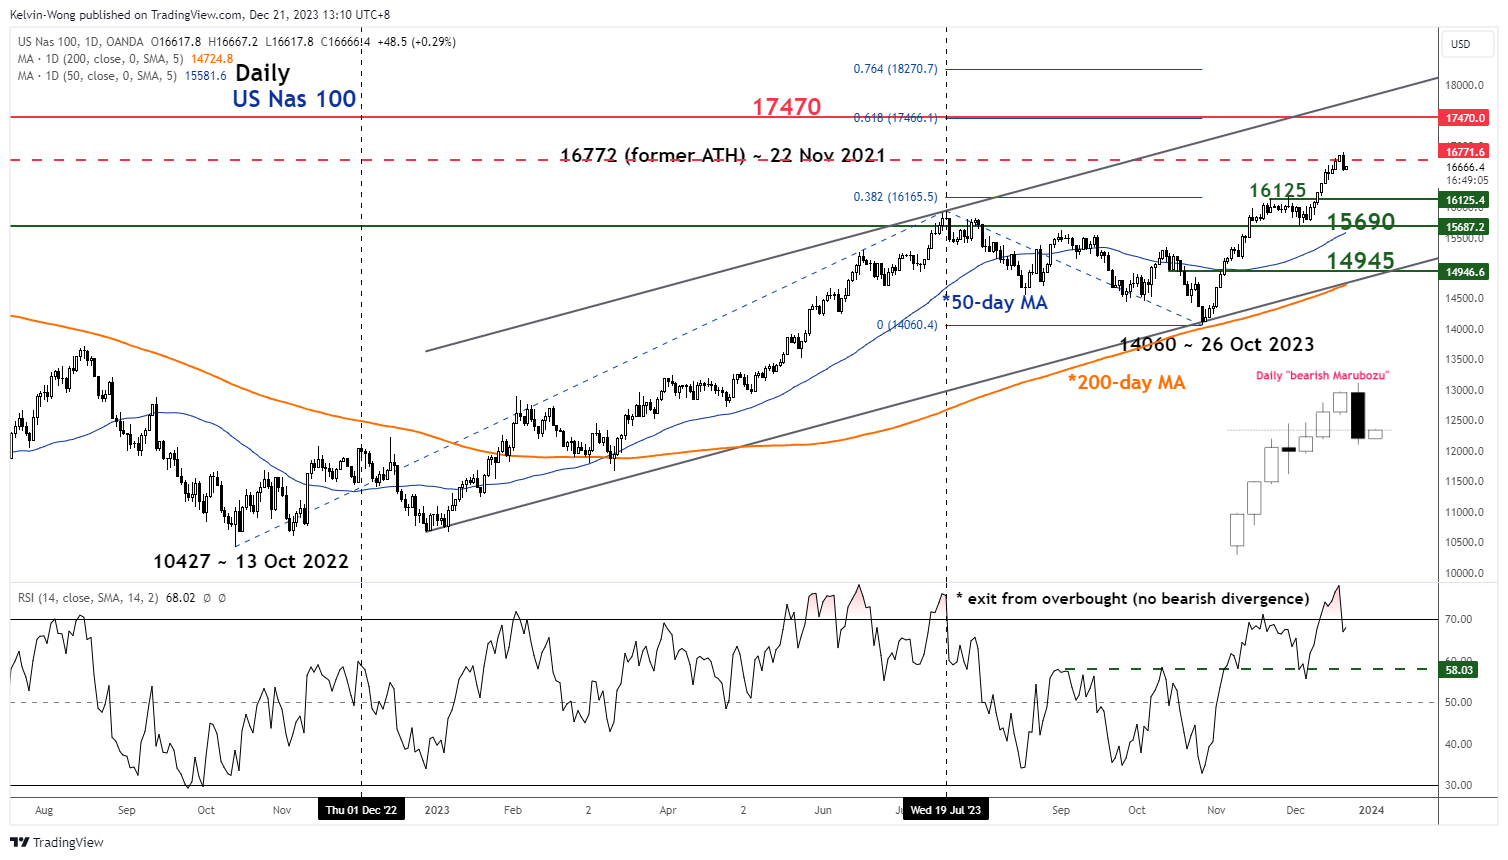
Fig 1: US Nas 100 medium-term trend as of 21 Dec 2023 (Source: TradingView, click to enlarge chart)
The US Nas 100 Index has formed a daily “bearish Marubozu” candlestick with a daily loss of -1.37% which is the steepest daily decline since the medium-term uptrend kickstarted on 27 October 2023.
These observations suggest the prior seven consecutive weeks of higher positive closes are likely to give way to a potential mean reversion decline sequence; at least a short-term multi-day corrective decline to retrace a portion of the enormous swift rally of +20% from the low of 23 October 2023 to yesterday’s fresh intraday all-time high of 16,898.
Short-term bullish trend exhaustion
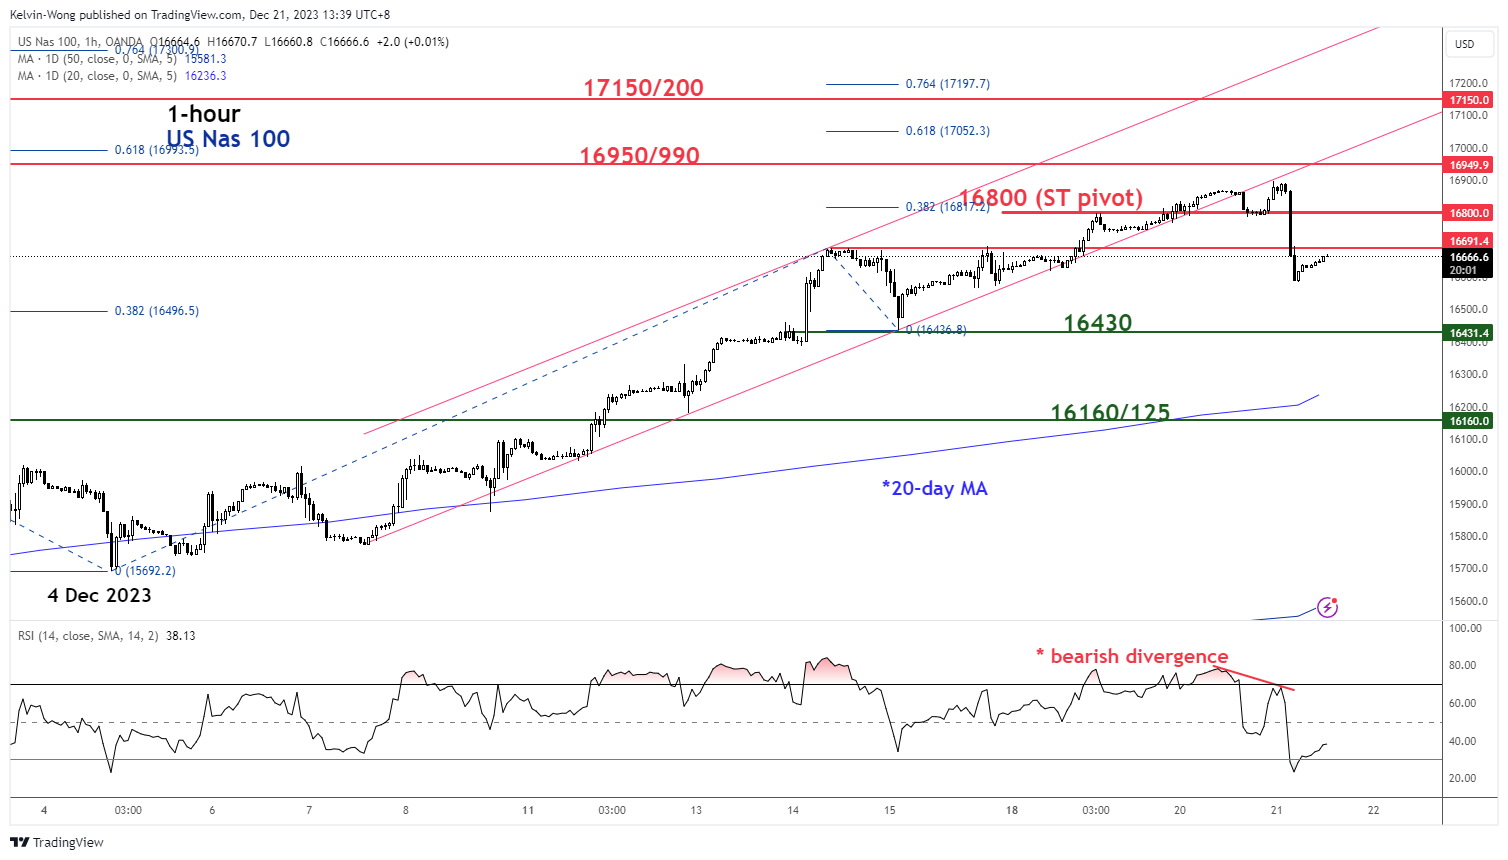
Fig 2: US Nas 100 minor short-term trend as of 21 Dec 2023 (Source: TradingView, click to enlarge chart)
Its price actions have broken below a minor ascending channel support from the 7 December 2023 low as depicted on the hourly chart.
The retest seen yesterday, 20 December on the former ascending channel support turned pull-back resistance has been accompanied by a bearish divergence condition flashed out on the hourly RSI momentum indicator at its overbought zone.
These short-term bearish elements have reinforced the potential start of a minor corrective decline sequence within its medium-term uptrend phase that is still intact.
If 16,800 key short-term pivotal resistance is not surpassed, the Index may see the next immediate support coming in at 16,430 and a break below it exposes the next support at 16,160/125 (also the upward sloping 20-day moving average).
On the flip side, a clearance above 16,800 invalidates the minor corrective decline scenario for a potential continuation of the bullish impulsive upmove towards the next immediate resistances of 16,950/990 and 17,150/200.
GBPJPY Showing Incomplete Bearish Sequence
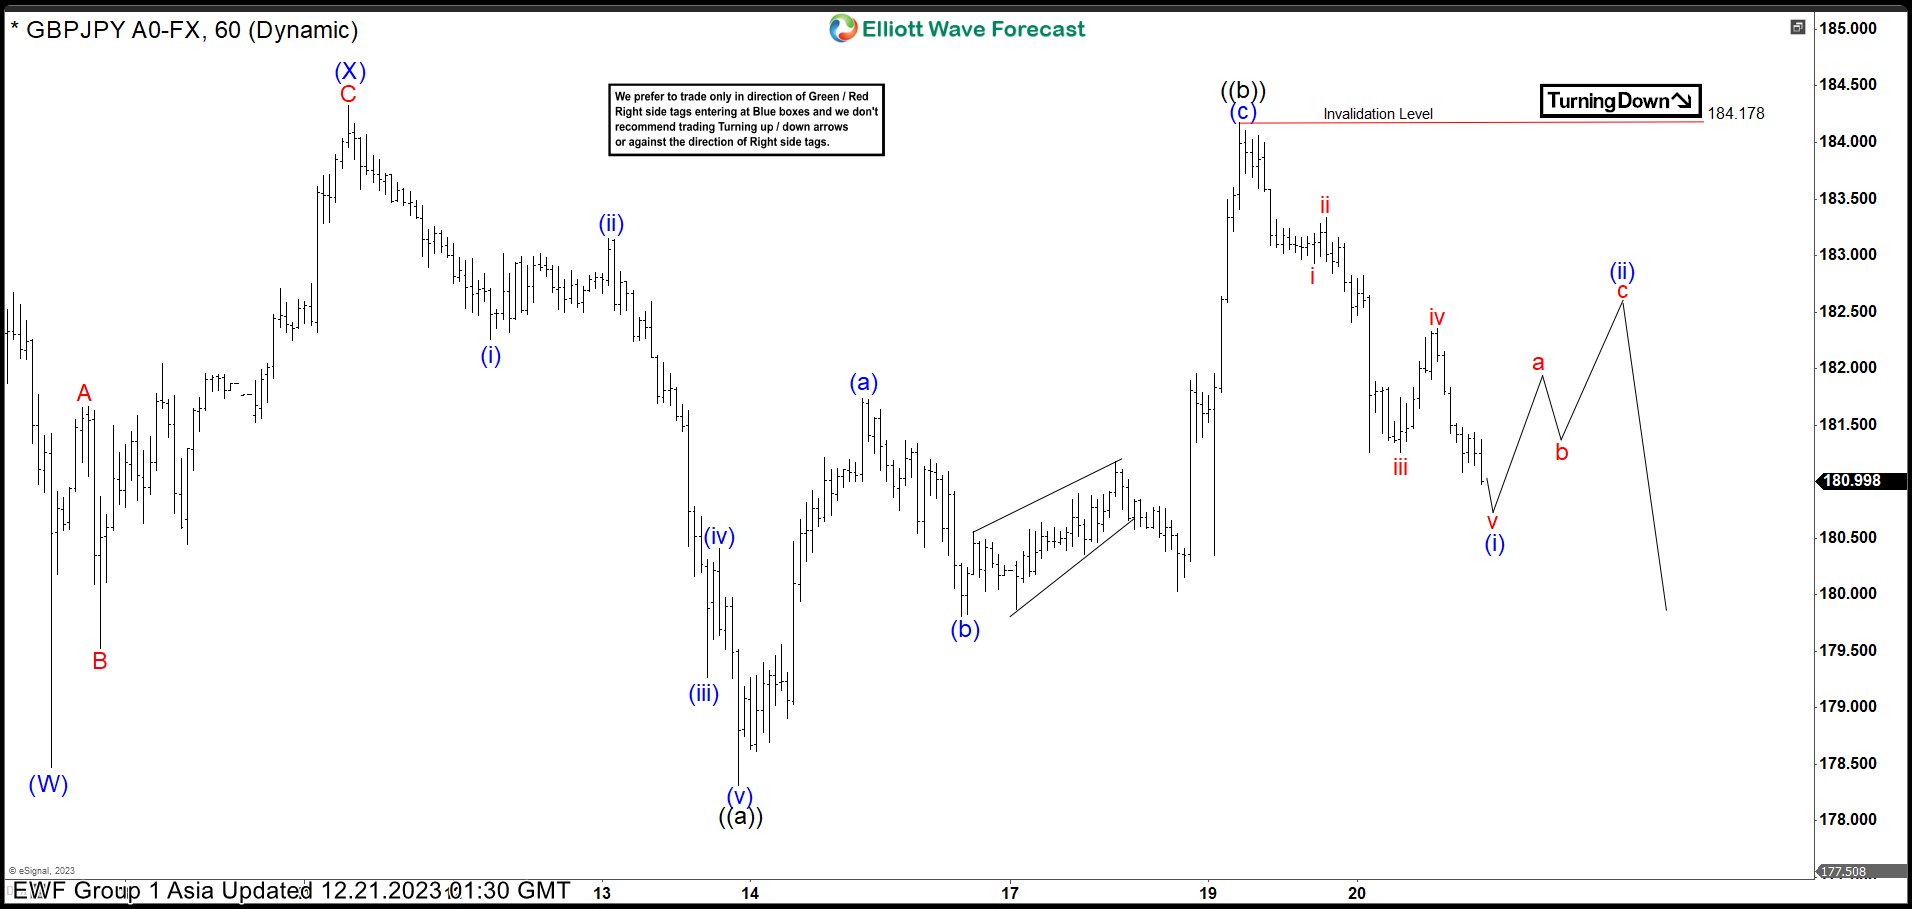
Short Term Elliott Wave View in GBPJPY shows that it has ended wave ((3)) at 188.66. Pullback in wave ((4)) is currently in progress as a double three Elliott Wave structure. Down from wave ((3)), wave A ended at 185.06 and wave B ended at 186.18. Wave C lower made a strong drop ended at 178.47 which completed wave (W). The yen pair then corrected in wave (X) as a zigzag structure. Up from wave (W), wave A ended at 182.04 and wave B ended at 180.45. Wave C higher ended at 184.32 which completed wave (X).
The GPBJPY then turned lower in wave (Y). Down from wave (X), wave ((a)) ended at 178.32 breaking the low of wave (W) opening the idea of a incomplete bearish sequence. Wave ((b)) pullback was very high retesting wave (X) ended at 184.17. The yen pair is now trading lower in wave ((c)) of W. Down from wave ((b)), wave (i) is expected to end soon, then it should pullback in wave ((ii)), followed by further downside in wave (iii) of ((c)). Then, as far as pivot at 184.18 high remains intact, the GBPJPY has scope to see further downside in a larger double three in wave (Y).
GBPJPY 60 Minutes Elliott Wave Chart
GBPJPY Elliott Wave Video
https://www.youtube.com/watch?v=u078O8vqYxM
Technical Outlook and Review
DXY:
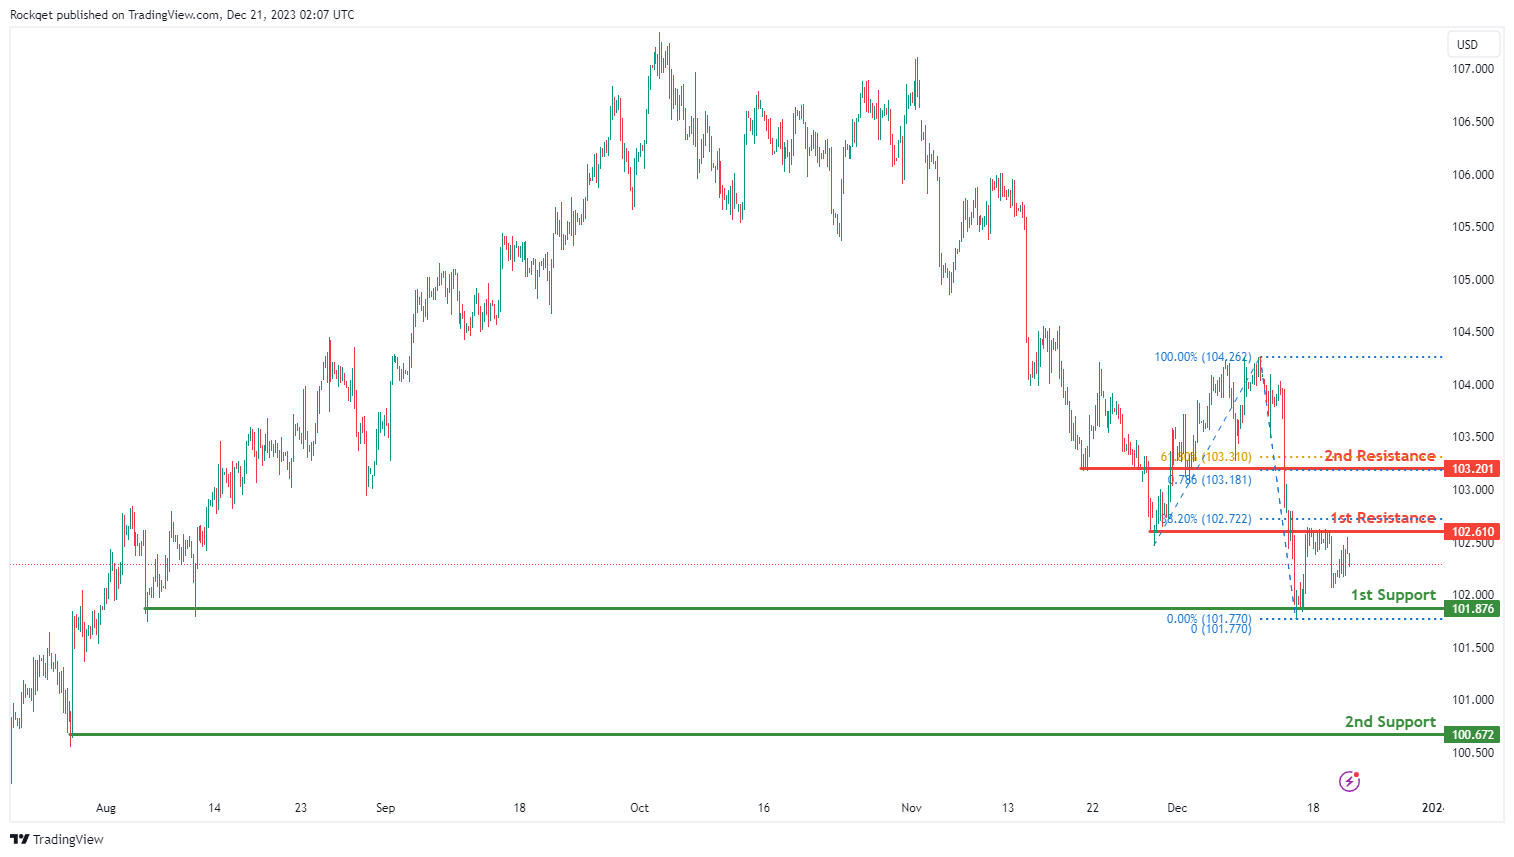
The DXY (US Dollar Index) chart currently shows an overall bearish momentum, indicating a potential for price to make a bearish continuation towards the 1st support.
The 1st support level at 101.87 is identified as a multi-swing-low support. Further below, the 2nd support level at 100.67 is noted as a swing-low support, further reinforcing its importance as a potential key support level.
To the upside, the 1st resistance level at 102.61 is identified as an overlap resistance that aligns close to the 38.20% Fibonacci retracement level. Higher up, the 2nd resistance level at 103.20 is also marked as an overlap resistance that aligns with a confluence of Fibonacci levels i.e. the 61.80% retracement and the 78.60% projection levels, suggesting a potential barrier for further upside movement.
EUR/USD:
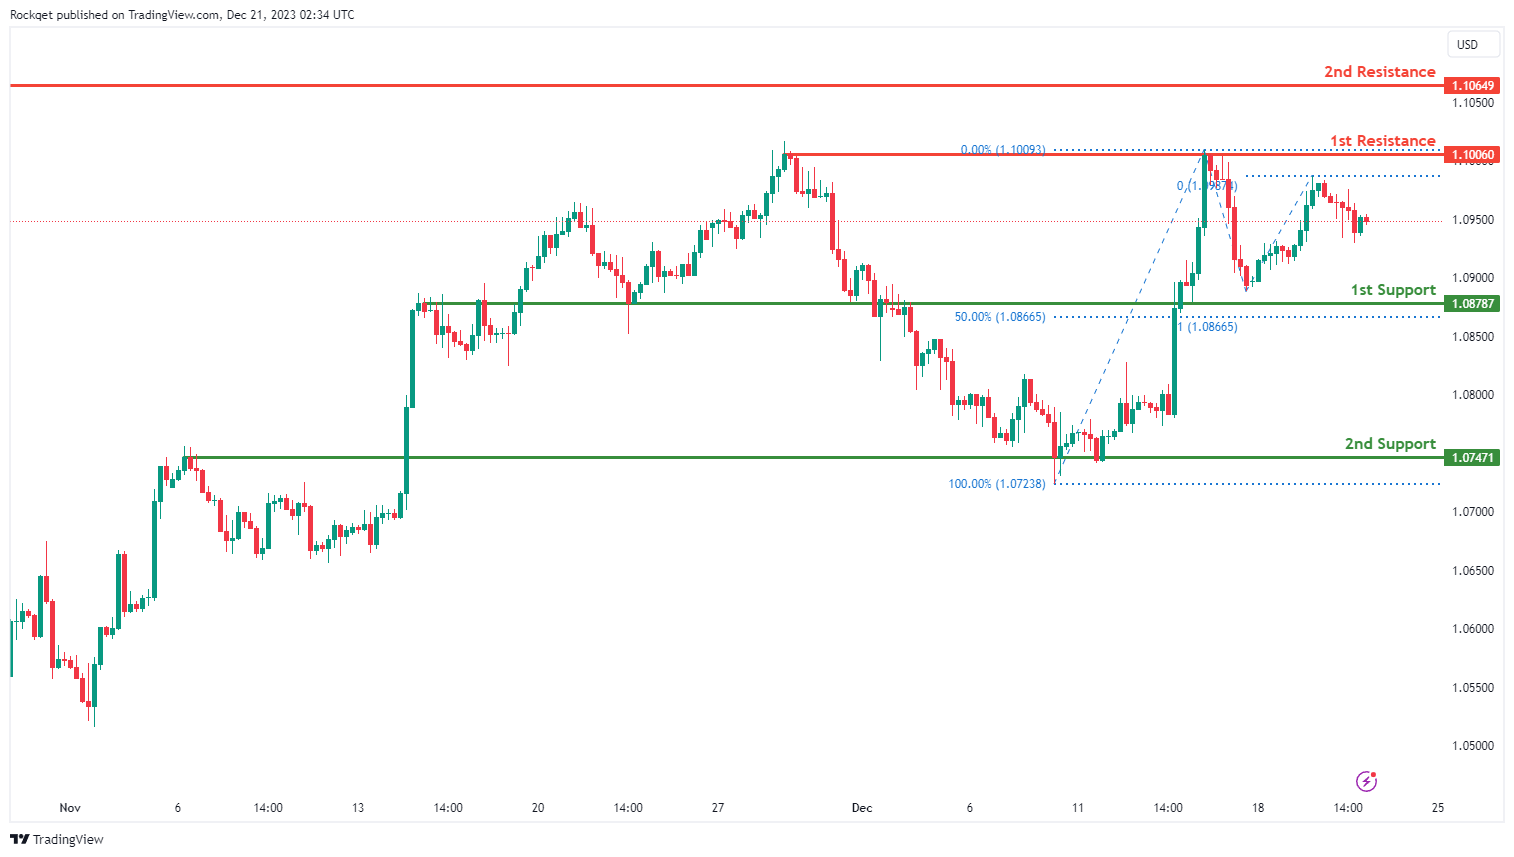
The EUR/USD chart currently exhibits an overall bullish momentum. In this context, there is a potential scenario for price to make a bullish continuation towards the 1st resistance.
The 1st resistance level at 1.1006 is identified as a multi-swing-high resistance. Higher up, the 2nd resistance level at 1.1064 is noted as a swing-high resistance, suggesting a potential barrier for further upside movement.
To the downside, the 1st support level at 1.0878 is identified as an overlap support that aligns close to the 50.00% Fibonacci retracement level. Further below, the 2nd support level at 1.0747 is also marked as an overlap support, further reinforcing its importance as a potential key support level.
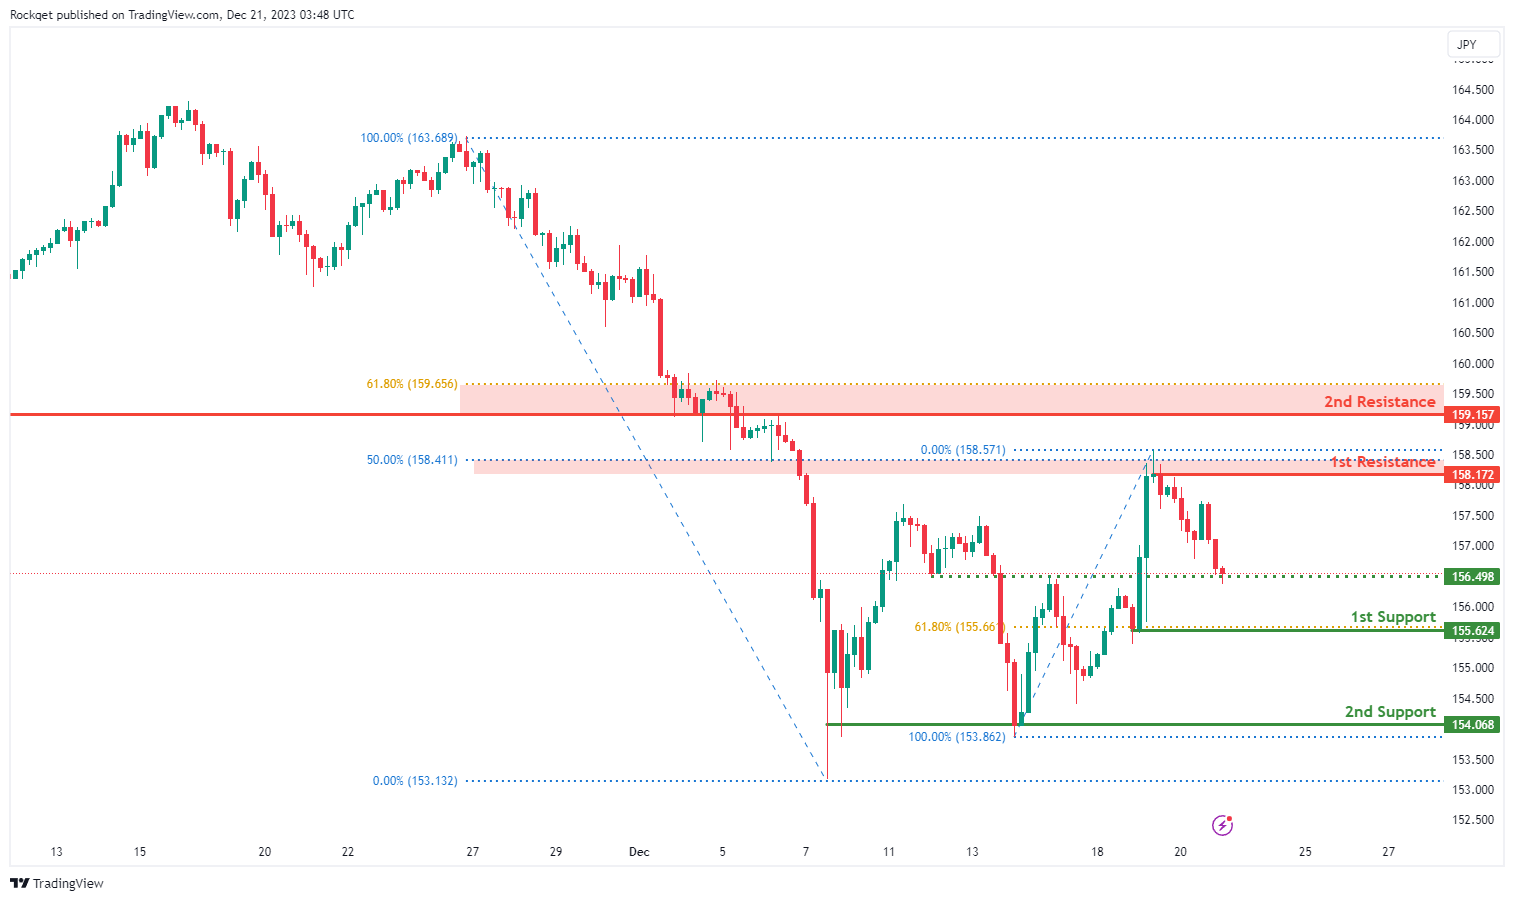
EUR/JPY:
The EUR/JPY chart currently exhibits a bearish overall momentum, suggesting a potential scenario for a bearish continuation towards the 1st support.
he 1st support at 155.62 is deemed significant as it is identified as a pullback support and aligns with the 61.80% Fibonacci Retracement level. This level represents a historical area where buying interest has been present, reinforcing its significance as a key support zone.
Additionally, the 2nd support at 154.07 is considered a multi-swing low support, providing an additional layer of potential support for the currency pair.
On the resistance side, the 1st resistance at 158.17 is associated with a pullback resistance and the 50% Fibonacci Retracement, indicating a level where selling interest could intensify, potentially causing a temporary pause or reversal in the bearish trend.
Furthermore, the 2nd resistance at 159.16 is linked to an overlap resistance and the 61.80% Fibonacci Retracement, presenting a potential challenge for the price to surpass these levels.
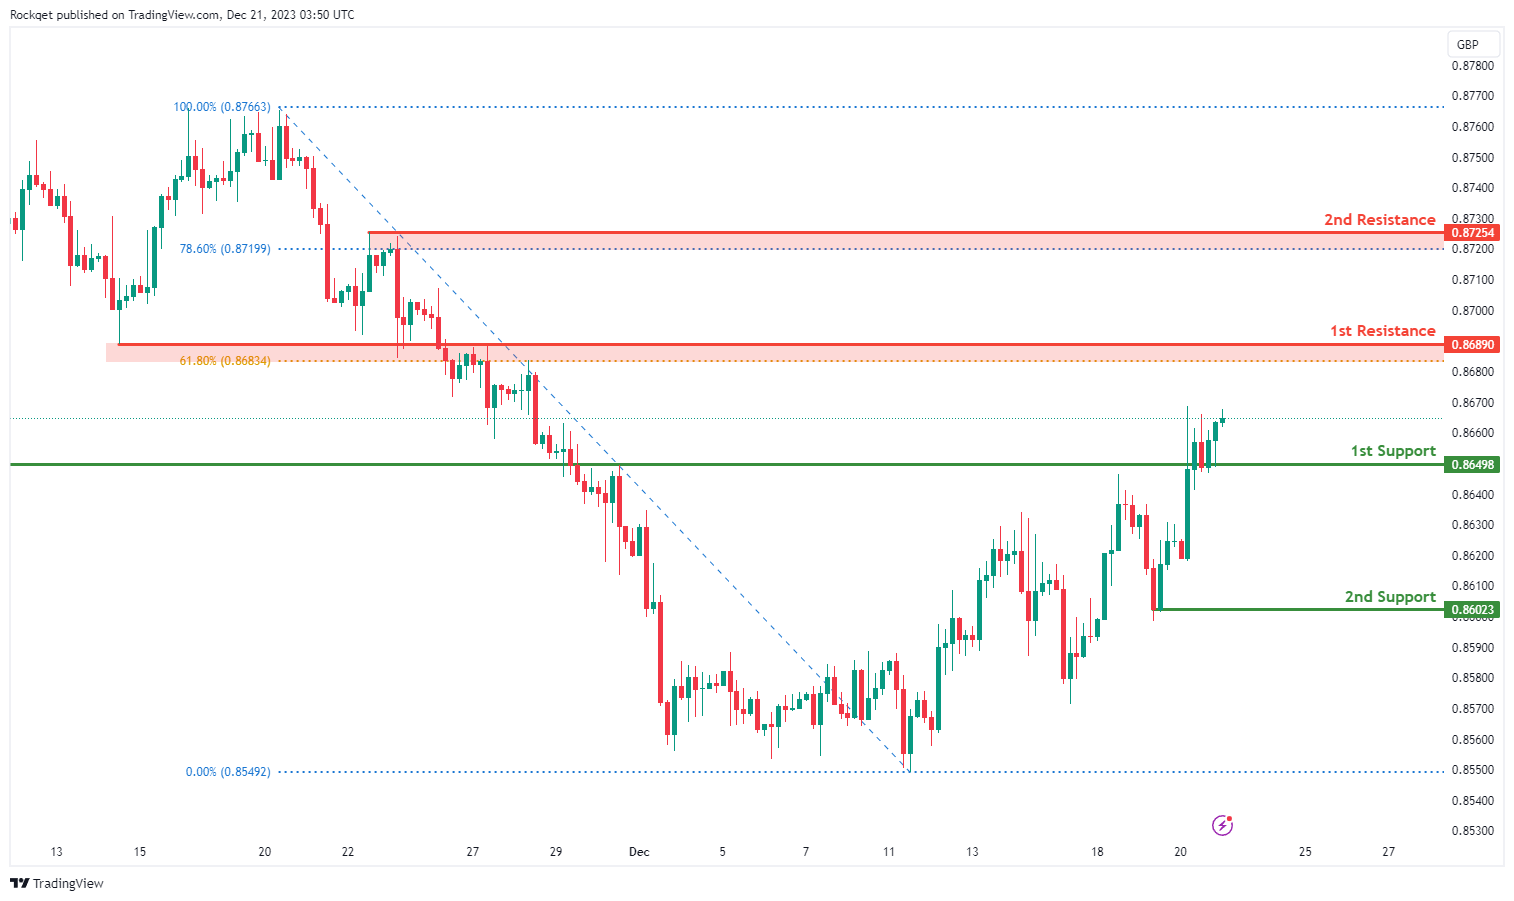
EUR/GBP:
The EUR/GBP chart currently exhibits a bullish overall momentum, indicating a potential scenario for a bullish continuation towards the 1st resistance.
The 1st support at 0.8650 is considered significant as it represents an overlap support. This level indicates a historical area where buying interest has been present, reinforcing its potential as a crucial support zone.
Additionally, the 2nd support at 0.8602 is identified as a pullback support, providing an extra layer of potential support for the currency pair.
On the resistance side, the 1st resistance at 0.8689 is associated with an overlap resistance and the 61.80% Fibonacci Retracement. This level may act as a barrier where selling interest could intensify, potentially causing a temporary pause or reversal in the bullish trend.
Furthermore, the 2nd resistance at 0.8725 is linked to a pullback resistance and the 78.60% Fibonacci Retracement, presenting an additional challenge for the price to surpass these levels.
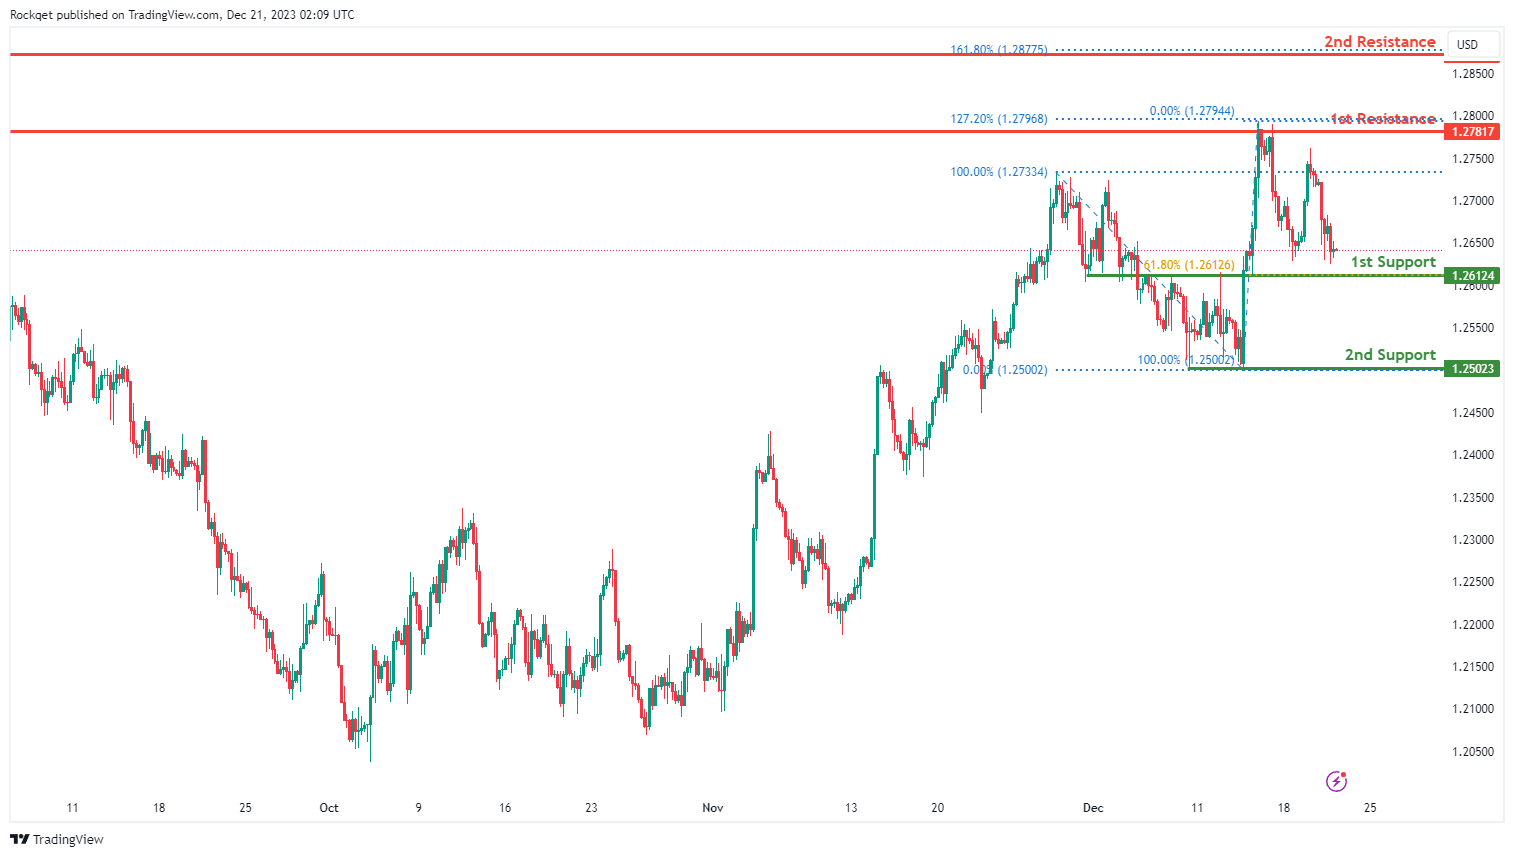
GBP/USD:
The GBP/USD chart currently exhibits an overall bearish momentum. In this context, there is a potential scenario for price to make a bearish continuation towards the 1st support.
The 1st support level at 1.2612 is identified as an overlap support that aligns with the 61.80% Fibonacci retracement level. Further below, the 2nd support level at 1.2502 is marked as a swing-low support, further reinforcing its importance as a potential key support level.
To the upside, the 1st resistance level at 1.2781 is identified as a multi-swing-high resistance that aligns with the 127.20% Fibonacci extension level. Higher up, the 2nd resistance level at 1.2872 is noted as a pullback resistance that aligns with the 161.80% Fibonacci extension level, suggesting a potential barrier for further upside movement.
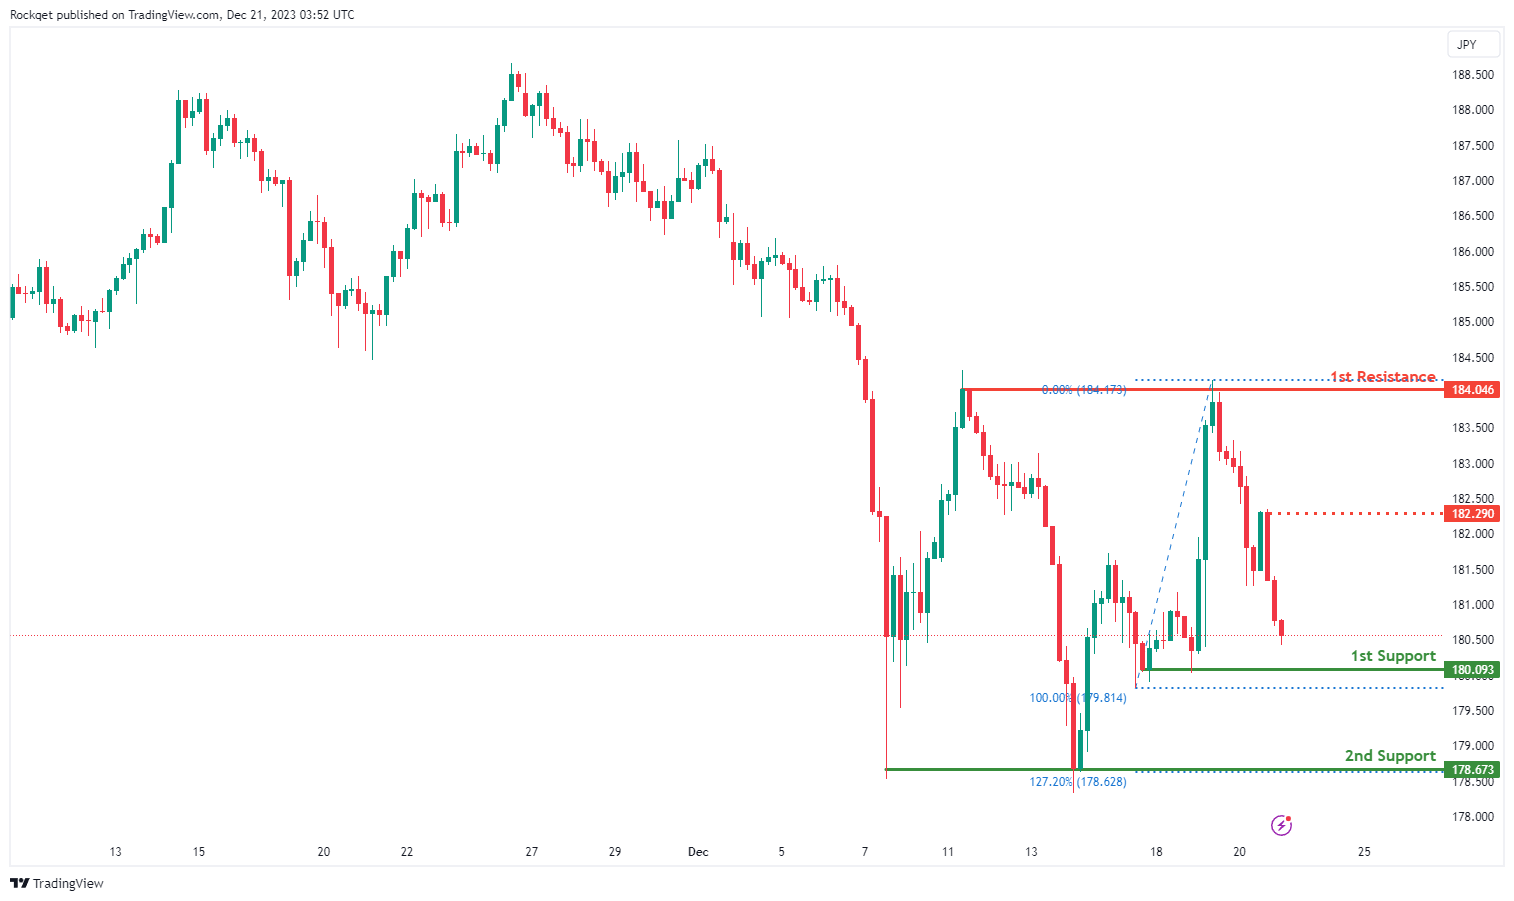
GBP/JPY:
The GBP/JPY chart currently exhibits a bearish overall momentum, suggesting a potential scenario for a bearish continuation towards the 1st support.
The 1st support at 180.09 is considered significant as it represents a pullback support. This level indicates a historical area where buying interest has been present, reinforcing its potential as a crucial support zone.
Additionally, the 2nd support at 178.67 is identified as a multi-swing low support and is associated with the 127.20% Fibonacci Extension, providing an additional layer of potential support for the currency pair.
On the resistance side, the intermediate resistance at 182.29 is linked to a pullback resistance. This level may act as a barrier where selling interest could intensify, potentially causing a temporary pause or reversal in the bearish trend.
Furthermore, the 1st resistance at 184.05 is associated with a multi-swing high resistance, presenting an additional challenge for the price to surpass these levels.
USD/CHF:
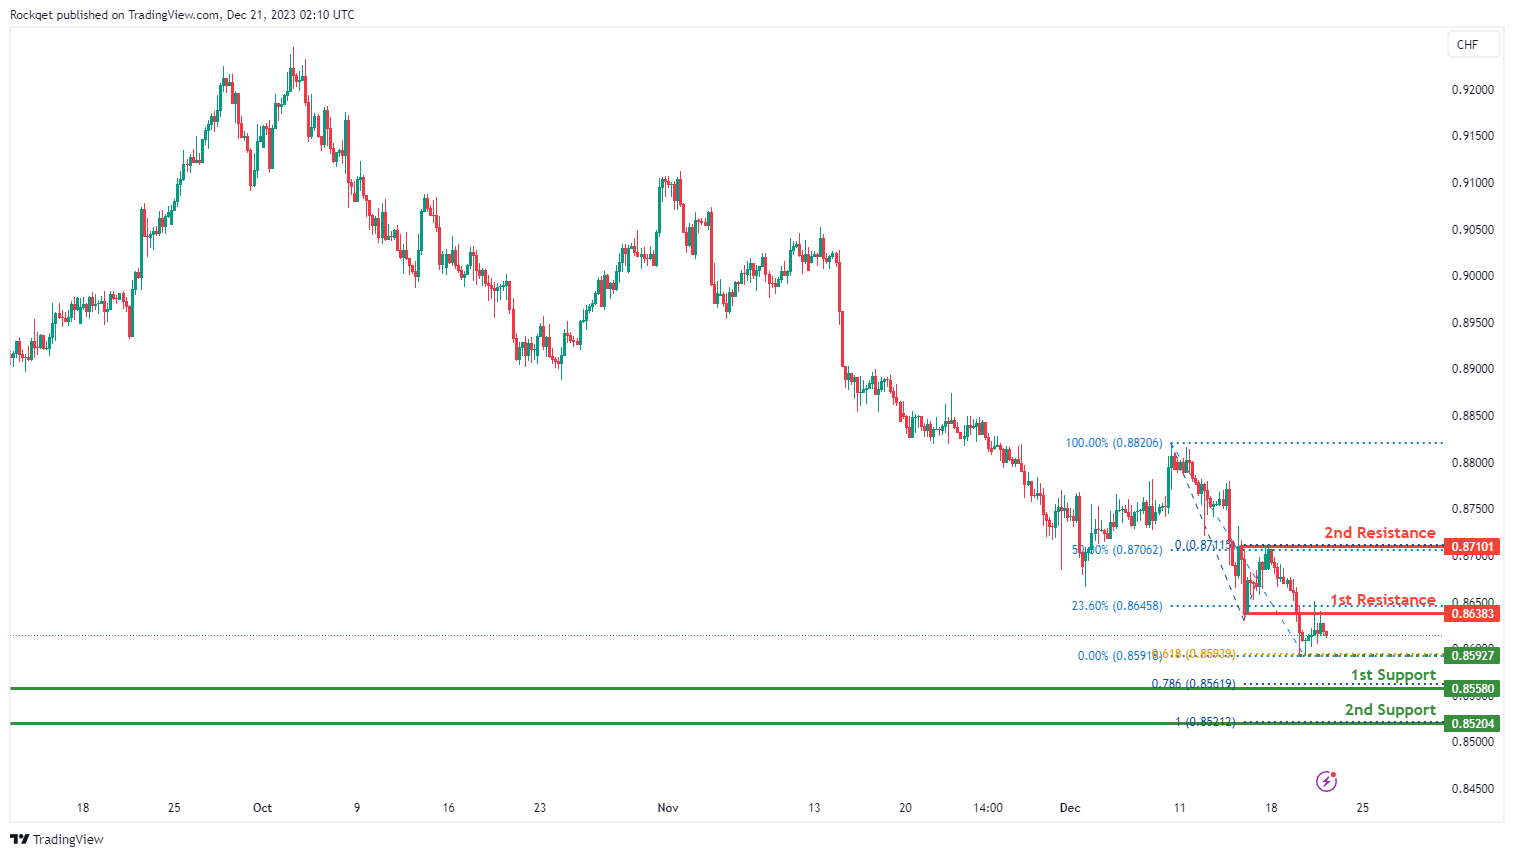
The USD/CHF chart currently exhibits an overall bearish momentum. In this context, there is a potential scenario for price to make a bearish continuation towards the 1st support.
The intermediate support level at 0.8592 is identified as a pullback support that aligns with the 61.80% Fibonacci projection level while the 1st support level at 0.8558 is marked as a multi-swing-low support that aligns with the 78.60% Fibonacci projection level. Further below, the 2nd support level at 0.8520 is noted as a swing-low support that aligns with the 100.00% Fibonacci projection level, further reinforcing its importance as a key support level.
To the upside, the 1st resistance level at 0.8638 is identified as a pullback resistance that aligns close to the 23.60% Fibonacci retracement level. Higher up, the 2nd resistance level at 0.8710 is also marked as a pullback resistance that aligns with the 50.00% Fibonacci retracement level, suggesting a potential barrier for further upside movement.
USD/JPY:
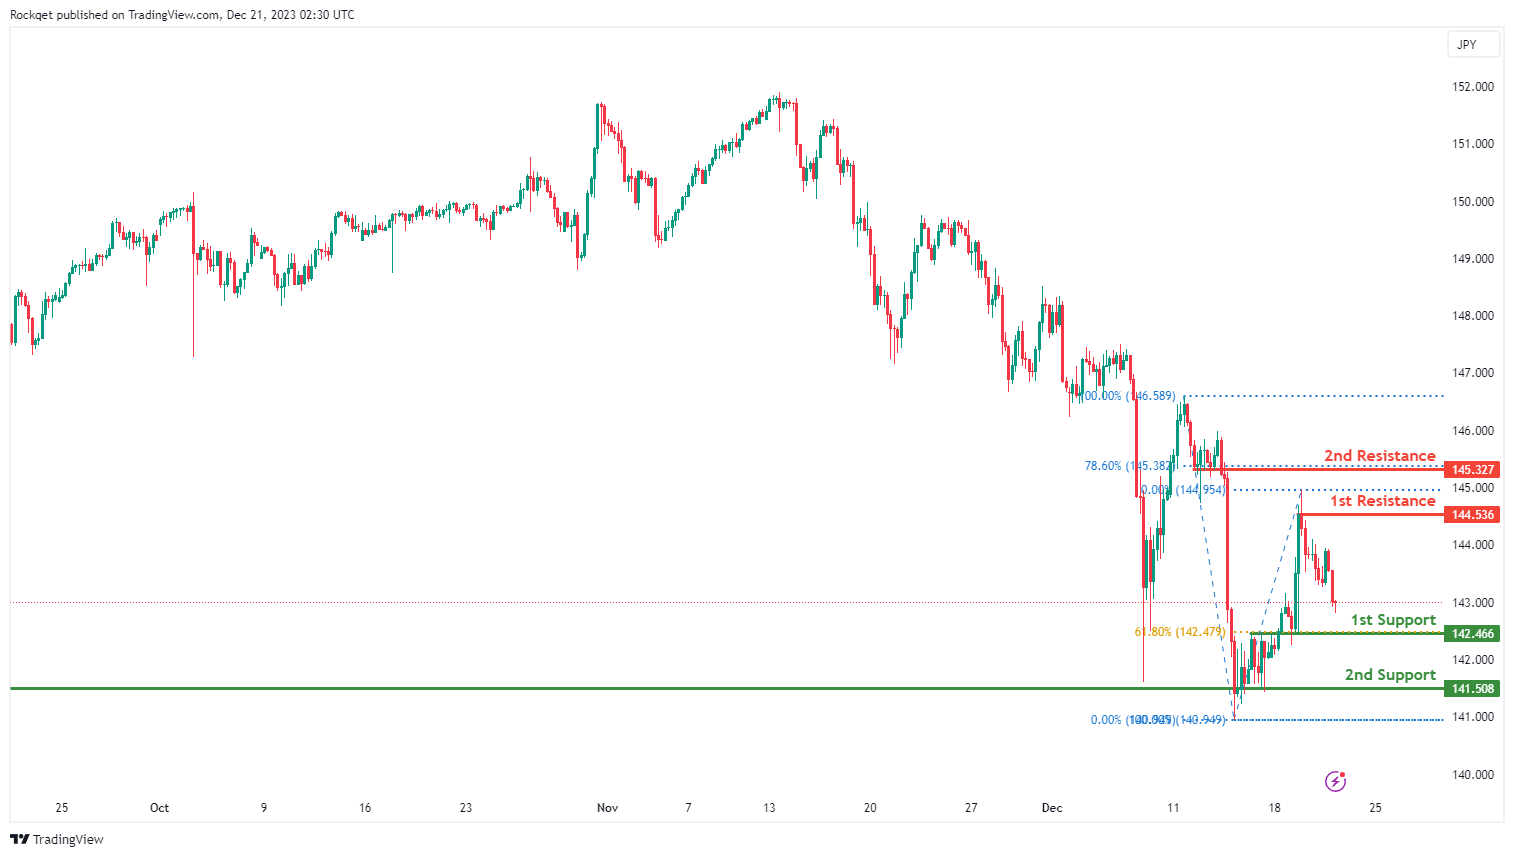
The USD/JPY chart currently exhibits an overall bearish momentum, indicating a potential for price to make a bearish continuation towards the 1st support.
The 1st support level at 142.46 is identified as an overlap support that aligns with the 61.80% Fibonacci retracement level. Further below, the 2nd support level at 141.50 is noted as a multi-swing-low support, further reinforcing its importance as a key support level.
To the upside, the 1st resistance level at 144.53 is identified as a pullback resistance. Higher up, the 2nd resistance level at 145.32 is also marked as a pullback resistance that aligns with the 78.60% Fibonacci retracement level, suggesting a potential barrier for further upside movement.
USD/CAD:
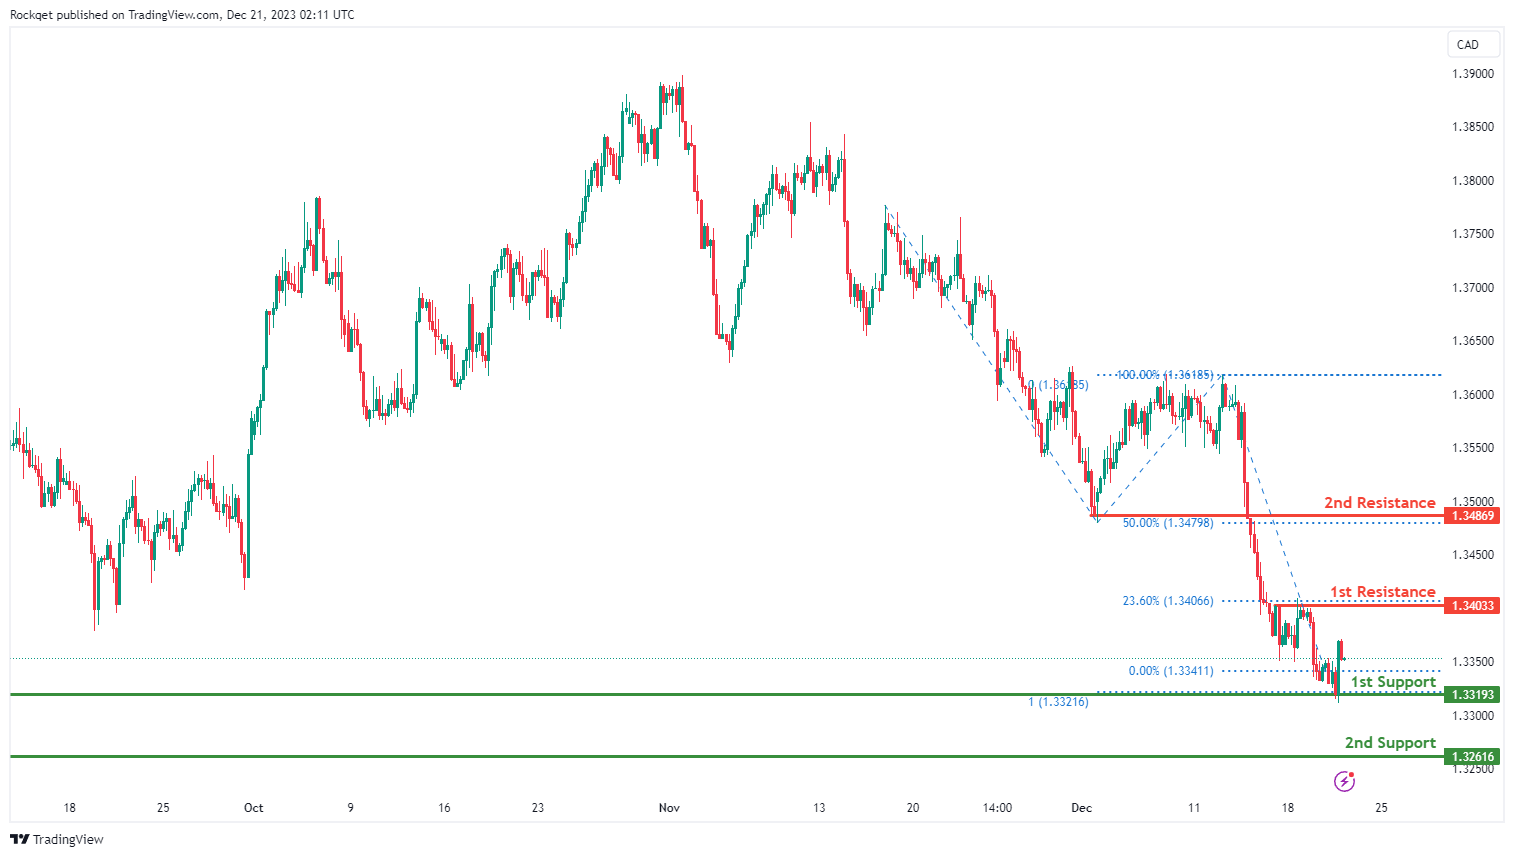
The USD/CAD chart currently exhibits an overall bearish momentum, indicating a potential for a drop towards the 1st support.
The 1st support level at 1.3319 is identified as a pullback support that aligns with the 100.00% Fibonacci projection level. Further below, the 2nd support level at 1.3261 is noted as an overlap support, further reinforcing its importance as a key support level.
To the upside, the 1st resistance level at 1.3403 is identified as a pullback resistance that aligns with the 23.60% Fibonacci retracement level. Higher up, the 2nd resistance level at 1.3486 is also marked as a pullback resistance that aligns with the 50.00% Fibonacci retracement level, suggesting a potential barrier for further upside movement.
AUD/USD:
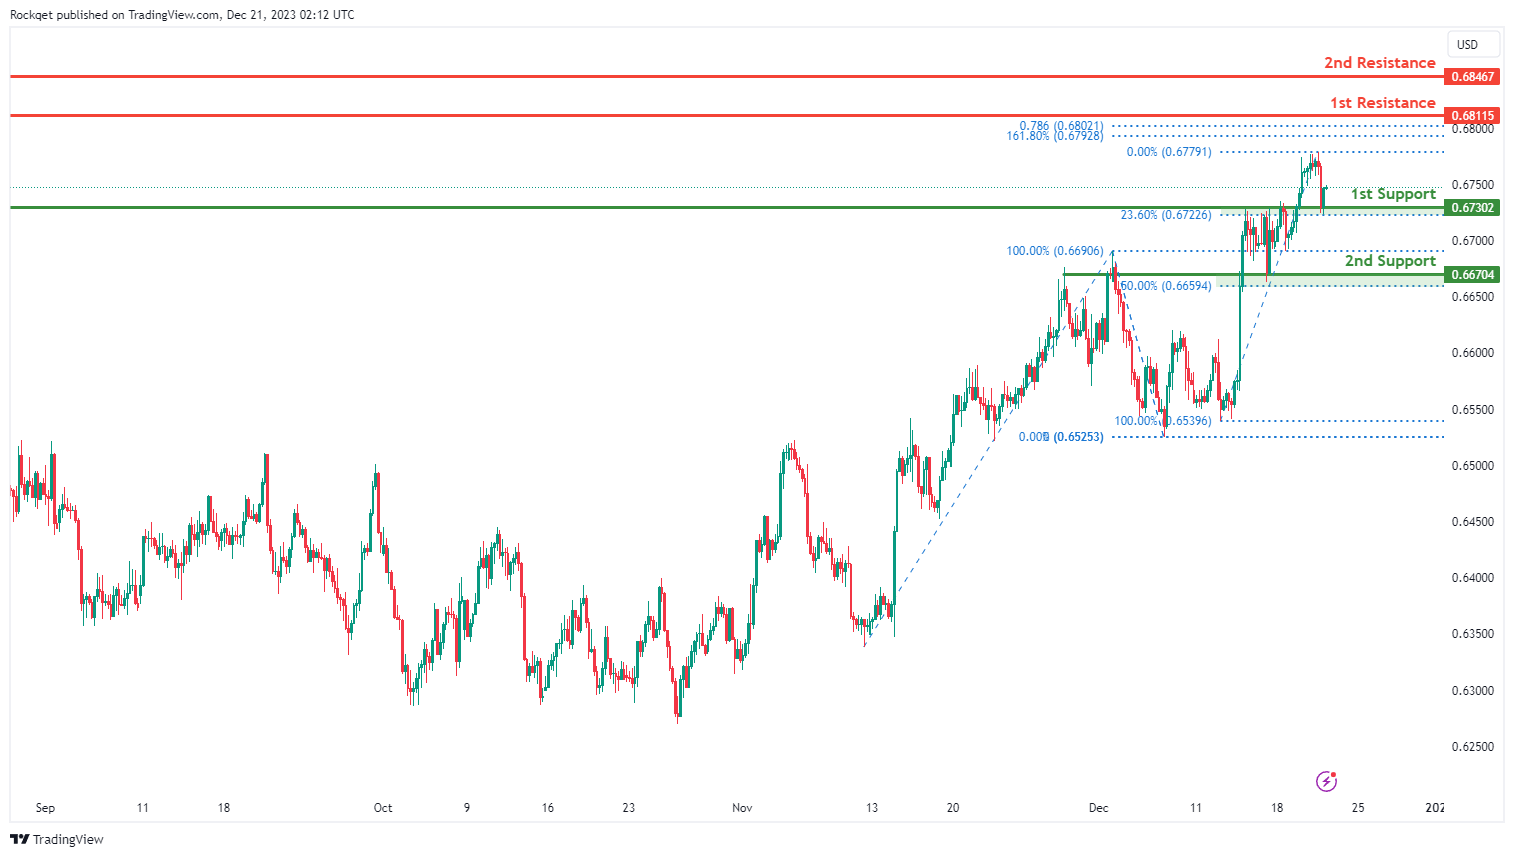
The AUD/USD chart currently exhibits an overall bullish momentum. In this context, there is a potential scenario for price to make a bullish continuation towards the 1st resistance.
The 1st resistance level at 0.6811 is identified as a swing-high resistance that aligns with a confluence of Fibonacci levels i.e. the 161.80% extension and the 78.60% projection levels. Higher up, the 2nd resistance level at 0.6846 is also noted as a swing-high resistance, indicating its potential significance as a barrier for further upward movement.
To the downside, the 1st support level at 0.6730 is identified as an overlap support that aligns with the 23.60% Fibonacci retracement level. Further below, the 2nd support level at 0.6670 is also marked as an overlap support that aligns close to the 50.00% Fibonacci retracement level, further reinforcing its importance as a key support level.
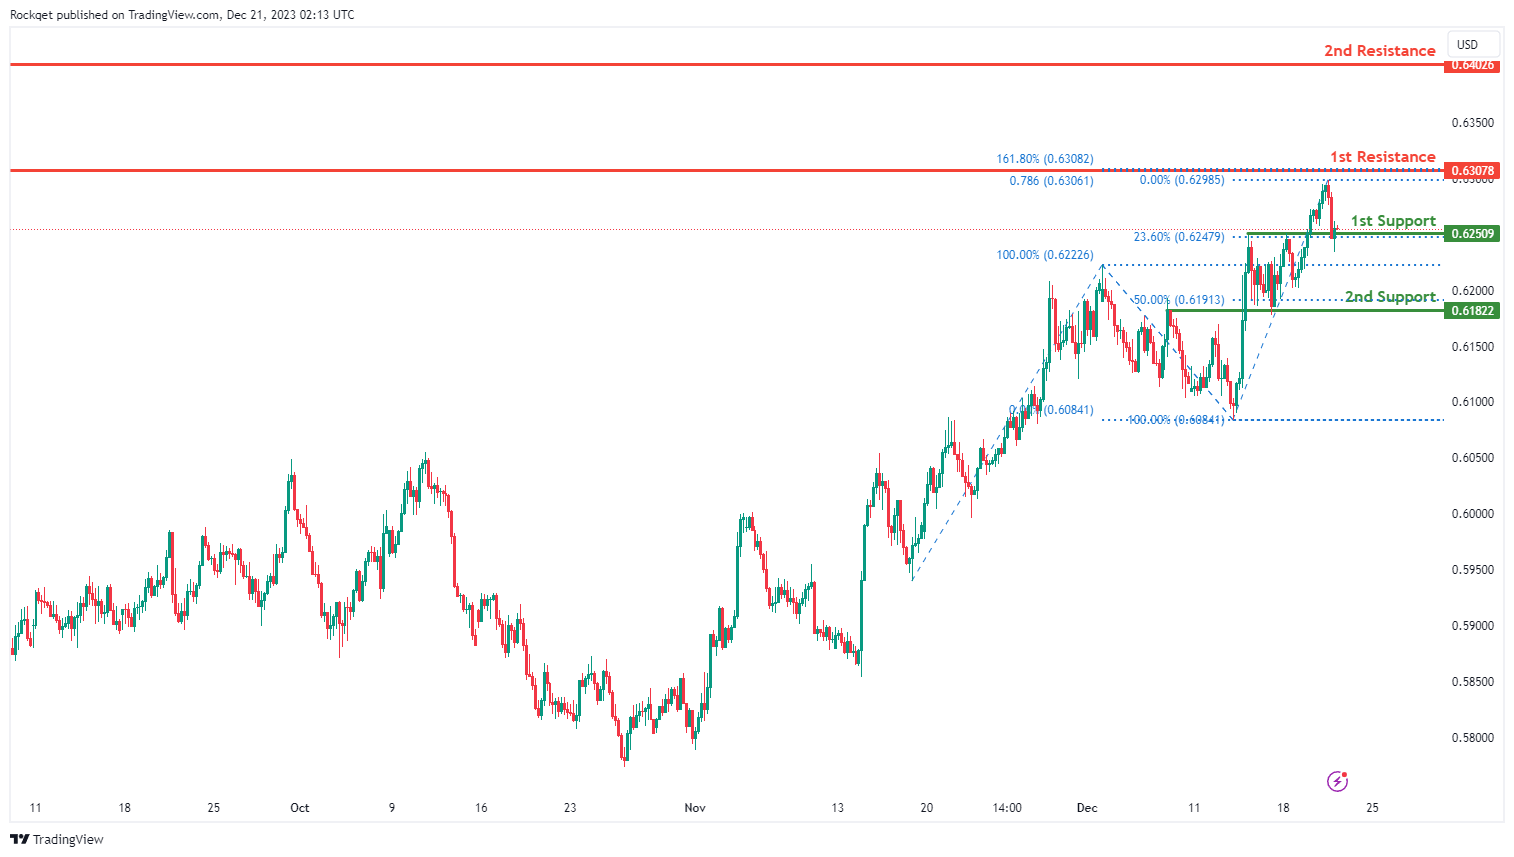
NZD/USD
The NZD/USD chart currently exhibits an overall bullish momentum. In this context, there is a potential scenario for price to make a bullish bounce off the 1st support and rise towards the 1st resistance.
The 1st support level at 0.6250 is identified as an overlap support that aligns with the 23.60% Fibonacci retracement level. Further below, the 2nd support level at 0.6182 is also noted as an overlap support that aligns close to the 50.00% Fibonacci retracement level, further reinforcing its importance as a key support level.
To the upside, the 1st resistance level at 0.6307 is identified as a swing-high resistance that aligns with a confluence of Fibonacci levels i.e. the 161.80% extension and the 78.60% projection levels. Higher up, the 2nd resistance level at 0.6402 is also marked as a swing-high resistance, indicating its potential significance as a barrier for further upward movement.
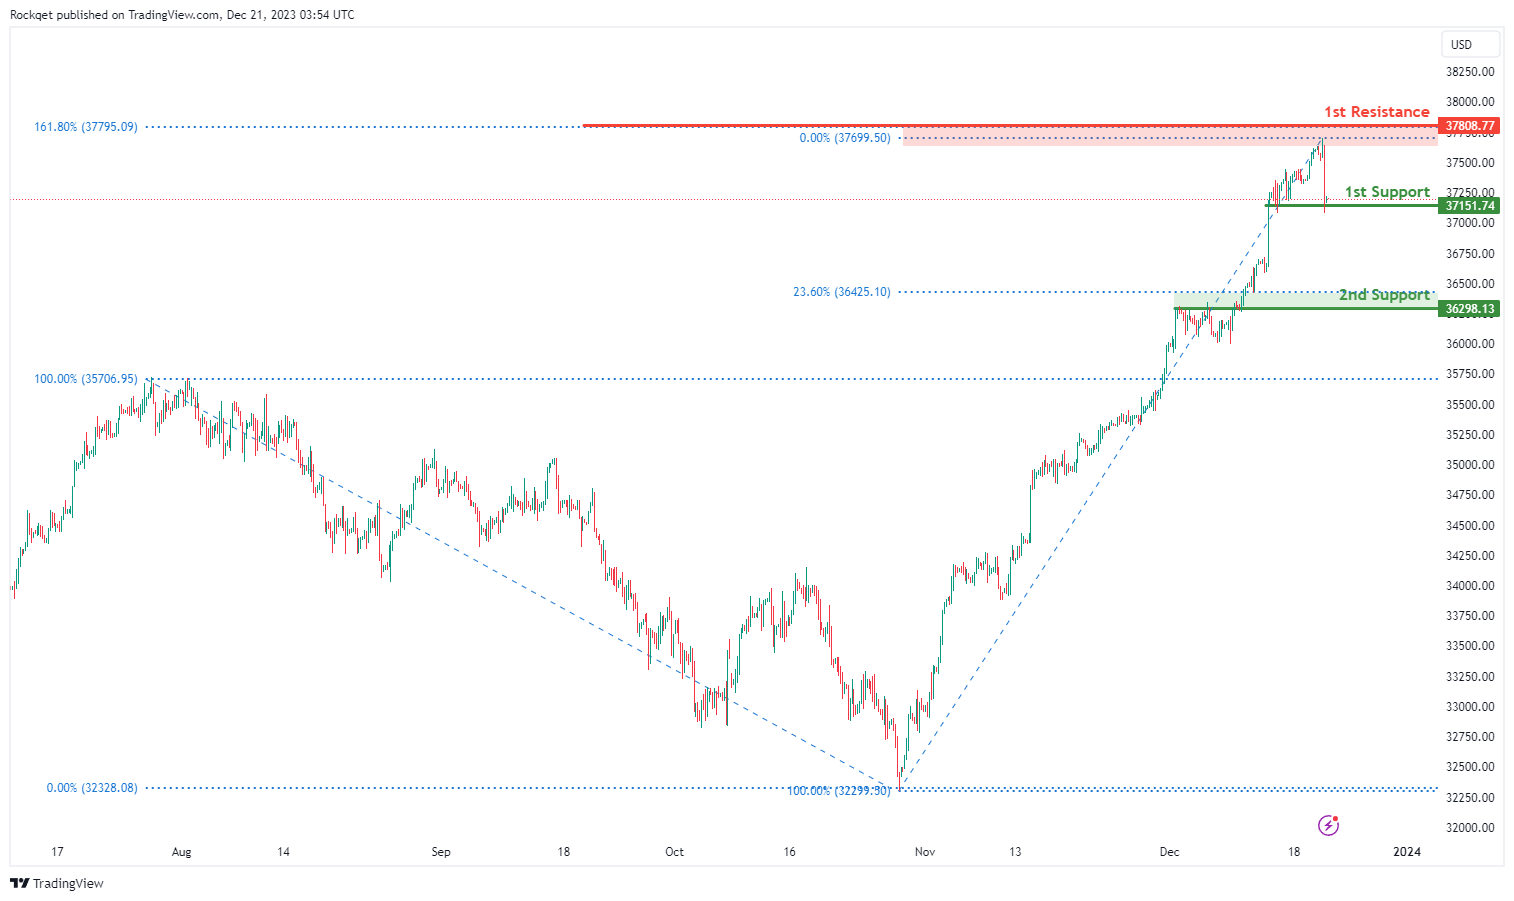
DJ30:
The DJ30 chart currently exhibits a bullish overall momentum, indicating a potential scenario for a bullish bounce off the 1st support and a subsequent move towards the 1st resistance.
The 1st support at 37151.74 is considered significant as it represents an overlap support, signifying a historical area where buying interest has been present. This reinforces its potential as a crucial support zone for the index.
Additionally, the 2nd support at 36298.13 is identified as both an overlap support and associated with the 23.60% Fibonacci Retracement, providing an additional layer of potential support.
On the resistance side, the 1st resistance at 37808.77 is linked to the 161.80% Fibonacci Extension. This level may act as a barrier where selling interest could intensify, potentially causing a temporary pause or reversal in the bullish trend.
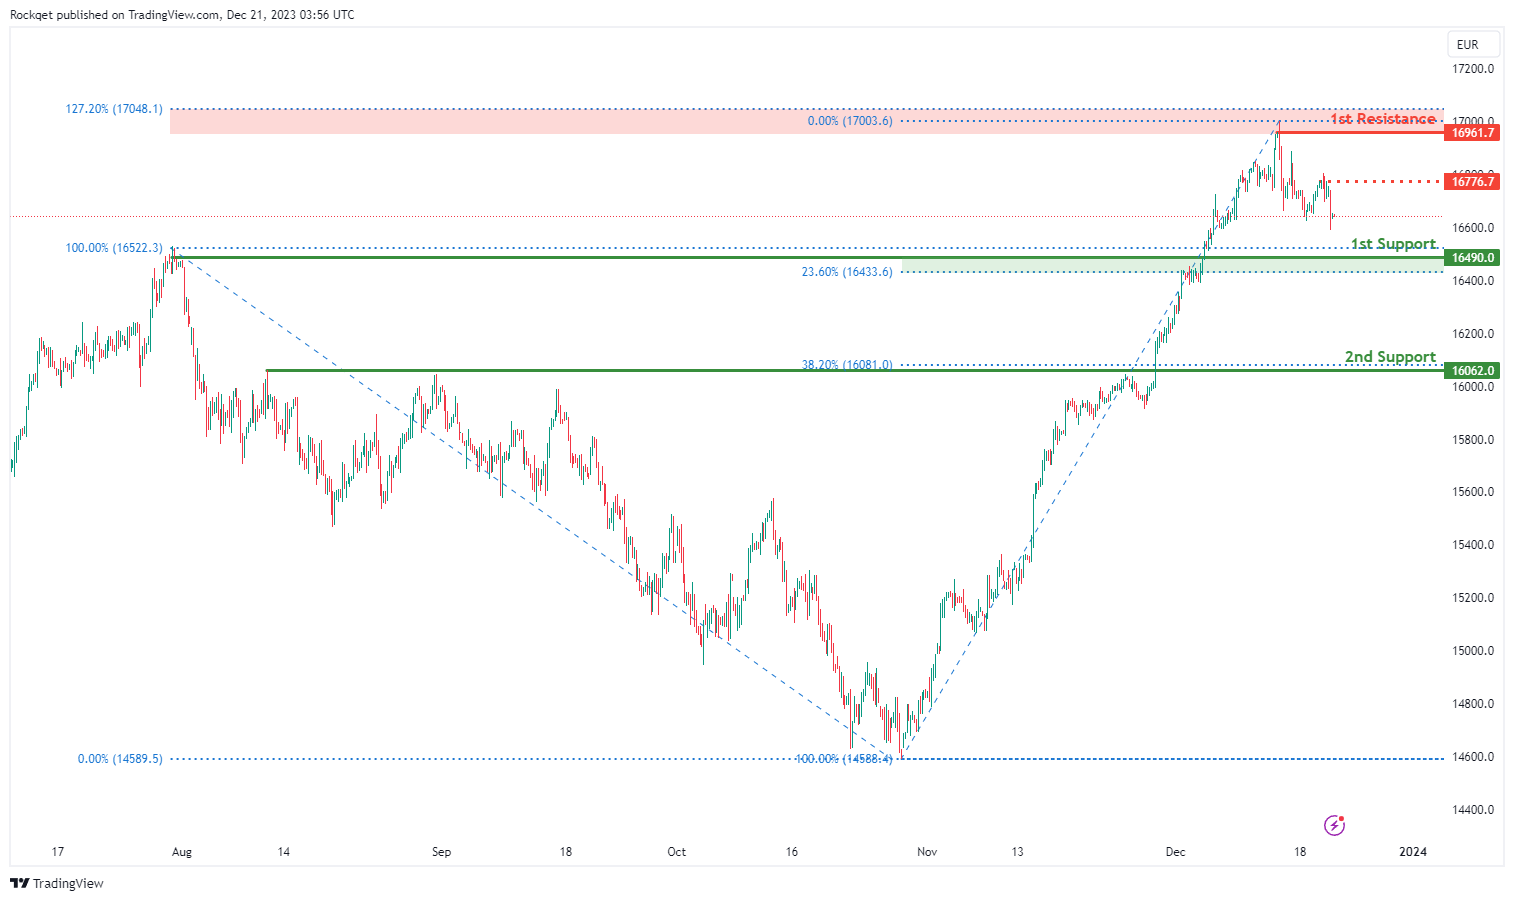
GER40:
The GER40 chart currently demonstrates a neutral overall momentum, with factors contributing to this state. As a result, the price could potentially make fluctuations between the 1st resistance and 1st support levels.
The 1st support at 16490.00 is considered significant as it represents an overlap support and is associated with the 23.60% Fibonacci Retracement. This level indicates a historical area where buying interest has been present, reinforcing its potential as a crucial support zone.
Additionally, the 2nd support at 16062.00 is identified as a pullback support and is linked to the 38.20% Fibonacci Retracement, providing an additional layer of potential support for the index.
On the resistance side, the intermediate resistance at 16776.70 is associated with a pullback resistance, indicating a level where selling interest could intensify.
Furthermore, the 1st resistance at 16961.70 is linked to a swing high resistance and the 127.20% Fibonacci Extension, highlighting a potential challenge for the price to surpass these levels.
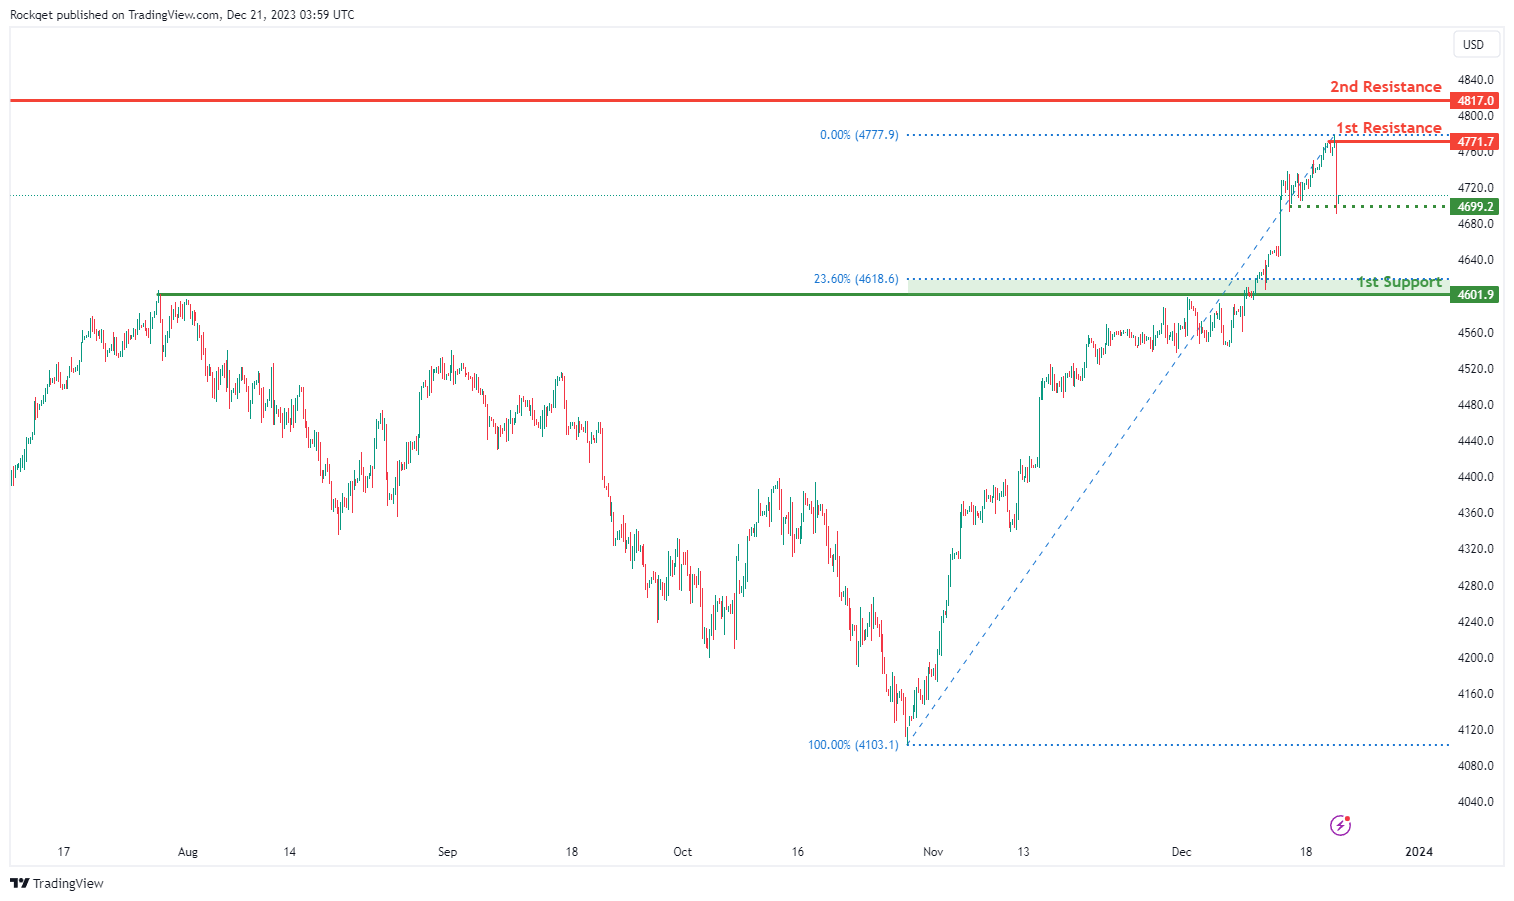
US500:
The US500 chart currently demonstrates a bullish overall momentum, with several factors contributing to this positive sentiment. As a result, the price could potentially make a bullish continuation towards the 1st resistance.
The intermediate support at 4699.2 is considered significant as it represents a multi-swing low support, indicating a historical area where buying interest has been present.
Additionally, the 1st support at 4601.9 is identified as an overlap support and is associated with the 23.60% Fibonacci Retracement, providing an additional layer of potential support for the index.
On the resistance side, the 1st resistance at 4771.7 is linked to a swing high resistance, and the 2nd resistance at 4817.0 is also associated with a swing high resistance. These levels represent potential barriers where selling interest could intensify, potentially causing a temporary pause or reversal in the bullish trend.
BTC/USD:
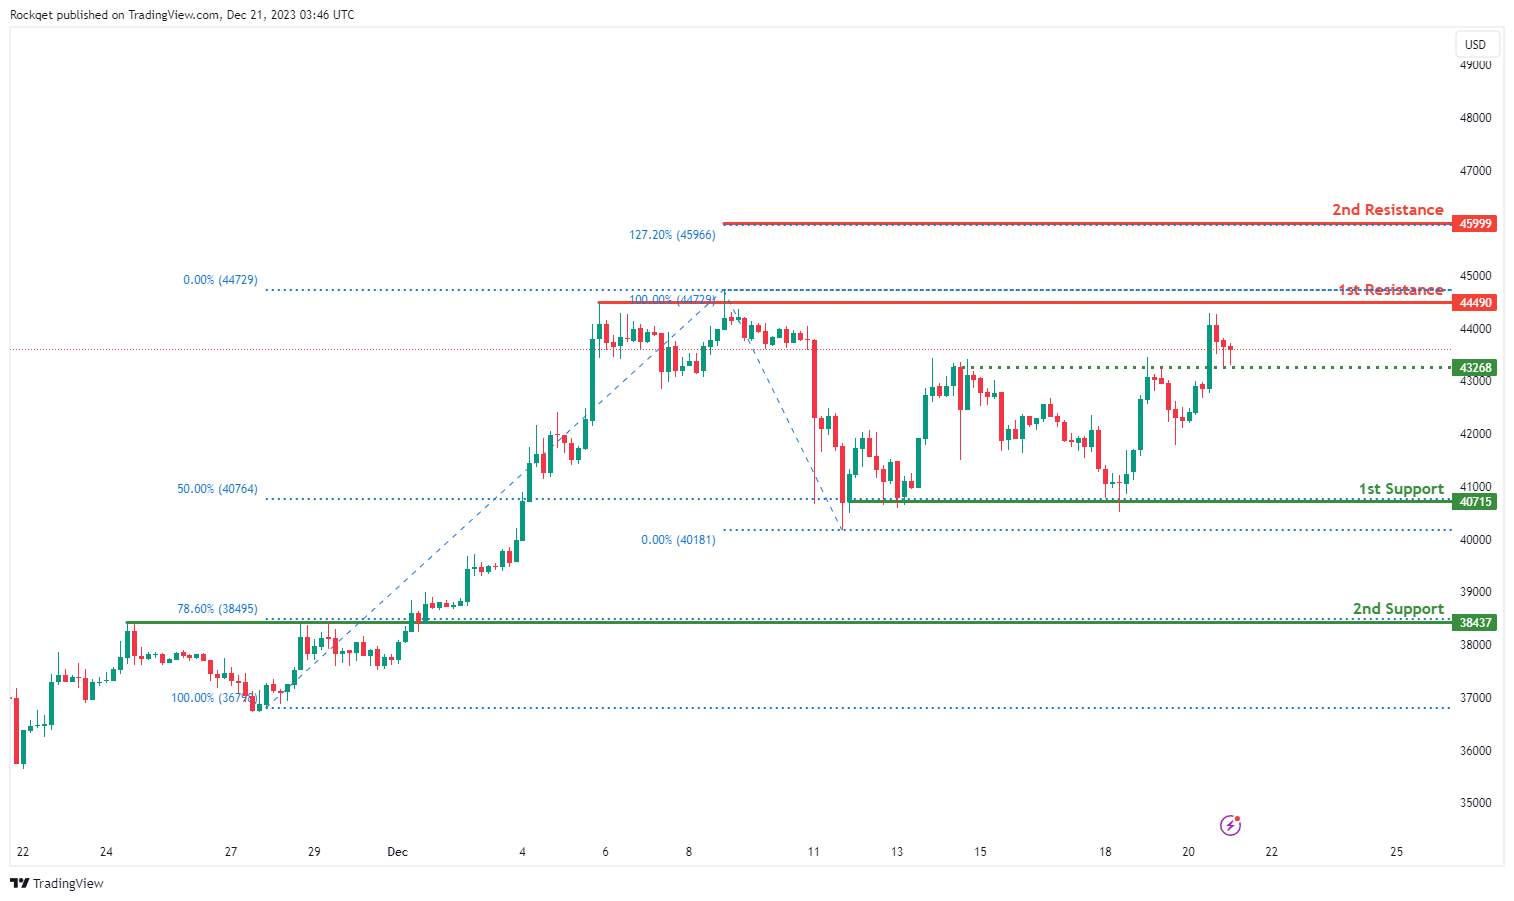
The BTC/USD chart currently demonstrates a bullish overall momentum, suggesting a potential scenario for a bullish continuation towards the 1st resistance.
The 1st support at 40715 is noteworthy as it corresponds to a swing low support and aligns with the 50% Fibonacci Retracement level. This level indicates a historical area where buying interest has been prevalent, reinforcing its significance as a crucial support zone.
Additionally, the 2nd support at 38437 is identified as an overlap support and is associated with the 78.60% Fibonacci Retracement, providing an additional layer of potential support for the cryptocurrency.
On the resistance side, the 1st resistance at 44490 is linked to a swing high resistance, marking a level where selling interest could intensify, potentially causing a temporary pause or reversal in the bullish trend.
Furthermore, the 2nd resistance at 45999 is associated with the 127.20% Fibonacci Extension, presenting a potential challenge for the price to surpass these levels.
ETH/USD:
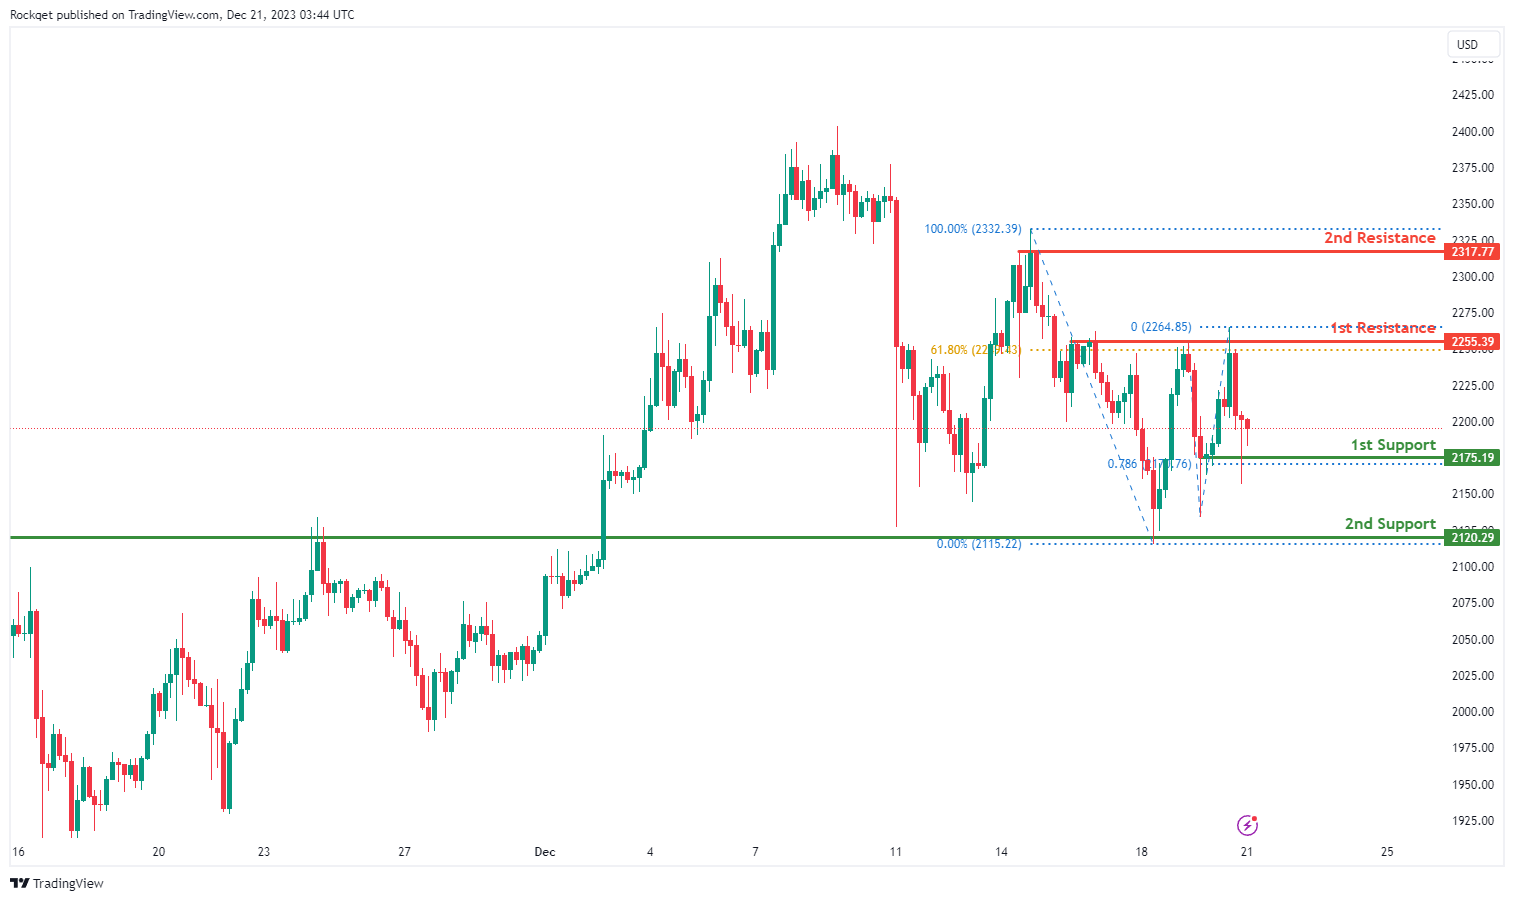
The ETH/USD chart currently exhibits a bearish overall momentum, suggesting a potential scenario for a bearish continuation towards the 1st support.
The 1st support at 2175.19 is significant as it is identified as a pullback support and coincides with the 78.60% Fibonacci Retracement level. This level indicates a historical area where buying interest has been present, reinforcing its importance as a key support zone.
Additionally, the 2nd support at 2120.29 is considered a swing low support, providing an additional layer of potential support for the cryptocurrency.
On the resistance side, the 1st resistance at 2255.39 is associated with a pullback resistance and the 61.80% Fibonacci Retracement, indicating a level where selling interest could intensify, potentially causing a temporary pause or reversal in the bearish trend.
Furthermore, the 2nd resistance at 2317.77 is linked to a swing high resistance and the 100% Fibonacci Retracement, presenting a potential challenge for the price to surpass these levels.
WTI/USD:
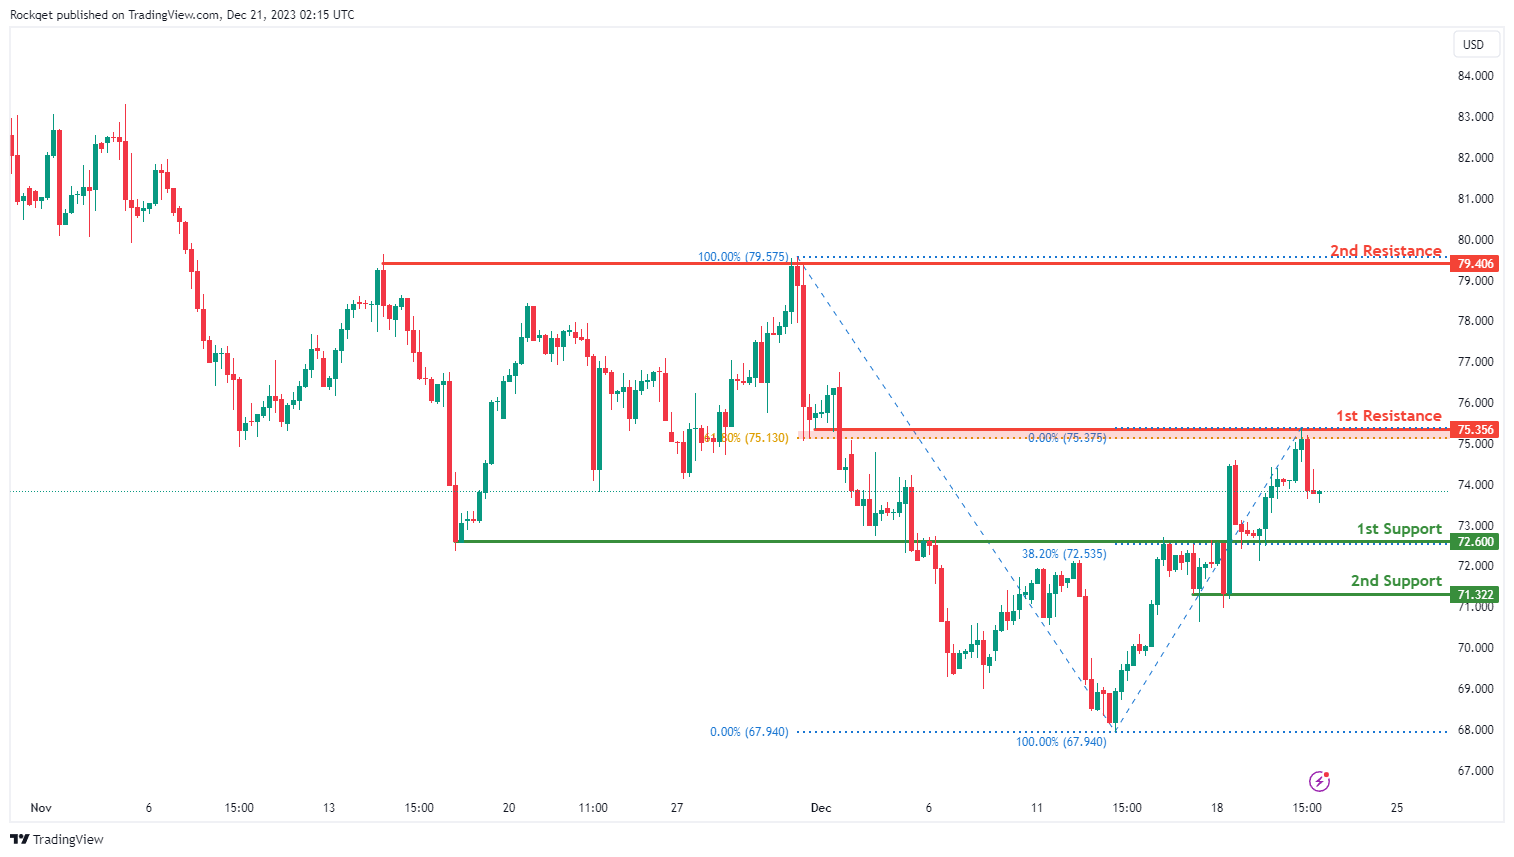
The WTI chart currently exhibits an overall bullish momentum, suggesting a prevailing uptrend. In this context, there is a potential scenario for price to make a bullish continuation towards the 1st resistance.
The 1st resistance level at 75.35 is identified as an overlap resistance that aligns close to the 61.80% Fibonacci retracement level. Higher up, the 2nd resistance level at 79.40 is noted as a multi-swing-high resistance, further indicating its potential significance as a barrier for further upward movement.
To the downside, the 1st support level at 72.60 is identified as an overlap support that aligns with the 38.20% Fibonacci retracement level. Further below, the 2nd support level at 71.32 is marked as a pullback support, reinforcing its importance as a key support level.
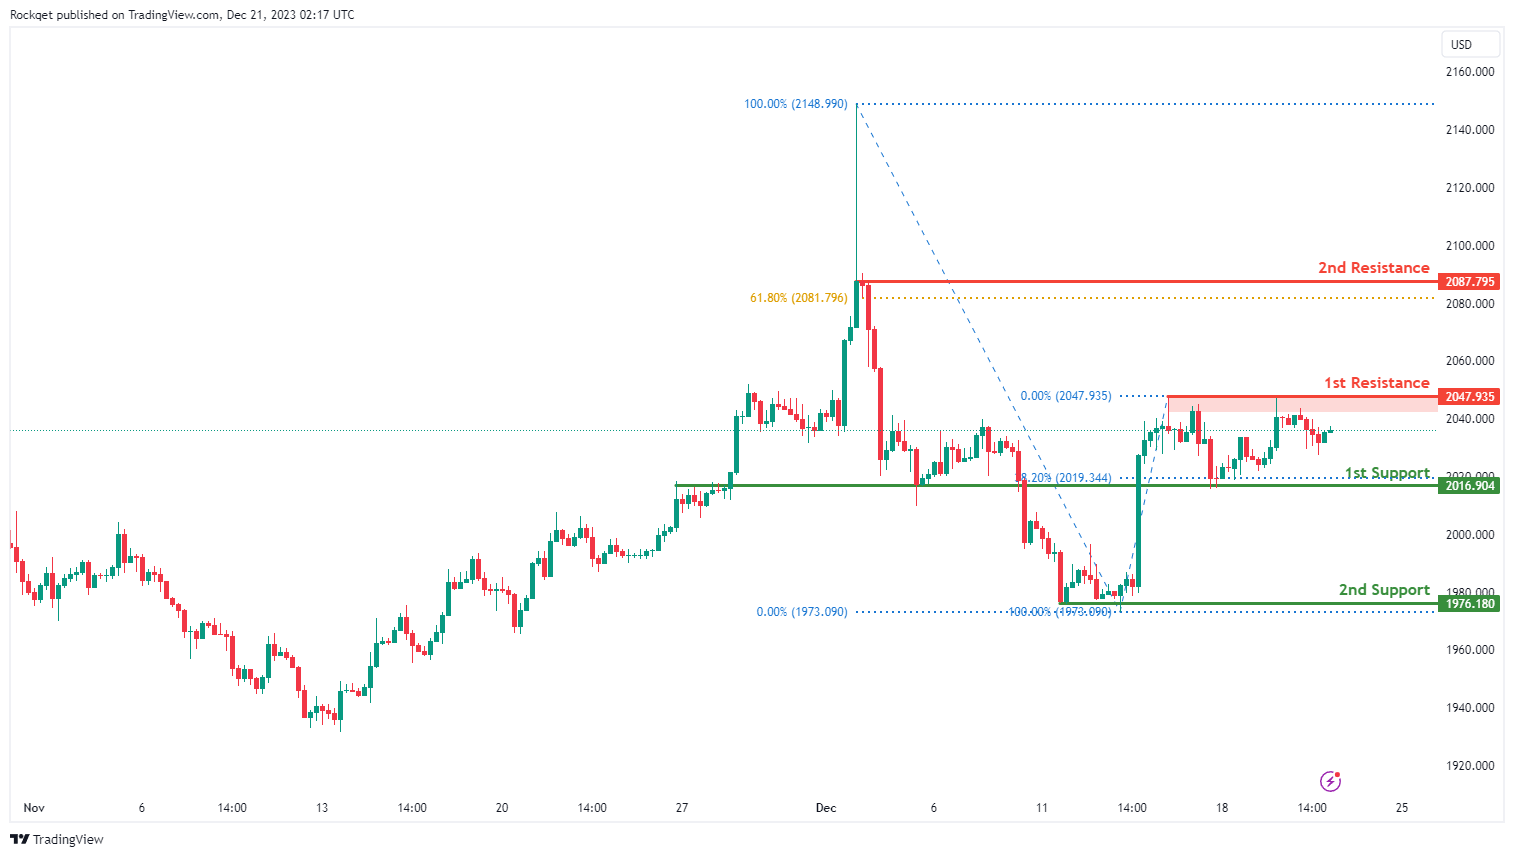
XAU/USD (GOLD):
The XAU/USD chart currently demonstrates a neutral momentum, indicating a potential for price to fluctuate between the 1st support and the 1st resistance.
The 1st support level at 2,016.90 is identified as an overlap support that aligns with the 38.20% Fibonacci retracement level. Further below, the 2nd support level at 1,976.18 is noted as a pullback support, reinforcing its importance as a key support level.
To the upside, the 1st resistance level at 2,047.93 is identified as a pullback resistance. Higher up, the 2nd resistance level at 2,087.79 is also marked as a pullback resistance that aligns close to the 61.80% Fibonacci retracement level, further indicating its potential significance as a barrier for further upward movement.