Sample Category Title
GER 40 Index Near New Highs at the End of 2023
- GER 40 looks strongly bullish
- However, RSI suggests overbought market
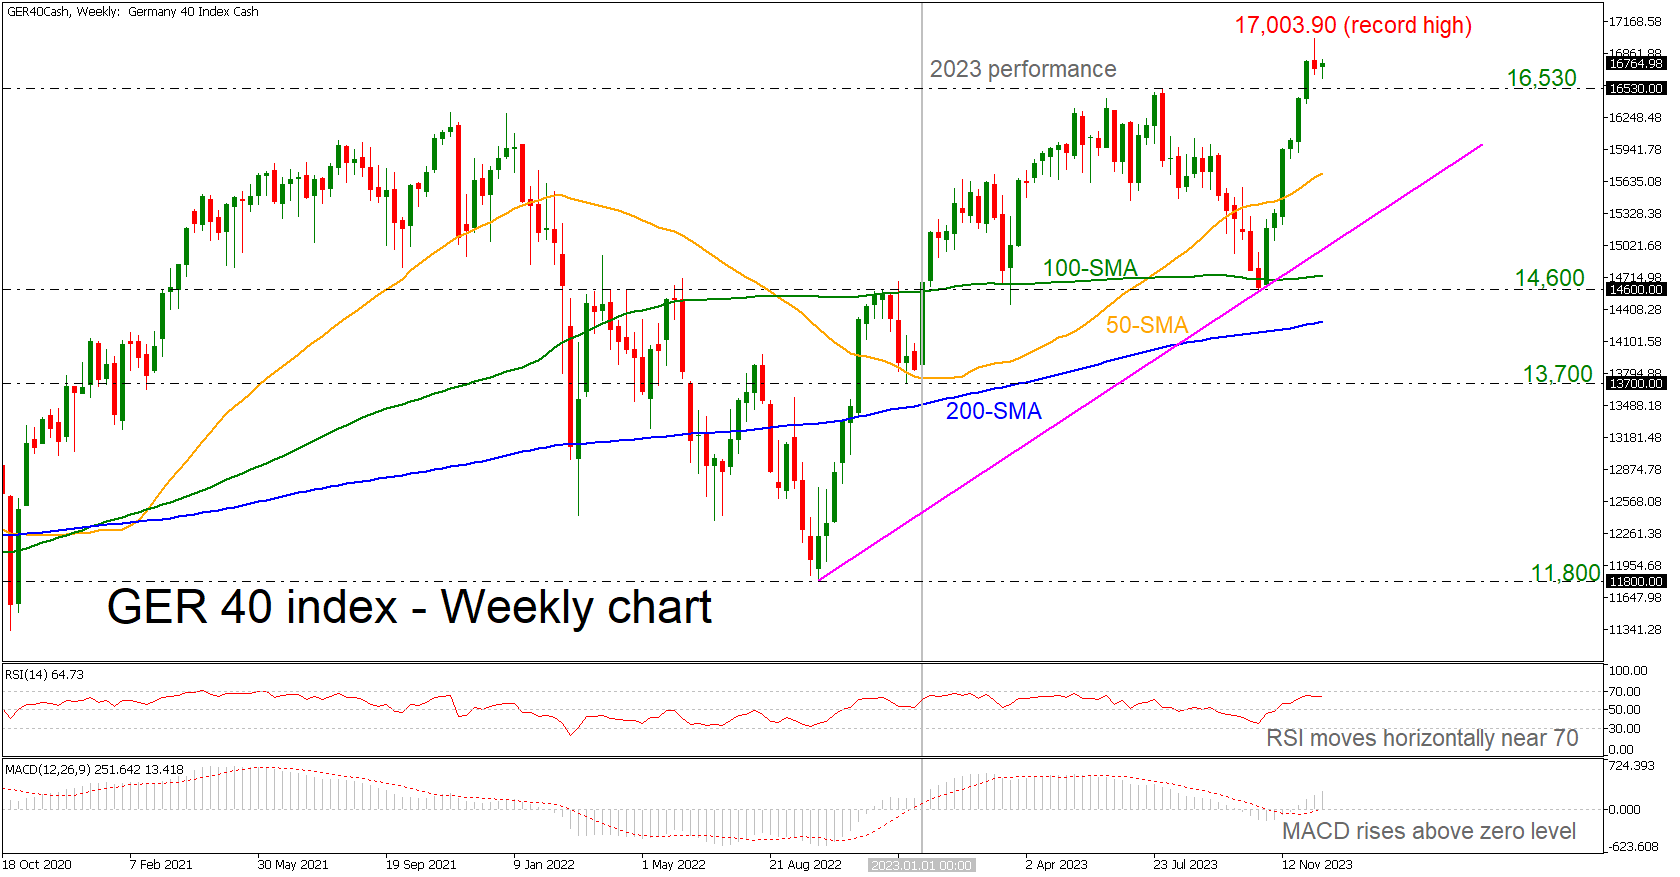
As the 2023 is coming to an end, the GER 40 index added more than 17% after the bounce off the 14,600 support level and the 100-week simple moving average (SMA). The price reached a new high near 17,003.90 in the previous week and lost some of its upside momentum, falling lower.
According to technical oscillators, the RSI is flattening marginally below 70, suggesting a weakening positive bias; however, the MACD is extending the bullish movement above its trigger and zero lines.
If the market extends the bullish action, then the index could rest near the next psychological numbers such as 17,100 and 17,200.
In the negative scenario, a bearish correction could lead the price until the previous high of 16,530 ahead of the 50-week simple moving average (SMA) at 15,710. Beneath that, the long-term ascending trend line at 15,200 may halt the bearish wave before meeting the 14,600 bottom again.
All in all, the GER 40 index is looking strongly positive in the broader outlook and only a decline below the rising trend line and the 200-week SMA at 14,300 may switch the outlook to negative.
GBP/USD – Inflation Surprise Sends Pound Lower
- UK inflation falls to 3.9%, lower than expected
- British pound declines
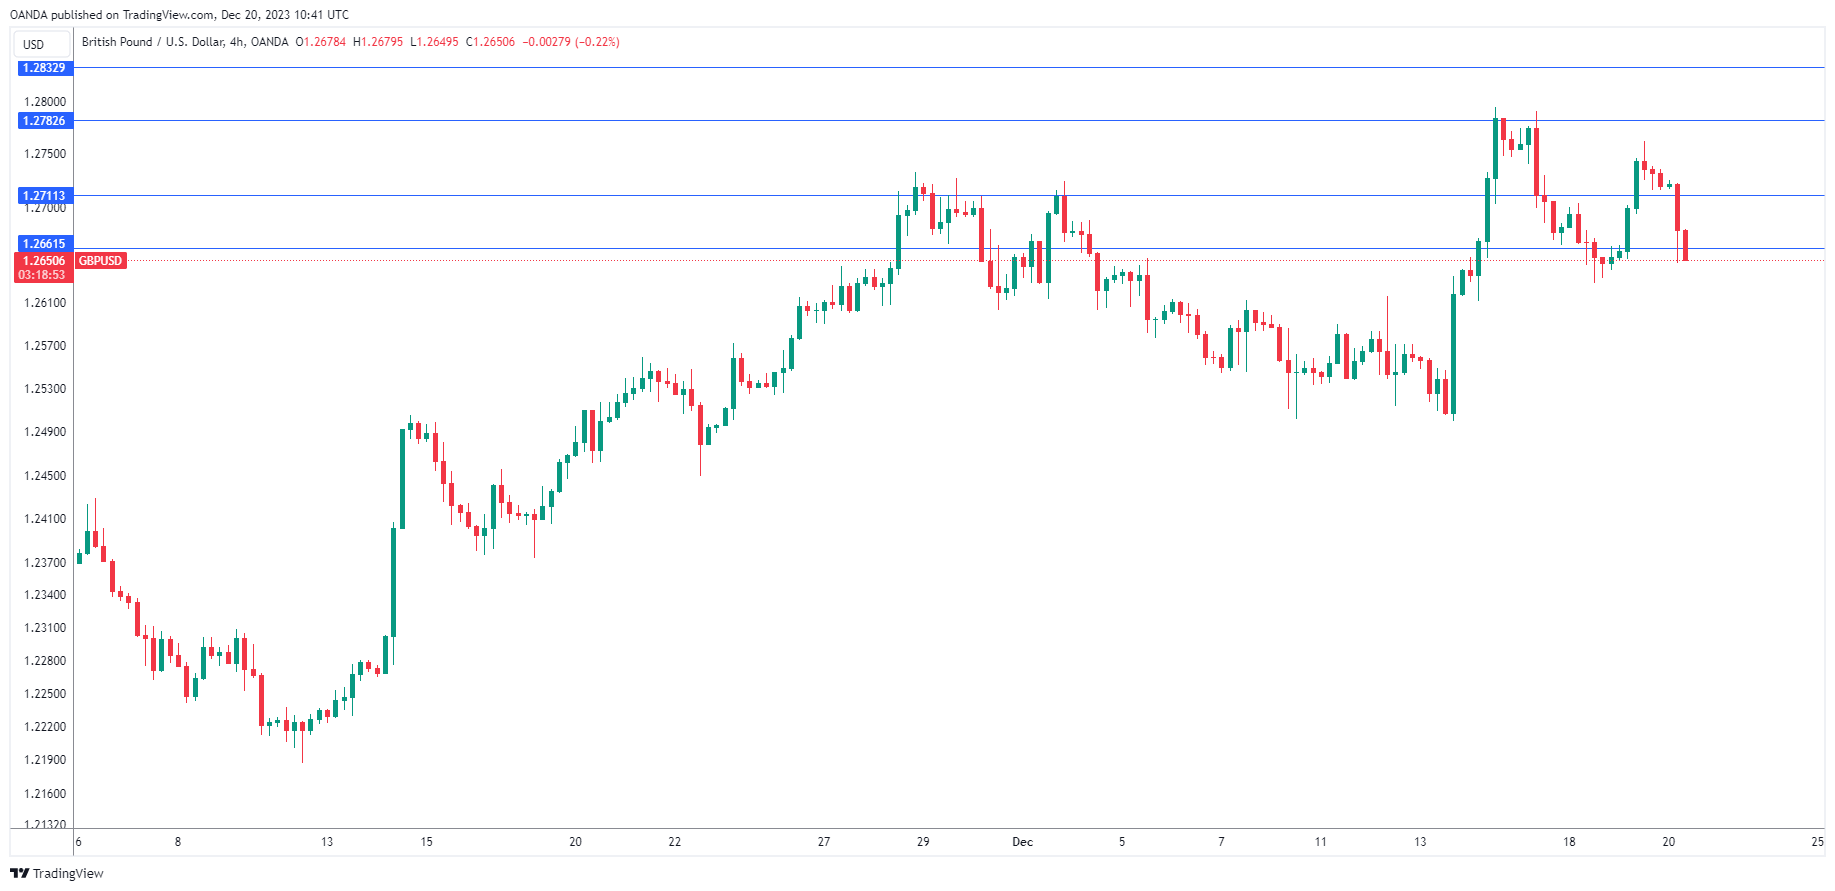
The British pound has declined on Wednesday. In the European session, GBP/USD is trading at 1.2658, down 0.58%.
UK inflation surprises on the downside
UK inflation was lower than expected in November and the surprising release has sent the British pound lower today. Headline CPI eased to 3.9% y/y, down from 4.6% in October and below the consensus estimate of 4.4%. This marked the lowest inflation rate since September 2021. Core CPI rose 5.1% in November, down from 5.7% and below the market consensus of 5.6%. Significantly, both the headline and core readings declined in November on a monthly basis – headline CPI came in at -0.2% and the core rate at -0.3% and both were lower than expected.
The sharp drop in inflation was driven by lower prices across the economy, including food, fuel, transport, recreation and clothing. The Bank of England will be encouraged by the significant decline in Core CPI, which excludes volatile items such as food and energy and is considered a better gauge of inflation trends than headline CPI.
It was just one week ago that the BoE paused rates but Governor Bailey remained hawkish at the meeting and pushed back against rate cut expectations. Bailey said that rates would remain in restrictive territory for an extended period (‘higher for longer’) and the pound reacted to his comments with sharp gains.
Will the soft inflation report change any minds at the BoE? The decline in inflation should put pressure on the BoE to cut rates next year. However, hawkish policy makers can point to Core CPI and argue that at a clip of 5.1%, it is nowhere near the Bank’s target of 2% and now is not the time to signal rate cuts are coming. It will be interesting to see how BoE officials react to the inflation report and whether the central bank adopts a less hawkish stance as a result.
GBP/USD Technical
- GBP/USD has breached support at 1.2711 and 1.2661. The next support level is 1.2590
- 1.2782 and 1.2832 are the next resistance lines
Euro Lower on German PPI Decline
- German PPI eases to 7.9%
- German GfK Consumer Confidence index improves slightly
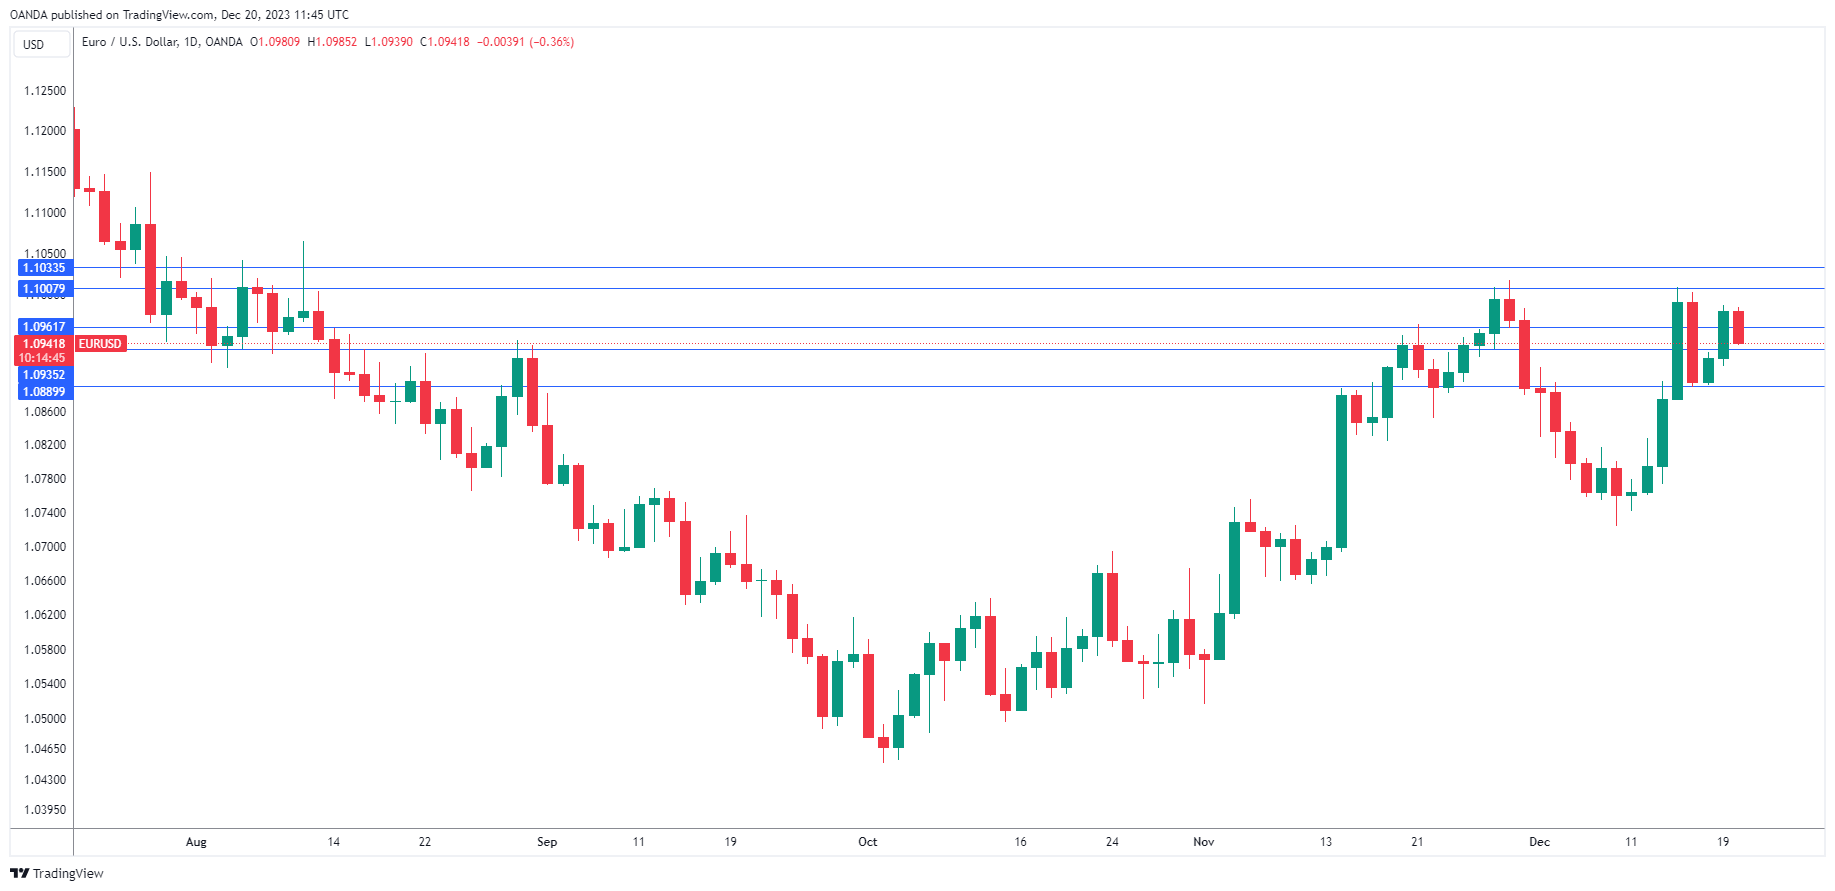
The euro has dropped in Wednesday’s trade. In the European session, EUR/USD is trading at 1.0939, down 0.38%.
German PPI declines by 7.9%
Germany’s producer price index fell by 7.9% y/y in November, another sharp decline after the October reading of -11%. This was lower than the market consensus of -7.5% and marked a fifth straight month of decline. Monthly, PPI dropped 0.5%, more than the consensus estimate of -0.3% and following a 0.1% decrease in October.
The drop in PPI was largely driven by a sharp drop in energy and electricity prices. Germany’s economy remains weak and the decrease in domestic activity and global demand for German products has cooled the economy and resulted in lower inflation in the eurozone’s largest economy. Consumers are feeling squeezed by the cost of living crisis and high borrowing costs and it’s no surprise that German consumer confidence is mired deep in negative territory.
The GfK Consumer Confidence index, released today, showed a slight improvement heading into January, with a reading of -25.1, compared to a revised -27.6 in December and above the market consensus of -27. Recent data out of Germany has not been encouraging. Business confidence remains weak and declined in December. As well, services and manufacturing PMIs pointed to contraction in December.
There is a deep disconnect over rate expectations between the ECB and financial markets. The markets have priced in six rate cuts in 2024, perhaps as early as March. The ECB has tried to dampen rate cut expectations and ECB President Lagarde said that members did not discuss rate cuts at last week’s meeting, at which the central bank held the cash rate at 4.0% for a second straight time. Lagarde received support earlier from ECB member Yannis Stournara this week when he stated that the ECB would need to see inflation sustainably below 3% before it would cut rates..
EUR/USD Technical
- EUR/USD is testing support at 1.0961. Below, there is support at 1.0935 and 1.0889
- 1.1007 and 1.1033 are the next resistance lines
WTI: Oil Price Rises Further on Growing Supply Disruption Concerns
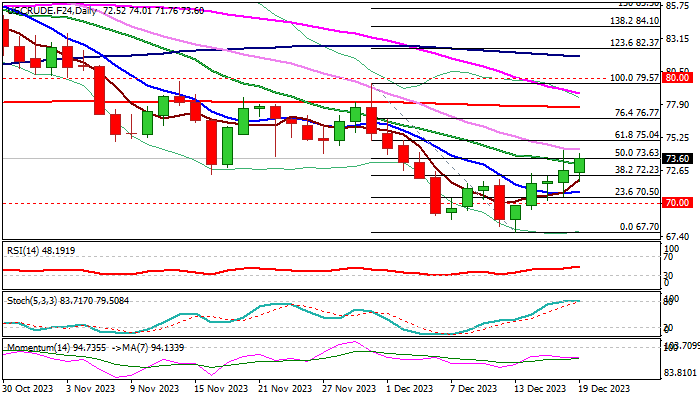
WTI oil price continues to trend higher, extending recovery from Dec 13 low ($67.70) into fifth consecutive day.
Growing tensions on several attacks on ships in the Red Sea, which prompted major shipping companies to reroute, added to fears about supply disruption amid existing conflict in Palestine and further lifted oil prices.
Recovery has so far retraced 50% of $79.57/$67.70 bear-leg, which improved the structure on daily chart, however, momentum indicator is still in the negative territory and stochastic is overbought, warning of possible recovery stall, as larger downtrend from $95.00 (2023 peak of Sep 28) remains intact.
Current corrective phase could extend further to still mark a healthy correction, as pivotal barrier at $77.69 (200DMA) is far and only sustained break here to generate stronger reversal signal and contribute to signals from bear-trap pattern on weekly chart.
Broken Fibo 38.2% level ($72.23) reverted to support which should hold dips and keep near-term bias with bulls, while dip below 10DMA ($70.96) will confirm an end of correction.
Res: 74.29; 75.04; 76.00; 76.77.
Sup: 72.23; 71.76; 70.96; 70.50.
Bundesbank’s Nagel cautions against premature ECB rate cut expectations
Bundesbank President Joachim Nagel has issued a warning to investors and analysts anticipating an early interest rate cut by ECB.
In an interview, Nagel emphasized the importance of maintaining the current interest rate levels to ensure the effective management of inflation. "We must initially remain at the current interest rate plateau so that monetary policy can fully develop its inflation-dampening effect," he stated.
Nagel's cautionary words to those speculating on an imminent rate cut were stark: "Be careful, some people have already miscalculated that." However, Nagel did acknowledge that interest rates have likely reached their peak, suggesting that while an immediate rate reduction may not be on the horizon, the period of aggressive rate hikes should have come to an end.
Nikkei 225 Technical: Potential Major Bullish Breakout After Pull-Back
- Yesterday’s swift rally has led to an overstretched upside momentum condition.
- At the risk of a minor corrective pull-back within its short-term uptrend phase.
- Watch the 33,150 key short-term support.
The price actions of the Japan 225 Index (proxy of the Nikkei 225 futures) have managed to hold above the 32,090 key medium-term support as highlighted in our previous analysis (printed an intraday low of 32,164 on 8 December 2023 before it reversed up by +5.2% to retest its 33 -year high which is the medium-term range resistance of 33,770/825 in place since 16 June 2023.
At a 33-year high with a positive medium-term momentum condition
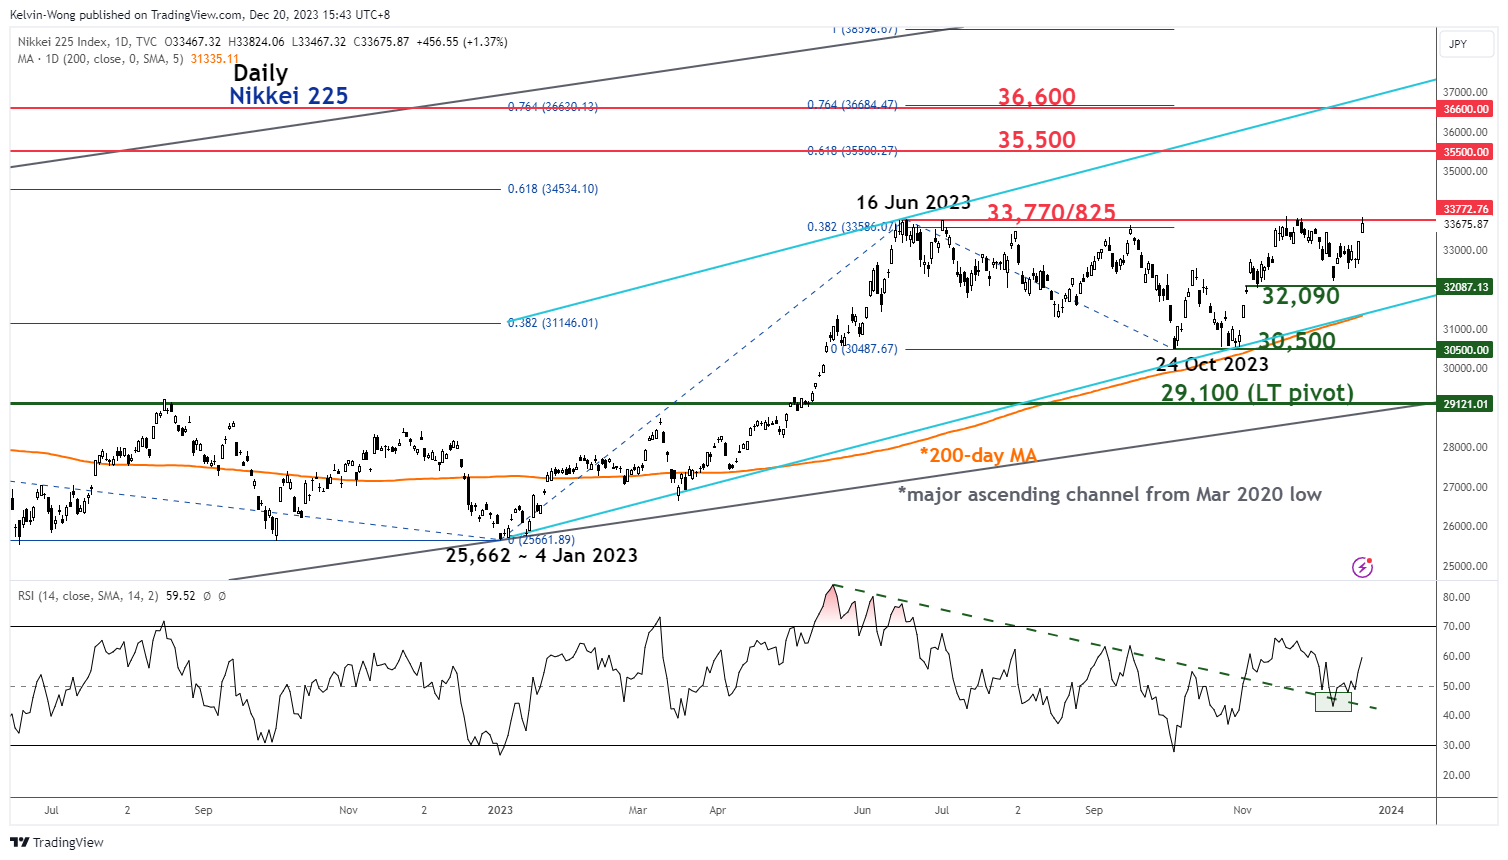
Fig 1: Nikkei 225 major & medium-term trends as of 20 Dec 2023 (Source: TradingView, click to enlarge chart)
This “stubborn level” of 33,770/825 has created a barrier for the bulls thrice on 3 July, 15 September, and 20 November. Hence, right now it will be the fourth test on this barrier today, 20 December at this time of writing.
So, will it be another failure or a bullish breakthrough? The latest reading seen in the medium-term daily RSI momentum indicator has advocated for a potential bullish breakout scenario above 33,770/825.
The daily RSI has managed to stage a rebound after a retest at a parallel pull-back support at the 43 level and has yet to reach its overbought region. These observations suggest that medium-term upside momentum has resurfaced without being overstretched.
Minor corrective pull-back in progress
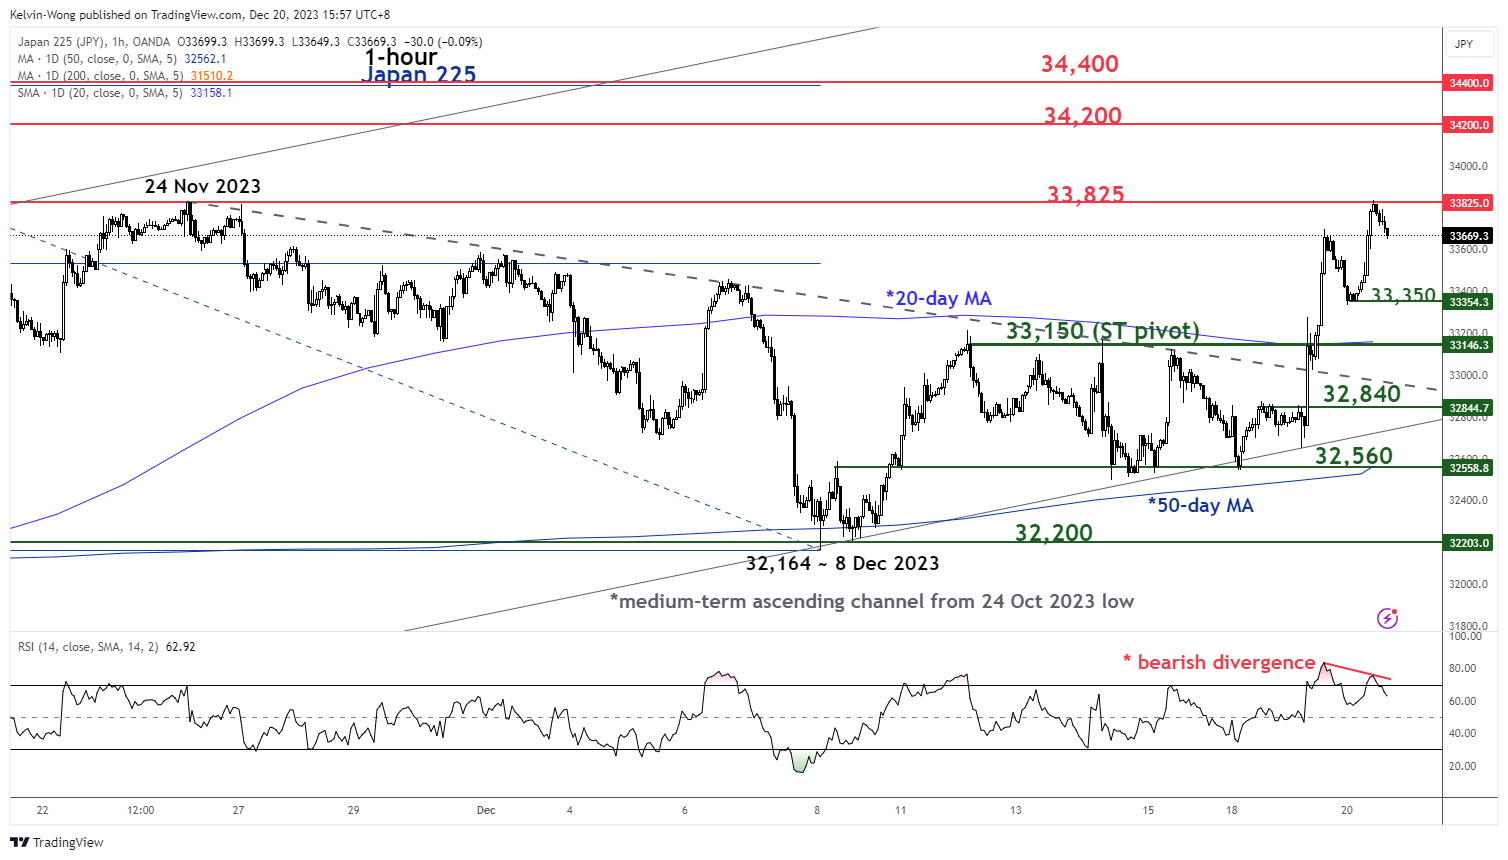
Fig 2: Japan 225 minor short-term trend as of 20 Dec 2023 (Source: TradingView, click to enlarge chart)
Through the lens of technical analysis, price actions do not move in a vertical direction but instead oscillate within trends. The Index has evolved into a short-term uptrend phase from its 8 December 2023 low of 32,164 as price actions surpassed the 20-day moving average.
A point to note that is the rally seen yesterday, 9 December has been reinforced by the Bank of Japan’s monetary policy forward guidance that offered no clear indication of an imminent removal of its short-term negative interest rate policy.
This set of short-term bullish impulsive sequence has been swift which in turn led to an overstretched upside momentum condition as the hourly RSI momentum indicator has just flashed a bearish divergence condition as its overbought region.
Hence, the Index may undergo a minor corrective pull-back at this juncture within its short-term uptrend phase toward the near-term support at 33,350.
If the 33,150 key short-term pivotal support (also the 20-day moving average) manages to hold, the Index may see another probe at 33,825 and above it sees the next intermediate resistance coming in at 34,200 in the first step.
However, a break below 33,150 negates the bullish tone to expose the next immediate supports at 32,840 and 32,560 (50-day moving average).
GBP/USD Deflated By Softer Than Expected UK November Inflation Data
Cable dropped on Wednesday morning on softer than expected UK November inflation, losing around 0.4% after data release.
Stronger than expected drop in consumer prices adds support to rate cut scenario, making pound less attractive, though latest comments from BOE’s deputy governor about keeping restrictive policy for some time, may partially offset impact from inflation report.
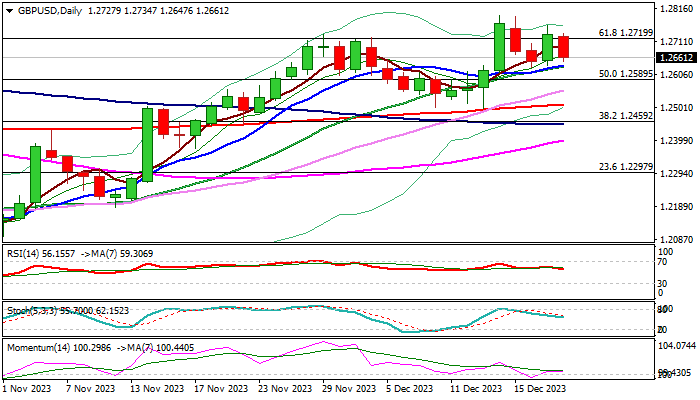
Fresh weakness is on track to fully reverse Tuesday’s advance (the pair was up 0.65%) and challenge pivotal supports at 1.2636/31 (converged 10/20DMA’s).
Near-term bias is expected to remain with bulls while the these supports hold (daily studies show MA’s in bullish configuration and 14-d momentum in positive territory) and keep in play scenario for renewed probe through cracked Fibo barrier at 1.2919 (61.8% of 1.3141/1.2037) and possible acceleration towards pivotal 1.2800 zone.
Conversely, firm break of 10/20DMA’s would weaken near-term structure and risk deeper pullback towards key supports at 1.2510/00 zone (200DMA / Dec 8/13 higher base).
Res: 1.2719; 1.2761; 1.2800; 1.2818.
Sup: 1.2631; 1.2589; 1.2556; 1.2500.
USD: Initial Claims Data Incoming
The COVID-19 pandemic led to a substantial labor force transformation in the U.S., marked by 'The Great Reshuffle.' Over 50 million workers resigned in 2022, continuing the trend from 2021, but by August 2023, resignations tapered to 30.5 million. This reshuffling trend indicates a quest for better work-life balance, higher compensation, and a robust company culture. November's unemployment rate slightly dropped to 3.7%, with job gains surpassing expectations at 199,000, led by health care, government, and manufacturing sectors recovering from the United Auto Workers strike. The U.S. Chamber of Commerce is closely monitoring industry-specific trends, providing valuable insights for businesses and policymakers. Weekly jobless claims remained steady, with the insured unemployment rate at 1.3%. Notable state variations include New Jersey and California which have the highest insured unemployment rates. As the labor market adapts, businesses and policymakers are keenly observing these indicators to navigate changing workforce dynamics and economic conditions.
GBPUSD - H4 Timeframe
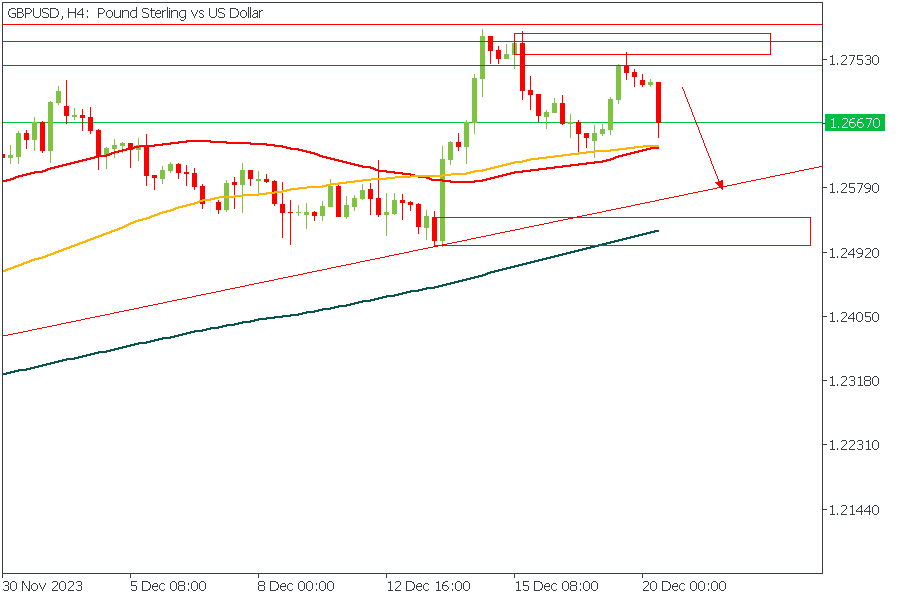
GBPUSD as seen from the attached chart above has been rejected off the rally-base-drop supply zone and seems to be aiming for the confluence region of the demand zone, moving average, and trendline support. In this situation, my sentiment remains bearish, until a proper reaction is observed from the confluence region as stated.
Analyst’s Expectations:
- Direction: Bearish
- Target: 1.25529
- Invalidation: 1.27081
EURUSD - H4 Timeframe
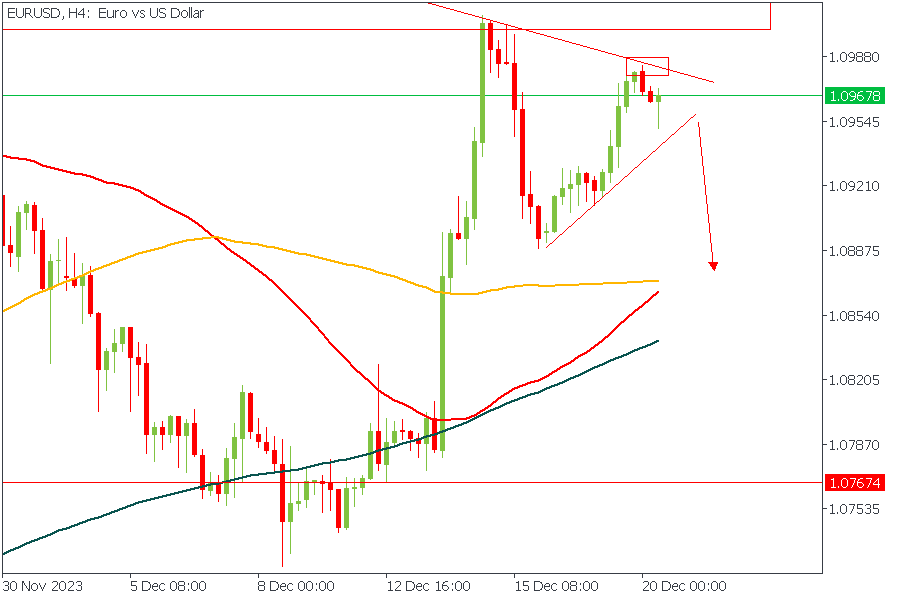
EURUSD, after bouncing off the supply zone, is at the moment facing another bout of rejection from the trendline resistance. The current state of the price action is a consolidation between the two trendlines. A cautionary approach to this trade idea would be to wait for a clear break below the trendline support, whilst an aggressive approach would be to use the recent high as the stop-loss price.
Analyst’s Expectations:
- Direction: Bearish
- Target: 1.09867
- Invalidation: 1.09108
USDCHF - H4 Timeframe
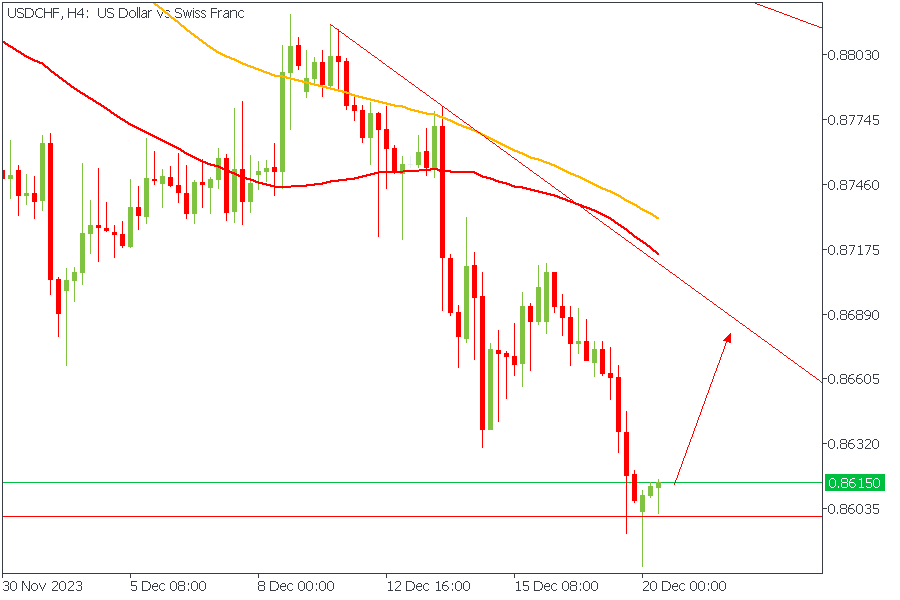
As for USDCHF, price seems to be on the verge of a clean rejection from the demand zone as projected based on the pin-bar candlestick formation. I’m personally not exceedingly thrilled about this move though, since it does not have as many confluences as I’d prefer to be able to work with. In the meantime, however, I’ll keep my fingers crossed, with a tentative bullish sentiment.
Analyst’s Expectations:
- Direction: Bullish
- Target: 0.86671
- Invalidation: 0.85785
CONCLUSION
The trading of CFDs comes at a risk. Thus, to succeed, you have to manage risks properly. To avoid costly mistakes while you look to trade these opportunities, be sure to do your due diligence and manage your risk appropriately.
Gold Price Eyes Breakout, Crude Oil Price Recovers
Gold price gained traction and climbed above the $2,030 resistance level. Crude oil price is recovering, and it could climb further higher toward the $78 resistance.
Important Takeaways for Gold and Oil Prices Analysis Today
- Gold price started a decent increase from the $1,975 zone against the US Dollar.
- A connecting bullish trend line is forming with support near $2,030 on the hourly chart of gold at FXOpen.
- Crude oil prices rallied above the $71.00 and $73.00 resistance levels.
- There is a key bullish trend line forming with support near $73.00 on the hourly chart of XTI/USD at FXOpen.
Gold Price Technical Analysis
On the hourly chart of Gold at FXOpen, the price found support near the $1,975 zone. The price formed a base and started a fresh increase above the $1,990 level.
There was a decent move above the 50-hour simple moving average. The bulls pushed the price above the $2,030 resistance zone. Finally, the bears appeared near $2,045, A high is formed near $2,046.99 and the price is now consolidating gains.
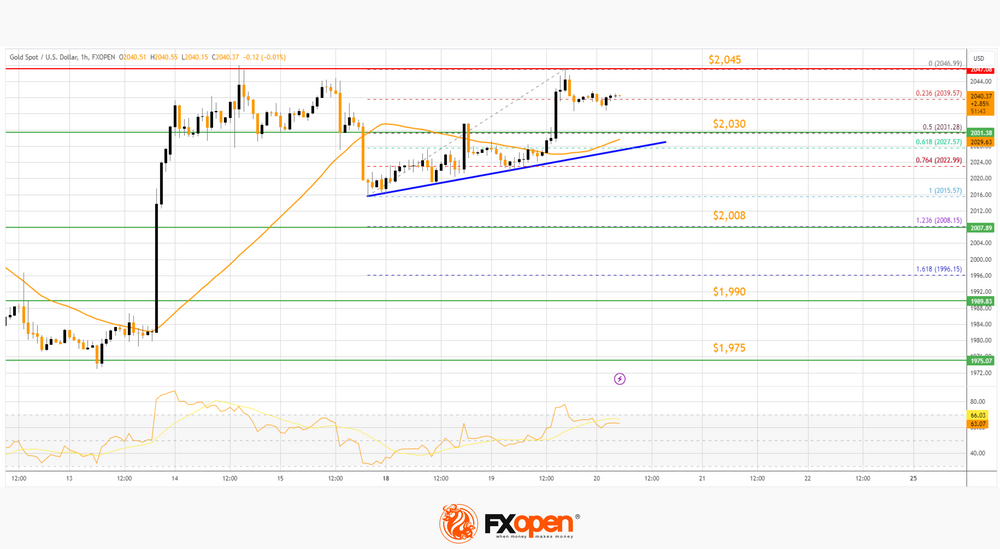
There was a minor move below the 23.6% Fib retracement level of the upward move from the $2,015 swing low to the $2,046 high. The RSI is still stable above 50 and the price could aim for more gains. Immediate resistance is near the $2,045 level.
The next major resistance is near the $2,050 level. An upside break above the $2,050 resistance could send Gold price toward $2,065. Any more gains may perhaps set the pace for an increase toward the $2,080 level.
Initial support on the downside is near the 50-hour simple moving average or $2,030. There is also a connecting bullish trend line forming with support near $2,030. The trend line is close to the 61.8% Fib retracement level of the upward move from the $2,015 swing low to the $2,046 high.
If there is a downside break below the $2,030 support, the price might decline further. In the stated case, the price might drop toward the $2,008 support.
Oil Price Technical Analysis
On the hourly chart of WTI Crude Oil at FXOpen, the price started a decent recovery wave against the US Dollar. The price gained bullish momentum after it broke the $71.00 resistance.
There was a sustained upward move above the $72.00 and $73.00 resistance levels. The bulls pushed the price toward $75.00. The current price action is positive above the 50-hour simple moving average and RSI is stable above 50.
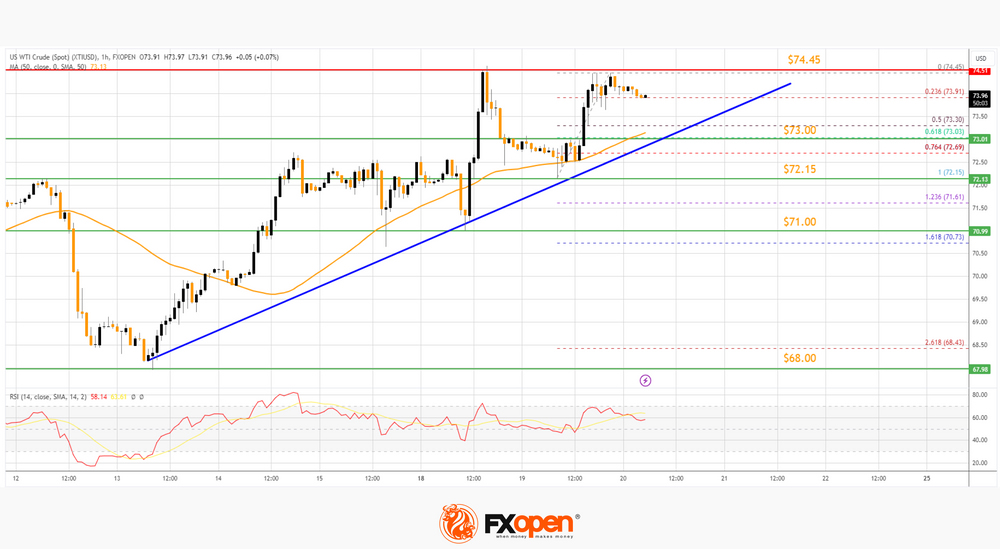
If the price climbs further higher, it could face resistance near $74.45. The first major resistance is near the $76.20 level. Any more gains might send the price toward the $78.00 level.
Conversely, the price might correct gains below the 23.6% Fib retracement level of the upward move from the $72.15 swing low to the $74.45 high. The next major support on the WTI crude oil chart is near a key bullish trend line at $73.00.
The 61.8% Fib retracement level of the upward move from the $72.15 swing low to the $74.45 high is also near $73.00. If there is a downside break, the price might decline toward $72.15. Any more losses may perhaps open the doors for a move toward the $71.00 support zone.
This article represents the opinion of the Companies operating under the FXOpen brand only. It is not to be construed as an offer, solicitation, or recommendation with respect to products and services provided by the Companies operating under the FXOpen brand, nor is it to be considered financial advice.
Could EURGBP Bulls Keep the Rebound Alive?
- EURGBP edges higher after weaker UK CPI
- Path higher filled with strong resistance points
- Momentum indicators are mostly bullish
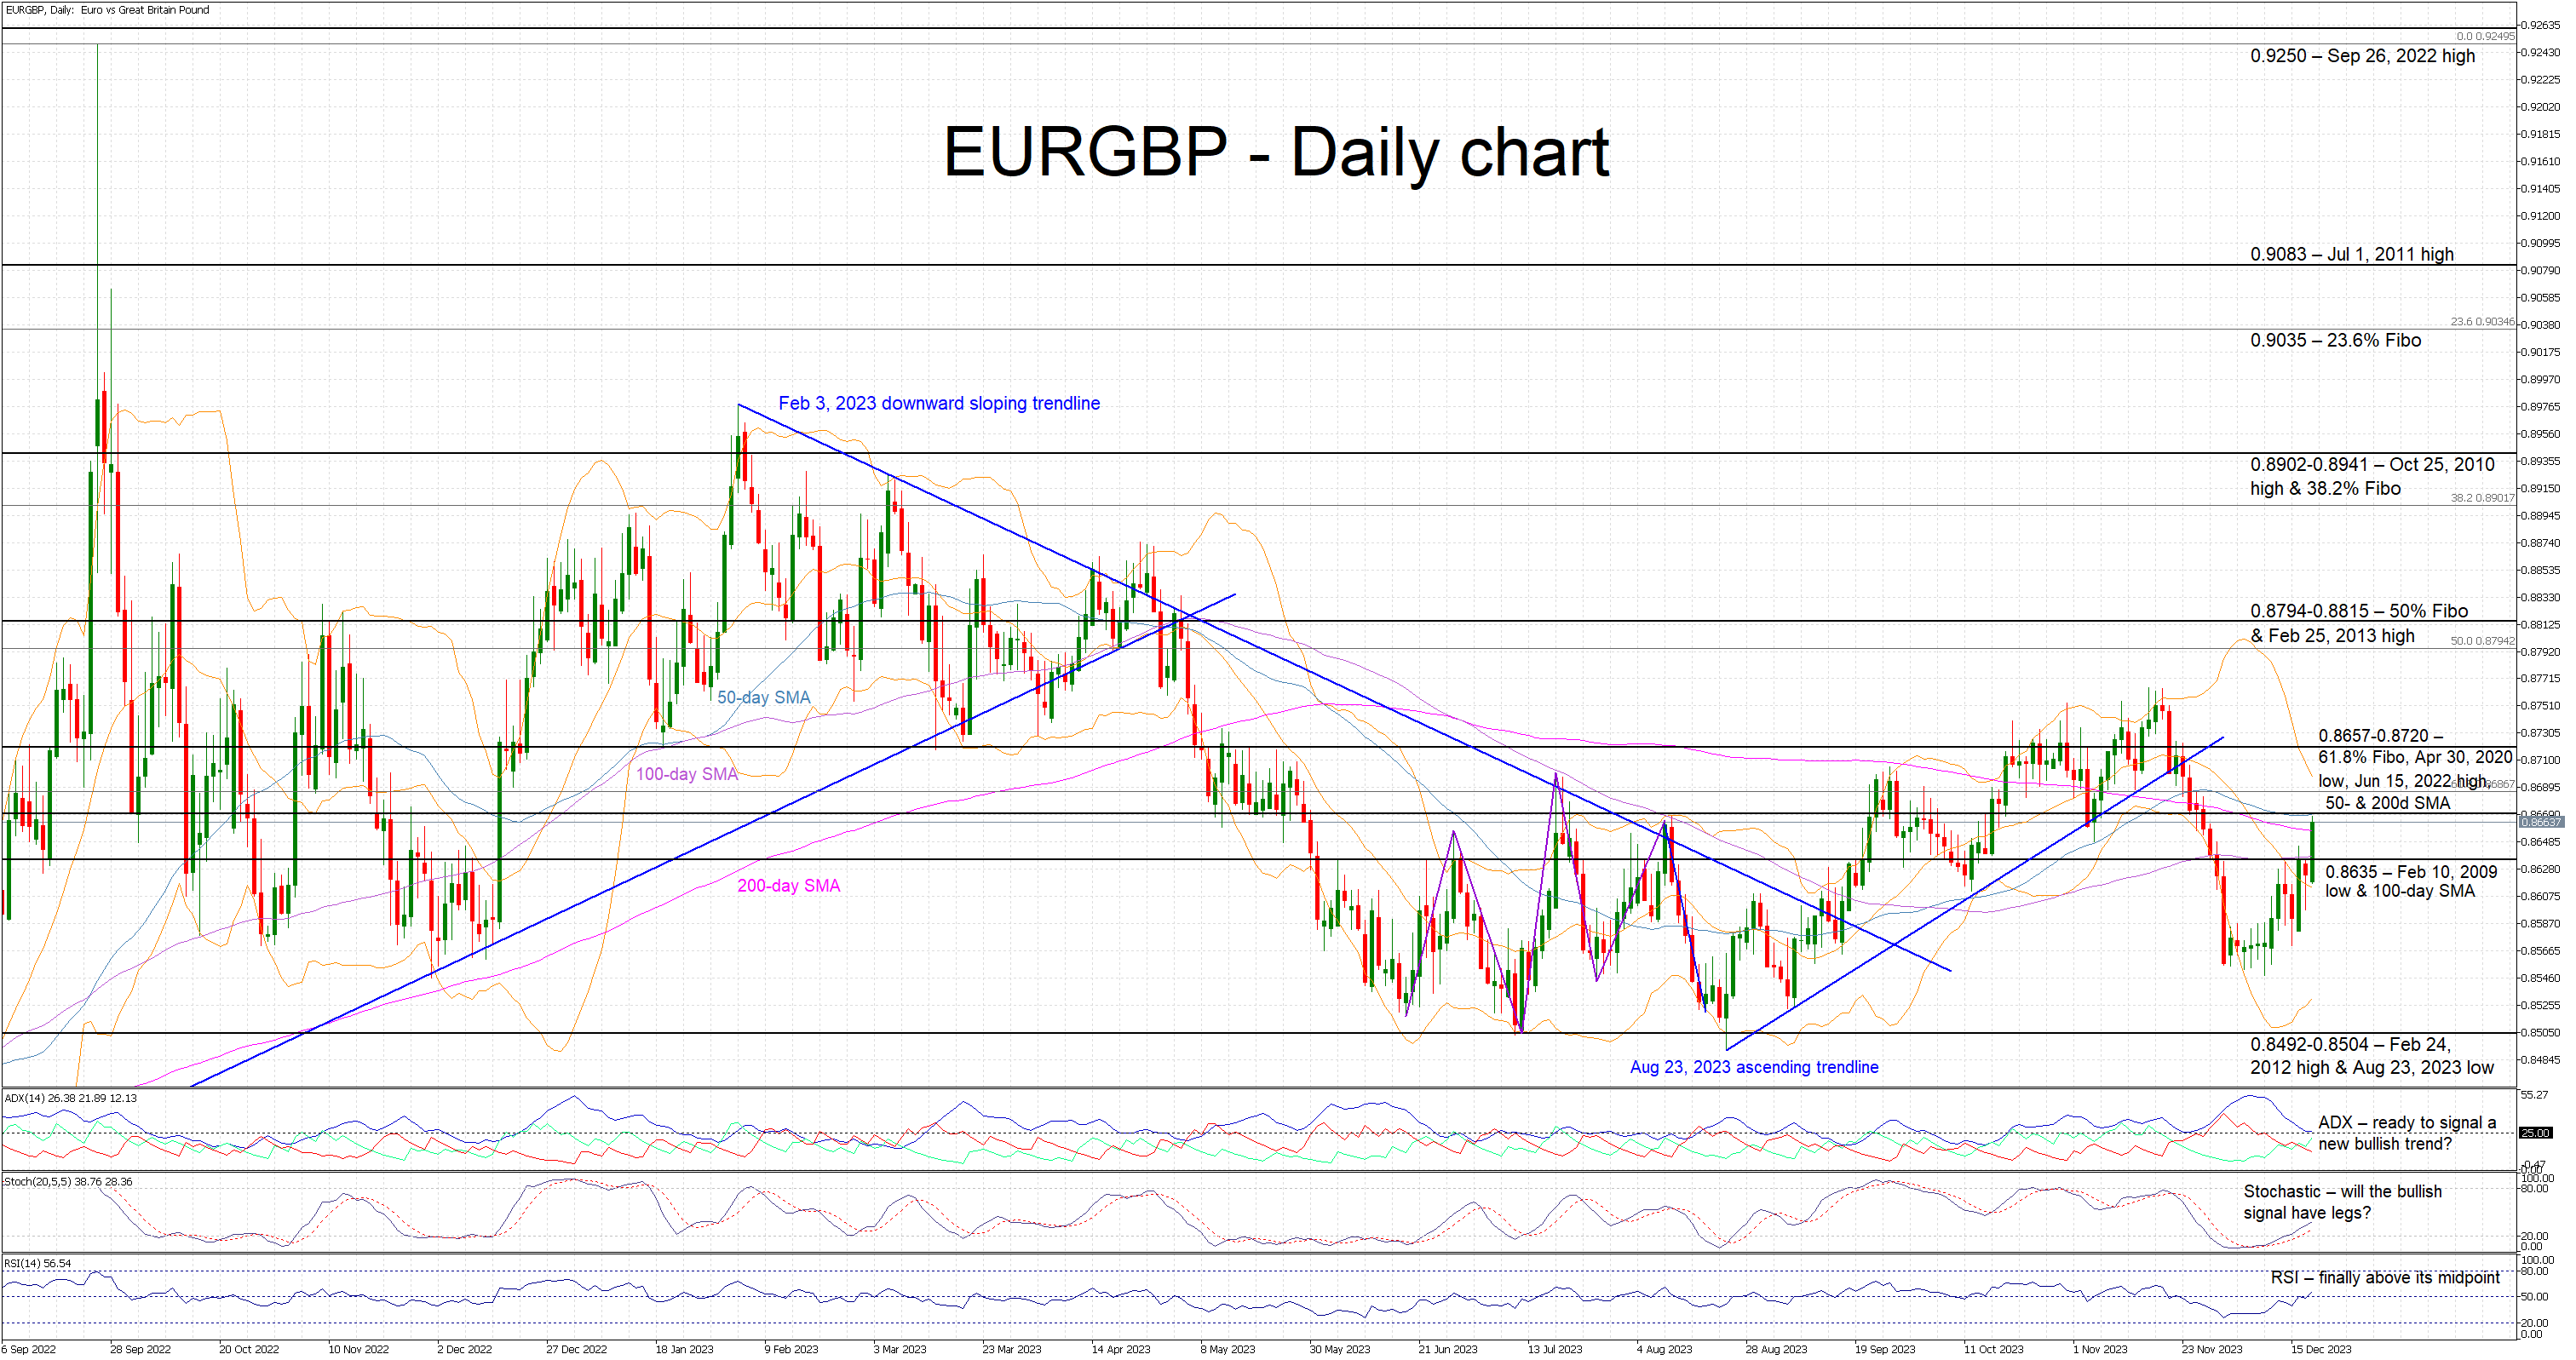
EURGBP is trading higher today after the downside surprise registered by the UK inflation report. The 0.8635 level was easily surpassed with the EURGBP bulls now preparing to test the resistance set by the 0.8657-0.8720 area. They are just halfway to recovering the losses incurred during the November 20-December 1 correction.
In the meantime, the momentum indicators appear supportive of the current upleg. The Average Directional Movement Index (ADX) remains a tad above its 25-threshold, confirming the increasing bullish pressure in the market. Similarly, the RSI has finally managed to return back above its 50-midpoint. More importantly, the stochastic oscillator is edging higher, above its oversold territory, and building a good gap from its moving average.
Should the bulls feel confident, they could first try to push EURGBP above the very busy 0.8657-0.8720 area. This is populated by the 61.8% Fibonacci retracement of the August 4, 2022 – September 26, 2022 uptrend, the June 15, 2022 high and the 50- and 200-day simple moving averages (SMAs). If successful in overcoming this key region, the bulls could have the chance to stage a move above the recent peak of 0.8765 and record a new 7-month high.
On the flip side, the bears appear determined to defend the busy 0.8657-0.8720 area and protect their recent hard-earned gains. They could then try to push EURGBP back below the 0.8635 level defined by the February 10, 2009 low and the 100-day SMA. Even lower, the path appears to be unhindered until the 0.8492-0.8504 area.
To sum up, with some support from the momentum indicators, EURGBP bulls are trying to keep the current upleg intact. However, their true drive could be tested at the busy 0.8657-0.8720 area.