Sample Category Title
USD/JPY: Strong Acceleration After Dovish BoJ Deflated Yen
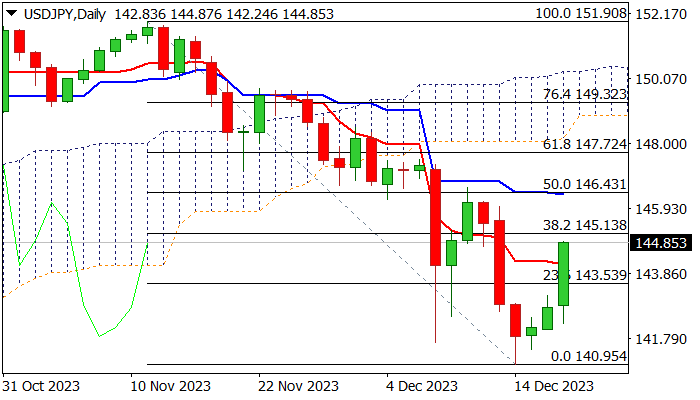
USDJPY was sharply up during the late Asian/European session on Tuesday (up 1.3% so far) in strong acceleration after dovish Bank of Japan deflated yen.
The central bank kept its ultra-loose monetary policy unchanged and maintained forward guidance, disappointing those who expected signals about the start of tightening cycle.
The pair is in near-term recovery for the third straight day, with today’s advance bring the biggest since Oct 31 and contributing to positive outlook.
Fresh bulls broke above daily Tenkan-sen (144.14) and pressuring pivotal Fibo barrier at 145.13 (38.2% retracement of 151.90/140.95).
Daily close above Tenkan-sen to validate recovery, with firm break above 145.13 to generate reversal signal and expose next key barriers at 146.50 zone (50% retracement / daily Kijun-sen/Dec 11 lower top).
Daily studies are improving, though caution is still required as 14-d momentum indicator is still in negative territory.
Res: 145.13; 145.99; 146.43; 146.58.
Sup: 144.14; 143.53; 142.60; 142.06.
Eurozone CPI finalized at 2.4%, core at 3.6%
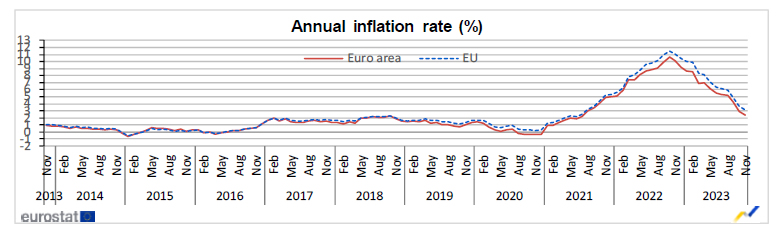
Eurozone CPI was finalized at 2.4% yoy in November, down from October's 2.9% yoy. CPI core (excluding energy, food, alcohol & tobacco) was finalized at 3.6% yoy , down from prior month's 4.2% yoy. The highest contribution came from services (+1.69 percentage points, pp), followed by food, alcohol & tobacco (+1.37 pp), non-energy industrial goods (+0.75 pp) and energy (-1.41 pp).
EU CPI was finalized at 3.1% yoy, down from prior month's 3.6% yoy. The lowest annual rates were registered in Belgium (-0.8%), Denmark (0.3%) and Italy (0.6%). The highest annual rates were recorded in Czechia (8.0%), Hungary (7.7%), Slovakia and Romania (both 6.9%). Compared with October, annual inflation fell in twenty-one Member States, remained stable in three and rose in three.
EURJPY Retraces Higher as 200-day Holds Ground
- EURJPY falls sharply but the 200-day SMA acts as a strong floor
- Repeated failure to violate the latter triggers an upward spike
- Momentum indicators improve, but remain in negative zones
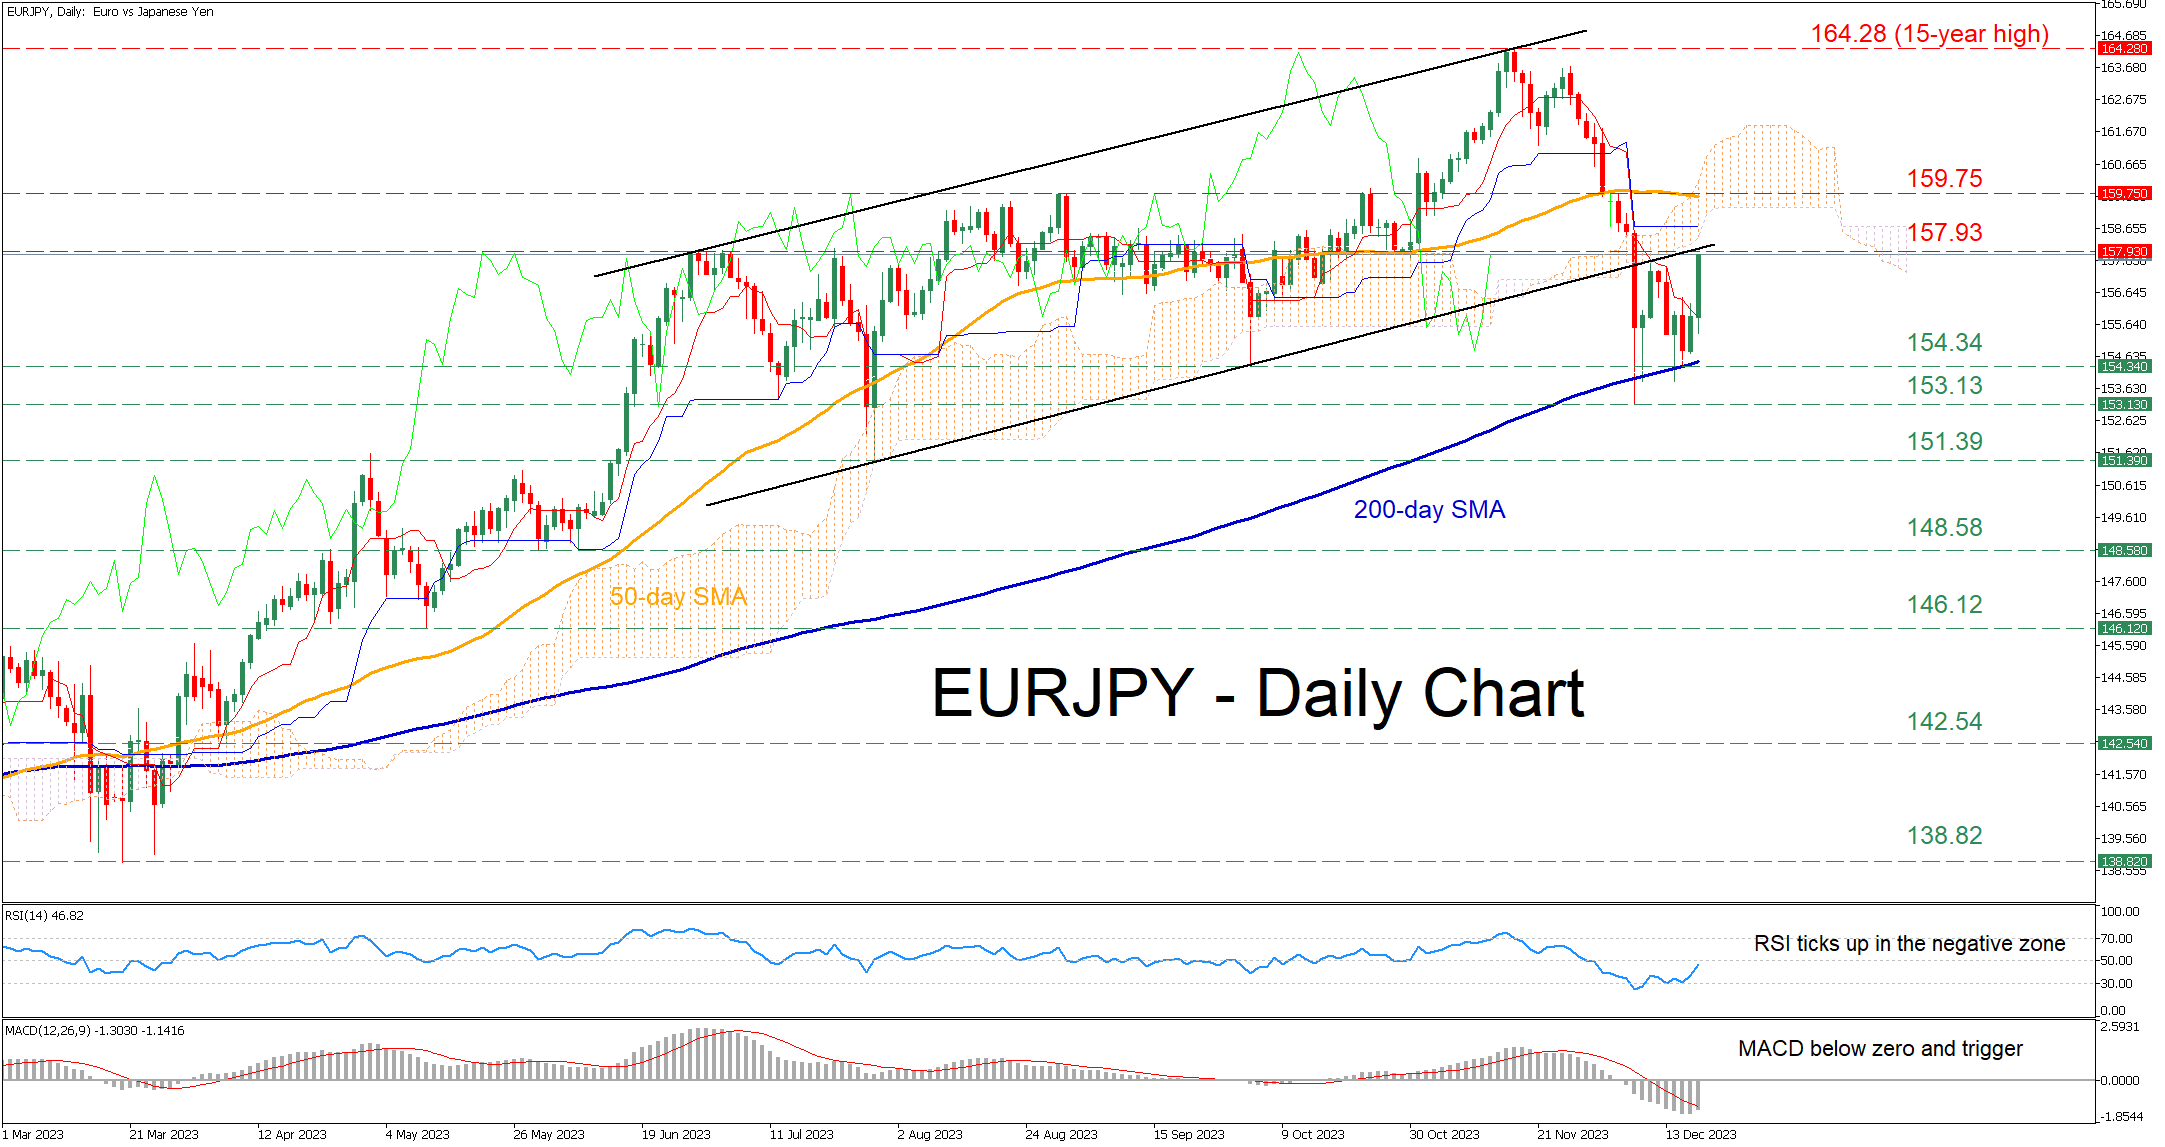
EURJPY had been experiencing a steep pullback from its recent 15-year peak of 164.28, which ceased at the crucial 200-day simple moving average (SMA). In today’s session, the pair has gained significant ground in its attempt to erase the recent correction.
Should buying pressures intensify further, the June-July resistance of 157.93 could prove to be the first barricade for the bulls to claim. A break above that area could pave the way for the August resistance of 159.75, which overlaps with the 50-day SMA. Failing to halt there, the pair might revisit its 15-year high of 164.28.
On the flipside, if the pair reverses back lower, the congested region that includes the 200-day SMA and the October-December support of 154.34 could act as the first line of defence. Sliding beneath that floor, the price may test its December bottom of 153.13, which is also its lowest level in four months. Further retreats could cease around the July low of 151.39.
In brief, EURJPY managed to pause its short-term selloff with some help from the 200-day SMA. However, for the bulls to regain confidence, the price has to reclaim the 157.93 hurdle.
USDCAD Forms Bullish Double Bottom
- USDCAD creates bullish formation after sharp decline
- A close above 1.3400 could boost buying sentiment
- Canadian CPI figures for November due at 13:30 GMT
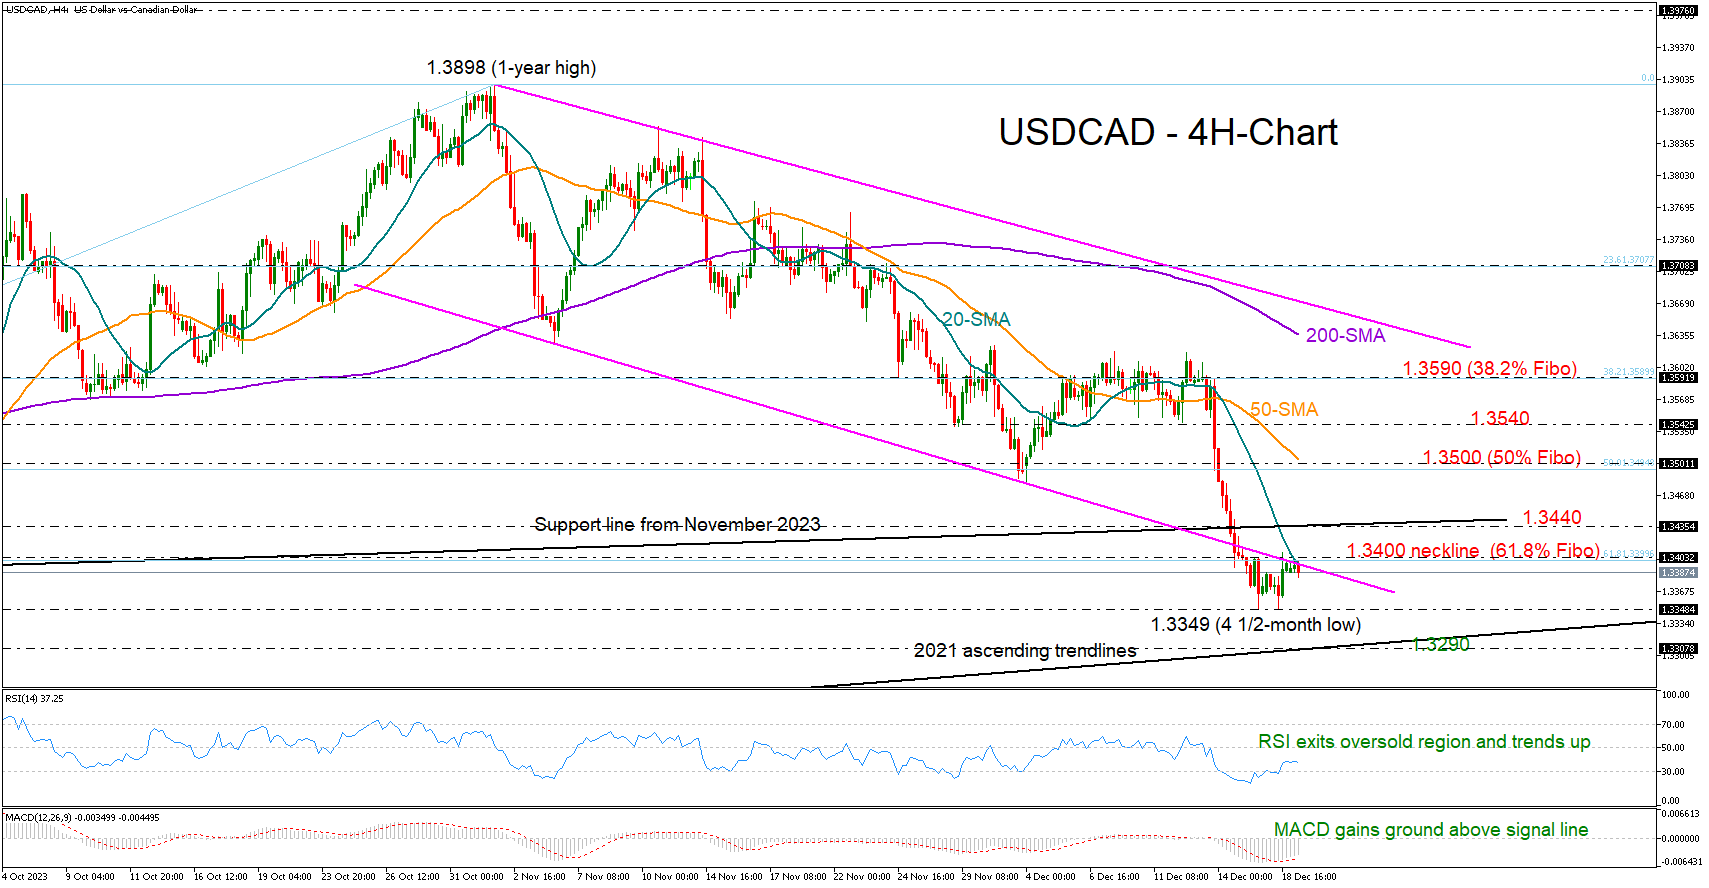
USDCAD entered a range trade following the slump to a four-and-a-half month low of 1.3349 last Friday. In the four-hour chart, the ongoing sideways move seems to have taken the shape of a bullish double bottom pattern, increasing optimism the pair might soon change direction to the upside.
In other encouraging signals, the RSI has bounced off oversold levels and keeps trending northwards, reflecting a positive bias. Likewise, the MACD continues to gain ground above its red signal line, suggesting that upside forces could persist in the short-term.
Technically though, the positive formation needs a confirmation above the neckline at 1.3400 and above the 20-period simple moving average (SMA). The 61.8% Fibonacci retracement of the July-November uptrend is placed in the same region. Should the pair step above that bar, it could accelerate towards the 1.3480-1.3500 region, unless the constraining line from November 2023 halts the recovery at 1.3435. A continuation above 1.3540 could last till the 38.2% Fibonacci of 1.3590.
In the event the 1.3400 mark stands firm, the pair could retest its recent lows around 1.3349. The 1.3300 round-level, which overlaps with the 2021 ascending trendline, could be another important region to watch before the spotlight falls on the 78.6% Fibonacci number of 1.3265.
Summing up, the technical picture is currently promoting a bullish trend reversal, but traders will need confirmation above 1.3400 to raise their buying orders.
US 500 Index Rallies to New Highs in 2023
- US 500 completes 8 green weeks
- Overall trend remains overwhelmingly positive
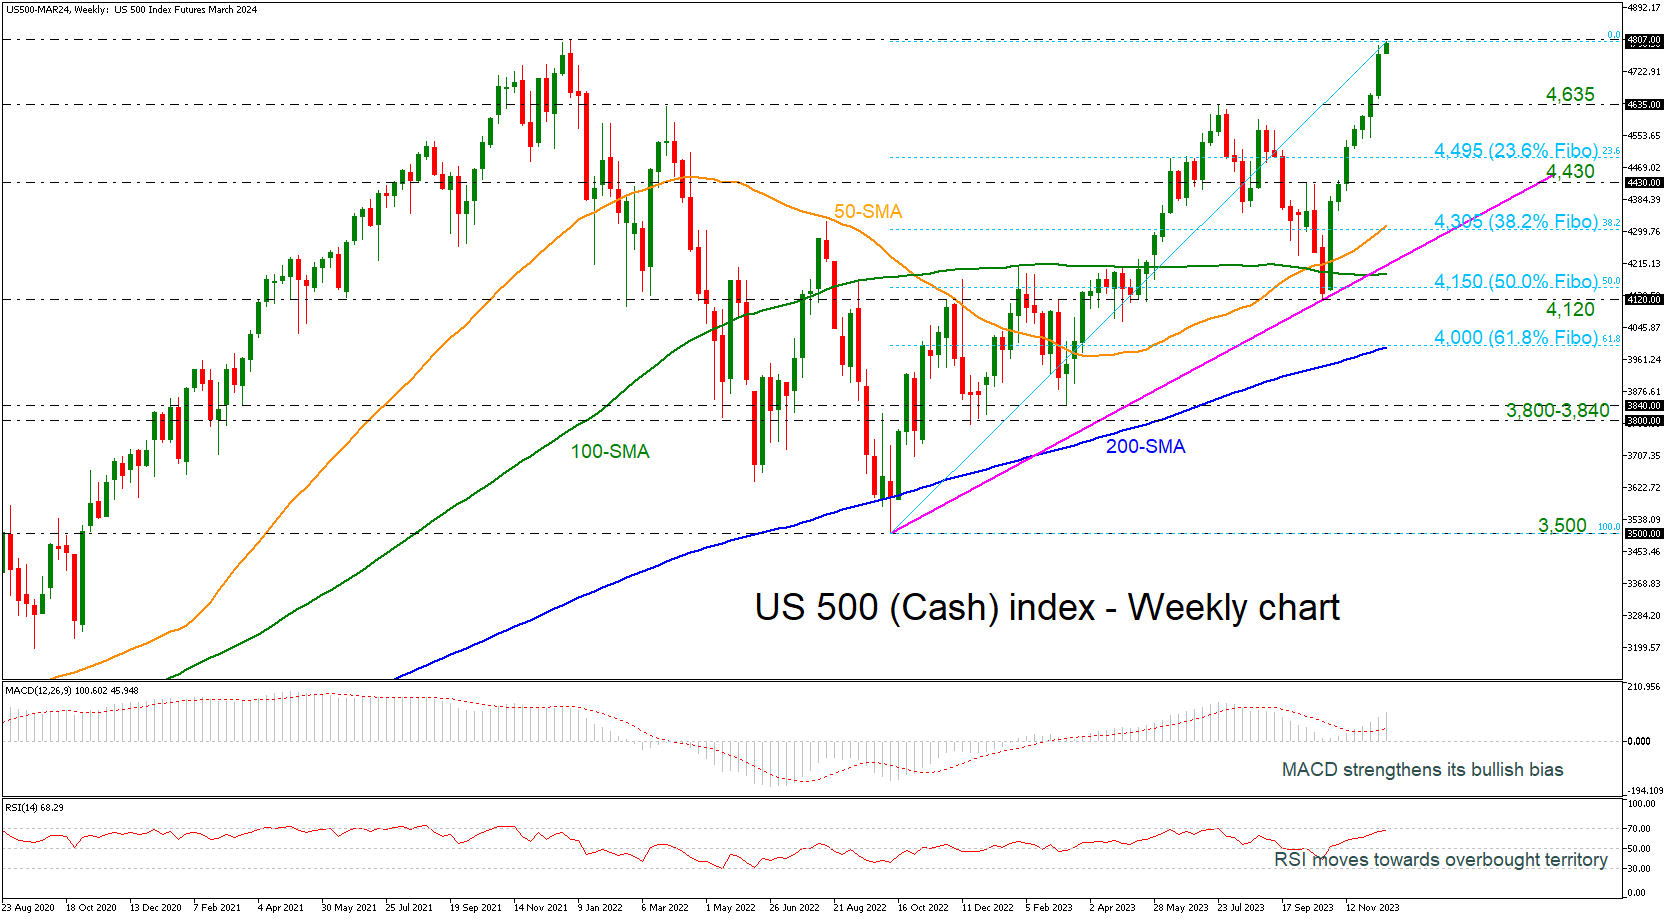
The US 500 cash index rose to its highest level of 4,801 in at least two years. The index is recording the eighth straight green week following the strong rebound off the ascending trend line and the 4,120 support level.
Weekly oscillators suggest that upside momentum is still gaining steam, reflecting the latest bullish rally in the market. The RSI has turned up and is ready to cross above the 70 level, while the MACD is extending its positive move above its trigger and zero lines.
If buyers maintain an upside rally and surpass the previous peak of 4,807, recorded in January 2022, it may push the price into uncharted territory and shift attention towards significant psychological levels, where traders may position their stop orders, potentially impeding further price increases. From this perspective, the key levels to monitor are 4,900 and 5,000.
Now should sellers take back control, the first obstacle to the downside might be the previous peak of 4,635, which has acted as strong resistance in recent months. If violated, the spotlight would then shift to the 23.6% Fibonacci retracement level of the upward move from 3,500 to 4,801 at 4,495. Beneath this line, the 4,430 inside swing high, taken from the peak on October 15, which overlaps with the 50-week simple moving average (SMA) would be tested ahead of the long-term uptrend line and the 100-week SMA at 4,190.
Summarizing, the long-term outlook remains clearly positive. A decisive break below the ascending trend line is needed to bring that into doubt, although a trend reversal would require much heavier declines than that.
Canadian Dollar Drifting Ahead of CPI Release
- Canada’s inflation rate expected to fall to 2.9%
- Fed members push back against rate cut expectations
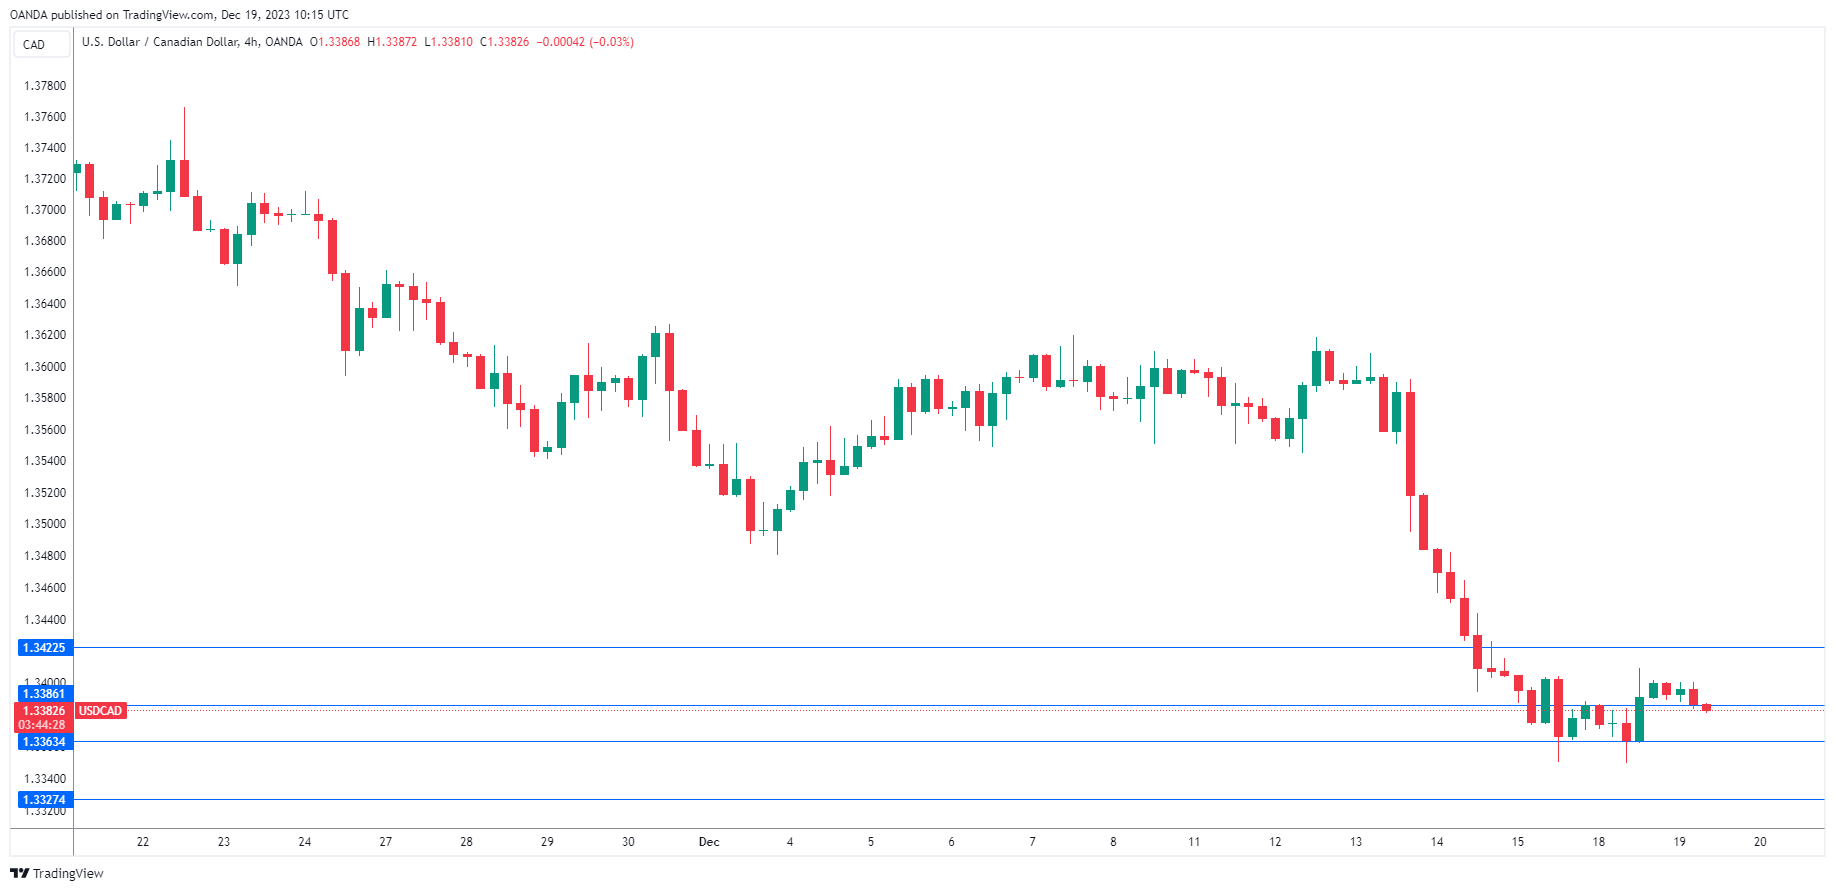
The Canadian dollar is showing little movement on Tuesday. In the European session, USD/CAD is trading at 1.3382, down 0.13%. We could see stronger movement from the Canadian dollar in the North American session, with the release of the Canadian inflation report.
Canadian inflation expected to ease to 2.9%
Canada releases the November inflation report later on Tuesday. In October, inflation dropped to 3.1% y/y, down sharply from 3.8%. The market consensus for November stands at 2.9%. Two key core inflation indicators are expected to ease to an average of 3.3%, down from an average of 3.5% in October.
A further drop in inflation would be an encouraging sign for the Bank of Canada, which has raised the cash rate to 5.0% but has paused three straight times. The BoC remained hawkish at the December meeting and kept the door open to additional rate hikes but the markets are convinced that the rate-tightening cycle is over and have priced in rate cuts next year, starting in mid-2024. A drop in the November inflation report would bolster expectations for rate cuts next year. If inflation surprises on the upside, it would bolster the Canadian dollar and force the BoC to continue pausing rates at restrictive levels (‘higher for lower’).
The US dollar has hit a rough patch since the Fed meeting last week when Fed Chair Powell penciled in three rate cuts next year. Traders are far more bullish and have priced in six rate hikes in 2024, starting in March.
We’re seeing some pushback from the Fed to dampen rate-cut fever in the markets. On Friday, New York Fed President John Williams said a rate cut in March was “premature” and even warned that rates could move higher if inflation were to stall or reverse. Cleveland Fed President Mester said on Monday that the markets are a “bit ahead” of the Fed on rate cuts, as the Fed was focused on how long it would need to maintain rates in restrictive territory, while the markets were focused on rate cuts.
USD/CAD Technical
- USD/CAD is testing support at 1.3363. Below, there is support at 1.3327
- There is resistance at 1.3386 and 1.3422
Japanese Yen Slides as BoJ Stands Pat
- BoJ makes no changes to policy or guidance
- Yen declines over 1%
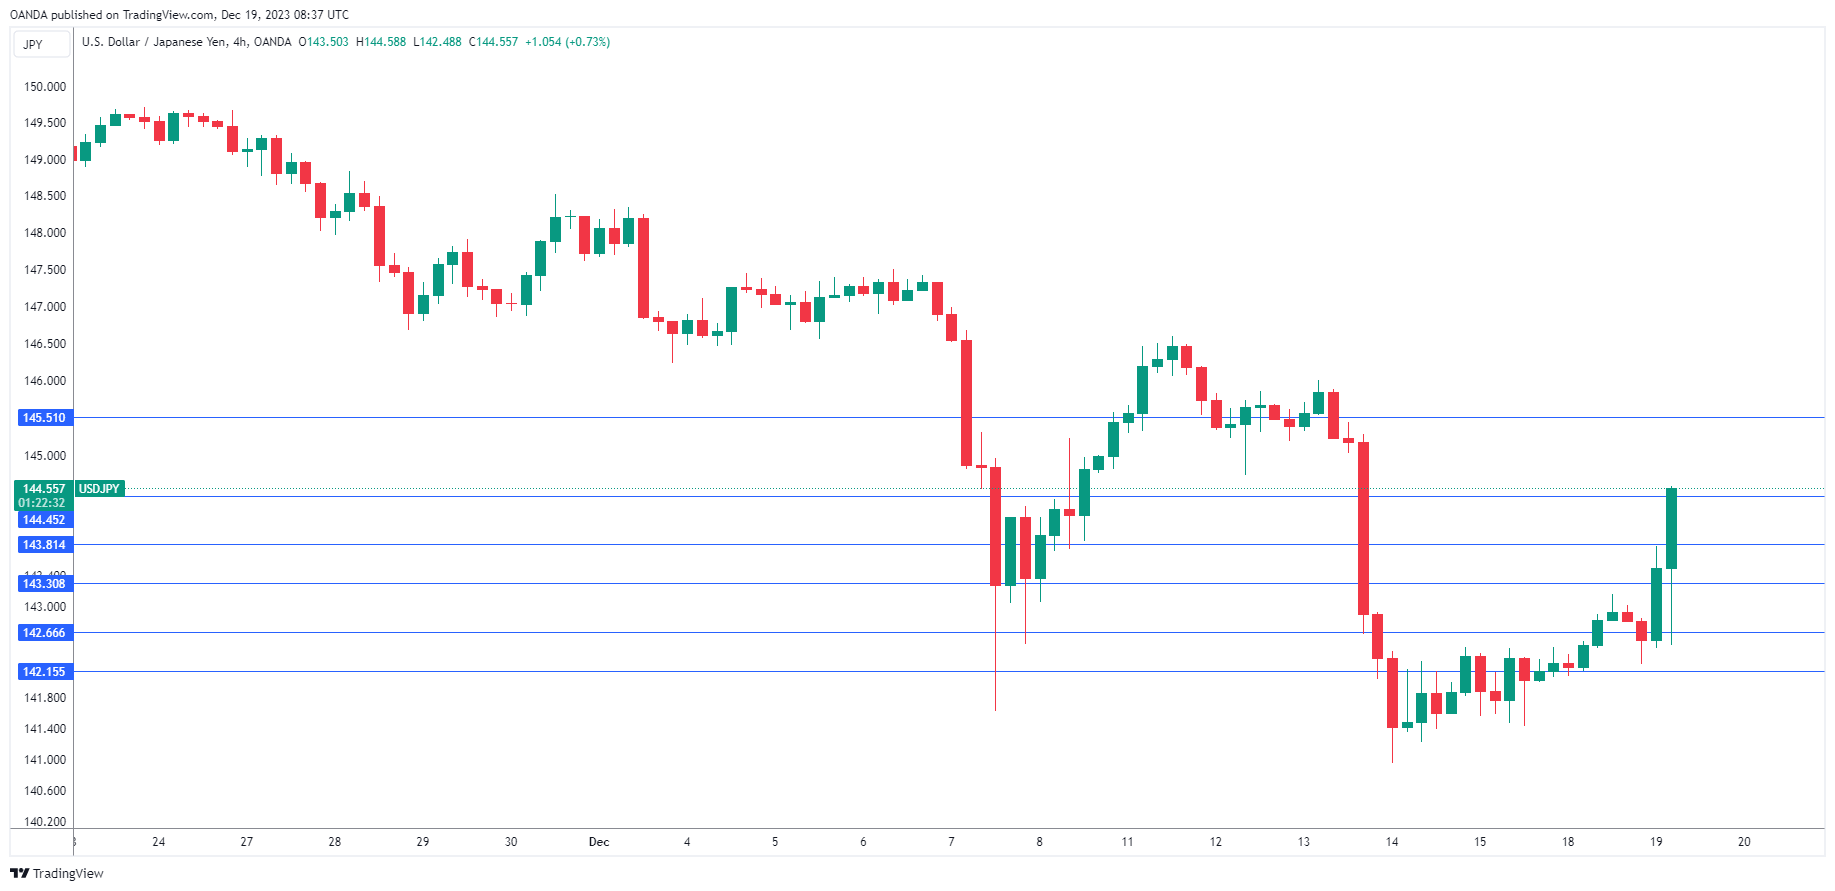
The Japanese yen is sharply lower on Tuesday. In the European session, USD/JPY is trading at 144.42, up 1.15%. The yen surged 1.95% last week but has faltered and pared most of those gains this week.
BoJ maintains policy
Tuesday’s Bank of Japan meeting was a live meeting, as there was speculation that the central bank might make a move after some broad hints of tighter policy from senior Bank officials. In the end, the meeting was a non-event as even a tweak in language was not to be found, and disappointed market participants gave the yen a thumbs down.
The BoJ maintained its policy settings, but speculation is high that the central bank will tighten policy next year, at a time when the other major banks are loosening policy as inflation moves lower. Governor Ueda acknowledged that prices and wages are moving higher but said more time was needed to determine if a “positive wage-inflation cycle will fall in place”. Core inflation has remained above the 2% target for some 19 months, but the BoJ has argued that inflation has been driven by cost-push factors and is not sustainable. At a post-meeting press conference, Ueda rejected exiting from the Bank’s ultra-loose policy, saying that uncertainty over the outlook is “extremely high”.
The markets have been exuberant since the Fed meeting last week when Fed Chair Powell penciled in three rate cuts next year. Traders are far more bullish and are betting on six rate hikes in 2024, starting in March.
We’re seeing some pushback from the Fed to reign in market expectations. On Friday, New York Fed President John Williams said a rate cut in March was “premature” and even warned that rates could move higher if inflation were to stall or reverse. Cleveland Fed President Mester said on Monday that the markets are a “bit ahead” of the Fed on rate cuts, as the Fed was focused on how long it would need to maintain rates in restrictive territory, while the markets were focused on rate cuts.
USD/JPY Technical
- USD/JPY has pushed past resistance at 143.30 and 143.81 and is testing resistance at 144.45. Above, there is resistance at 145.51
- There is support at 142.66 and 142.15
USD/JPY and NIKKEI React to Bank of Japan Decision
This morning, the Bank of Japan decided to leave interest rates unchanged at -0.10%. Its head, Kazuo Ueda, stated that:
→ the chances that the current ultra-loose monetary policy will change in January are very small;
→ further decisions of the Bank of Japan will be based on incoming economic information.
Thus, rumors that the Bank of Japan might raise rates from the negative zone did not come true. As a result, the NIKKEI index rose to November highs, and the yen weakened.
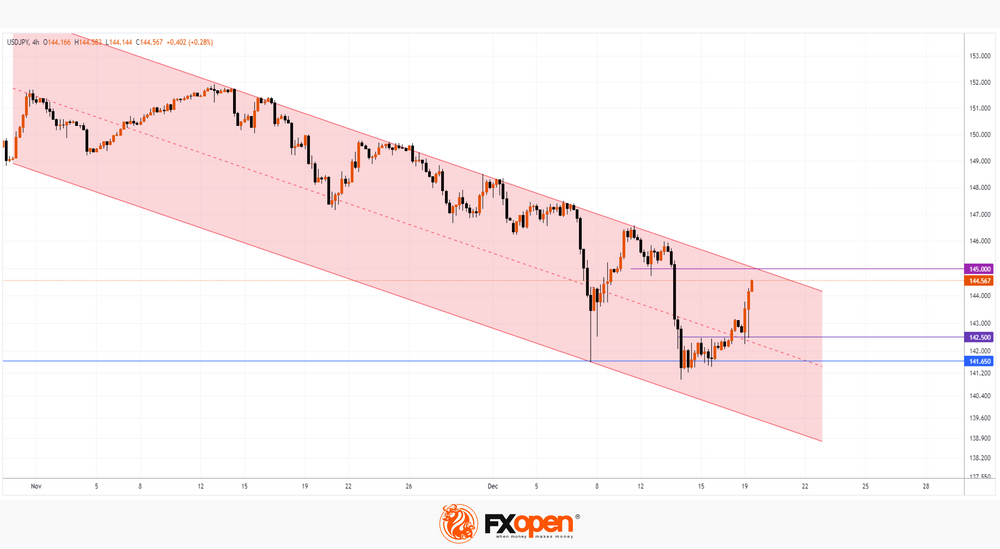
The 4 hour USD/JPY chart shows that:
→ The price forms a downward channel (shown in red). The strengthening of the yen against the US dollar, observed since November, was caused by both rumors related to the Bank of Japan and the prospect of a rate cut by the Federal Reserve.
→ The lower border of the channel pushed the price upward on December 7, indicating support at 141.65.
→ On December 14, there was an attempt at a bearish breakdown of this support. But instead of developing a downward movement to another touch with the lower border of the channel, the price entered into consolidation (an early bullish sign), which lasted until the end of last week and marked the resistance level of 142.5.
→ The closer the Bank of Japan's decision was, the stronger the bulls became. After breaking through the level of 142.5, it was tested. Moreover, not only the level of 142.5, but also the median line of the channel showed its support role.
The upward momentum that the USD/JPY market has received may develop during today's American session. It is possible that the quote will reach resistance at 145 yen per dollar, which is strengthened by the upper boundary of the downward channel.
This article represents the opinion of the Companies operating under the FXOpen brand only. It is not to be construed as an offer, solicitation, or recommendation with respect to products and services provided by the Companies operating under the FXOpen brand, nor is it to be considered financial advice.
Bulls Quickly Returned to Crypto
Market Picture
The second half of Monday proved to be for the bulls in cryptocurrencies, triggering a 3.5% rise in capitalisation over the last 24 hours to $1.61 trillion. Daily updates of all-time highs in US stock indices support the appetite for crypto. The Nasdaq100, which has previously had a pronounced impact on the cryptocurrency market, did so yesterday.
Bitcoin is trading just below $43K, and as of this morning, in a thinly liquid market, it was rising at a peak of $43.4K, an eight-day high. Bitcoin has formed a double bottom on the intraday charts, and this dynamic indicates that the mood for a deeper correction has not materialised. On the other hand, Tuesday’s peak is close to last Thursday’s, leaving Bitcoin inside the range.
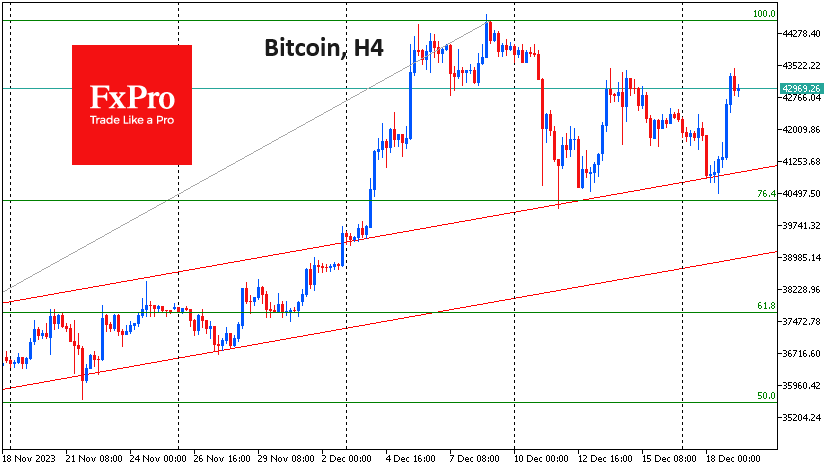
According to CoinShares, investments in crypto funds fell by $16 million last week for the first time after 11 weeks of inflows. Bitcoin investments were down $33 million, Ethereum was down $4 million, and Solana was up $11 million.
The slight outflow was more profit-taking than a change in sentiment, CoinShares said. Altcoins bucked the trend with inflows of $21 million, with Solana, Cardano ($3 million), XRP ($2.7 million) and Chainlink ($2 million) being the main beneficiaries. Trading activity remained well above the yearly average, totalling $3.6bn for the week.
News Background
Average fees on the Bitcoin network topped $37, hitting a yearly high. The growth was fuelled by another wave of activity in the Ordinals segment, which increased demand for space in the blockchain.
Cryptocurrency attorney and Crypto-Law founder John Deaton said that 20 per cent of US Senate members agree to support a ban on cryptocurrencies in the country. In his opinion, cryptocurrency opponent Senator Elizabeth Warren is the biggest threat to freedom in the US.
The issuer of the largest stablecoin USDT, Tether, has confirmed its course of cooperation with the US authorities. The firm said it is committed to fighting the illegal use of USDT.
Speculators have started reselling Solana’s Saga smartphones on eBay at prices above $2000 due to the hype surrounding the BONK meme-token Airdrop. Buyers of Saga phones get a guaranteed giveaway of 30 million BONK, worth more than the original price of the smartphone.
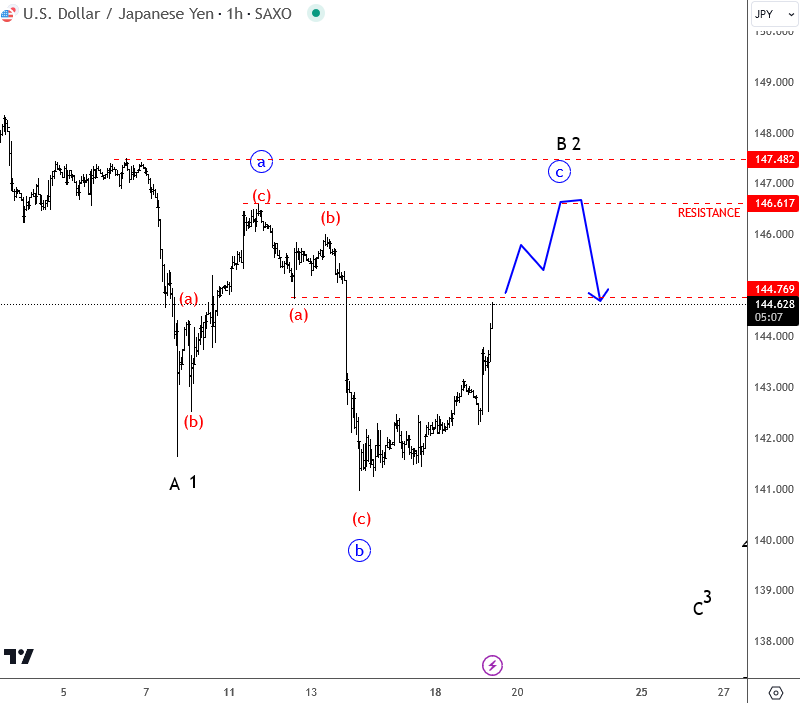
USD/JPY Remains Trapped in a Correction Following BoJ
Today's focus is on the Bank of Japan's decision to maintain its current policy stance, which has led to a depreciation of the Japanese Yen. Consequently, the USD/JPY pair is on an upward trajectory, seeking higher resistance levels. Although this trend may extend further, there is an anticipation of a potential downturn in 2024.
Ueda's hint at policy normalization in March 2024, along with the possibility of unforeseen market events, suggests a future shift in policy that could result in increased volatility and potentially strengthen the Yen. The latest Elliott wave analysis indicates a notable ongoing recovery, with the pair approaching the 144.76 mark. Surpassing it would validate the hypothesis that the recent decline was a three-wave move, indicative of a complex correction. Key resistance for a flat correction is identified in the 146.6 to 148 range, providing critical points to monitor for future market movement.