

Sample Category Title
GBP/USD Daily Outlook
Daily Pivots: (S1) 1.2616; (P) 1.2660; (R1) 1.2691; More...
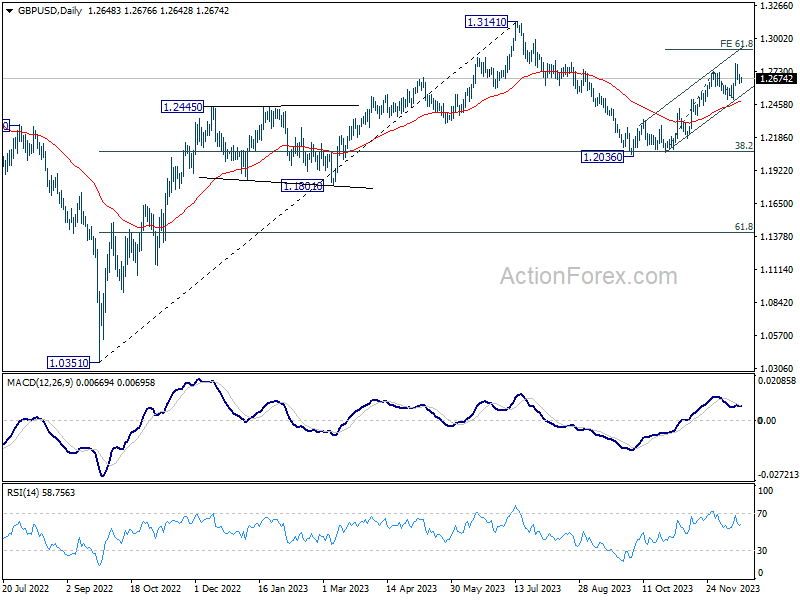
No change in GBP/USD's outlook as consolidation from 1.2793 is still extending. Intraday bias remains neutral at this point. Further rally is expected as long as 1.2499 support holds. On the upside, firm break of 1.2793 will resume the rally from 1.2036. Next target is 61.8% projection of 1.2068 to 1.2731 from 1.2499 at 1.2909.
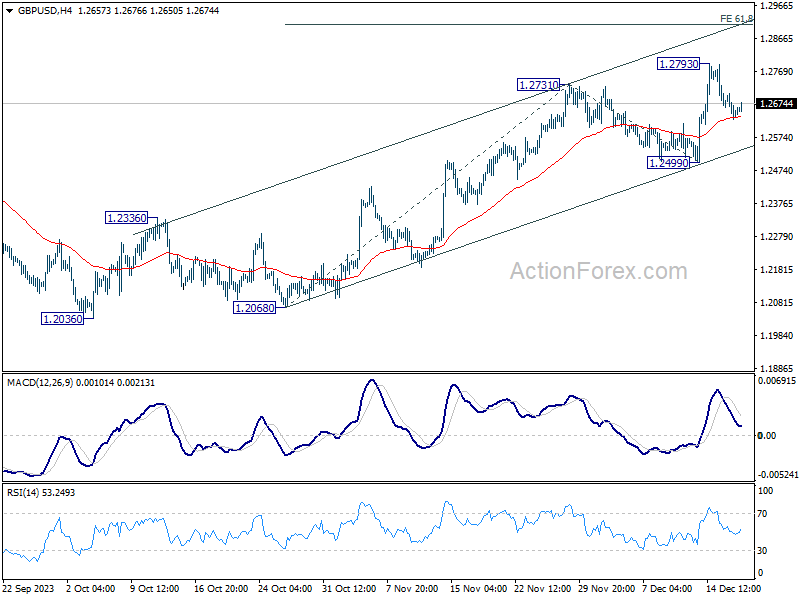
In the bigger picture, price actions from 1.3141 medium term top are seen as a corrective pattern to rise from 1.0351 (2022 low). Rise from 1.2036 is seen as the second leg that's in progress. Upside should be limited by 1.3141 to bring the third leg of the pattern. Meanwhile, break of 1.2499 support will argue that the third leg has already started for 38.2% retracement of 1.0351 (2022 low) to 1.3141 at 1.2075 again.
USD/CHF Daily Outlook
Daily Pivots: (S1) 0.8655; (P) 0.8683; (R1) 0.8700; More....
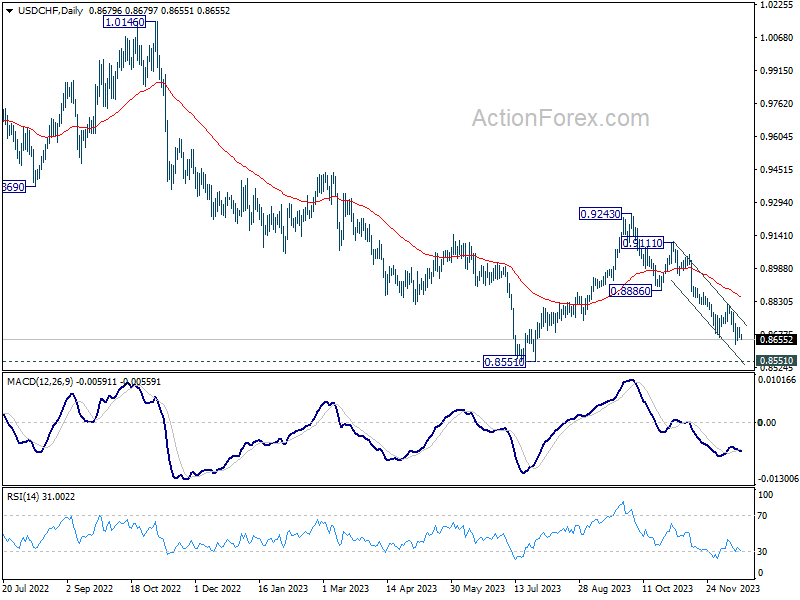
Outlook in USD/CHF is unchanged. Intraday bias stays neutral as consolidation from 0.8629 might extend further. But further decline is expected with 0.8819 resistance intact. On the downside, break of 0.8629 will resume larger fall from 0.9243 to retest 0.8551 key support next. On the upside, however, firm break of 0.8819 will turn bias back to the upside for stronger rebound.
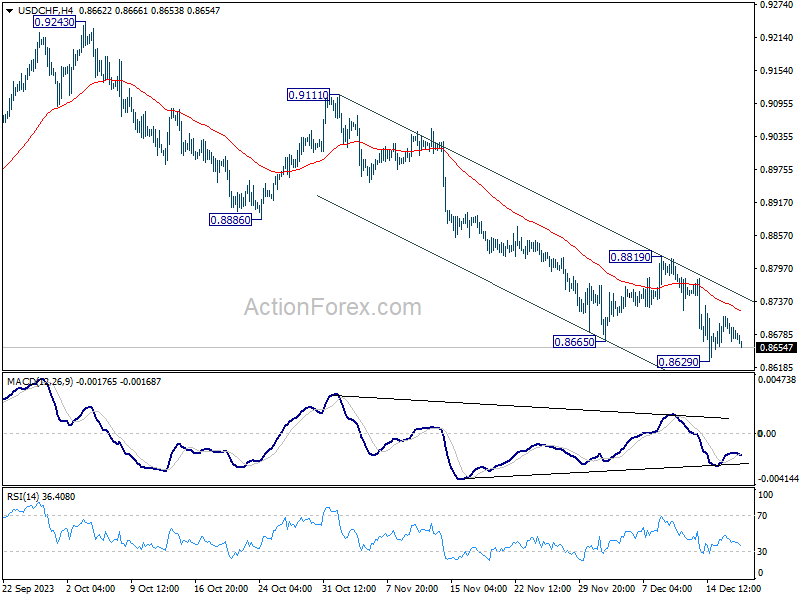
In the bigger picture, price actions from 0.8551 are currently seen as a corrective pattern to the decline from 1.0146 (2022 high). Fall from 0.9243 is seen as the second leg for now. Strong support should be seen 0.8551 to bring rebound. Meanwhile, break of 0.9111 resistance will argue that the third leg has started already, and target 0.9243.
New Threat to Inflation
The week started with mixed feelings. Investors broadly ignored the Federal Reserve (Fed) members’ latest warnings that the interest rate cuts won’t come as soon and as fast as priced in by the financial markets. Equity bulls look determined to keep the Xmas magic alive. Big banks like Goldman Sachs also add fuel on fire, citing that the dovish Fed is good for stocks. We all agree. Dovish Fed is good for stock valuations, yet, how long the Fed could remain dovish if the economy heats up?
Anyway, attention was rather on a burst of mergers and acquisitions worth around $40bn that hit the wire on Monday. The S&P500 advanced to a fresh ytd high yesterday, while Nasdaq 100 renewed record for the 2nd straight session. Amazon rallied 2.73% yesterday, as Nvidia tested the $500 offers for the 3rd time since August. Apple was an exception to another euphoric day of trading, as its shares fell after hitting a fresh high last week on news that China is extending its ban of foreign device usage and on news that the company will halt the sale of Apple watches on a patent dispute.
Reality check
Yesterday’s trading was also marked by geopolitical tensions and news. The week started with the news that the world’s leading shipping companies decided to halt transit through the Suez Canal due to attacks by Iran-backed Houthis on commercial ships. The latter increases the risk premium of using the short-cut of Suez Canal and encourages ships to go around Africa instead. Considering that around 12% of global trade goes through the Suez Canal, and the deviation around Africa adds between 6 to 14 days to shipments, the Red Sea disruptions delay the shipment of goods but also increase the price of shipping the goods. This, coupled with the disruption in Panama Canal due to drought-induced delays put the global supply chains under pressure, again.
Big shipping company stocks gain as they can increase their prices, energy companies also started announcing that they will avoid transiting via the Red Sea region. Crude oil and natural gas prices come under a renewed positive pressure.
An extended period of disruption in global trade ways should not only sustain energy prices, but also put a renewed pressure on global supply chains and shipping prices. The latter is a threat to inflation. Remember, the pandemic-related supply chain disruptions were the major reason that sent inflation to almost 10% in the US. Middle East tensions are expected to have a modest impact compared to the pandemic disruption, but the rising shipping costs – if they last – could lead to an uptick in inflation. Therefore, it is well possible that the Fed uncorked the champagne before winning the inflation battle.
As of today, upside risks to inflation persist and build up, and this will inevitably dawn on investors sooner rather than later. A stronger case is being built for a sizeable downside correction in both stock and bond markets into next year.
This being said, the Eurozone’s November inflation numbers are out this morning; headline inflation is expected to have eased to 2.4% and core inflation to 3.6% in November. Inflation in Canada is expected to fall below the 3% mark. Sufficiently soft inflation figures could cheer up investors, but it’s worth keeping an eye on shipping news.
BoJ on Hold
In focus today
Today, euro area final HICP data for November will be released. With all the details out, it will be interesting to see what drove the downtick in inflation in November.
In the US, we will get housing starts and building permits for November.
On the central bank front, we have a few ECB speakers and Fed's Bostic on the wires today.
Following today's BoJ decision, we will get Japanese trade data overnight.
Also, overnight, China will announce 1-year and 5-year loan rates but no changes are expected at this point.
The 60 second overview
BoJ: The Bank of Japan kept its quantitative and qualitative easing with yield curve control policy unchanged this morning as expected. The policy rate stays at -0.1% and the 10-year yield target around 0, with the upper bound of 1.0 percent as a reference rate. The bank offers no clues on plans for tightening in 2024 and even kept the pledge to "not hesitate to take additional easing measures if necessary". USD/JPY took a leg higher on the decision as it traded back above 143, but the yen remains off the very weak levels from November. We continue to look for the April meeting as the most likely timing for the next move from the BoJ but the January meeting could also be interesting. Dismantling YCC and hiking the policy rate out of negative will be on the agenda if wages accelerate in the spring as expected.
Red Sea: The attacks by Houthi rebels on vessels passing through the Red Sea continue to induce shipping companies to pull out of the region. Yesterday, energy prices rose following BP's decision to bypass the waters due to security risks. According to shipping data compiled by Bloomberg, transportation activity through the Red Sea has dropped 35% since the beginning of December. As about 10-15% of global seaborne trade passes through the Suez Canal, the risk of new supply disruptions has risen. This could also pose upward risks to inflation next year. US Defence Secretary Austin will today meet fellow ministers to gather a maritime task force to deal with the attacks.
Equities: Global equities were marginally higher yesterday as US and cyclical growth stocks rose. It was interesting to see financials, industrials, and utilities lower. We argue this does not mark a change of the recent rotations, but markets have made it a long way the last two months and we may be in for a period with smaller moves and less difference between best and worst performers. In the US yesterday, Dow +0.00%, S&P 500 +0.5%, Nasdaq +0.6% and Russell 2000 -0.1%. Asian markets focus on the BoJ meeting which did not bring much news or changes. This resulted in a weaker yen and higher equities. Futures in Europe are marginally higher while US futures are flattish.
FI: Hawkish comments from ECB/Fed members provided some headwinds to bond markets in yesterday's session. Bund yields rose 5-6bp across the curve with markets continuing to price in 150bp worth of cuts next year. The 10Y BTP spread to Bunds tightened a couple of basis points throughout the session. Inflation swap rates rose slightly with energy prices as BP halted their shipping routes through the Red Sea.
FX: The JPY weakened immediately after Bank of Japan's decision to leave rates and YCC unchanged. USD/JPY rose from 142.60 to 143.60. After last week's gyrations, EUR/USD has remained flat around 1.09 this week. EUR/GBP moved higher again yesterday with focus on a speech by MPC Breeden later today and CPI tomorrow. EUR/NOK has continued to trade on a heavy note this week with the cross moving firmly below the 11.40-mark and EUR/SEK too is on the defensive.
USD/JPY Daily Outlook
Daily Pivots: (S1) 142.15; (P) 142.66; (R1) 143.30; More...
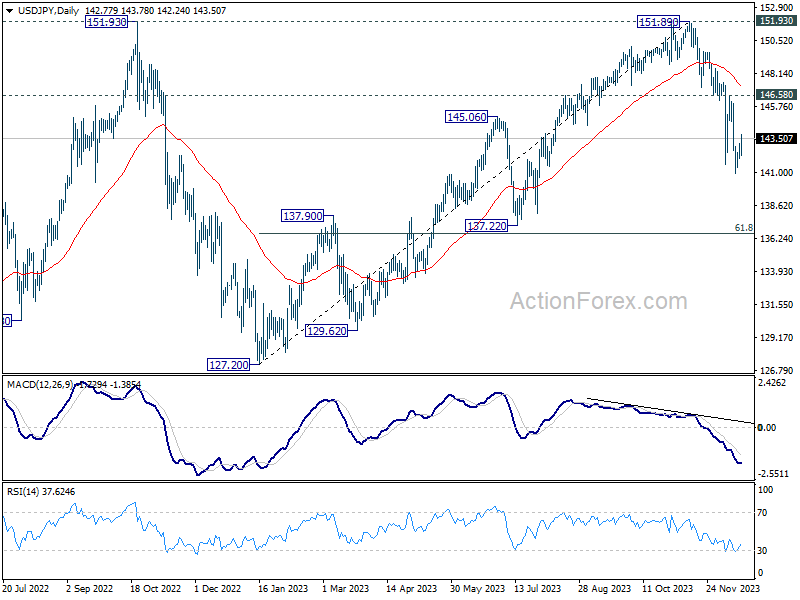
While USD/JPY's recovery from 140.94 extends higher today, outlook is unchanged. Upside of recovery should be limited well below 146.58 resistance to bring another decline. On the downside, break of 140.94 will resume the fall from 151.89 to next fibonacci level at 136.63.
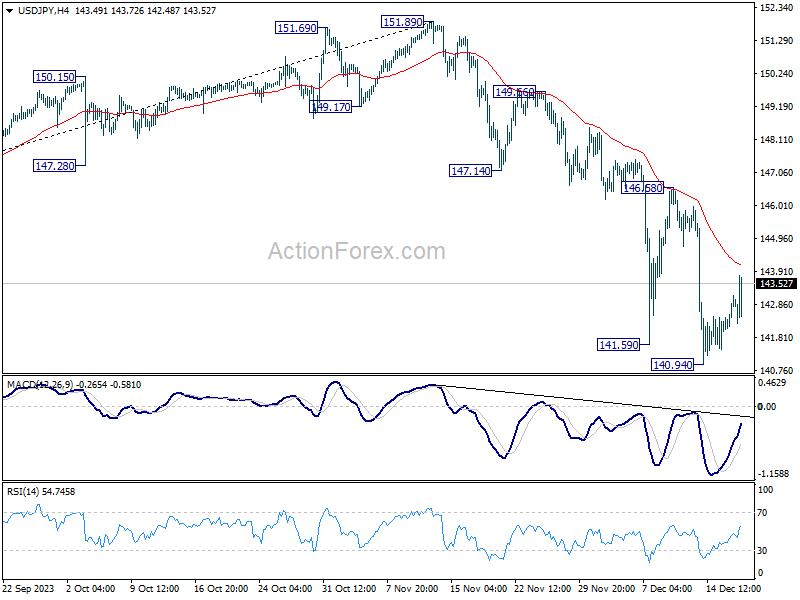
In the bigger picture, fall from 151.89 is seen as the third leg of the corrective pattern from 151.93 (2022 high). Deeper decline would be seen to 61.8% retracement of 127.20 to 151.89 at 136.63, sustained break there will pave the way to 127.20 support (2022 low). This will now remain the favored as long as 146.58 resistance holds.
Yen Dips Post-BoJ, Kiwi and Aussie Gain
Yen falls broadly today after BoJ's to maintain monetary policy unchanged. The sell-off can be attributed to the dismay of investors who had hoped for indications of a shift towards stimulus exit next year. BoJ's steadfastness in its easing bias, without any hint of a policy adjustment, has contributed to Yen's softening. Although this doesn't signify an outright bearish reversal for Yen, it does set a tone of mild vulnerability for the currency as the year draws to a close, with mild downside risks ahead.
In contrast, New Zealand Dollar and the Australian Dollar are firming up mildly. Kiwi's uplift is primarily driven by modest improvement in New Zealand's business confidence data, suggesting a more optimistic economic outlook in the region. Australian Dollar is finding support from RBA's latest meeting minutes which struck a balanced tone, but left the door ajar for possible future rate hikes.
Elsewhere, Dollar and Euro are lagging behind, following Yen in terms of performance. Swiss Franc and Sterling, on the other hand are emerging as stronger contenders. Canadian Dollar is presenting a mixed picture as investors and analysts await the release of Canada's CPI, which is expected to provide further clarity on the country's inflation trajectory and, by extension, potential monetary policy directions.
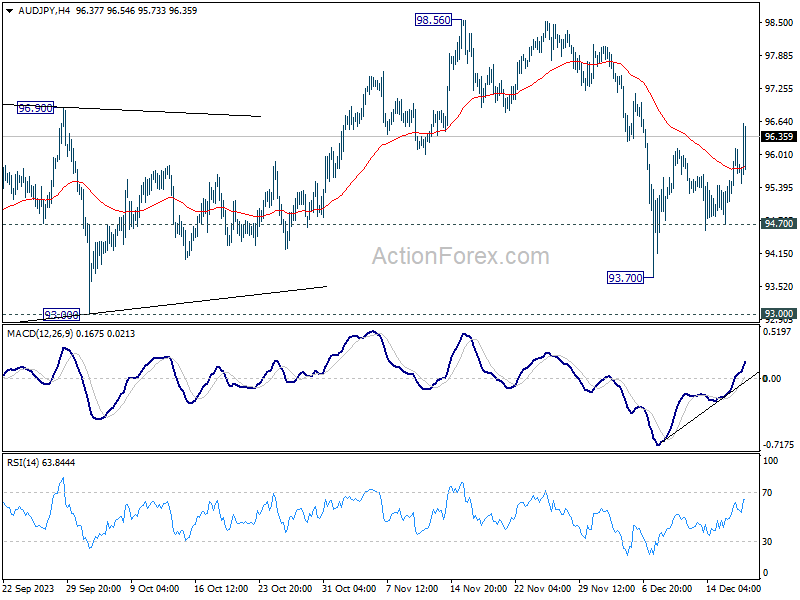
Technically, AUD/JPY's rebound from 93.70 resumed by breaking through 96.13 minor resistance. Further rise is now in favor as long as 94.70 support holds. Upside could be capped by 98.56 resistance, at least on the first attempt. Corrective pattern from 98.56 could extend with another falling leg before completion. Meanwhile, break of 94.70 will bring retest of 93.70 instead.
In Asia, Nikkei closed up 1.41%. Hong Kong HSI is down -1.08%. China Shanghai SSE is down -0.47%. Singapore Strait Times is up 0.23%. Japan 10-year JGB yield fell -0.0286 to 0.641. Overnight, DOW closed up 0.00%. S&P 500 rose 0.45%. NASDAQ rose 0.62. 10-year yield rose 0.026 to 3.954.
BoJ holds steady despite speculation for tweaks
BoJ decided to maintain its monetary policy unchanged, a move that has come as a disappointment to some observers who anticipated minor policy changes or at least some alterations in the statement.
Under the Yield Curve Control framework, short-term policy interest rate remains at -0.1%. BoJ has also maintains its target for the 10-year JGB yield at approximately 0%, allowing for a cap of 1% for yield fluctuations. This decision was reached unanimously.
In addition, BoJ reiterated its commitment to an easing bias, stating it "will not hesitate to take additional easing measures if necessary."
Regarding Japan's economic outlook, BoJ expects a moderate ongoing recovery in the near term. However, it acknowledges downward pressures, primarily due to a slowdown in the recovery pace of overseas economies. Looking ahead, the central bank projects that as a positive cycle from income to spending strengthens, Japan's economy will continue to grow at a rate above its potential growth rate.
In terms of inflation, BoJ anticipates CPI core to remain above 2% through fiscal 2024. Underlying inflation is expected to "increase gradually toward achieving the price stability target."
RBA considered hike and hold, Dec minutes show
Minutes of RBA's December 5 meeting revealed that both a 25bps hike and maintaining the status quo were considered. Ultimately, they opted to keep the interest rate unchanged at 4.35%. The rationale behind this decision was the perceived value in "waiting for further data to assess how the balance of risks was evolving and how best to balance these risks when setting policy."
The board members concurred that the need for additional monetary tightening to ensure inflation returns to the target within a reasonable timeframe would be contingent on how incoming data influences the economic outlook and the assessment of risks.
The RBA emphasized its commitment to closely monitoring various economic indicators in its future policy decisions. This includes developments in the global economy, trends in domestic demand, and the outlook for inflation and the labor market.
NZ ANZ business confidence improved to 33.2, with mixed inflation signals
New Zealand's ANZ Business Confidence climbed from 30.8 to 33.2 in December. Looking into the specifics, own activity outlook improved from 26.3 to 29.3, indicating positive sentiment about future business conditions. However, investment intentions dropped from 4.5 to 2.7, suggesting some hesitancy in capital expenditures. Employment intentions rose from 5.4 to 7.0, reflecting moderately stronger inclination towards hiring.
In terms of pricing, there was a noticeable increase, with pricing intentions moving from 46.8 to 50.2. This rise implies that more businesses are planning to increase their prices, which could contribute to inflationary pressures. Similarly, cost expectations saw an upward movement from 73.9 to 76.2, indicating rising costs for businesses. On the other hand, inflation expectations showed a decline from 4.79% to 4.61%.
ANZ commented on the mixed nature of the inflation indicators, as they do not present an encouraging outlook for inflation. With more data expected before RBNZ's February decision, this survey's results might not be among the most favorable. While recent GDP data showed RBNZ's measures gaining more traction than previously understood, the extent of economic downturn required to bring inflation down to the 2% target remains an unresolved question.
New Zealand's trade deficit narrows to NZD -1.2B, led by decreased trade with china
New Zealand's goods trade deficit narrowed from NZD 1.7B to NZD 1.2B in November, aligning largely with market expectations. Exports fell by NZD 337m, representing -5.3% yoy decline, settling at NZD 6.0B. Meanwhile, imports saw a more substantial reduction of NZD 1.3B, -15% yoy decrease, totaling NZD 7.2B.
A key factor in these changes is reduced trade volume with China, which led contraction in both imports and exports. Exports to China decreased by NZD 183m, -9.7% yoy fall. Imports from China also saw a substantial reduction of NZD 347m, marking -17% yoy decrease.
Other key trading partners also showed varied trends. Exports to Australia and EU declined by NZD 35m (-4.5% yoy) and NZD 27m (-9.1% yoy), respectively. Conversely, exports to US increased by NZD 110m, a significant 18% yoy rise. Exports to Japan experienced a sharp decline of NZD 99m, -27% yoy drop.
In the realm of imports, alongside China, EU, Australia, US, and South Korea all registered declines. Imports from the EU decreased by NZD 164m (-14% yoy), from Australia by NZD 219m (-23% yoy), from the US by NZD 68m (-11% yoy), and from South Korea by NZD 231m (-32% yoy).
Fed's Daly views 2024 as right for rate cuts, timetable uncertain
San Francisco Fed Bank President Mary Daly, in a Wall Street Journal interview yesterday, suggested that it might be appropriate for policymakers to start considering rate cuts in 2024, especially considering the easing of inflation this year. However, she also cautioned that it is premature to speculate on the exact timing of these rate reductions.
Daly emphasized the delicate balancing act Fed faces: the need to achieve price stability while minimizing job losses. Fed's goal is to bring inflation down to its 2% target, but Daly highlighted the importance of doing so gently, "with as few disruptions to the labor market as possible."
Another key point from Daly's interview concerns the real borrowing costs for households and businesses. With inflation showing a downward trend, maintaining the current rate could inadvertently increase these costs. Daly conveyed her wariness that "we could overtighten quite easily, and so that's what I'm mindful of".
Aligning with the broader perspective of Fed policymakers, Daly's views resonate with the median projections released last week. These projections suggest a majority of the 19 Fed policymakers anticipate a 75 basis-point reduction from the current target range of 5.25%-5.50% for the policy rate, aiming to bring inflation down to about 2.4% by the year's end.
BoC's Macklem see rate cuts in 2024, but with focus on core inflation trend
BoC Governor Tiff Macklem, in an interview with Bloomberg overnight, indicated that interest rate cuts are being considered "sometime in 2024," but he emphasized that this decision hinges critically on the sustained easing of core inflation.
Macklem underlined the importance of core inflation as a key focus for BoC. He stated, "We're very focused on core inflation." Specifically, he pointed out the necessity for "a number of months with sustained downward momentum in core inflation" before the central bank can confidently move forward with interest rate cuts.
Nevertheles, Macklem expressed a growing confidence in the effectiveness of the current monetary policy, acknowledging that "increasingly, the conditions are in place to get us back to two-per-cent inflation."
However, he was clear in conveying that this goal has not been fully achieved yet, stating, "but that is not yet assured, we're not there yet."
Looking ahead
Swiss trade balance and Eurozone CPI final will be relased in Euroepan session. Later in the day, Canada CPI, IPPI and RMPI will be featured while US will publish housing starts and building permits.
USD/JPY Daily Outlook
Daily Pivots: (S1) 142.15; (P) 142.66; (R1) 143.30; More...
While USD/JPY's recovery from 140.94 extends higher today, outlook is unchanged. Upside of recovery should be limited well below 146.58 resistance to bring another decline. On the downside, break of 140.94 will resume the fall from 151.89 to next fibonacci level at 136.63.
In the bigger picture, fall from 151.89 is seen as the third leg of the corrective pattern from 151.93 (2022 high). Deeper decline would be seen to 61.8% retracement of 127.20 to 151.89 at 136.63, sustained break there will pave the way to 127.20 support (2022 low). This will now remain the favored as long as 146.58 resistance holds.
Economic Indicators Update
| GMT | Ccy | Events | Actual | Forecast | Previous | Revised |
|---|---|---|---|---|---|---|
| 21:45 | NZD | Trade Balance (NZD) Nov | -1234M | -1200M | -1709M | -1730M |
| 00:00 | NZD | ANZ Business Confidence Dec | 33.2 | 30.8 | ||
| 00:30 | AUD | RBA Meeting Minutes | ||||
| 02:49 | JPY | BoJ Interest Rate Decision | -0.10% | -0.10% | -0.10% | |
| 07:00 | CHF | Trade Balance (CHF) Nov | 3.50B | 4.60B | ||
| 10:00 | EUR | Eurozone CPI Y/Y Nov F | 2.40% | 2.40% | ||
| 10:00 | EUR | Eurozone CPI Core Y/Y Nov F | 3.60% | 3.60% | ||
| 13:30 | USD | Housing Starts Nov | 1.360M | 1.372M | ||
| 13:30 | USD | Building Permits Nov | 1.470M | 1.498M | ||
| 13:30 | CAD | Industrial Product Price M/M Nov | -0.70% | -1.00% | ||
| 13:30 | CAD | Raw Material Price Index Nov | -3.50% | -2.50% | ||
| 13:30 | CAD | CPI M/M Nov | -0.10% | 0.10% | ||
| 13:30 | CAD | CPI Y/Y Nov | 2.90% | 3.10% | ||
| 13:30 | CAD | CPI Median Y/Y Nov | 3.30% | 3.60% | ||
| 13:30 | CAD | CPI Trimmed Y/Y Nov | 3.40% | 3.50% | ||
| 13:30 | CAD | CPI Common Y/Y Nov | 4.00% | 4.20% |
RBA Minutes December 2023: The Benefits of Waiting
Monetary policy is working to bring demand and supply back into alignment and inflation back to target, and some of the concerns that would support a case to raise rates further were effectively dismissed by data released after the meeting. The Board’s decision to hold was therefore vindicated by subsequent events.
The minutes of the December meeting of the RBA Board highlighted the benefits of testing your assessment of the economy against subsequent data. Monetary policy is working to bring demand and supply back into closer alignment and inflation back to target, and some of the concerns that would support a case to raise rates further were effectively dismissed by data released after the meeting. The Board’s decision to hold was therefore vindicated by subsequent events.
The RBA Board was encouraged by global inflation news, noting towards the end of the minutes that the pace of disinflation had picked up in some economies. Labour markets and wages growth were moderating, more so in Europe than the United States. Services inflation can be expected to continue to decline, even if the pace has been slow to date, which is a promising sign for Australia. Slower global demand was also resulting in lower oil prices, another good sign for global inflation. The news in China was also a bit more positive than a few months ago; outside the property sector, the broader situation is still supporting iron ore prices.
Domestically, there was not much news, and what was available at the time of the meeting was not view-changing. The October CPI indicator contained little new information on the services prices that are the RBA’s current inflation concern. The Board did strike a note of caution about the balance of risks on wages growth ‘shifting a little to the upside’, with wages growth reaching 4% ‘a little sooner than had been expected’. But it also described wages growth as ‘unlikely to rise much further’ and ‘peaking at around 4 per cent by the end of the year’; the RBA’s November forecasts have growth in the Wage Price Index still at 4% over the year to June quarter 2024 as well. It is important not to make too much of small wording nuances or forecast adjustments, but this does suggest that the shifts in risks that the Board noted are small indeed. The Board’s discussion of labour market conditions noted that these were less tight and likely to ease further in coming months, with a risk that unemployment could increase by more than forecast.
As has been the case for several months, the Board considered both the case to raise rates and the case to hold them steady. Key to the case to raise rates was the assessment that ‘domestic demand was judged still to be running above the level consistent with the inflation target’.
Following the Board meeting, though, we have seen the release of the national accounts for the September quarter, which were noticeably softer than expected, especially for household consumption. The December Labour Force Survey also showed a workforce offering more labour supply in an attempt to counteract cost of living pressures. These subsequent developments cut against the narrative in the minutes of below-trend output growth having negative implications for productivity, at least beyond the quarter-to-quarter noise. They also cut against the depiction of business investment as still being strong (see Westpac Economics’ note on the national accounts).
The argument that ‘growth could be supported in the year ahead by a recovery in real household disposable income as inflation declined’, cited as part of the case for a rate increase, also seems optimistic in light of subsequent information. Board members acknowledged that consumption growth was weak and that the household sector was being squeezed by the higher cost of living and higher interest rates – politely omitting the role of taxation in reducing real household disposable incomes. While policy needs to be forward-looking, there is also a risk of getting ahead of oneself, and worrying about a turnaround in household incomes does seem like an example of this. The emphasis in the minutes on the share of household income going to interest payments being lower than in 2008 also seems misplaced. Real household disposable income was not falling in 2008.
As a possible nod to the recently released Statement on the Conduct of Monetary Policy, the minutes noted that financial stability considerations were not a constraint on monetary policy at present. The Board also explicitly noted that the November forecasts saw inflation returning to the top of the target band by end-2025, rather than the midpoint of the band. This suggests a more rigid interpretation of the Statement than the actual text implies. There is nothing in the text of that agreement specifying a fixed horizon for achieving the target. Rather, it says ‘The appropriate timeframe for this depends on economic circumstances and should, where necessary, balance the price stability and full employment objectives of monetary policy.’ If the Board were to shift the goalposts on its ambition for disinflation, it would need to explain how that fits in with its full employment objectives and the squeeze on household incomes. That would require explicit communication separate from the minutes.
In the end, though, the Board found the case to hold rates steady to be stronger than the case to raise rates. Inflation is declining and, so far, inflation expectations remain consistent with target. While there is a risk inflation comes down too slowly, there is also a risk – in our view partly realised in the September quarter national accounts – that aggregate demand slows more than expected.
The post-meeting data releases rendered much of the analysis in the minutes stale. The Board will need to incorporate a fresh assessment of the outlook for domestic demand ahead of its February meeting, as well as the November and December reads on inflation. Unless these inflation data are noticeably higher than expected (we are forecasting CPI +0.8%qtr, +4.3%yr; trimmed mean +0.9%qtr, +4.4%yr), we see the case to raise rates in February as having been weakened by the recent data flow; we continue to see it as more likely that rates will be held steady following that meeting. While the minutes highlighted a range of possible upside risks to demand and inflation, some of these seemed quite low-probability given experience overseas.
The minutes also discussed the Bank’s approach to reducing its bond holdings. The Board agreed to continue with passive run-off via bond maturities, rather than sell actively (so-called ‘active QT’). The decision was discussed in the context of the coming maturity of the bulk of the Term Funding Facility. There is also a bunching of maturities in April 2024, which had been the target bond for part of the period that yield targeting was in place. We take from this discussion that active sales of bonds are not on the table until these bunched maturities have passed. The question of whether active QT should be considered after that point is a separate issue and depends on the broader framework for monetary policy implementation. That framework will need to articulate the costs and benefits for the public interest of reducing the interest rate risk on the central bank’s balance sheet.
Technical Outlook and Review
DXY:
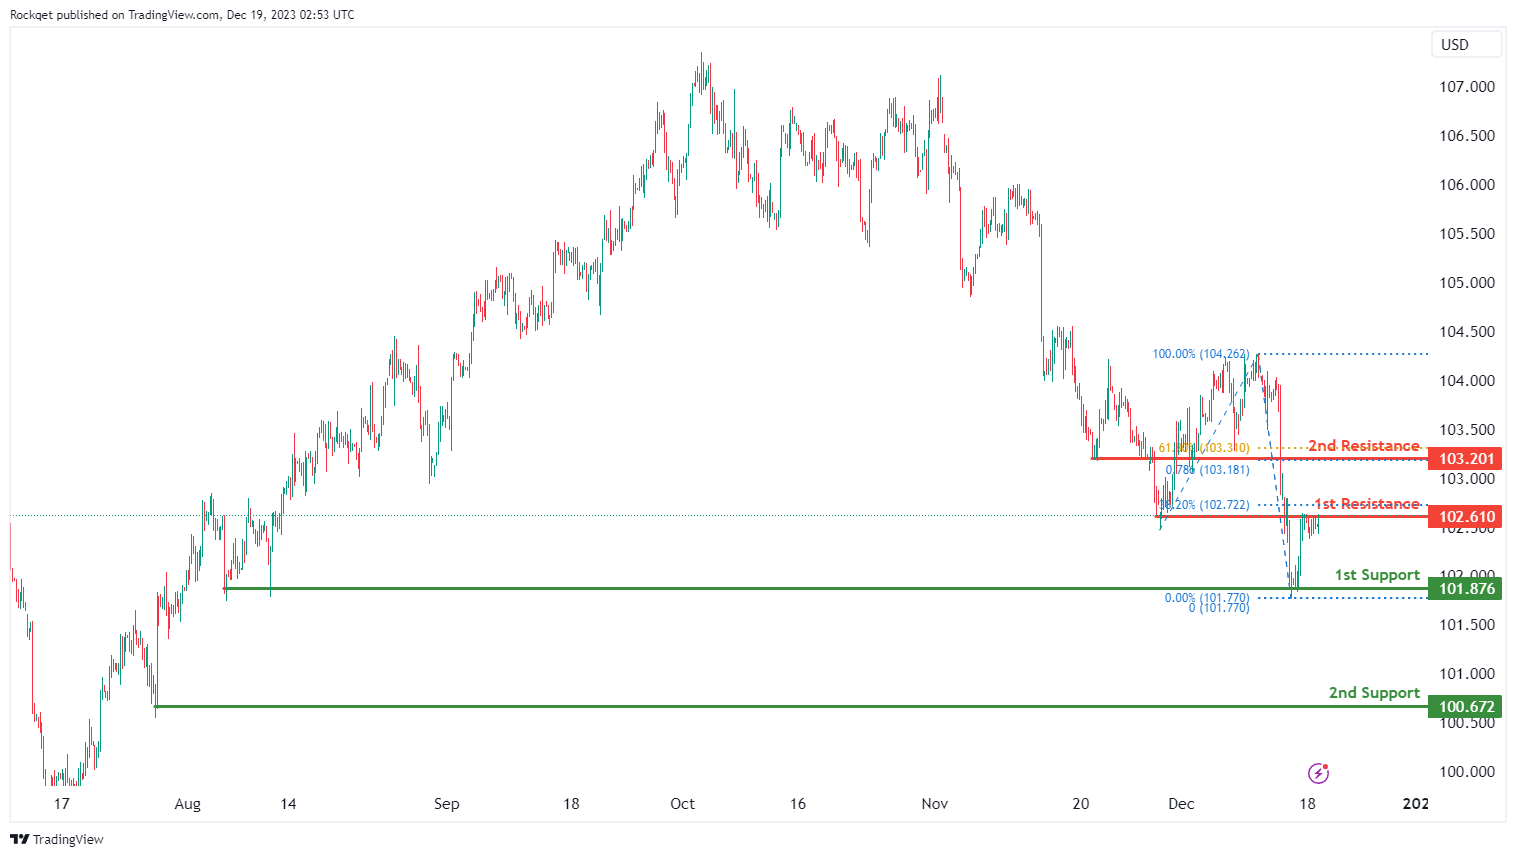
The DXY (US Dollar Index) chart currently shows an overall bearish momentum, indicating a potential for price to make a bearish reaction off the 1st resistance and fall towards the 1st support.
The 1st resistance level at 102.61 is identified as an overlap resistance that aligns close to the 38.20% Fibonacci retracement level. Higher up, the 2nd resistance level at 103.20 is also marked as an overlap resistance that aligns with a confluence of Fibonacci levels i.e. the 61.80% retracement and the 78.60% projection levels, suggesting a potential barrier for further upside movement.
To the downside, the 1st support level at 101.87 is identified as a multi-swing-low support. Further below, the 2nd support level at 100.67 is noted as a swing-low, further reinforcing its importance as a potential key support level.
EUR/USD:
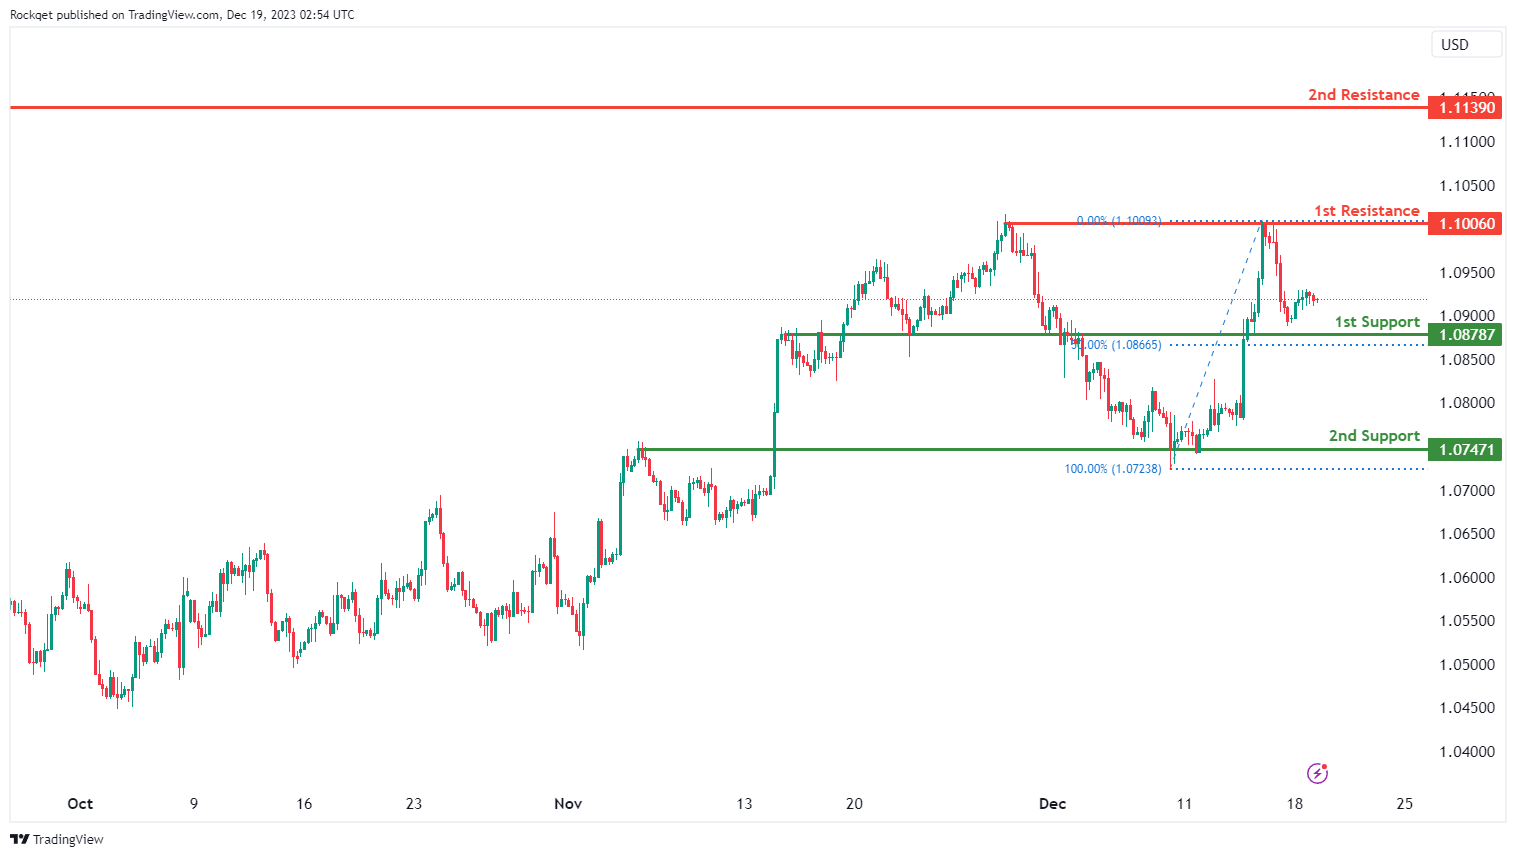
The EUR/USD chart currently exhibits an overall bearish momentum. In this context, there is a potential scenario for price to make a bearish continuation towards the 1st support.
The 1st support level at 1.0878 is identified as an overlap support that aligns close to the 50.00% Fibonacci retracement level. Further below, the 2nd support level at 1.0747 is also marked as an overlap support, further reinforcing its importance as a potential key support level.
To the upside, the 1st resistance level at 1.1006 is identified as a multi-swing-high resistance. Higher up, the 2nd resistance level at 1.1139 is noted as a swing-high resistance, suggesting a potential barrier for further upside movement.
EUR/JPY:
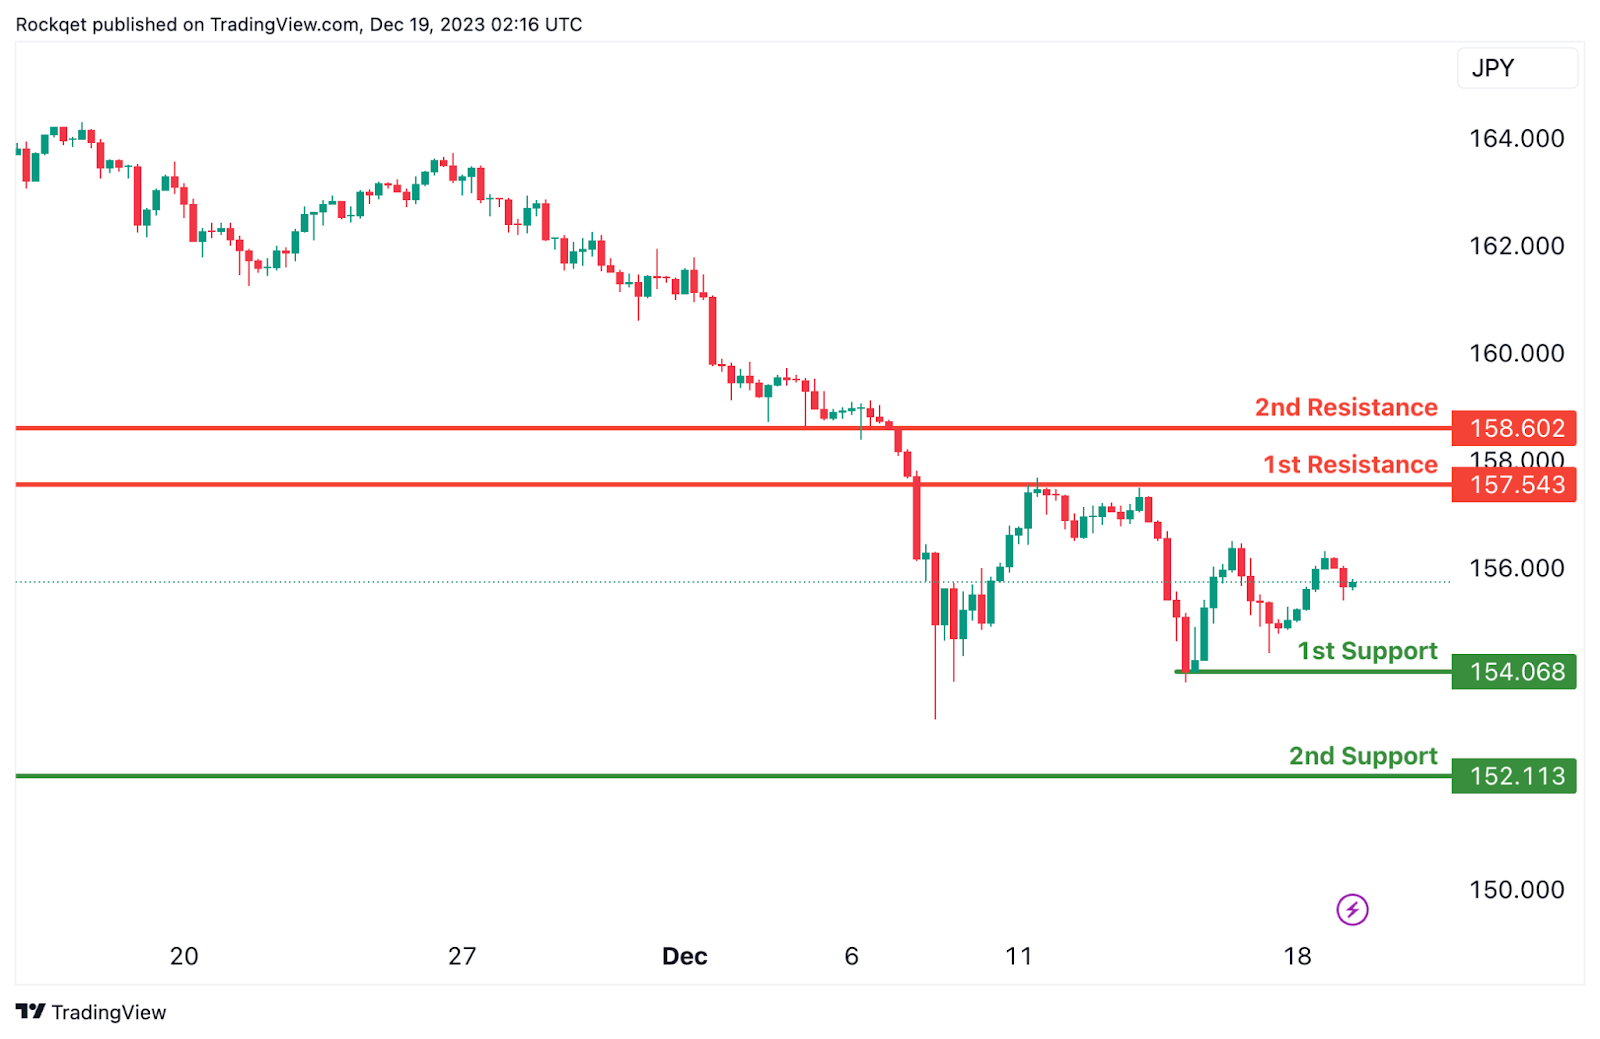
The EUR/JPY chart currently exhibits a neutral overall momentum, suggesting a potential scenario where the price could fluctuate between the 1st resistance and the 1st support level.
The 1st support at 154.07 is considered significant as it represents a pullback support. This level indicates a potential area where buying interest may emerge after a pullback, providing support for the currency pair.
Similarly, the 2nd support at 152.11 is identified as a swing low support. This adds another layer of potential support for EUR/JPY, indicating a zone where buying interest may be present, particularly considering its alignment with a swing low.
On the resistance side, the 1st resistance at 157.54 is associated with a pullback resistance. This level may act as a barrier where selling interest could intensify, potentially causing a temporary pause or reversal in the neutral trend.
Furthermore, the 2nd resistance at 158.60 is characterized as an overlap resistance. This adds another layer of significance to the resistance, suggesting a potential area where selling pressure may increase, especially considering its alignment with an overlap level.
EUR/GBP:
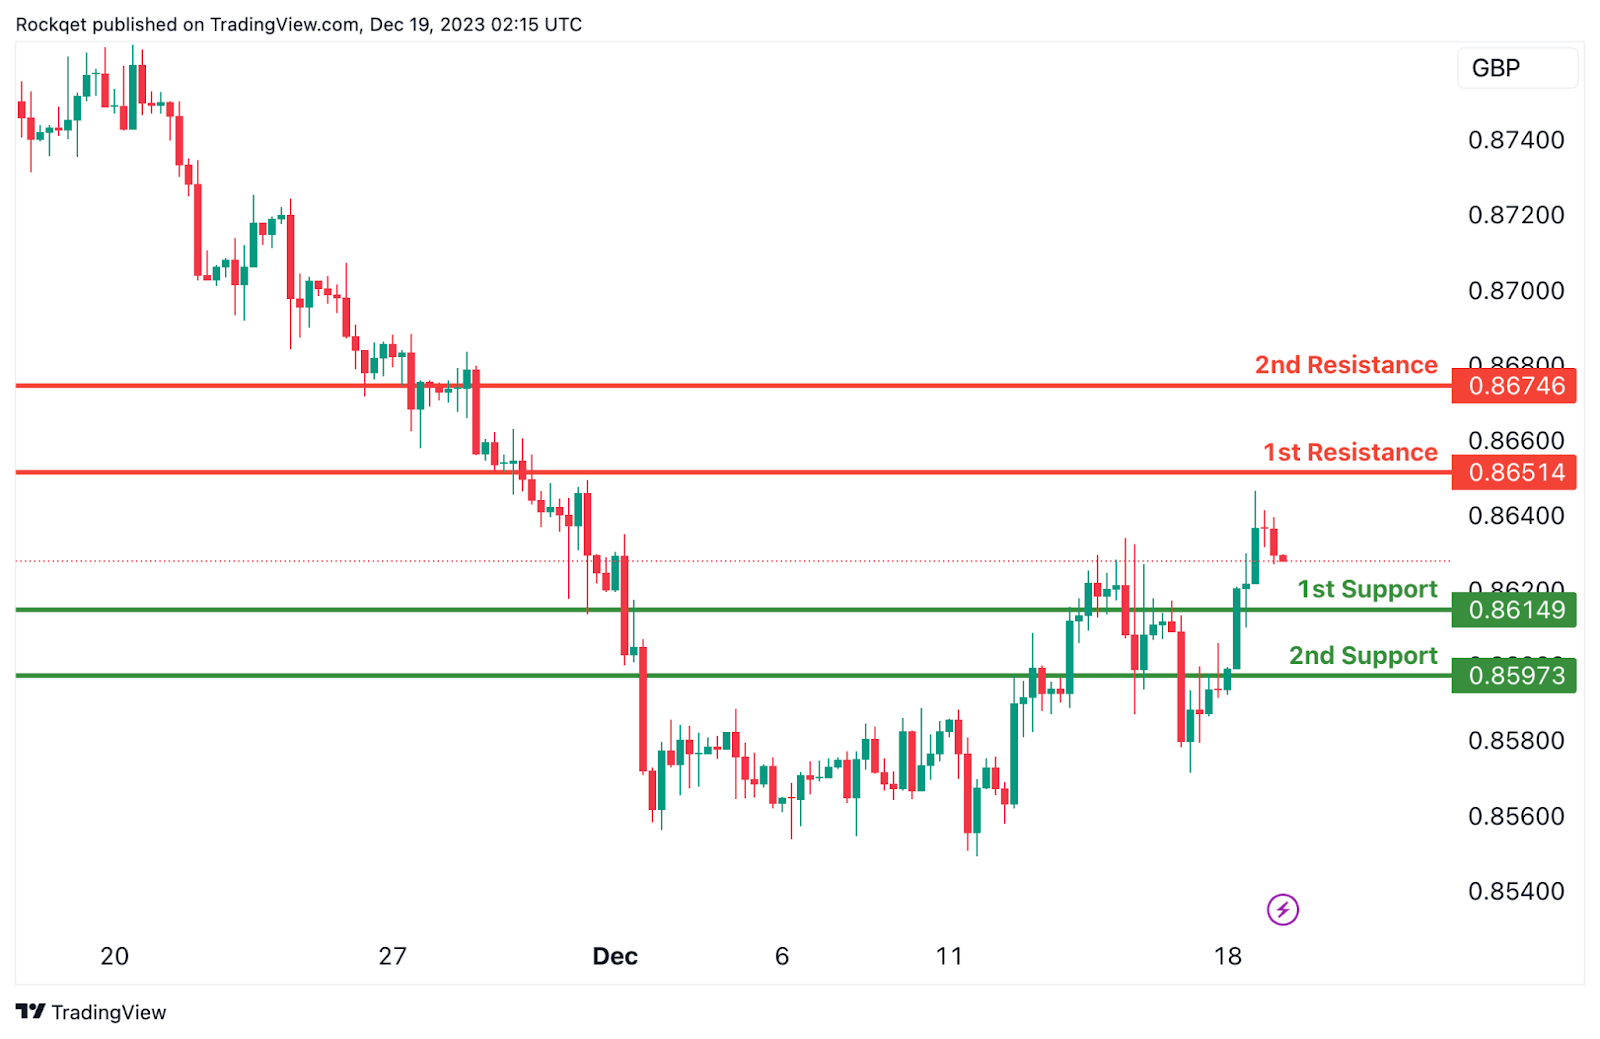
The EUR/GBP chart currently has a bearish overall momentum, and there is a potential scenario for a bearish continuation towards the 1st support.
The 1st support at 0.8615 is considered significant as it represents an overlap support. This level indicates a historical area where buying interest has been present, reinforcing its potential as a crucial support zone.
Similarly, the 2nd support at 0.8597 is identified as a pullback support. This adds another layer of potential support for the currency pair, indicating a zone where buying interest may emerge after a pullback.
On the resistance side, the 1st resistance at 0.8651 is associated with a pullback resistance. This level may act as a barrier where selling interest could intensify, potentially causing a temporary pause or reversal in the bearish trend.
Furthermore, the 2nd resistance at 0.8675 is characterized as an overlap resistance. This adds another layer of significance to the resistance, suggesting a potential area where selling pressure may increase, especially considering its alignment with an overlap level.
GBP/USD:
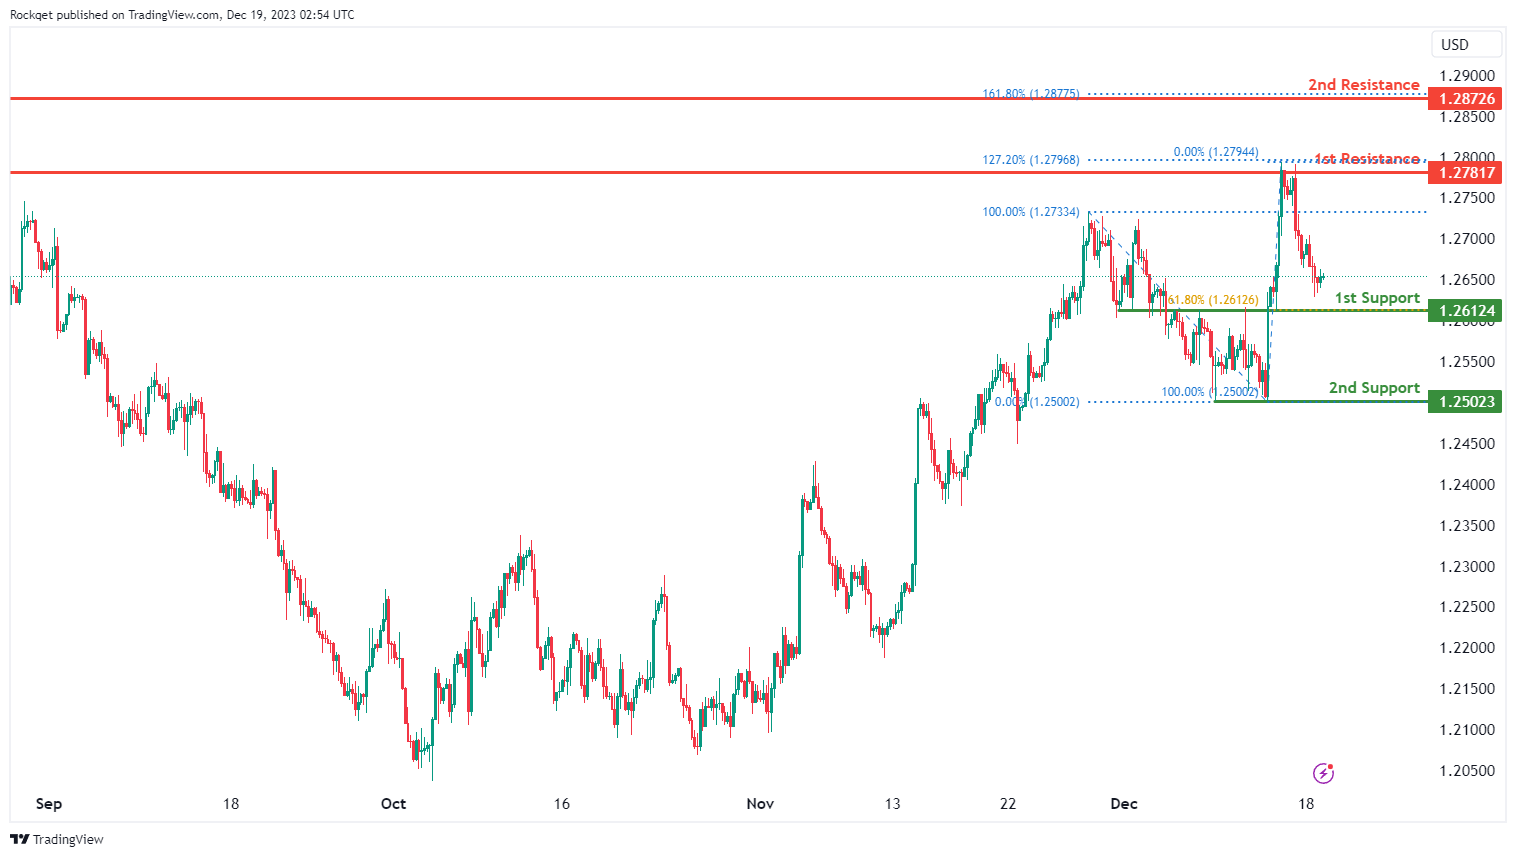
The GBP/USD chart currently exhibits an overall bearish momentum. In this context, there is a potential scenario for price to make a bearish continuation towards the 1st support.
The 1st support level at 1.2612 is identified as an overlap support that aligns with the 61.80% Fibonacci retracement level. Further below, the 2nd support level at 1.2502 is marked as a swing-low support, further reinforcing its importance as a potential key support level.
To the upside, the 1st resistance level at 1.2781 is identified as a multi-swing-high resistance that aligns with the 127.20% Fibonacci extension level. Higher up, the 2nd resistance level at 1.2872 is noted as a pullback resistance that aligns with the 161.80% Fibonacci extension level, suggesting a potential barrier for further upside movement.
GBP/JPY:
The GBP/JPY chart currently has a bearish overall momentum, suggesting a potential scenario for a bearish continuation towards the 1st support.
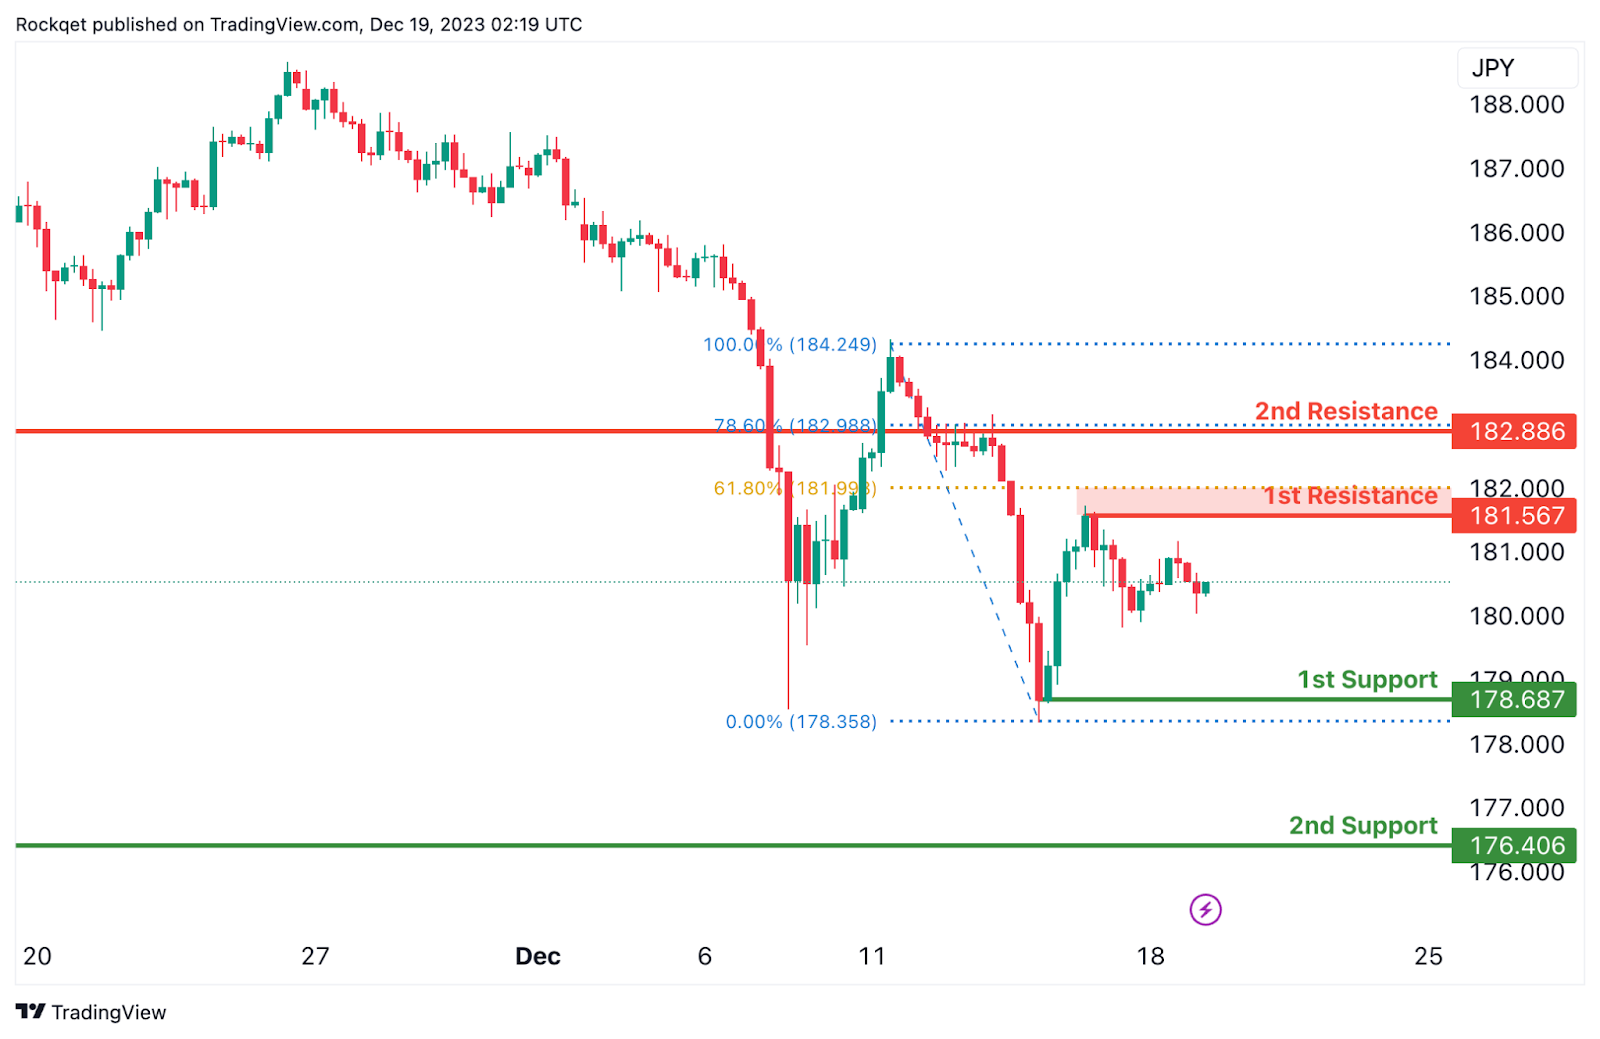
The 1st support at 178.69 is considered significant as it represents a swing low support. This level indicates a historical area where buying interest has been present, reinforcing its potential as a crucial support zone.
Similarly, the 2nd support at 176.41 is identified as a pullback support. This adds another layer of potential support for the currency pair, indicating a zone where buying interest may emerge after a pullback.
On the resistance side, the intermediate resistance at 181.57 is associated with a pullback resistance and the 61.80% Fibonacci Retracement level. This level may act as a barrier where selling interest could intensify, potentially causing a temporary pause or reversal in the bearish trend.
Furthermore, the 1st resistance at 182.89 is characterized as an overlap resistance and coincides with the 78.60% Fibonacci Retracement level. This adds another layer of significance to the resistance, suggesting a potential area where selling pressure may increase.
USD/CHF:
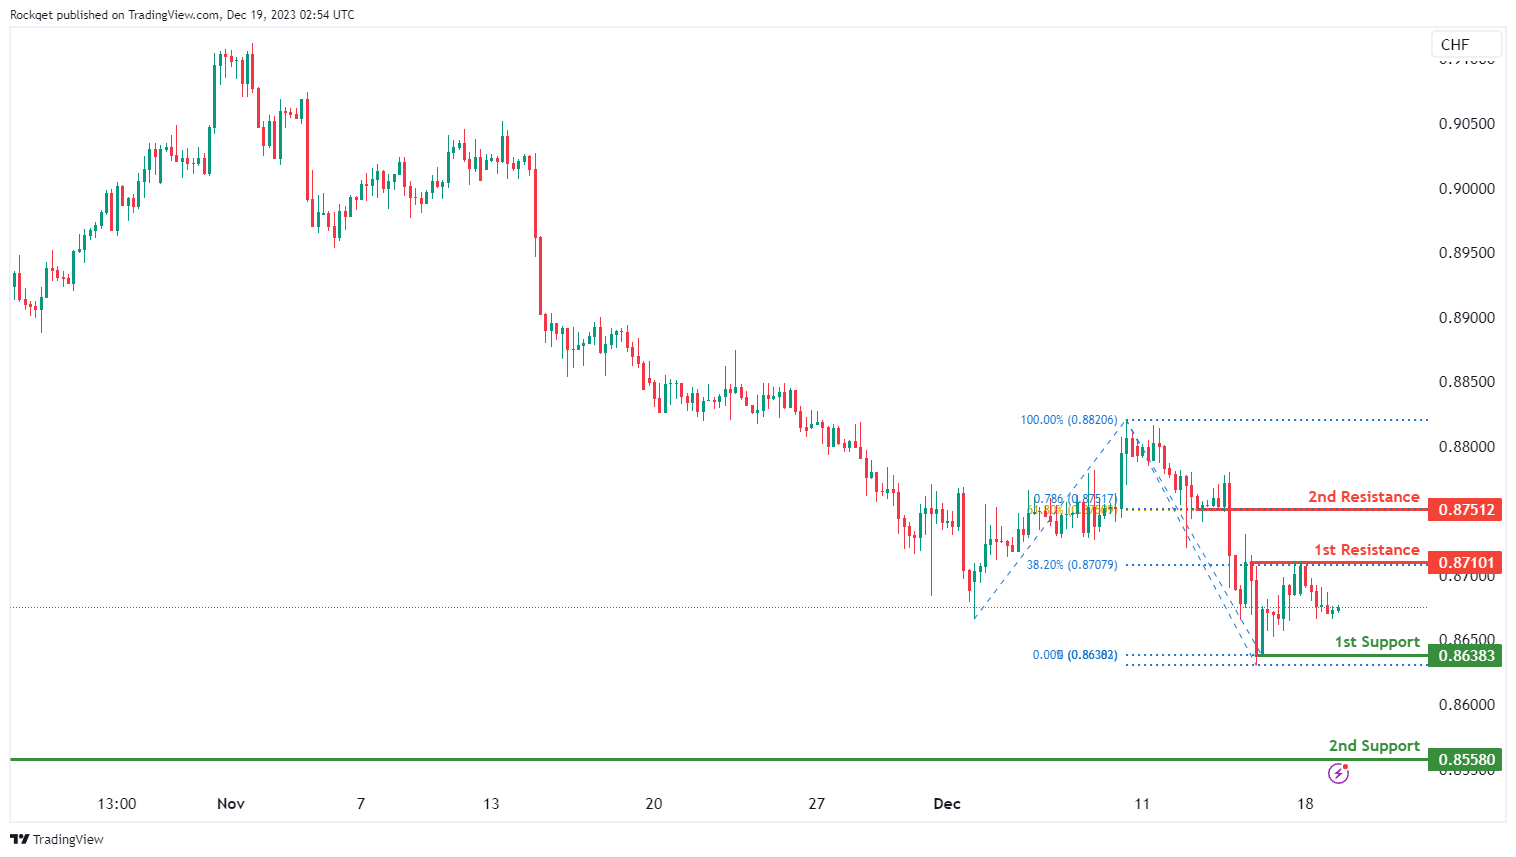
The USD/CHF chart currently exhibits an overall bearish momentum. In this context, there is a potential scenario for price to make a bearish continuation towards the 1st support.
The 1st support level at 0.8638 is identified as a pullback support. Further below, the 2nd support level at 0.8558 is noted as a multi-swing-low, further reinforcing its importance as a key support level.
To the upside, the 1st resistance level at 0.8710 is identified as a pullback resistance that aligns with the 38.20% Fibonacci retracement level. Higher up, the 2nd resistance level at 0.8751 is also marked as a pullback resistance that aligns with a confluence of Fibonacci levels i.e. the 61.80% retracement and the 78.60% projection levels, suggesting a potential barrier for further upside movement.
USD/JPY:
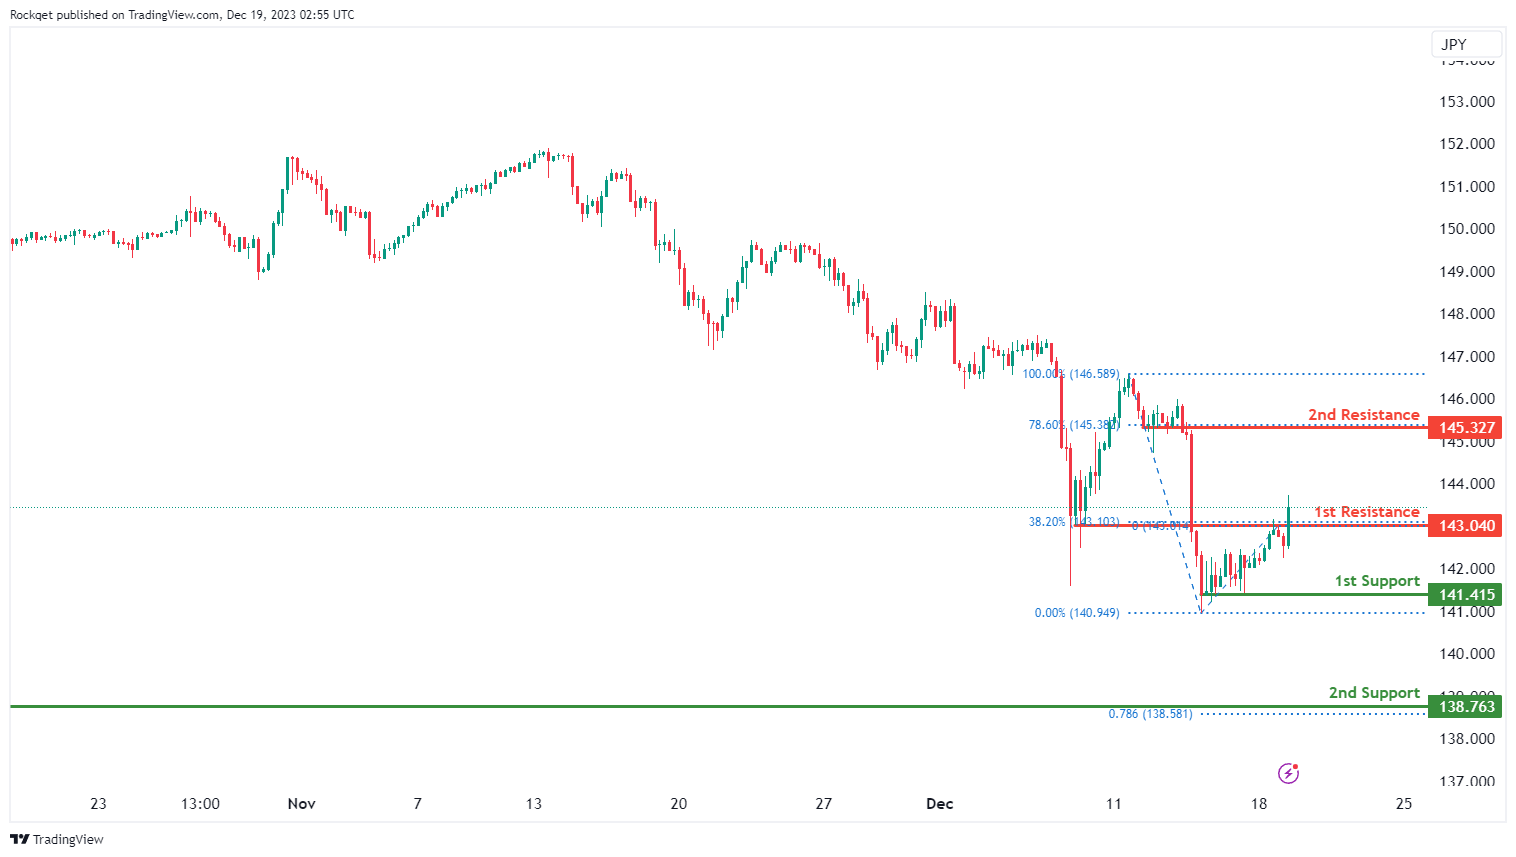
The USD/JPY chart currently exhibits an overall bullish momentum, indicating a potential for price to break above the 1st resistance and make a bullish continuation towards the 2nd resistance.
The 1st resistance level at 143.04 is identified as an overlap resistance that aligns with the 38.20% Fibonacci retracement level. Higher up, the 2nd resistance level at 145.32 is marked as a pullback resistance that aligns with the 78.60% Fibonacci retracement level, suggesting a potential barrier for further upside movement.
To the downside, the 1st support level at 141.41 is identified as a pullback support. Further below, the 2nd support level at 138.76 is noted as a swing-low support that aligns with the 78.60% Fibonacci projection level, further reinforcing its importance as a key support level.
USD/CAD:
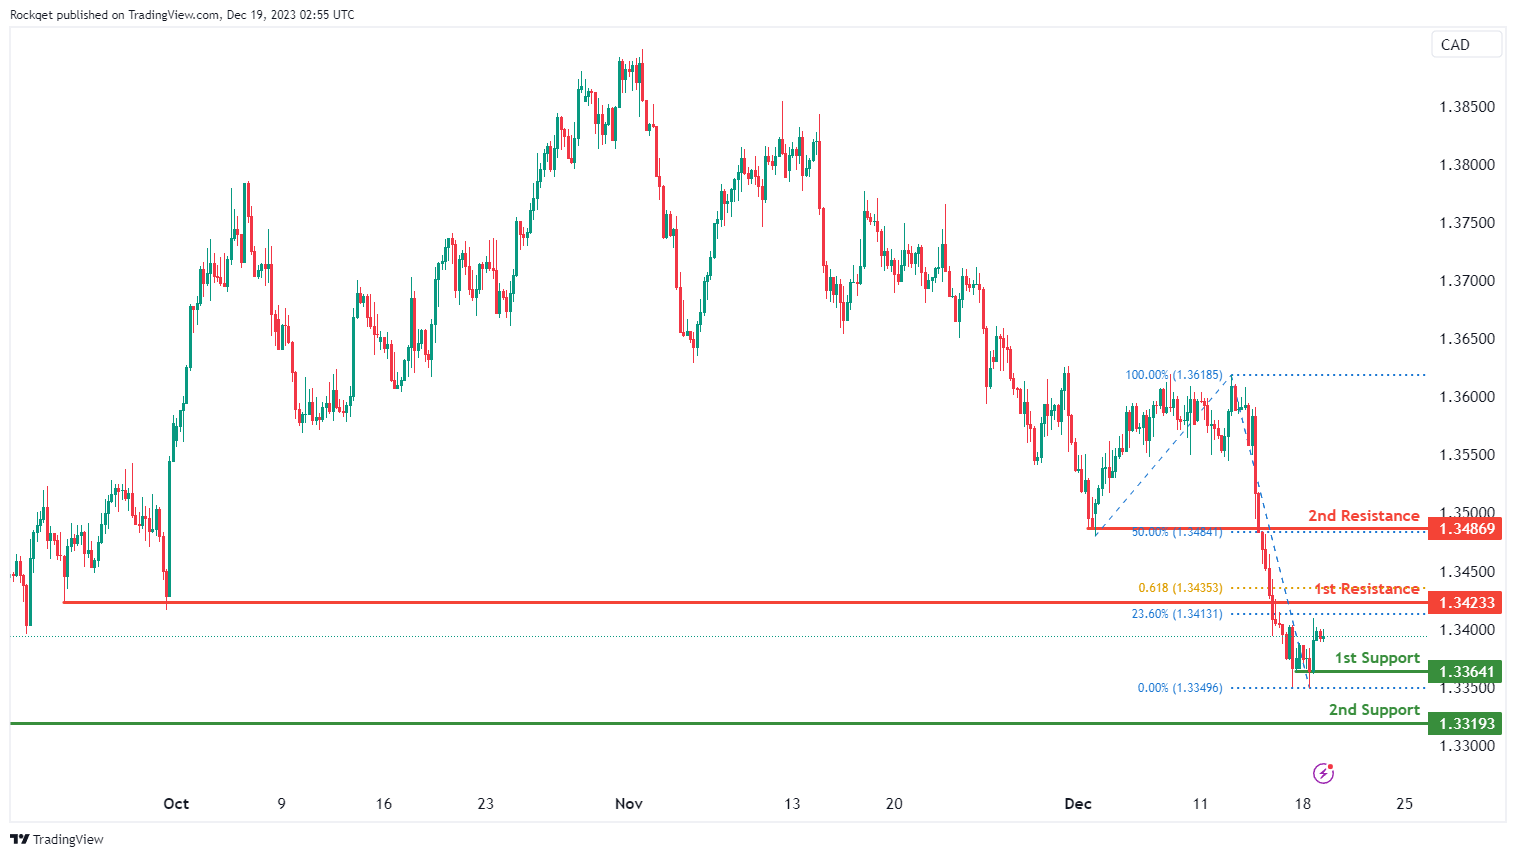
The USD/CAD chart currently exhibits an overall bearish momentum, indicating a potential for a drop towards the 1st support.
The 1st support level at 1.3364 is identified as a pullback support. Further below, the 2nd support level at 1.3319 is also noted as a pullback support, further reinforcing its importance as a key support level.
To the upside, the 1st resistance level at 1.3423 is identified as a pullback resistance that aligns with a confluence of Fibonacci levels i.e. the 23.60% retracement and the 61.80% projection levels. Higher up, the 2nd resistance level at 1.3486 is also marked as a pullback resistance that aligns with the 50.00% Fibonacci retracement level, suggesting a potential barrier for further upside movement.
AUD/USD:
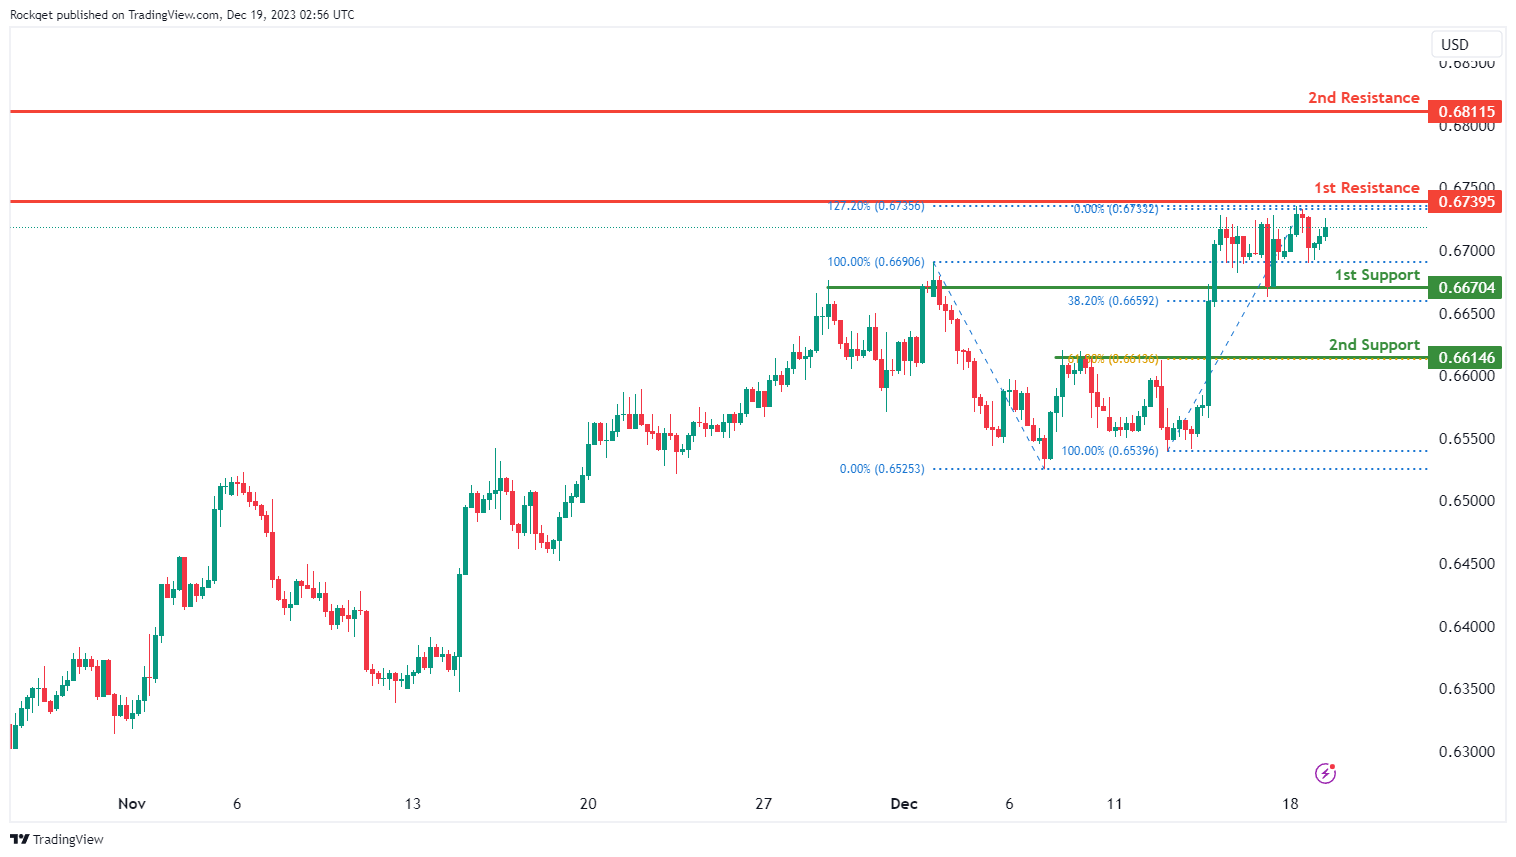
The AUD/USD chart currently exhibits an overall bullish momentum. In this context, there is a potential scenario for price to make a bullish continuation towards the 1st resistance.
The 1st resistance level at 0.6739 is identified as a swing-high resistance that aligns with the 127.20% Fibonacci extension level. Higher up, the 2nd resistance level at 0.6811 is also noted as a swing-high resistance, indicating its potential significance as a barrier for further upward movement.
To the downside, the 1st support level at 0.6670 is identified as an overlap support that aligns close to the 38.20% Fibonacci retracement level. Further below, the 2nd support level at 0.6614 is marked as a pullback support that aligns with the 61.80% Fibonacci retracement level, further reinforcing its importance as a key support level.
NZD/USD
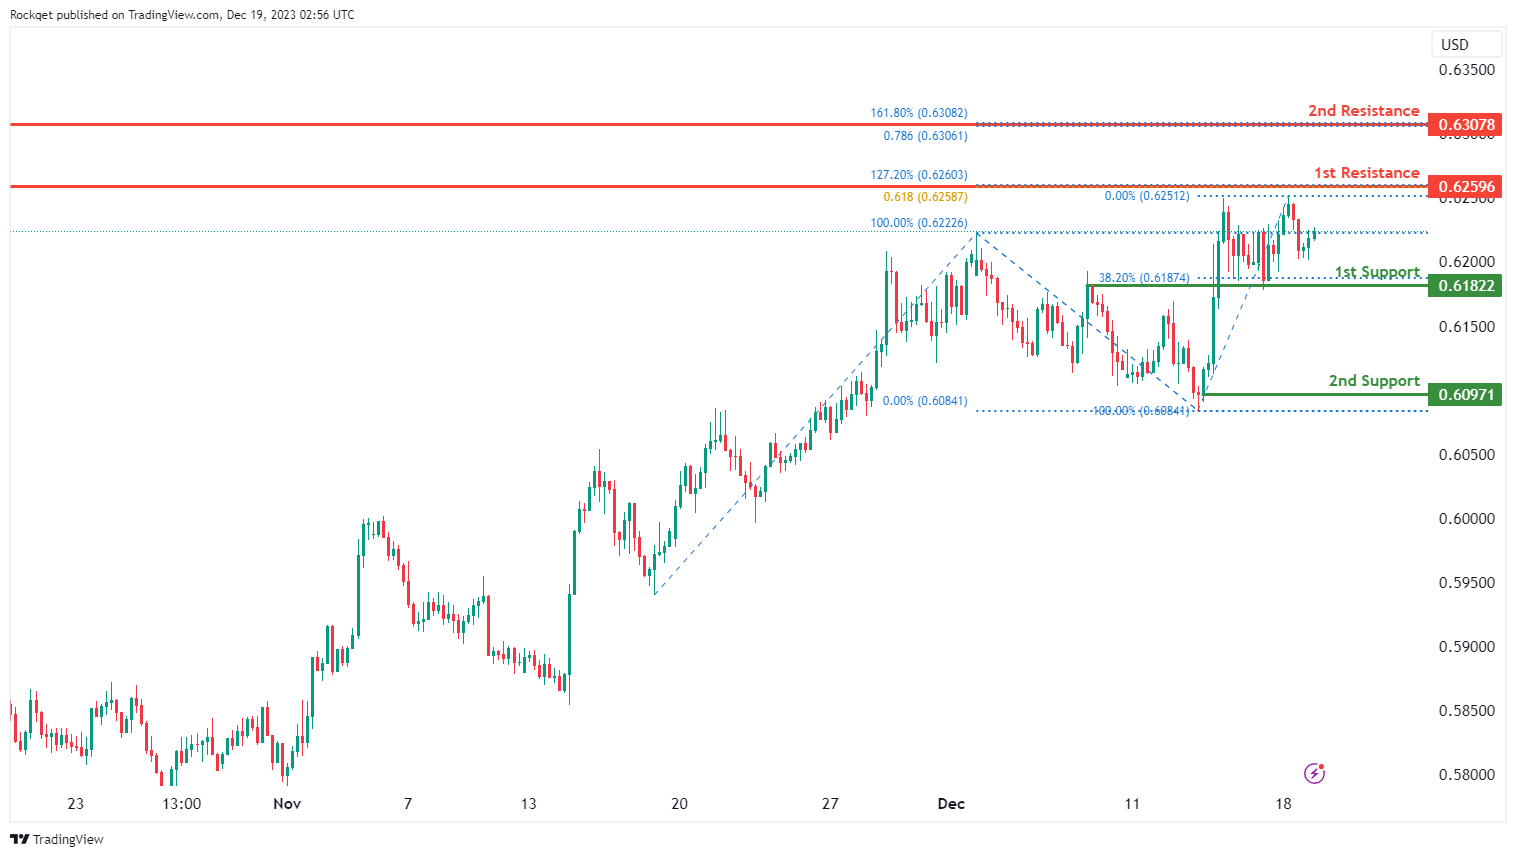
The NZD/USD chart currently exhibits an overall bullish momentum. In this context, there is a potential scenario for price to make a bullish continuation towards the 1st resistance.
The 1st resistance level at 0.6259 is identified as a swing-high resistance that aligns with a confluence of Fibonacci levels i.e. the 127.20% extension and the 61.80% projection levels. Higher up, the 2nd resistance level at 0.6307 is also marked as a swing-high resistance that aligns with a confluence of Fibonacci levels i.e. the 161.80% extension and the 78.60% projection levels, indicating its potential significance as a barrier for further upward movement.
To the downside, the 1st support level at 0.6182 is identified as an overlap support that aligns with the 38.20% Fibonacci retracement level. Further below, the 2nd support level at 0.6097 is noted as a swing-low support, further reinforcing its importance as a key support level.
DJ30:
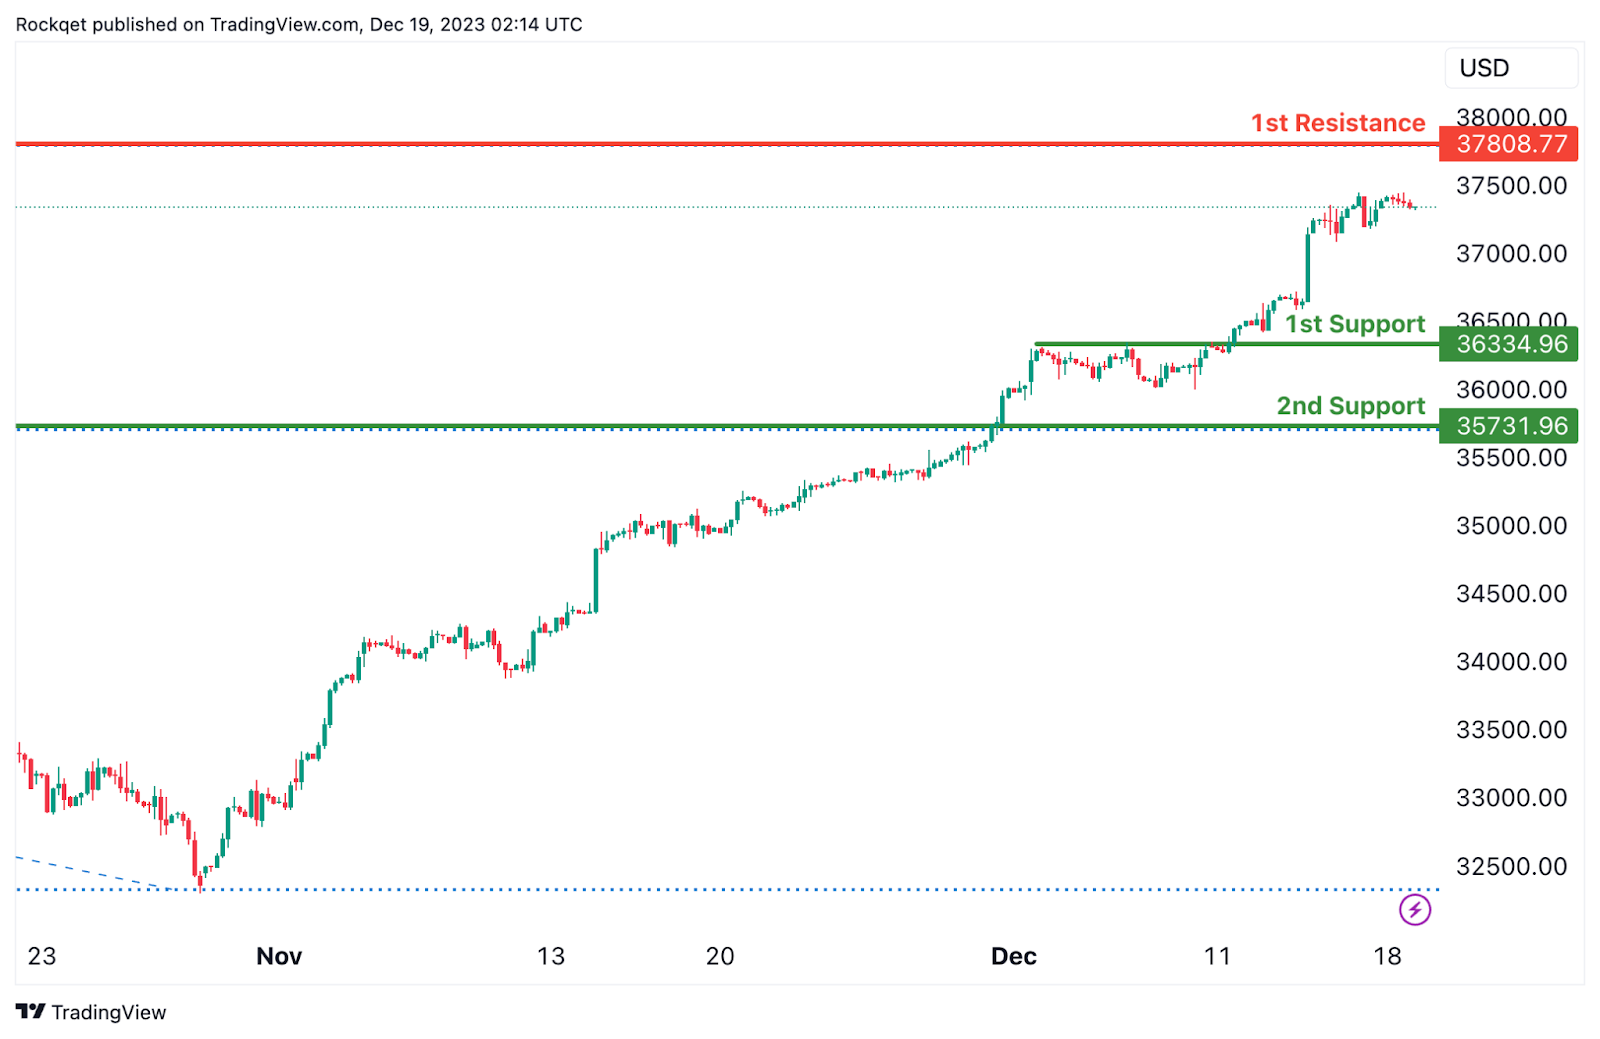
The DJ30 chart currently exhibits a bullish overall momentum, suggesting a potential scenario for a bullish continuation towards the 1st resistance.
The 1st support at 36334.96 is considered significant as it represents an overlap support. This level indicates a historical area where buying interest has been present, reinforcing its potential as a crucial support zone.
Similarly, the 2nd support at 35731.96 is identified as a pullback support. This adds another layer of potential support for the index, indicating a zone where buying interest may emerge after a pullback.
On the resistance side, the 1st resistance at 37808.77 is associated with the 161.80% Fibonacci Extension level. This level may act as a barrier where selling interest could intensify, potentially causing a temporary pause or reversal in the bullish trend.
GER40:
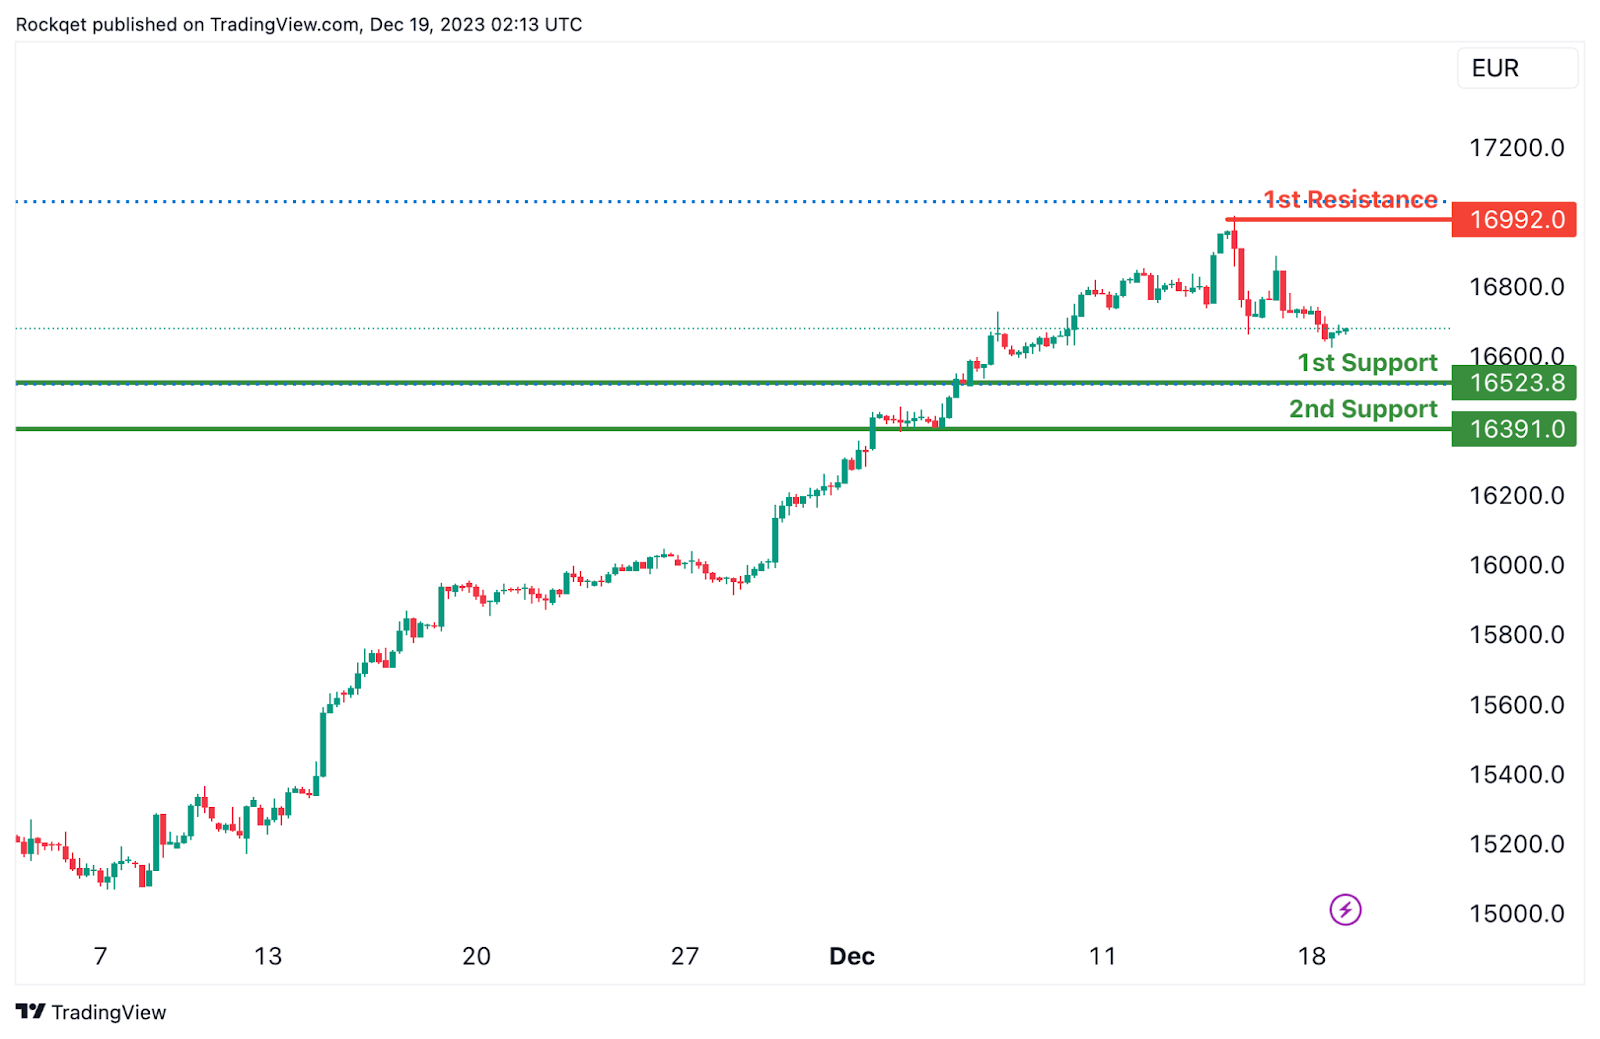
The GER40 chart currently has a bearish overall momentum, and there is a potential scenario for a bearish continuation towards the 1st support.
The 1st support at 16523.80 is considered significant as it represents an overlap support. This level indicates a historical area where buying interest has been present, reinforcing its potential as a crucial support zone.
Similarly, the 2nd support at 16391.00 is identified as a pullback support. This adds another layer of potential support for the index, indicating a zone where buying interest may emerge after a pullback.
On the resistance side, the 1st resistance at 16992.00 is associated with the 127.20% Fibonacci Extension level. This level may act as a barrier where selling interest could intensify, potentially causing a temporary pause or reversal in the bearish trend.
US500:
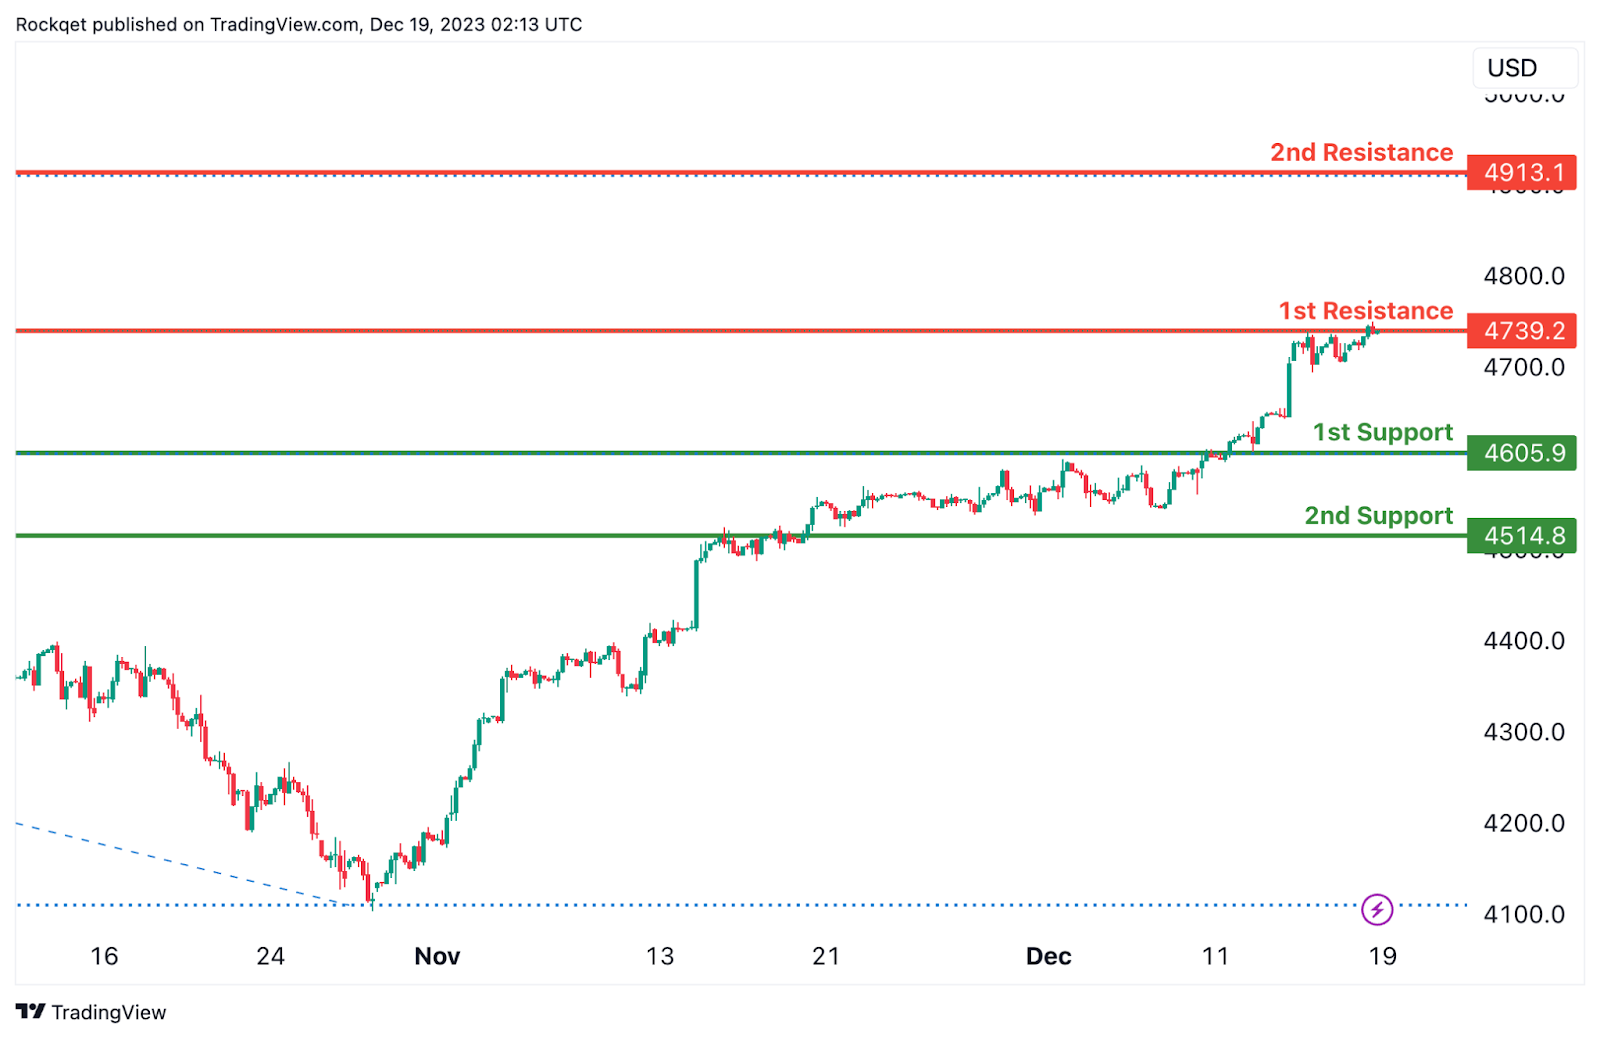
The US500 chart currently exhibits a bullish overall momentum, suggesting a potential scenario for a bullish continuation towards the 1st resistance.
The 1st support at 4605.9 is considered significant as it represents a pullback support. This level indicates a historical area where buying interest has been present, reinforcing its potential as a crucial support zone.
Similarly, the 2nd support at 4514.8 is identified as an overlap support. This adds another layer of potential support for the index, indicating a zone where buying interest may emerge after a pullback.
On the resistance side, the 1st resistance at 4739.2 is associated with a swing high resistance. This level may act as a barrier where selling interest could intensify, potentially causing a temporary pause or reversal in the bullish trend.
Furthermore, the 2nd resistance at 4913.1 is characterized as a swing high resistance and coincides with the 161.80% Fibonacci Extension level. This adds another layer of significance to the resistance, suggesting a potential area where selling pressure may increase.
BTC/USD:
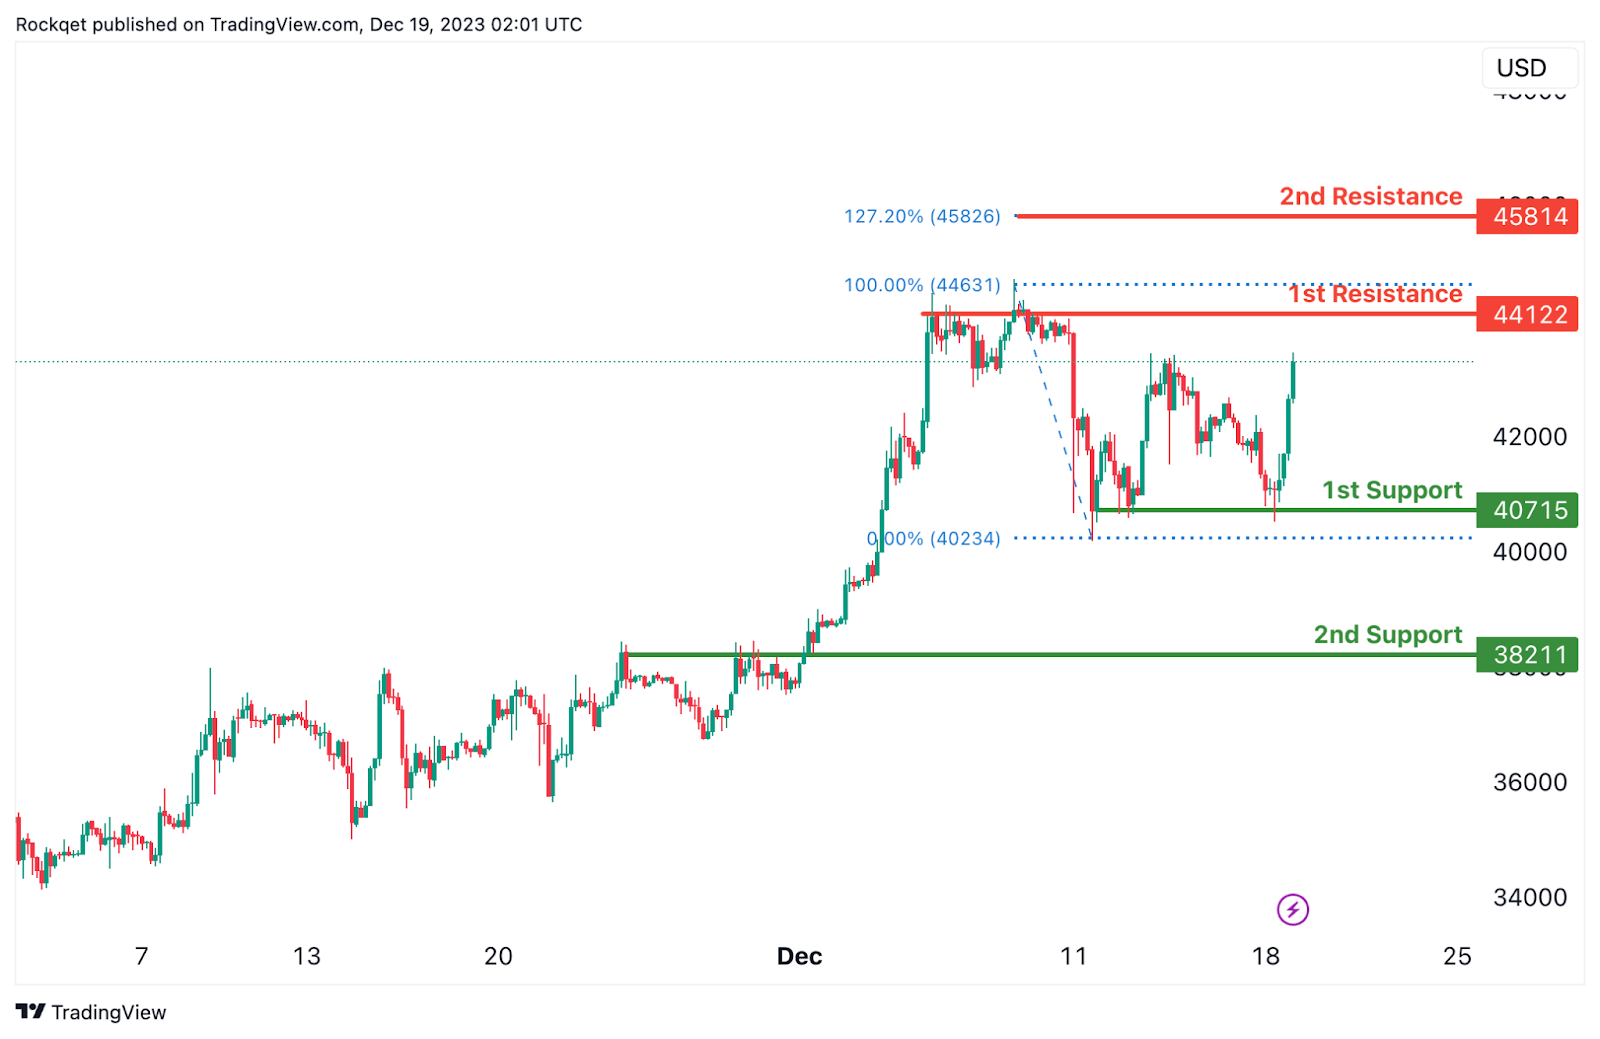
The BTC/USD chart currently has a bullish overall momentum, suggesting a potential scenario for a bullish continuation towards the 1st resistance.
The 1st support at 40715 is considered significant as it represents a pullback support. This level indicates a historical area where buying interest has been present, reinforcing its potential as a crucial support zone.
Similarly, the 2nd support at 38211 is identified as a pullback support. This adds another layer of potential support for the cryptocurrency, indicating a zone where buying interest may emerge after a pullback.
On the resistance side, the 1st resistance at 44122 is associated with a swing high resistance and coincides with the 100% Fibonacci Retracement level. This level may act as a barrier where selling interest could intensify, potentially causing a temporary pause or reversal in the bullish trend.
Furthermore, the 2nd resistance at 45814 is characterized as a potential target, given the 127.20% Fibonacci Extension level. This adds another layer of significance to the resistance, suggesting a potential area where selling pressure may increase.
ETH/USD:
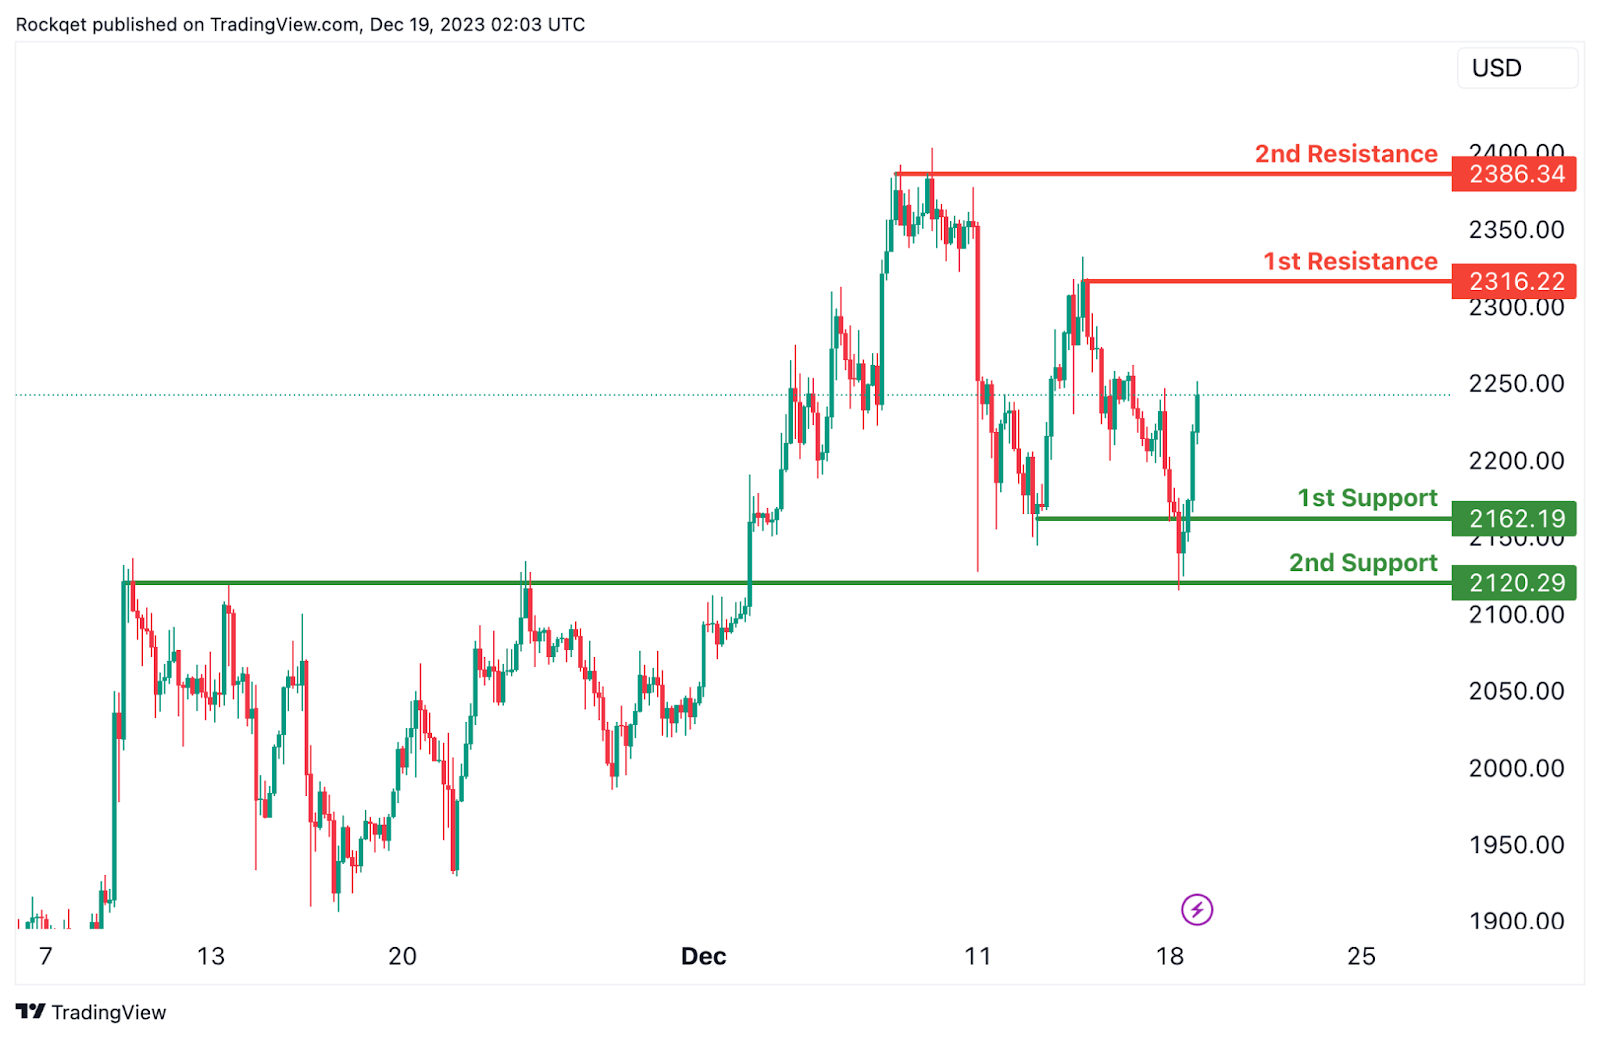
The ETH/USD chart currently demonstrates a bullish overall momentum, indicating a potential scenario for a bullish continuation towards the 1st resistance.
The 1st support at 2162.19 is considered significant as it represents a pullback support. This level indicates a historical area where buying interest has been present, reinforcing its potential as a crucial support zone.
Similarly, the 2nd support at 2120.29 is identified as an overlap support. This adds another layer of potential support for the cryptocurrency, indicating a zone where buying interest may emerge after a pullback.
On the resistance side, the 1st resistance at 2316.22 is associated with a swing high resistance. This level may act as a barrier where selling interest could intensify, potentially causing a temporary pause or reversal in the bullish trend.
Furthermore, the 2nd resistance at 2386.32 is characterized as a multi-swing high resistance, suggesting increased resistance in this area.
WTI/USD:
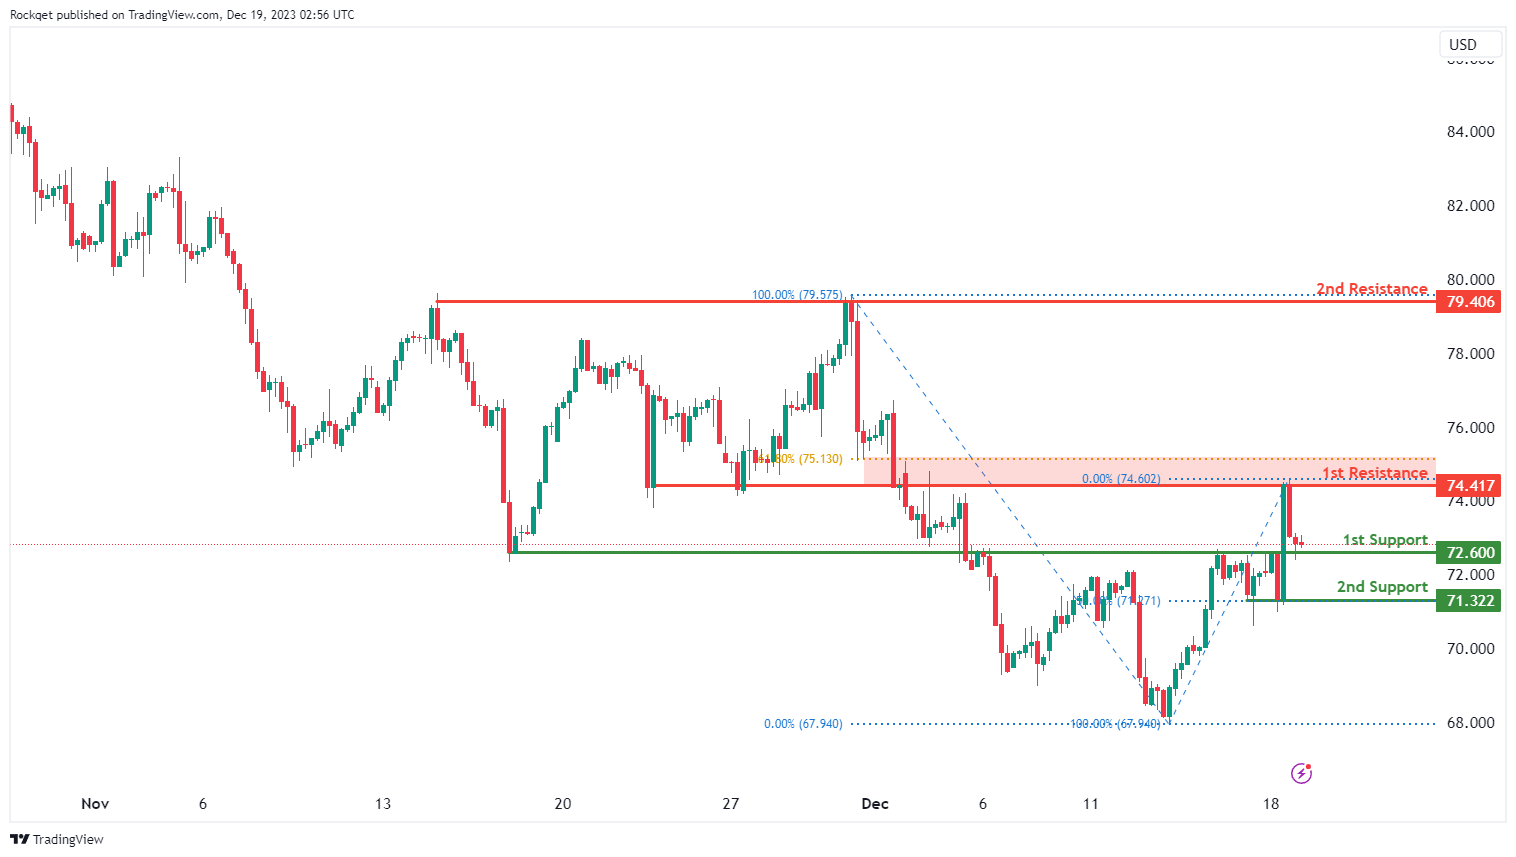
The WTI chart currently exhibits an overall bearish momentum, suggesting a prevailing downward trend. In this context, there is a potential scenario for price to make a bearish continuation towards the 1st support.
The 1st support level at 72.60 is identified as an overlap support. Further below, the 2nd support level at 71.32 is marked as a pullback support that aligns with the 50.00% Fibonacci retracement level, reinforcing its importance as a key support level.
To the upside, the 1st resistance level at 74.41 is identified as an overlap resistance that aligns close to the 61.80% Fibonacci retracement level. Higher up, the 2nd resistance level at 79.40 is noted as a multi-swing-high resistance, further indicating its potential significance as a barrier for further upward movement.
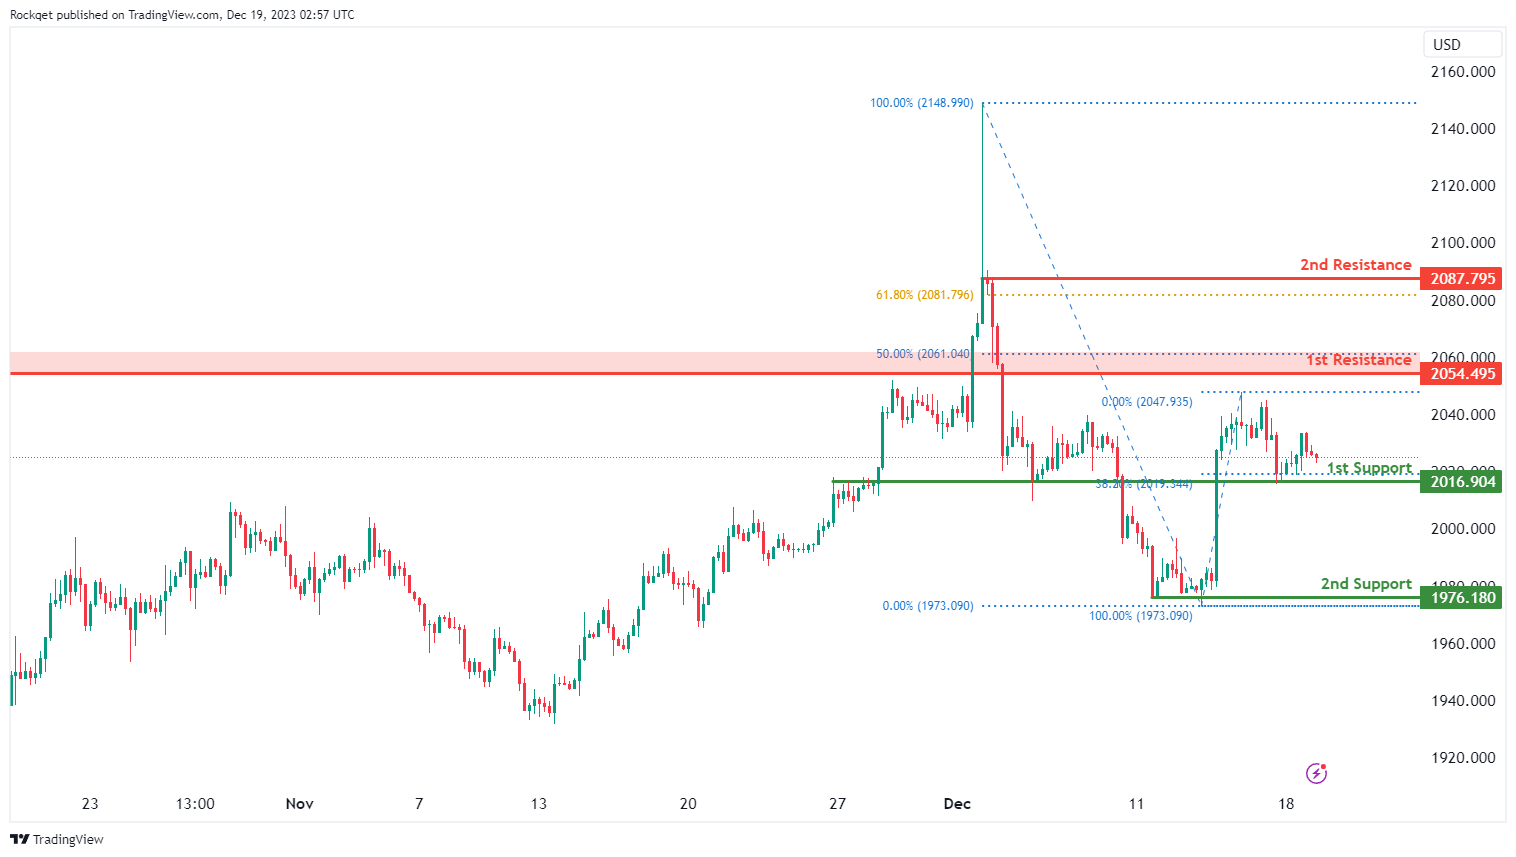
XAU/USD (GOLD):
The XAU/USD chart currently demonstrates a neutral momentum, indicating a potential for price to fluctuate between the 1st support and the 1st resistance.
The 1st support level at 2,016.90 is identified as an overlap support that aligns with the 38.20% Fibonacci retracement level. Further below, the 2nd support level at 1,976.18 is noted as a pullback support, reinforcing its importance as a key support level.
To the upside, the 1st resistance level at 2,054.49 is identified as a swing-high resistance that aligns close to the 50.00% Fibonacci retracement level. Higher up, the 2nd resistance level at 2,087.79 is marked as a pullback resistance that aligns close to the 61.80% Fibonacci retracement level, further indicating its potential significance as a barrier for further upward movement.
BoJ holds steady despite speculation for tweaks
BoJ decided to maintain its monetary policy unchanged, a move that has come as a disappointment to some observers who anticipated minor policy changes or at least some alterations in the statement.
Under the Yield Curve Control framework, short-term policy interest rate remains at -0.1%. BoJ has also maintains its target for the 10-year JGB yield at approximately 0%, allowing for a cap of 1% for yield fluctuations. This decision was reached unanimously.
In addition, BoJ reiterated its commitment to an easing bias, stating it "will not hesitate to take additional easing measures if necessary."
Regarding Japan's economic outlook, BoJ expects a moderate ongoing recovery in the near term. However, it acknowledges downward pressures, primarily due to a slowdown in the recovery pace of overseas economies.
Looking ahead, the central bank projects that as a positive cycle from income to spending strengthens, Japan's economy will continue to grow at a rate above its potential growth rate.
In terms of inflation, BoJ anticipates CPI core to remain above 2% through fiscal 2024. Underlying inflation is expected to "increase gradually toward achieving the price stability target."
Ethereum (ETHUSD) Should Find Buyers in 3, 7, or 11 Swing
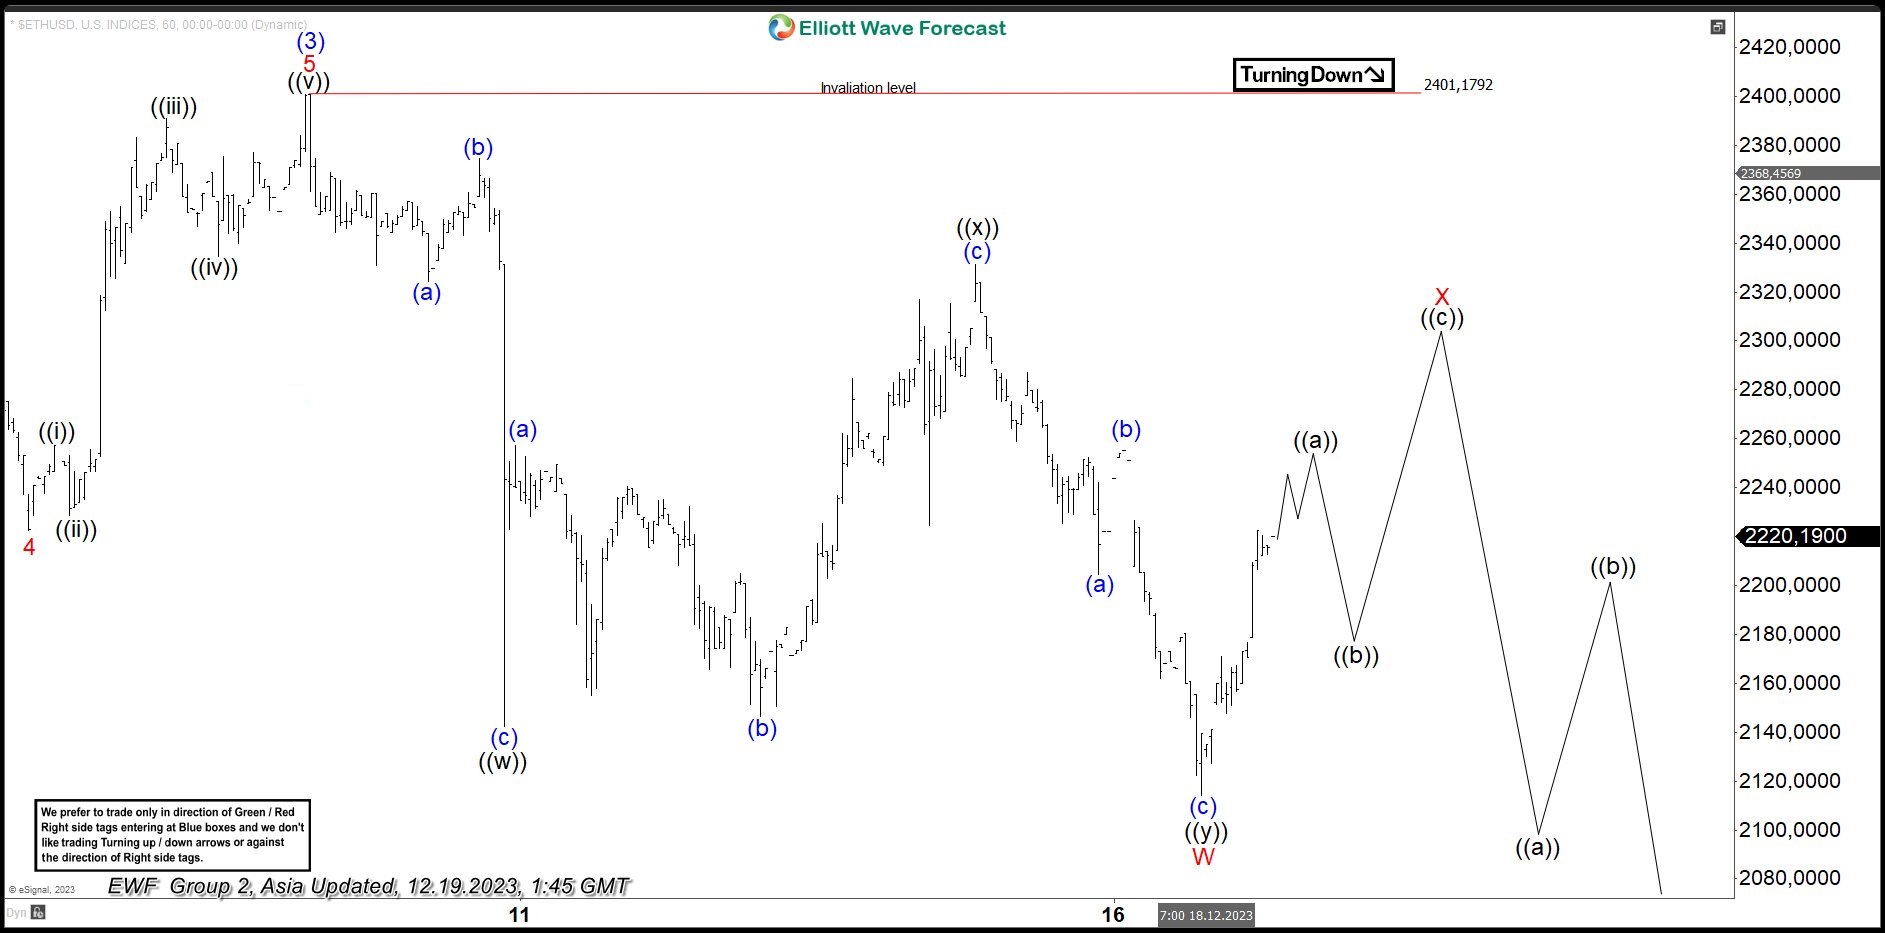
Short Term Elliott Wave View in Ethereum (ETHUSD) shows that it has ended wave (3) at 2401.18. Pullback in wave (4) is currently in progress as a double three Elliott Wave structure. Down from wave 93), wave (a) ended at 2324.3 and wave (b) ended at 2374.78. Wave (c) lower ended at 2142.28 which completed wave ((w)). The crypto currency then corrected in wave ((x)) as a zigzag structure. Up from wave ((w)), wave (a) ended at 2257.38 and wave (b) ended at 2146.35. Wave (c) higher ended at 2331.34 which completed wave ((x)).
The crypto-currency then turned lower in wave ((y)). Down from wave ((x)), wave (a) ended at 2204.42 and wave (b) ended at 2255.08. Wave (c) lower ended at 2114.22 which completed wave ((y)) of W. Ethereum is now correcting cycle from 12.9.2023 high in wave X as a zigzag structure. Up from wave W, wave ((a)) is expected to end soon, then it should pullback in wave ((b)), followed by further upside in wave ((c)) of X. Then, as far as pivot at 2401.18 high remains intact, the crypto-currency has scope to see further downside in a larger double three in wave Y.
Ethereum (ETHUSD) 60 Minutes Elliott Wave Chart
Ethereum (ETHUSD) Elliott Wave Video
https://www.youtube.com/watch?v=9Z0yhbg_MQw