

Sample Category Title
Technical Outlook and Review
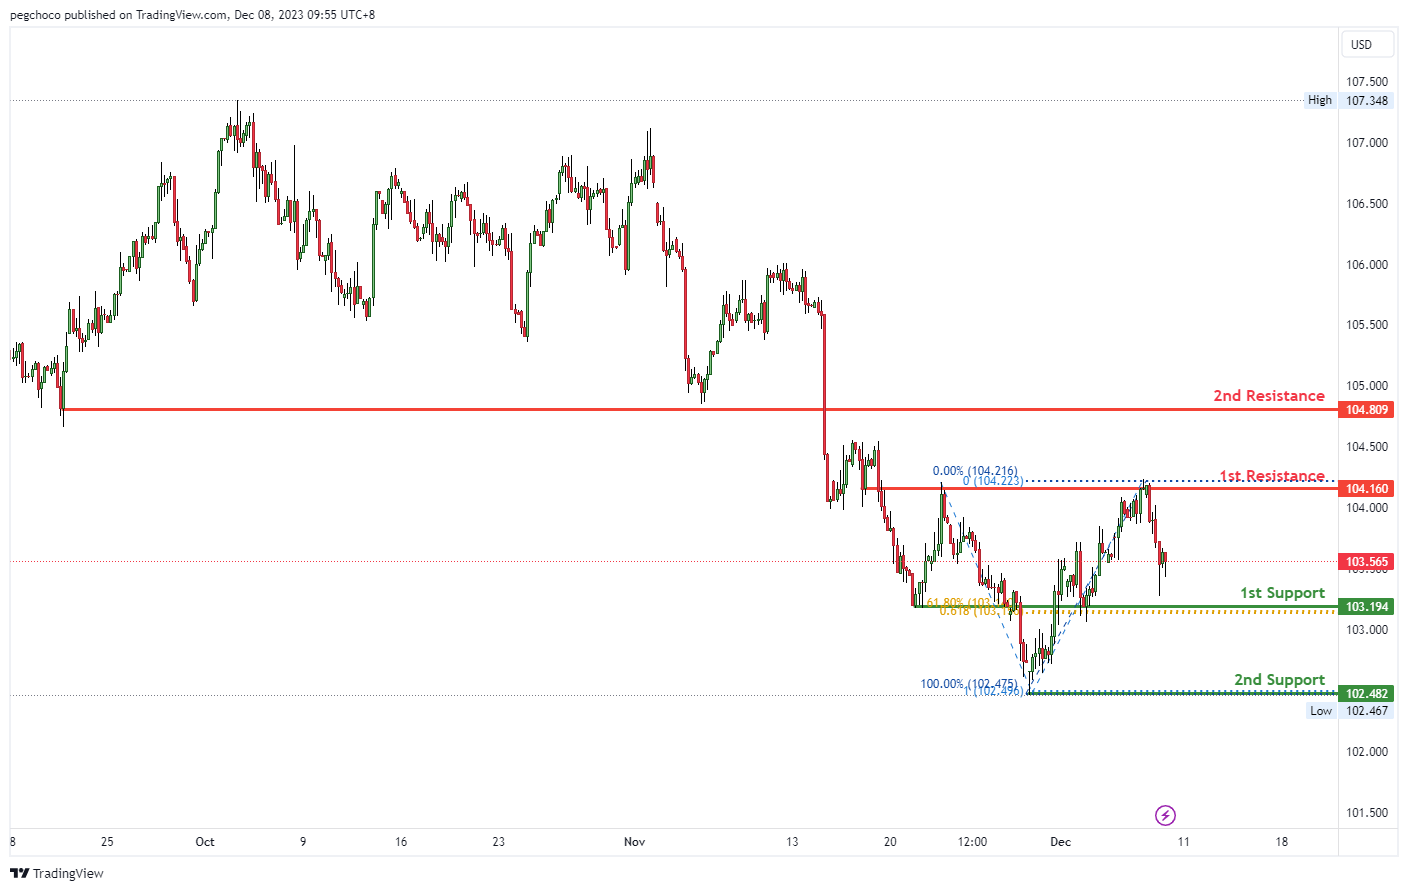
DXY:
The DXY chart currently shows a bearish overall momentum, indicating a potential for a bearish continuation in the price action.
The 1st support level at 103.19 is considered an overlap support. This level holds significance as it aligns with both the 61.80% Fibonacci Retracement and the 61.80% Fibonacci Projection, indicating a Fibonacci confluence. This confluence suggests that 103.19 could be a strong support level where buyers may step in.
The 2nd support at 102.48 is identified as a swing low support. Swing lows often serve as areas of potential buying interest, and this level reinforces the significance of 102.48 as a potential support zone.
On the resistance side, the 1st resistance at 104.16 is classified as an overlap resistance. Overlap resistances are historical levels where selling interest may intensify, potentially limiting upward price movements.
The 2nd resistance at 104.81 is categorized as a pullback resistance. This suggests that it is a level where selling pressure could increase, making it a potential barrier to further bullish movements.
EUR/USD:
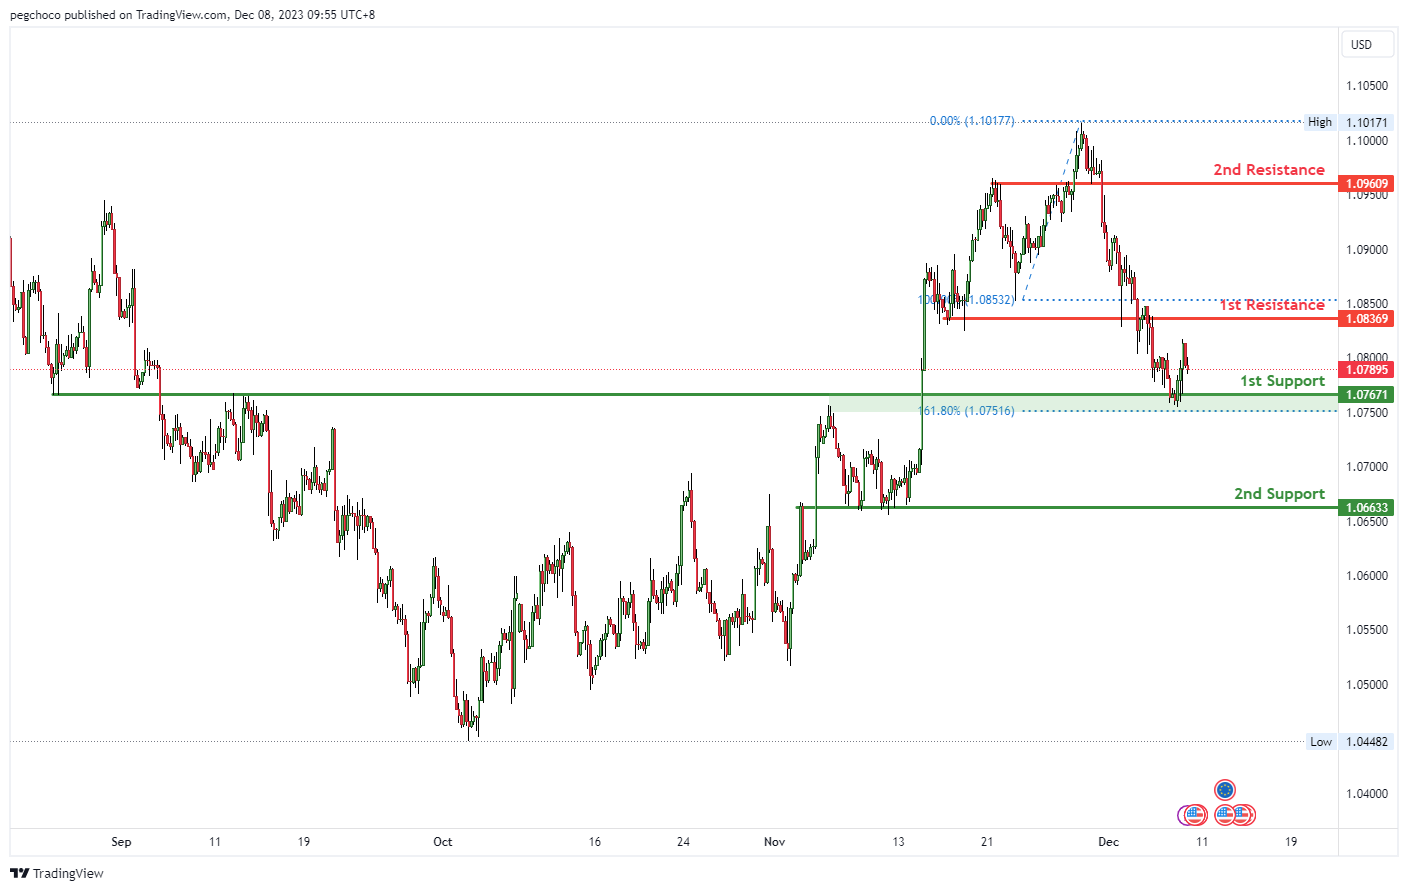
The EUR/USD chart currently exhibits a bearish overall momentum, suggesting a potential bearish reaction off the 1st resistance level.
The 1st support at 1.0767 is categorized as a pullback support and is also associated with the 161.80% Fibonacci Extension level. This confluence of technical factors suggests that 1.0767 could be a significant support level where buyers might step in, potentially providing support for the EUR/USD pair.
The 2nd support at 1.0663 is identified as an overlap support. Overlap supports are historical levels where buying interest may emerge, reinforcing the significance of this support level.
On the resistance side, the 1st resistance at 1.0836 is noted as an overlap resistance. Overlap resistances are historical levels where selling interest may intensify, potentially leading to a bearish reaction from this level.
The 2nd resistance at 1.0960 is categorized as a pullback resistance, indicating that it could be a level where selling pressure may increase, potentially limiting bullish movements.
EUR/JPY:
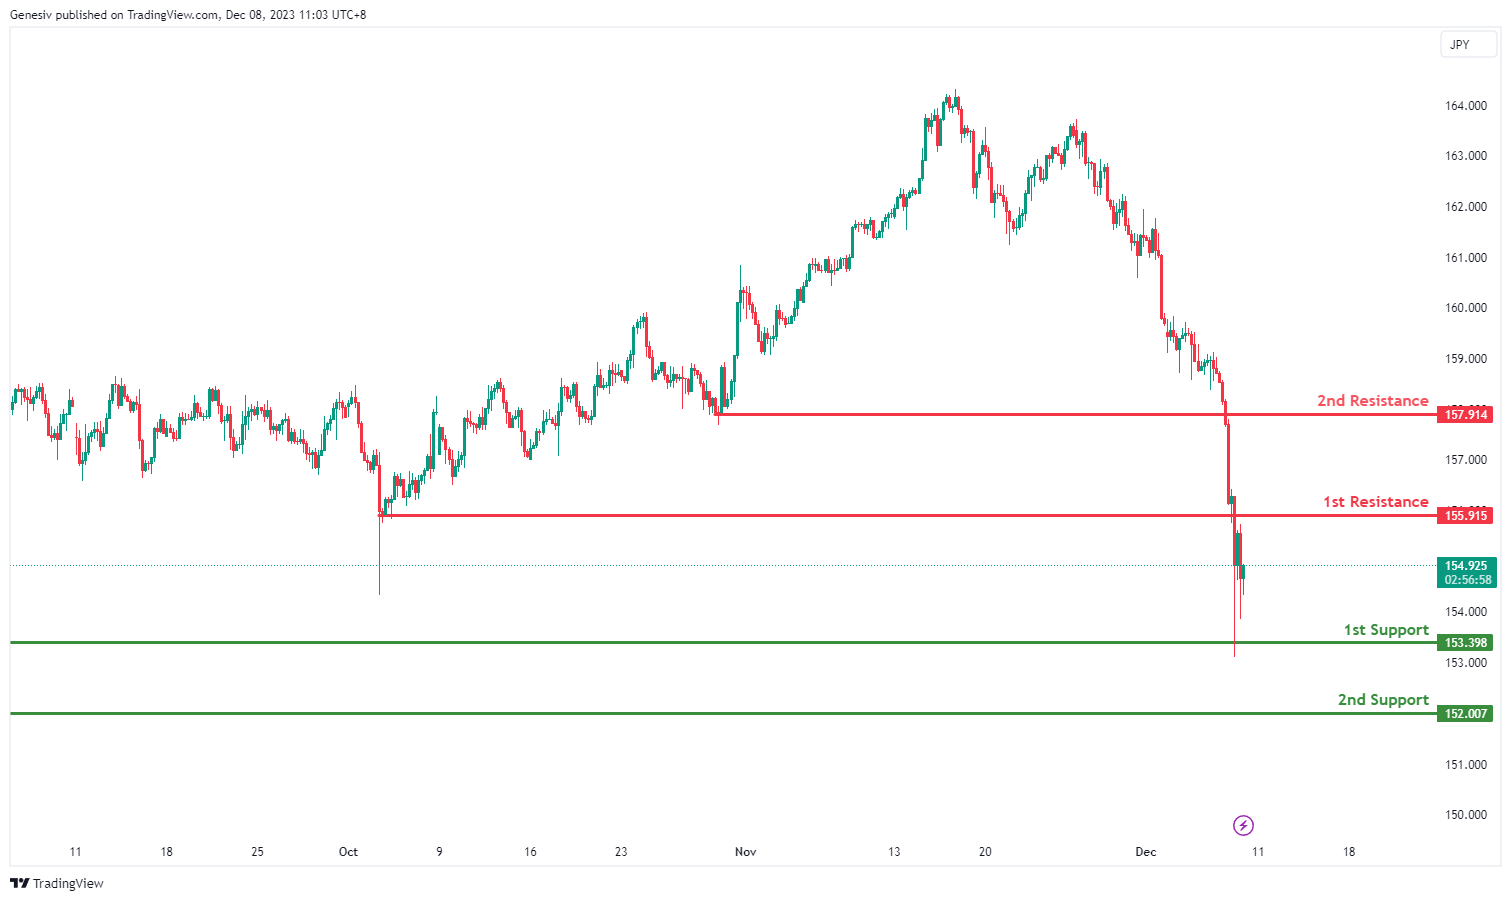
The EUR/JPY chart currently has bearish overall momentum, suggesting a potential bearish continuation towards the first support.
1st Support at 153.40: This level is identified as a pullback support, indicating a potential area where buying interest might emerge, contributing to a stabilization in the price.
2nd Support at 152.01: The second support is described as a swing low support, reinforcing the notion that this level has historical significance as a support zone.
1st Resistance at 155.92: The first resistance is recognized as a pullback resistance, suggesting a level where selling interest might be observed, acting as a hurdle to further upward movement.
2nd Resistance at 157.00: The second resistance is noted as a pullback resistance, indicating a level where selling interest might be encountered, potentially acting as an additional barrier to the bearish trend.
EUR/GBP:
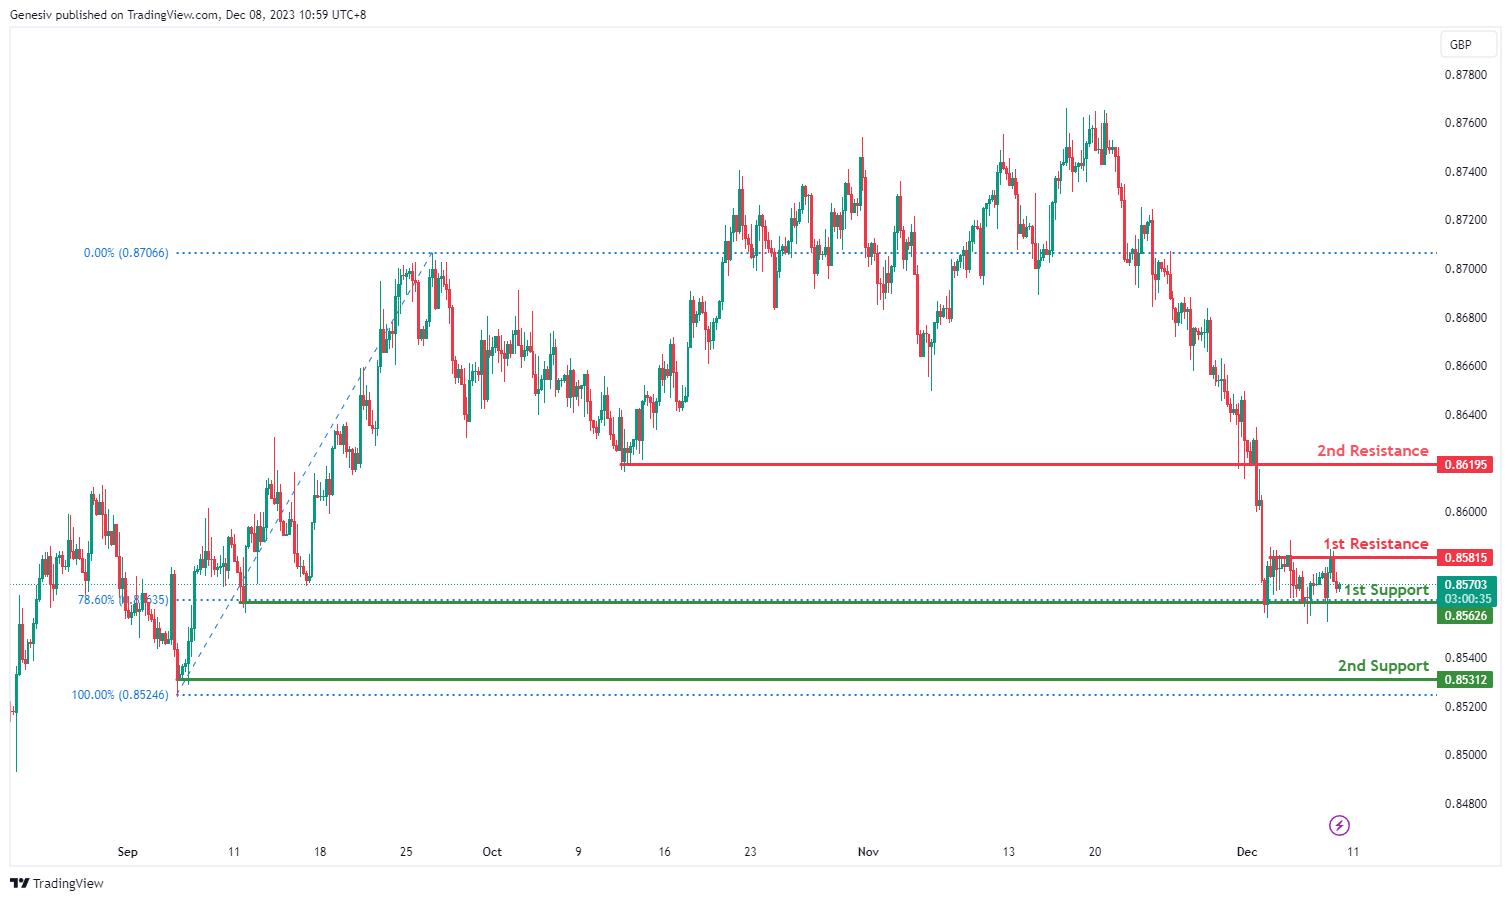
The EUR/GBP currency pair exhibits a a weak bearish momentum with low confidence, suggesting a potential bearish continuation towards the first support.
1st Support at 0.8563: This level is identified as a multi-swing low support, indicating historical significance as a level where the price has found support. Additionally, it coincides with the 78.60% Fibonacci retracement, adding to its potential strength as a support zone.
2nd Support at 0.8531: The second support is described as a pullback support, reinforcing the notion that buyers might show interest at this level, potentially leading to a stabilization in price.
1st Resistance at 0.8582: The first resistance is recognized as a multi-swing high resistance, suggesting historical points where the price faced obstacles and potential reversals. This level may act as a barrier to upward movement.
2nd Resistance at 0.8620: The second resistance is noted as a pullback resistance, indicating a level where selling interest might be observed, potentially acting as an obstacle to the bearish trend.
GBP/USD:
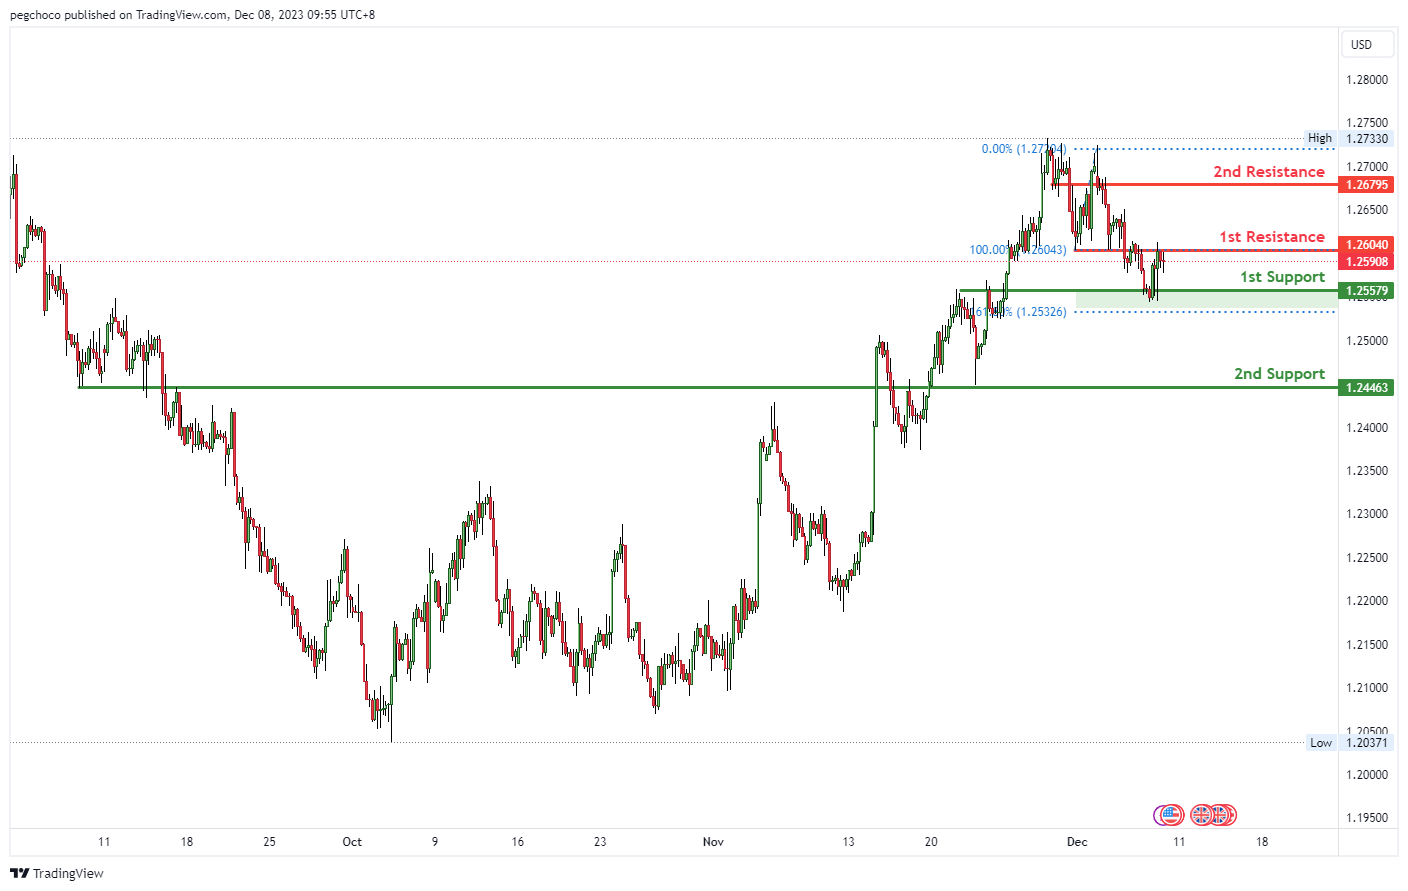
The GBP/USD chart currently exhibits a bearish overall momentum, indicating potential for a bearish continuation towards the 1st support level.
The 1st support at 1.2535 is categorized as an overlap support. Overlap supports are historical levels where buying interest may emerge, potentially providing support for the GBP/USD pair.
The 2nd support at 1.2446 is also identified as an overlap support, reinforcing its significance as a potential level where buyers might become active.
On the resistance side, the 1st resistance at 1.2604 is noted as an overlap resistance. Overlap resistances are historical levels where selling interest may intensify, potentially limiting upward movements.
The 2nd resistance at 1.2679 is categorized as an overlap resistance, further indicating its potential significance as a level where selling pressure may increase.
GBP/JPY:
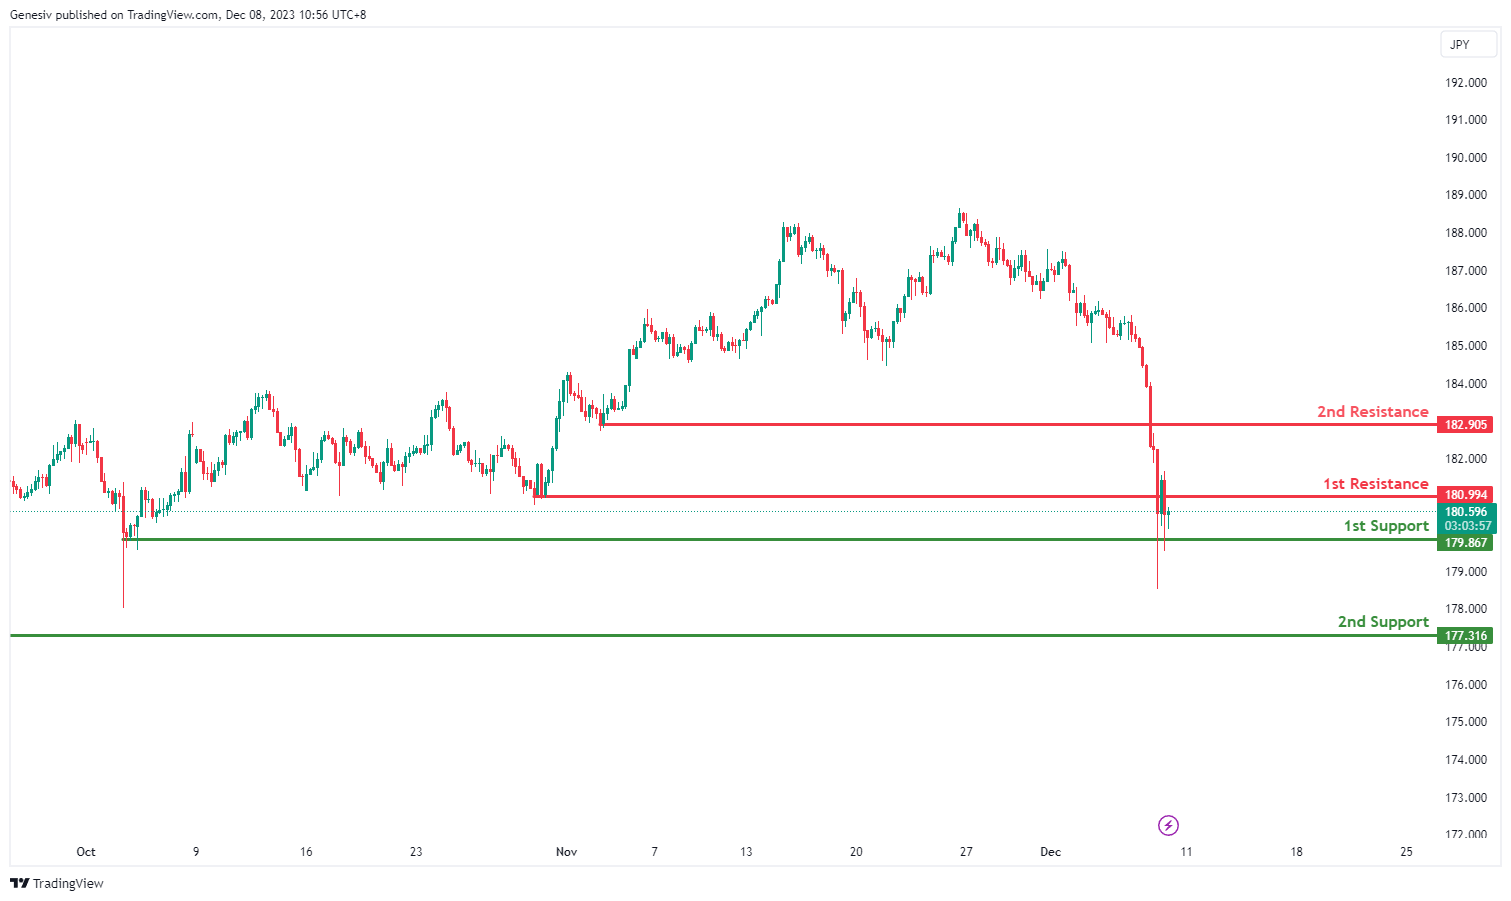
The GBP/JPY currency pair is currently experiencing a bearish momentum, indicating a potential bearish continuation towards the first support.
1st Support at 179.87: This level is identified as a swing low support, suggesting historical significance as a level where the price has found support in the past.
2nd Support at 177.32: The second support is described as a pullback support, indicating a level where buyers might show interest, potentially leading to price stabilization.
1st Resistance at 180.99: The first resistance is recognized as a pullback resistance, suggesting a level where selling interest might be observed, acting as a hurdle to further downward movement.
2nd Resistance at 182.91: The second resistance is noted as a pullback resistance, reinforcing the potential for selling interest and acting as an additional obstacle to the bearish trend.
USD/CHF:
The analysis for the USD/CHF currency pair is as follows:
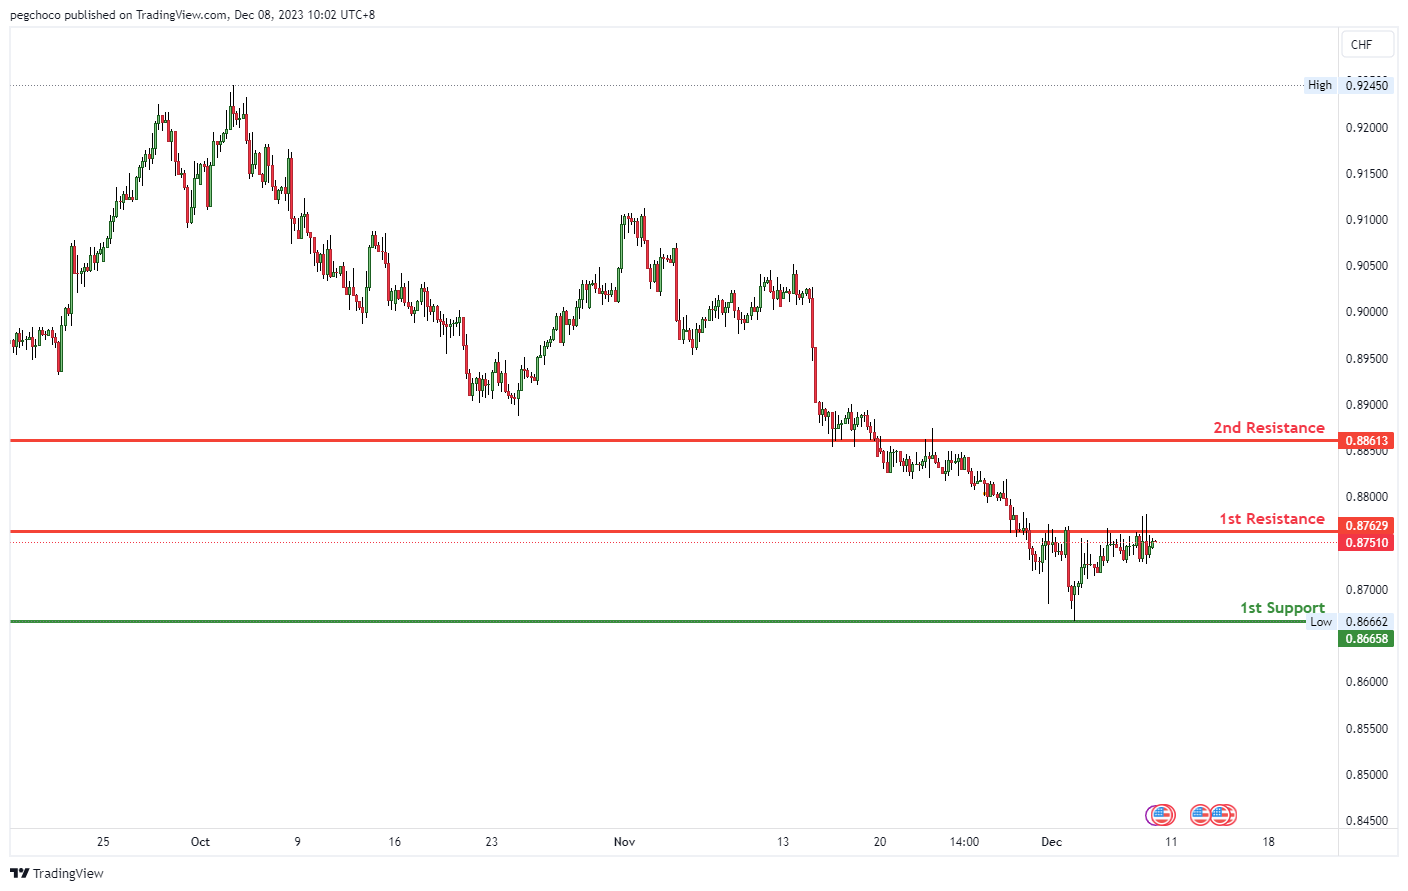
The USD/CHF chart currently displays a neutral overall momentum, suggesting that price could potentially fluctuate between the 1st resistance and 1st support levels.
The 1st support at 0.8665 is categorized as a multi-swing low support. Multi-swing low supports are historical levels where buying interest may emerge, potentially providing support for the USD/CHF pair.
On the resistance side, the 1st resistance at 0.8762 is identified as an overlap resistance. Overlap resistances are historical levels where selling interest may intensify, potentially limiting upward movements.
The 2nd resistance at 0.8861 is also categorized as an overlap resistance, reinforcing its significance as a potential level where selling pressure may increase.
USD/JPY:
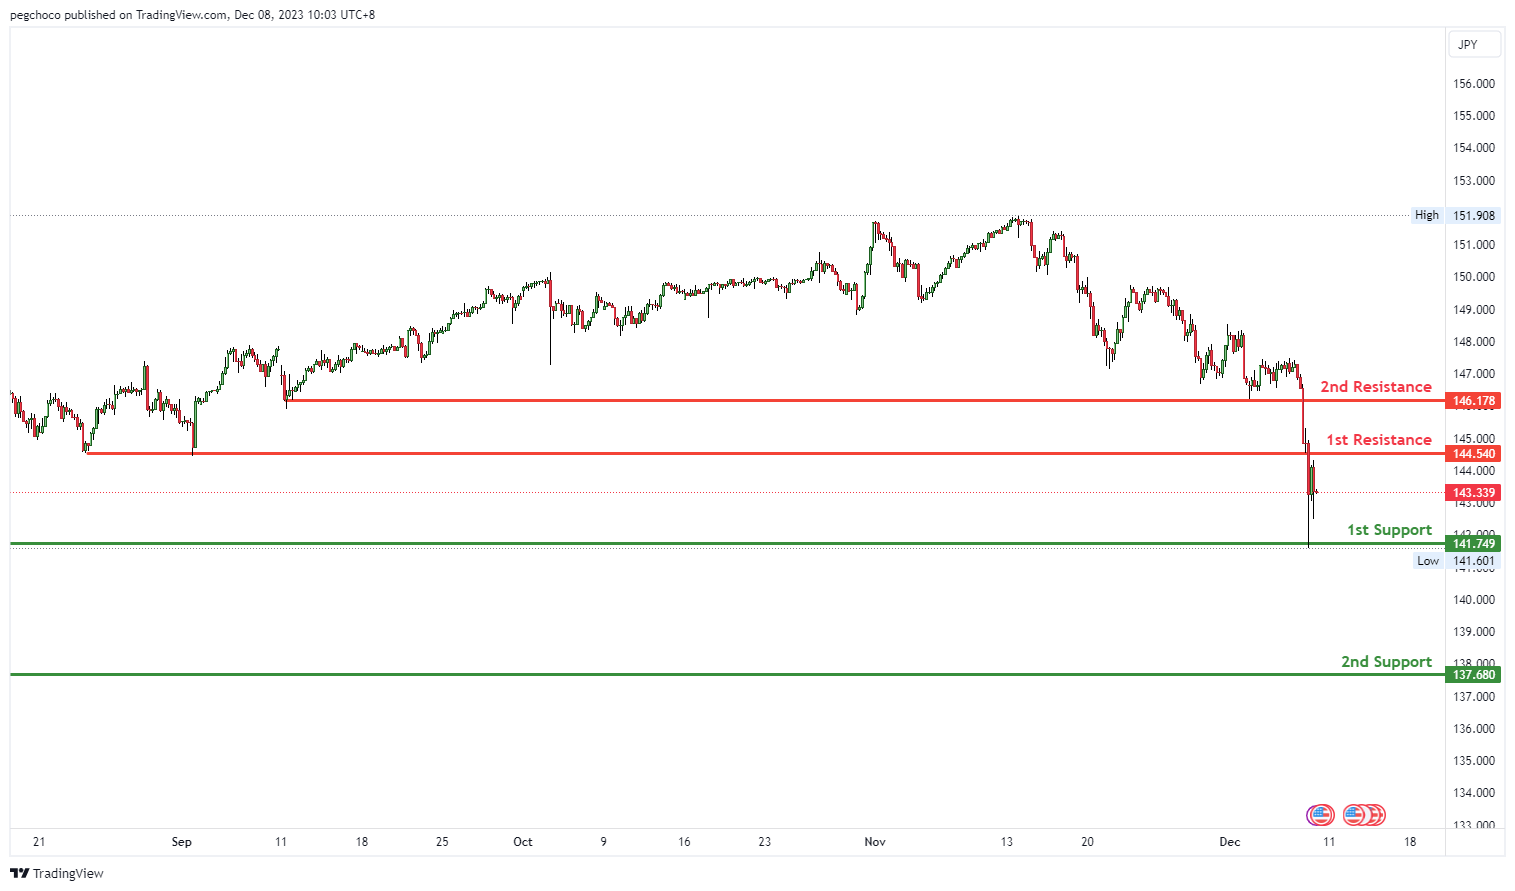
The USD/JPY chart currently exhibits a bearish overall momentum, suggesting the potential for a bearish continuation towards the 1st support level.
The 1st support at 141.74 is categorized as an overlap support. Overlap supports are historical levels where buying interest may emerge, potentially providing support for the USD/JPY pair.
Further down, there is a 2nd support at 137.68, also identified as an overlap support. This reinforces the significance of this support level, suggesting it as a potential area where buyers might become active.
On the resistance side, the 1st resistance at 144.74 is noted as a pullback resistance, implying that it’s a substantial barrier where selling interest could intensify, potentially triggering a bearish continuation.
The 2nd resistance at 146.17 is also identified as a pullback resistance, further indicating its potential significance as a level where selling pressure may increase.
USD/CAD:
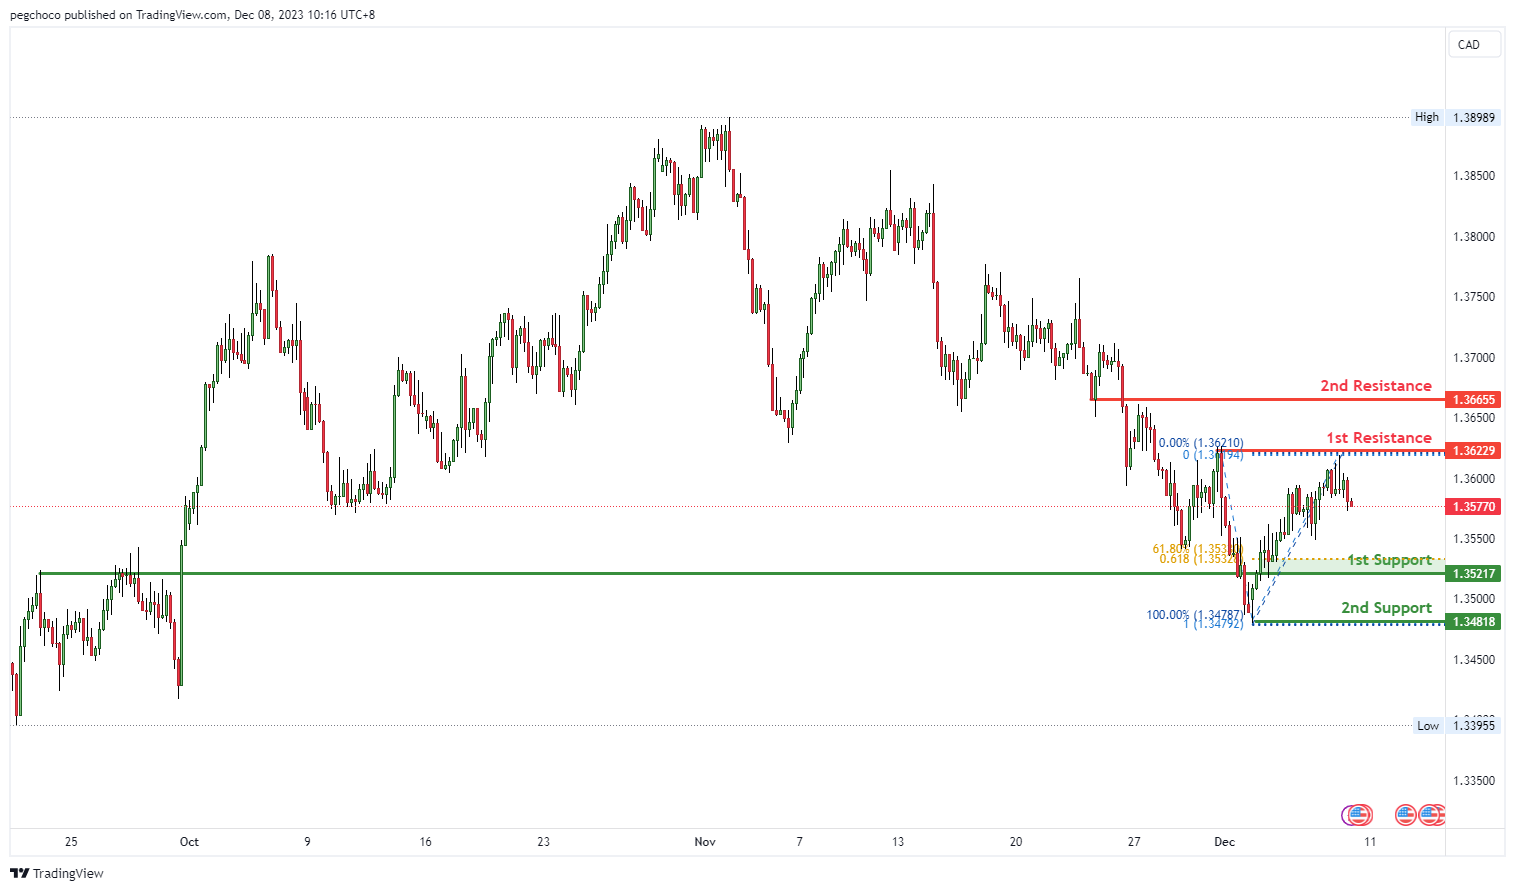
The USD/CAD chart currently has a bearish overall momentum, and there’s potential for a bearish continuation towards the 1st support level.
The 1st support at 1.3521 is categorized as an overlap support. This level is significant because it indicates a confluence of technical factors, including the 61.80% Fibonacci Retracement and the 61.80% Fibonacci Projection. This suggests that it could be a strong level where buying interest may emerge, potentially providing support for the USD/CAD pair.
The 2nd support at 1.3481 is identified as a swing low support, further reinforcing its significance as a potential level where buyers might become active. Additionally, it is associated with the 100% Fibonacci Projection, making it a notable level.
On the resistance side, the 1st resistance at 1.3622 is noted as a swing high resistance. This implies that it’s a substantial barrier where selling interest could intensify, potentially limiting upward movements.
The 2nd resistance at 1.3666 is categorized as an overlap resistance, indicating its potential significance as a level where selling pressure may increase.
AUD/USD:
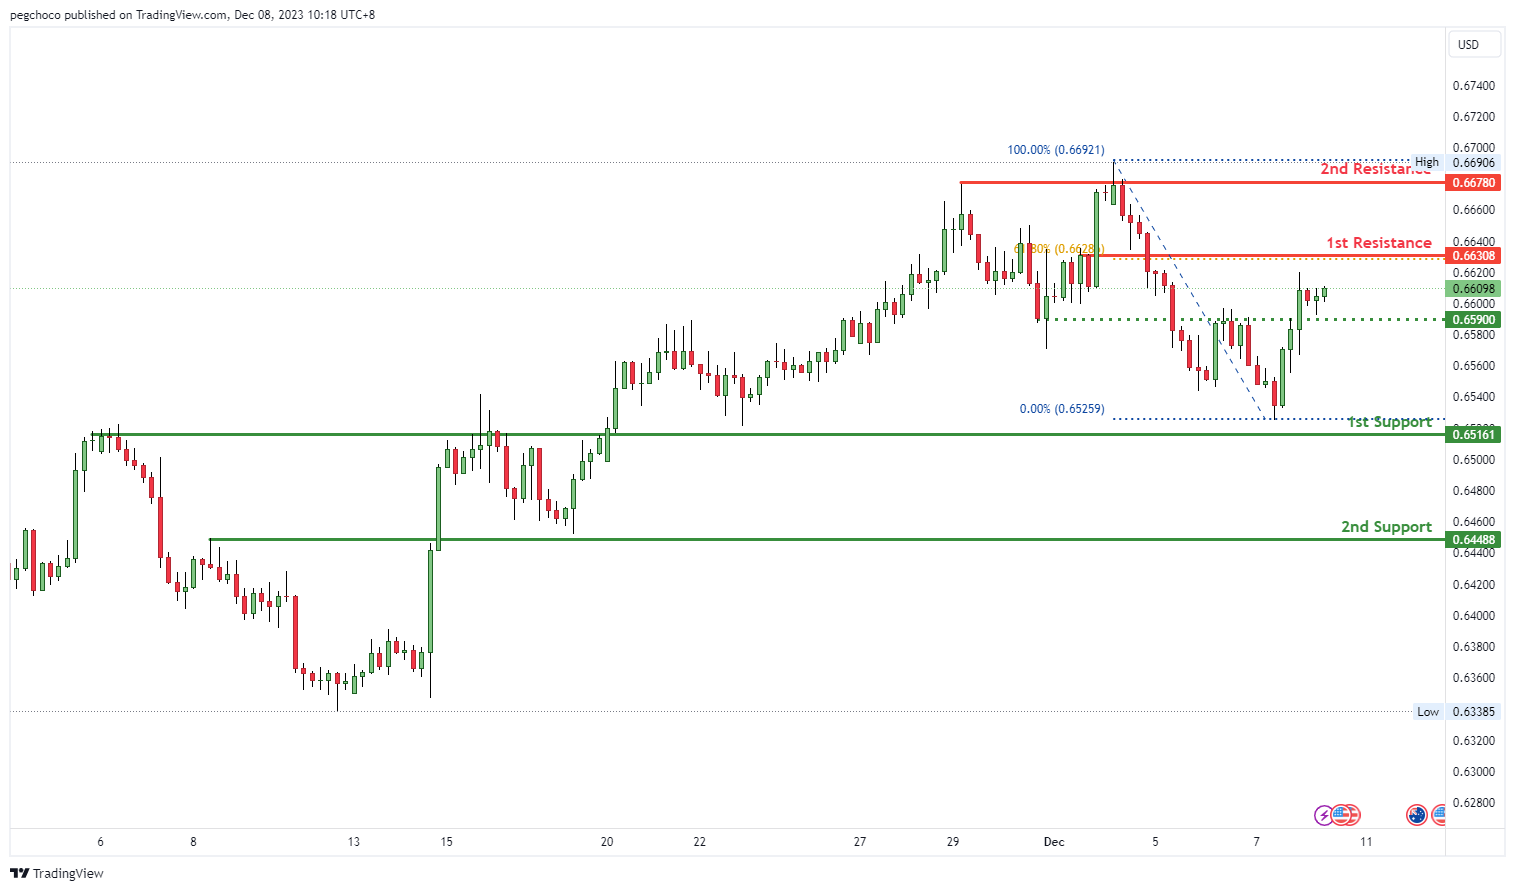
The AUD/USD chart currently exhibits a bearish overall momentum, and there’s potential for a bearish reaction off the 1st resistance level with a subsequent drop towards the 1st support.
The 1st support at 0.6516 is categorized as a pullback support, indicating it could be a significant level where buying interest may emerge, potentially providing support for the AUD/USD pair.
The 2nd support at 0.6448 is also identified as a pullback support, reinforcing the significance of this support level as a potential area where buyers might become active.
On the resistance side, the 1st resistance at 0.6630 is noted as a pullback resistance and is associated with the 61.80% Fibonacci Retracement level. This suggests it as a substantial barrier where selling interest could intensify, potentially leading to a bearish reaction.
The 2nd resistance at 0.6678 is categorized as a multi-swing high resistance, indicating another level where selling pressure may increase.
Additionally, there is an intermediate support at 0.6590, categorized as an overlap support, suggesting it as a level where buyers could also provide support.
NZD/USD
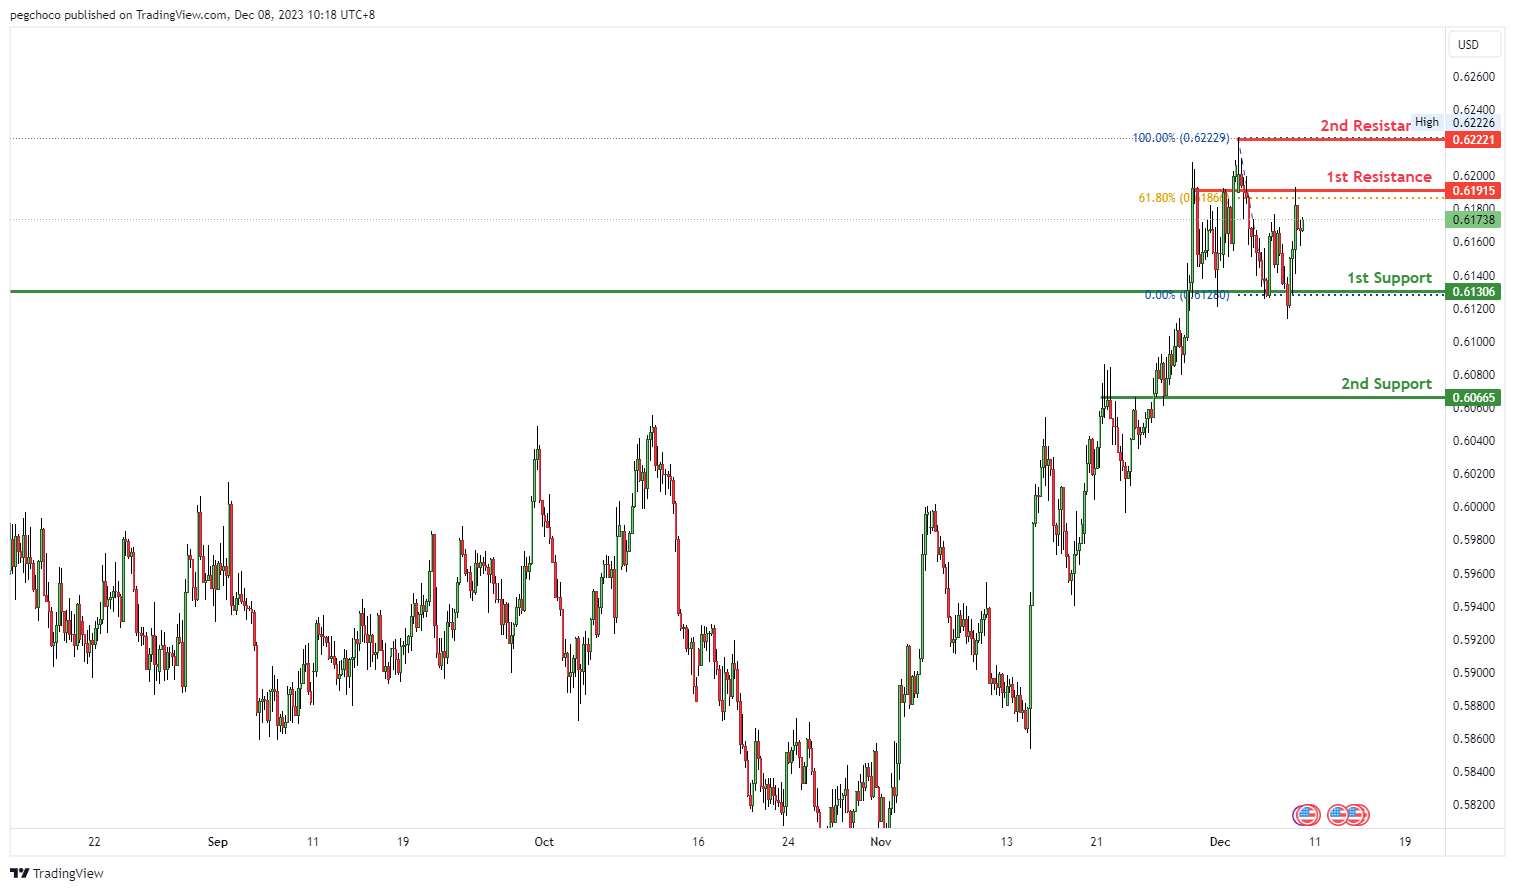
The NZD/USD chart currently has a bearish overall momentum, and there’s potential for a bearish reaction off the 1st resistance level with a subsequent drop towards the 1st support.
The 1st support at 0.6130 is categorized as an overlap support, indicating that it could be a significant level where buying interest may emerge, potentially providing support for the NZD/USD pair.
The 2nd support at 0.6066 is also identified as an overlap support, reinforcing the significance of this support level as a potential area where buyers might become active.
On the resistance side, the 1st resistance at 0.6191 is noted as an overlap resistance and is also associated with the 61.80% Fibonacci Retracement level. This suggests it as a substantial barrier where selling interest could intensify, potentially leading to a bearish reaction.
The 2nd resistance at 0.6222 is categorized as a swing high resistance, indicating another level where selling pressure may increase.
DJ30:
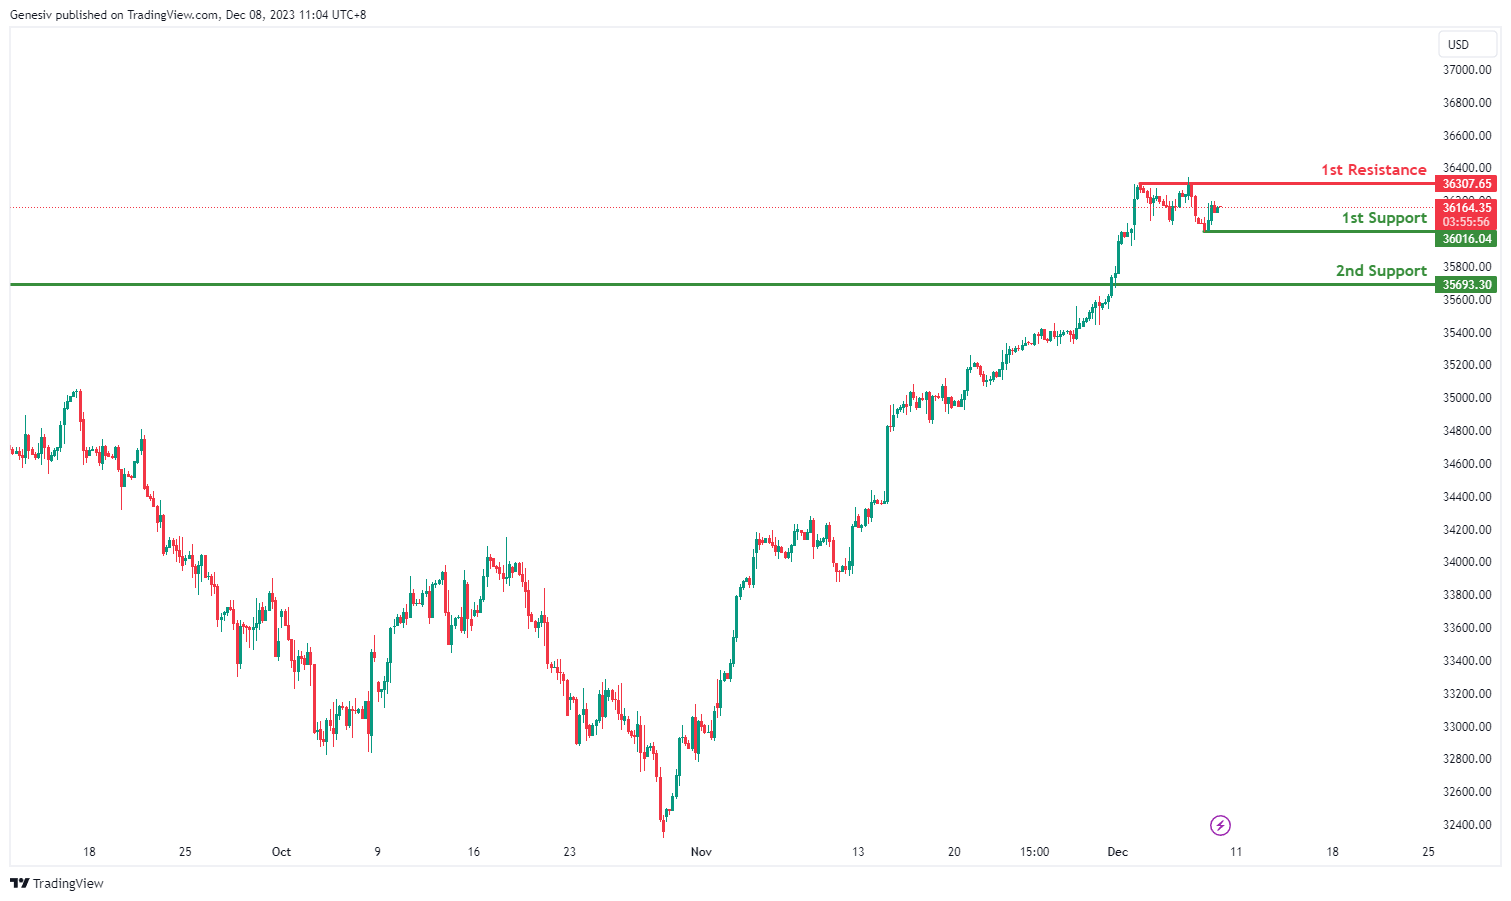
The DJ30 shows a neutral overall momentum, indicating a lack of a clear bullish or bearish trend. The potential price movement suggests a scenario in which the price could fluctuate between the first resistance and the first support levels. Overall Momentum: Neutral
1st Support at 36016.04: This level is identified as a swing low support, suggesting historical significance as a level where the price has found support in the past.
2nd Support at 35693.30: The second support is described as a pullback support, indicating a level where buyers might show interest, potentially stabilizing the price.
1st Resistance at 36307.65: This level is recognized as a swing high resistance, representing a historical point where the price has faced obstacles and potential reversals.
GER40:
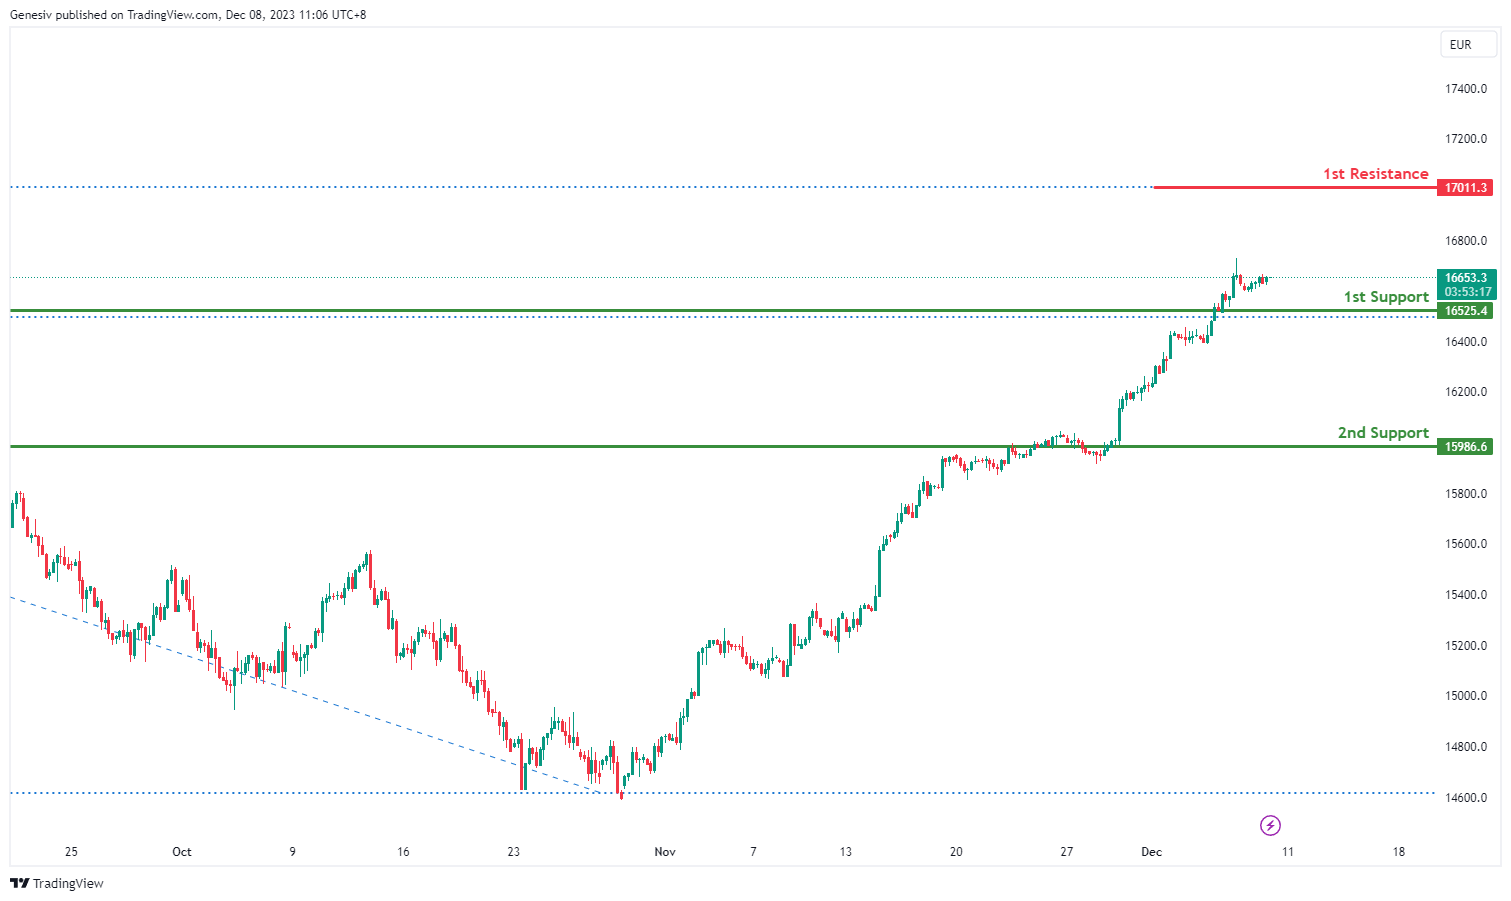
The GER40 indicates a llish overall momentum, suggesting a potential continuation towards the first resistance.
1st Support at 16524.4: This level is identified as a pullback support, indicating a potential area where buying interest might emerge, contributing to price stabilization.
2nd Support at 15986.6: The second support is also described as a pullback support, reinforcing the notion that buyers could be interested in this level, potentially providing strong support.
1st Resistance at 17009.4: The first resistance is noted as being at the 127.20% Fibonacci Extension level, signifying a potential barrier where the price might face selling pressure or a reversal within its bullish trend.
US500:
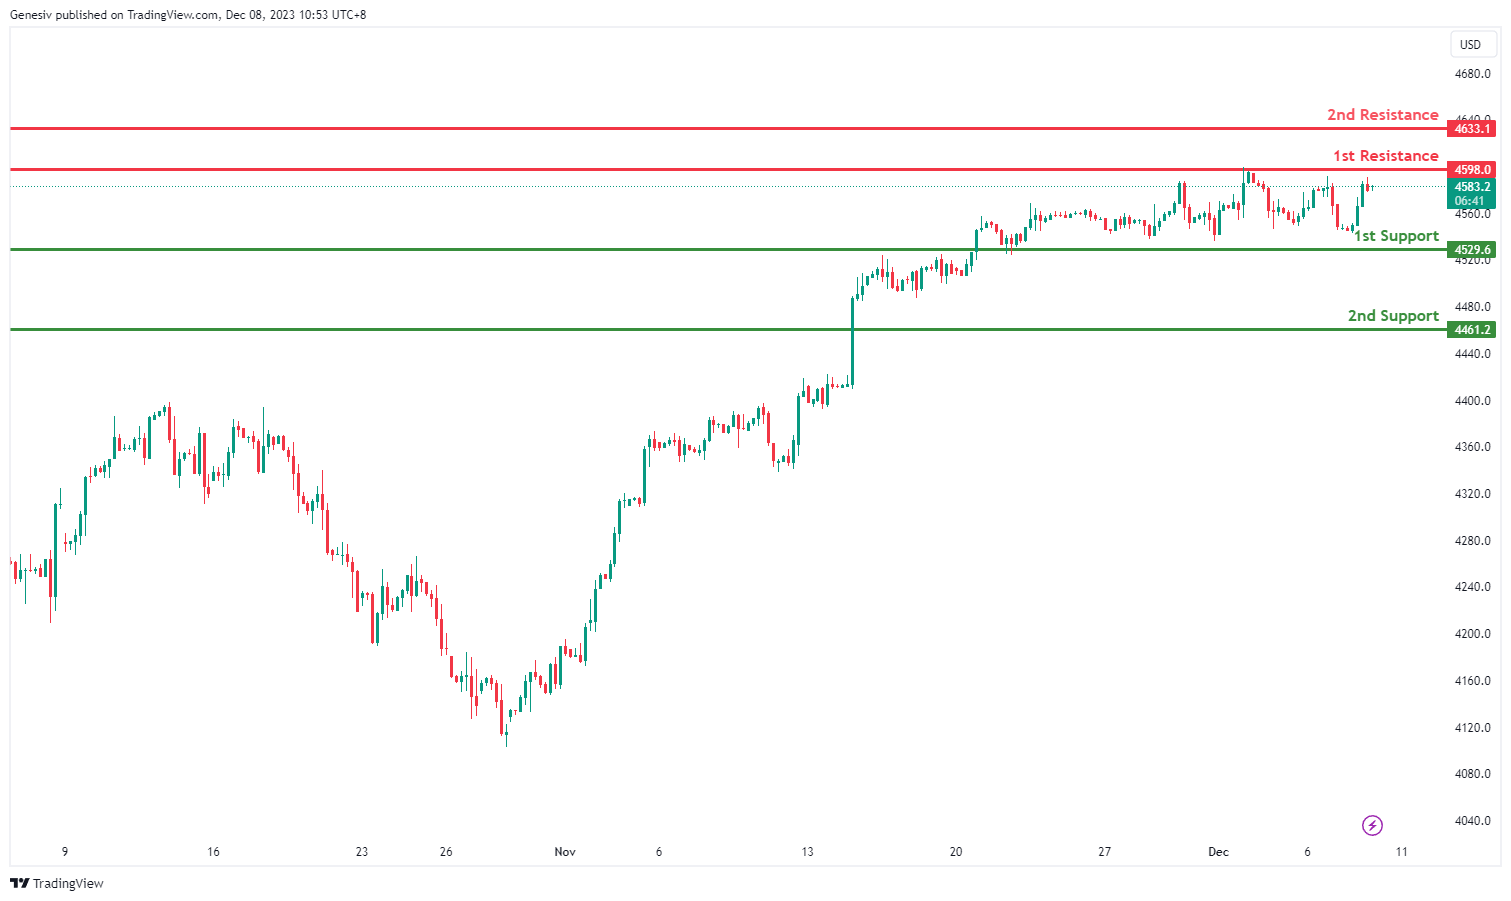
The chart of US500 indicates a bullish overall momentum, suggesting a potential continuation towards the first resistance.
1st Support at 4529.6: This level is identified as an overlap support, indicating historical significance as a level where the price has found support in the past.
2nd Support at 4461.2: The second support is described as a pullback support, suggesting a level where buyers might show interest, potentially leading to price stabilization.
1st Resistance at 4598.0: The first resistance is recognized as a multi-swing high resistance, signifying a historical point where the price faced obstacles and potential reversals in its upward movement.
2nd Resistance at 4633.1: The second resistance is noted as a pullback resistance, indicating a level where selling interest might be observed, potentially acting as a hurdle to further bullish movement.
BTC/USD:
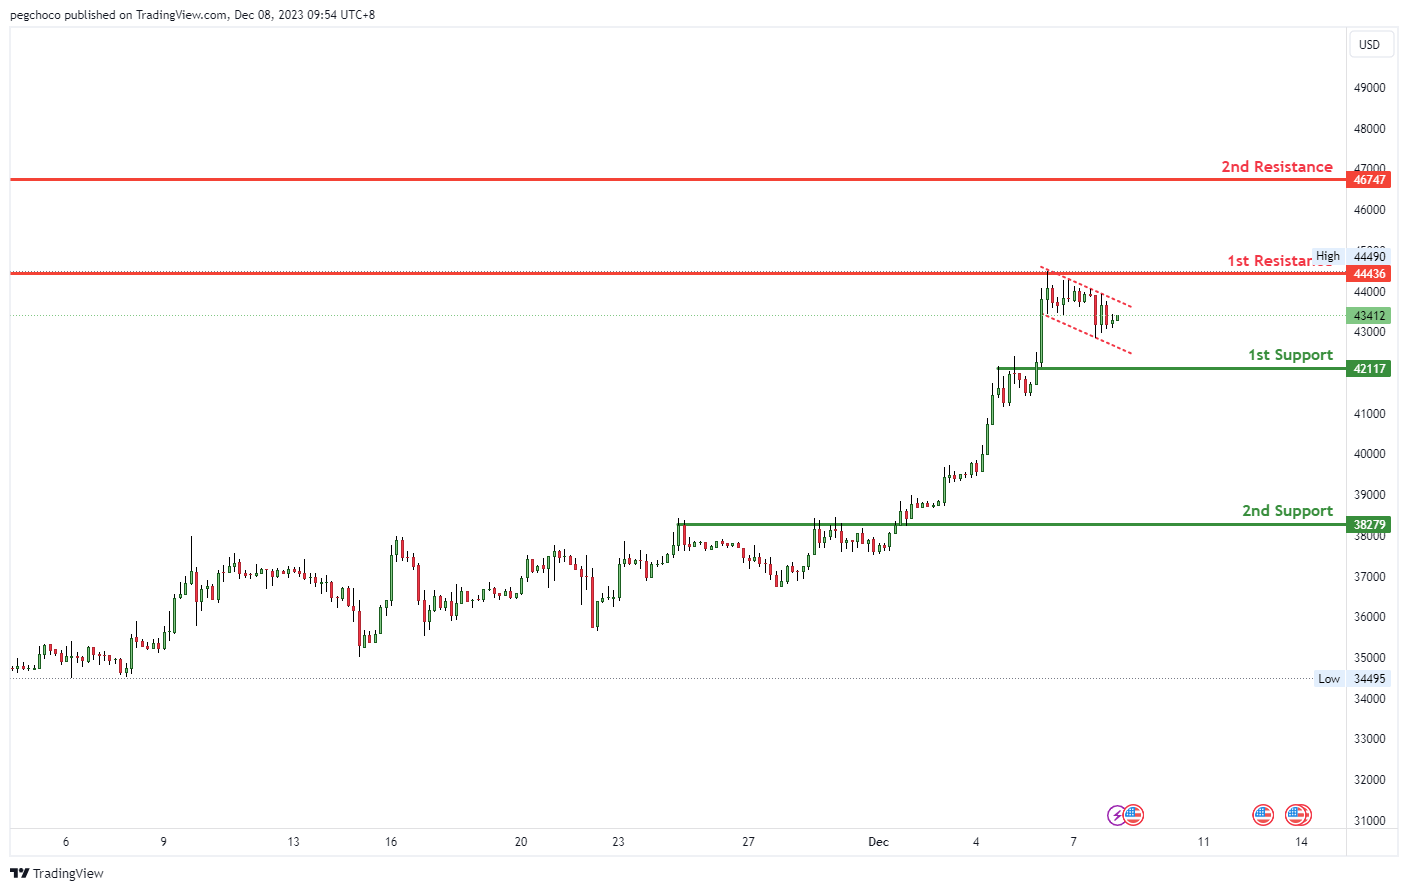
The BTC/USD chart currently exhibits a bullish overall momentum, and there’s potential for a bullish bounce off the 1st support level, signaling a potential upward movement towards the 1st resistance.
The 1st support at 42117 is categorized as an overlap support, indicating that it could be a significant level where buying interest may emerge, potentially providing support for the BTC/USD pair.
Further reinforcing this potential bullish scenario, there is a 2nd support at 38283, also identified as an overlap support. This additional support level adds to the significance of the potential bounce.
On the resistance side, the 1st resistance at 44436 is noted as a pullback resistance. This suggests that it’s a substantial barrier where selling interest could intensify, potentially causing a temporary pause in the bullish movement.
The 2nd resistance at 46747 is categorized as an overlap resistance, further indicating its potential significance as a level where selling pressure may increase.
Additionally, a “Bullish Flag” pattern is observed. Bullish flag patterns are common in equities that are in a sustained rally and are regarded as strong continuation patterns. This pattern often indicates that after a brief consolidation or pullback (the “flag”), there’s a potential for the previous upward trend to continue.
ETH/USD:
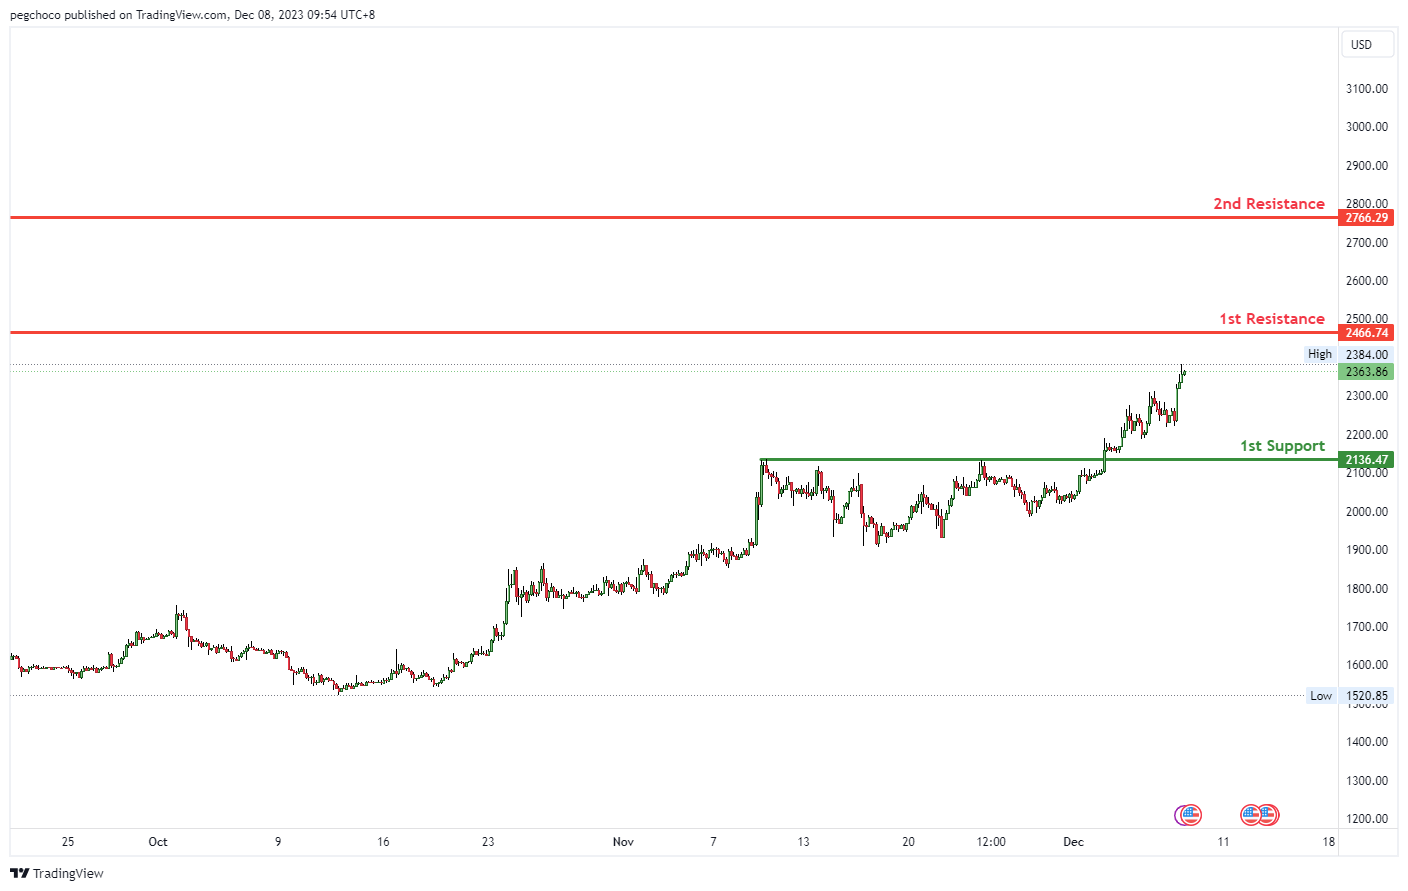
The ETH/USD chart currently exhibits a bullish overall momentum, and there’s potential for a bullish continuation towards the 1st resistance level.
The 1st support at 2136.47 is categorized as a pullback support. This level might act as a significant support zone where buying interest may emerge, potentially providing support for the Ethereum/US Dollar pair.
On the resistance side, the 1st resistance at 2466.74 is identified as an overlap resistance. This suggests that it’s a substantial barrier where selling interest could intensify, potentially limiting further upward movements.
The 2nd resistance at 3766.29 is categorized as a pullback resistance, indicating another level where selling pressure may increase.
WTI/USD:
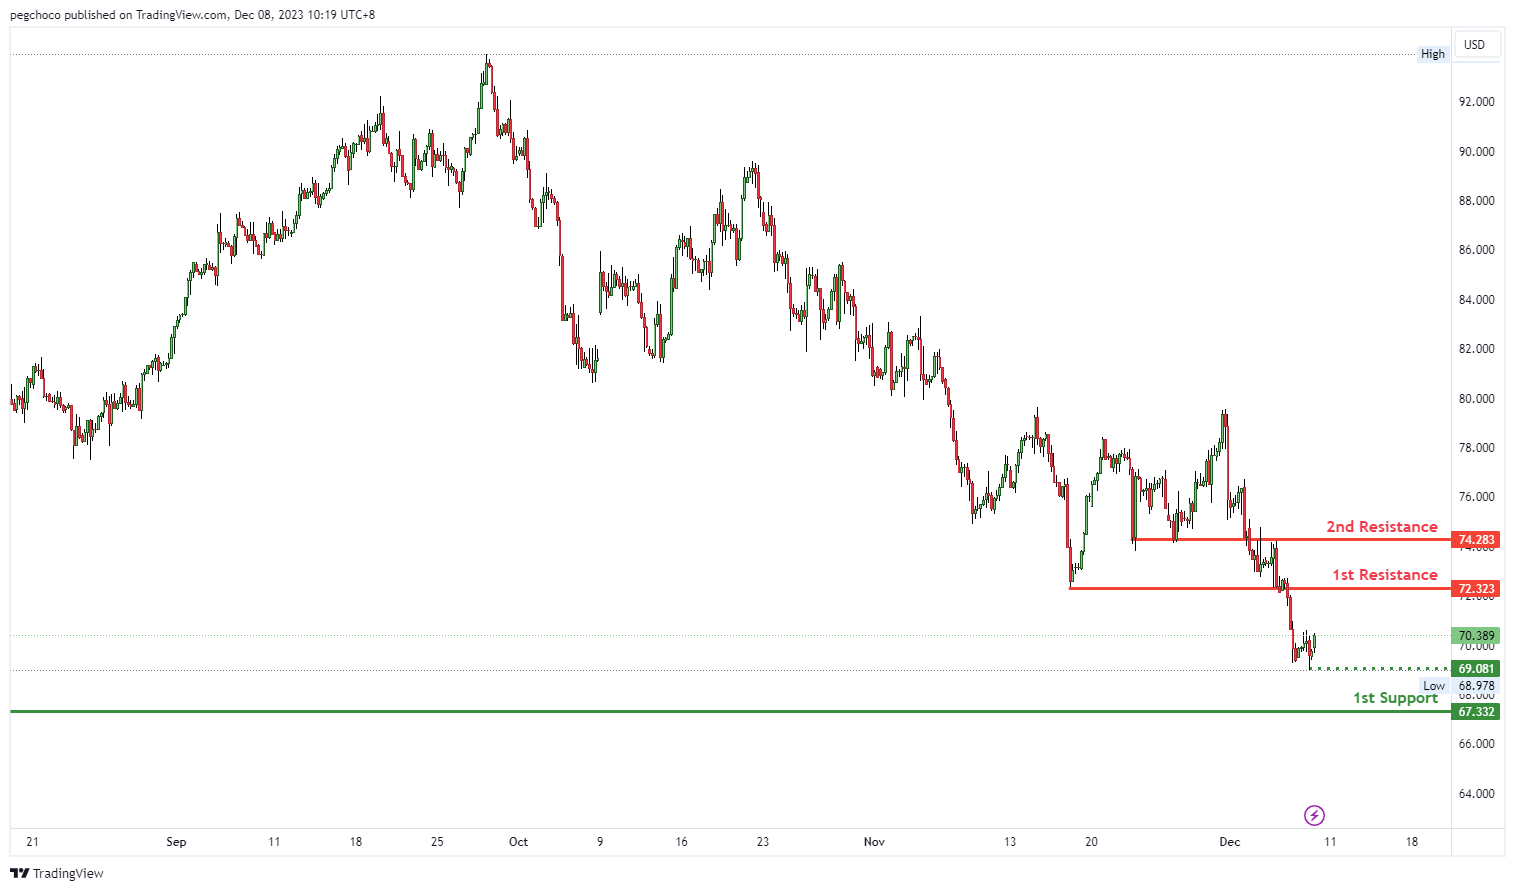
The WTI chart currently has a bearish overall momentum, and there’s potential for a bearish reaction off the 1st resistance level with a subsequent drop towards the 1st support.
The 1st support at 67.33 is categorized as a multi-swing low support, indicating that it could be a significant level where buying interest may emerge, potentially providing support for the WTI price.
Intermediate support is noted at 69.08, which is identified as a swing low support. This adds to the significance of potential support in this area.
On the resistance side, the 1st resistance at 72.32 is categorized as a pullback resistance, implying that it’s a substantial barrier where selling interest could intensify, potentially leading to a bearish reaction.
The 2nd resistance at 74.28 is identified as an overlap resistance, indicating another level where selling pressure may increase.
XAU/USD (GOLD):
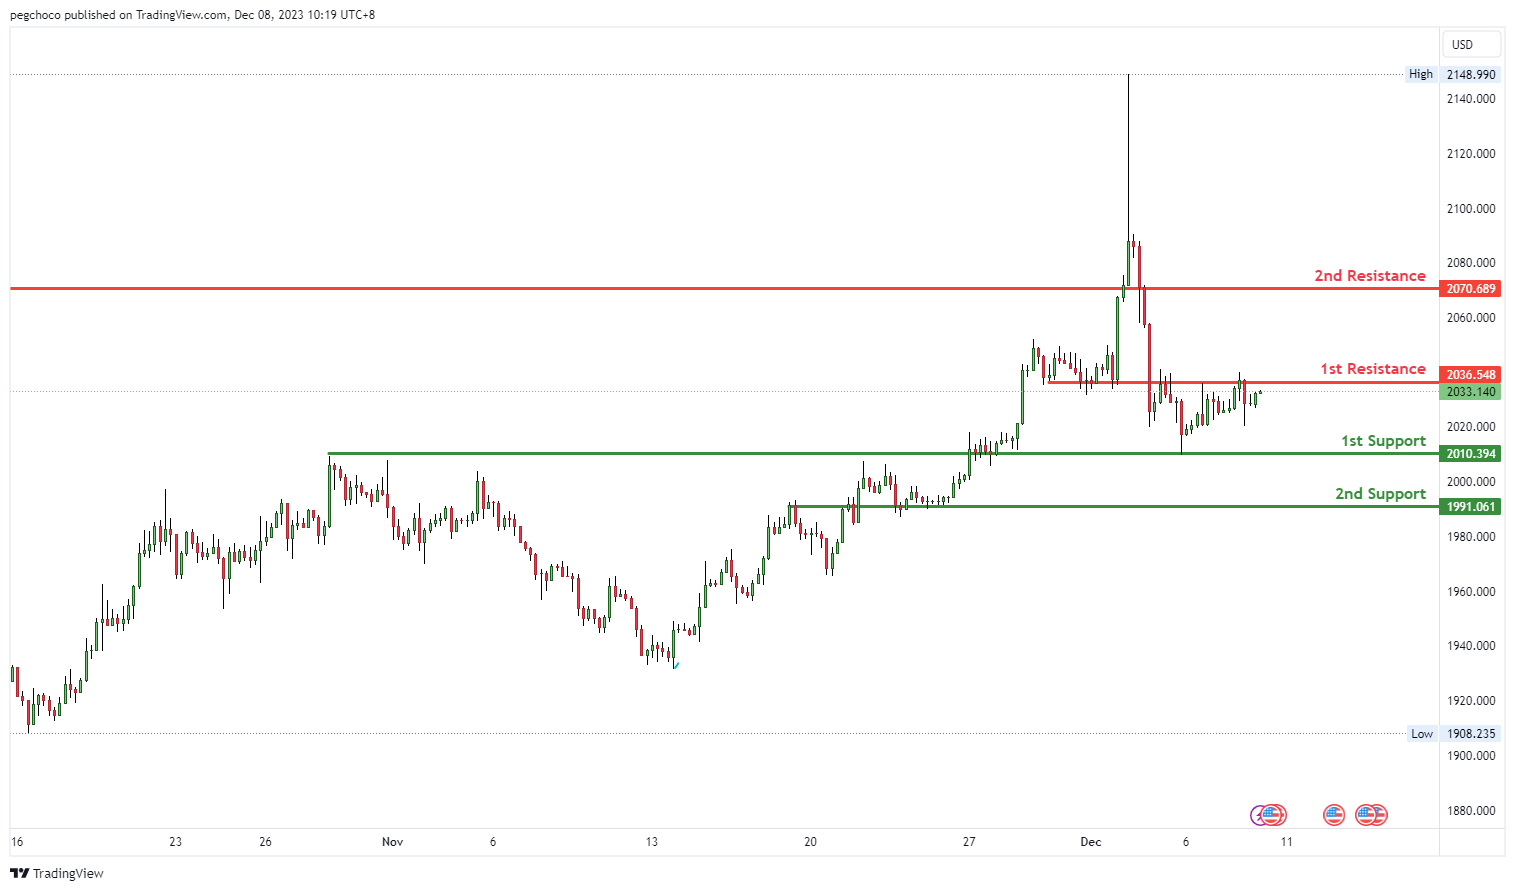
The XAU/USD chart currently exhibits a neutral overall momentum, suggesting the potential for price to fluctuate between the 1st resistance and 1st support levels.
The 1st support at 2010.39 is categorized as an overlap support. Overlap supports are historical levels where buying interest may emerge, potentially providing support for the XAU/USD pair.
Further down, there is a 2nd support at 1991.06, also identified as an overlap support. This reinforces the significance of this support level, suggesting it as a potential area where buyers might become active.
On the resistance side, the 1st resistance at 2036.54 is noted as an overlap resistance, implying that it’s a substantial barrier where selling interest could intensify, potentially limiting upward movements.
The 2nd resistance at 2070.68 is categorized as a pullback resistance, further indicating its potential significance as a level where selling pressure may increase.
US NFP in spotlight: A crucial test for soft-landing hypothesis
Today's primary focus in the financial markets is US Non-Farm Payrolls report, which is keenly anticipated by investors assessing the "soft landing" scenario in the economy. The soft landing hypothesis implies that labor market is cooling sufficiently to reduce inflation and pave the way for Fed to start lowering interest rates next year, without posing a significant threat to the overall economy.
Non-Farm Payrolls report is expected to indicate that job growth reaccelerated to 190k in November, up from October's 150k. Unemployment rate is projected to remain steady at 3.9%, and average hourly earnings are anticipated to show 0.3% mom increase.
Recent labor market data has shown signs of cooling. ISM Manufacturing Employment index dropped from 46.8 to 45.8, while ISM Services Employment index saw a slight improvement from 50.2 to 50.7. ADP Employment growth recorded 103k, nearly unchanged from the previous month's 106k. The four-week moving average of initial jobless claims rose from 213k to 221k. Additionally, the latest JOLTs reported a drop in the ratio of job openings to number of unemployed workers to 1.34, the lowest since August 2021.
A "goldilocks" Non-Farm Payrolls report, signifying a balanced labor market condition, could reignite bull runs in the stock markets and subsequently exert renewed selling pressure on the Dollar. However, market reactions to deviations from this ideal scenario are difficult to predict.
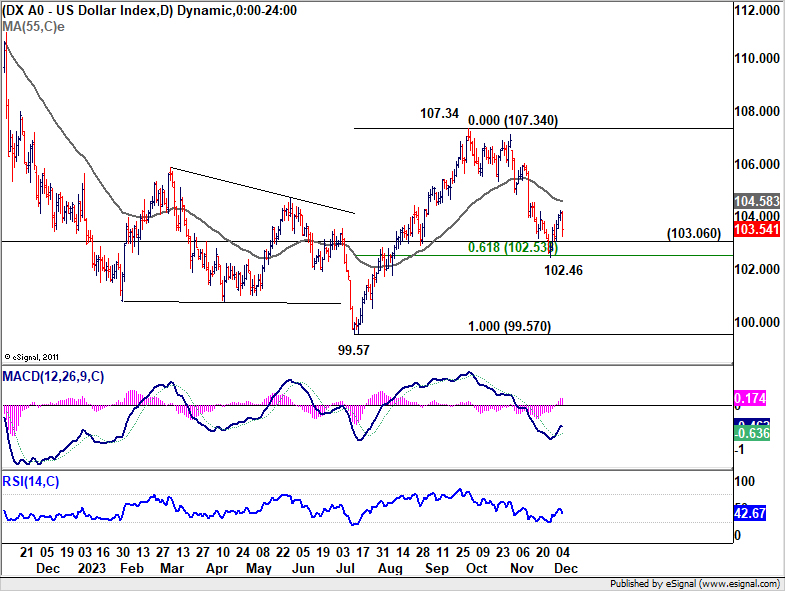
Regarding the Dollar index, recovery from 102.46 was interrupted after reaching 104.23, largely due to the steep selloff in USD/JPY. For now, further rise is mildly in favor as long as 103.06 minor support holds, towards 55 D EMA (now at 103.54).
But the index could start to struggle above there, unless EUR/USD could extended its near term decline through 55 D EMA decisively, while USD/JPY could stabilize at 142.45 fibonacci support.
Japan’s nominal pay rises 1.5% yoy, but fail to keep pace with inflation, consumer spending drops
Japan's nominal pay growth rose by 1.5% yoy, surpassing the expected 1.0% yoy increase. This marked the fastest rate of increase since June. Regular or base salaries contributed to this increase with a 1.4% yoy rise. However, overtime pay slightly decreased by -0.1% yoy. Special payments, a variable component of wages, saw a significant jump of 7.5% yoy.
However, the positive trend in nominal pay was offset by the continued decline in inflation-adjusted real wages, which fell for the 19th consecutive month, dropping by -2.3% yoy. A labor ministry official commented, "Price increases have outpaced wage growth." This situation is exacerbated by the consumer inflation rate, which includes fresh food prices but excludes owner's equivalent rent, re-accelerating to 3.9% after a brief two-month slowdown.
Alongside wage trends, household spending in Japan also experienced a downturn, decreasing by -2.5% yoy in October. This decline, while still significant, was less severe than the anticipated 3.0% yoy drop. The continued decrease in household spending, which has now extended to eight consecutive months, reflects ongoing challenges in the domestic consumption sector.
BoC’s Gravelle elaborates on holding interest rates steady amid balanced economy
In a speech overnight, BoC Deputy Governor Toni Gravelle said the decision to maintain policy interest rate at 5% this week was an effort to "balance the risks of over- and under-tightening." BoC aims to avoid excessively slowing down the economy, while also alleviating the burden of high inflation on Canadians.
Gravelle observed that the Canadian economy "no longer looks to be in excess demand", a shift that has contributed to reducing price pressures across a wide array of goods and services. He added said, "The economy is now roughly in balance.
He also emphasized that BoC is closely monitoring several key economic indicators, such as inflation expectations, wage growth, and corporate pricing behavior. These factors are crucial in determining whether inflation is on a consistent path towards the 2% target.
Despite the current state of balance in the economy, Gravelle stated, "Given the risks to the inflation outlook, we remain prepared to increase the policy rate further if needed."
Cliff Notes: Policy’s Effect Being Felt
Key insights from the week that was.
Q3 GDP for Australia surprised to the downside, printing 0.2% (2.1%yr). Relative to expectations, the key disappointment in the quarter was consumer spending, unchanged in Q3 after just a 0.1% gain in Q2. Per capita consumption growth is in the realm of –2.0%yr, second only to the GFC experience. Interest costs and tax payments are putting households under significant pressure, the drag from the latter being the largest ever recorded. Together these detractors wiped out a robust gain in nominal gross income in Q3. Also accounting for inflation, real disposable income has deteriorated materially (–4.3%yr).
Elsewhere in the domestic economy, public demand was a key contributor to growth, rising 1.4% in the quarter. In part this explains some of the weakness in consumption – government subsidies reducing the cost of electricity for households. That public investment meanwhile extended its uptrend (+12%yr) reflects the pursuit of capacity to meet the needs of a growing population. The impetus seen in business investment H1 2023 is, in contrast, fading after the expiration of generous tax incentives. From 2.5% in Q2, quarterly growth in business investment is now just 0.6%.
On trade, Australia’s current account balance fell from a surplus of $7.8bn in Q2 to a slight deficit of –$0.2bn in Q3. That was primarily driven by a moderation in the trade position as the terms of trade continued to slip (–2.6% ), a trend that extended into October for goods. In real terms, the decline in export volumes (–0.7%) in Q3 was met with a lift in imports (+2.1%), leading net exports to subtract a material 0.6ppts from GDP in the three months to September.
As detailed by Chief Economist Luci Ellis, the RBA’s decision to leave policy unchanged earlier in the week was unsurprising given the constructive dataflow ahead of the decision. The Board’s patience – to allow careful assessment of the dataflow – was further justified by the picture the National Accounts painted of the household sector.
Westpac remains of the view that the RBA does not need to tighten any further. The Q4 CPI still holds some risk; but with the consumer clearly pulling back on discretionary spending in response to higher interest rates and a growing tax burden, not only is the Q4 CPI likely to show softer momentum, but the detail is also expected to imply persistence in this downtrend through 2024.
Before moving offshore, a final note on housing. October’s housing finance data showcased a 5.6% bounce in the value of owner-occupier loan approvals, centred on a surge in construction-related lending (+9.1%) and, to a lesser extent, loans for the purchase of existing dwellings (+4.6%). Highlighting the price-led nature of the cycle thus far, the volume of total owner-occupier loans is little-changed from last year (–0.6%) whilst the total value of loans has lifted 12.1% over the same period. Affordability will continue to have a significant bearing on housing market outcomes in 2024.
Offshore, North America was in focus.
The Bank of Canada kept rates steady at 5% in December. The statement noted “the economy is no longer in excess demand”, implying that monetary policy is achieving its aims. Despite this, the Governing Council are still cautious on risks to wages and inflation and so “remains prepared to raise the policy rate further if needed”. Arguably, the BoC are keen to restrain market participants from pricing in rate cuts too soon, thereby easing financial conditions and risking additional momentum in inflation. Having already had to resume rate hikes once, they won’t want a repeat. Elevated wage growth is the primary risk for inflation, but it is receding as job creation and vacancies slow.
South of the border, US data pointed to a gradual easing in activity and the labour market. Factory orders fell 3.6%mth, with weakness in both durable and non-durable goods. Weaker demand sets the stage for a continued cooling of the labour market. The job openings rate declined 0.3ppts in October while hiring and separation rates were broadly stable, in line with pre-pandemic levels. The official US employment report is out tonight; but, ahead of that release, the services ISM this week, and other business surveys previously, pointed to downside risks for employment from November.
Three Pillars of Yen’s Strength
The Japanese yen was the hero of the day on Thursday, adding over 1.7% against the dollar and 1.6% against the euro since the start of the day. The yen has been sided by Japan’s regional banks, which are rumoured to be lobbying for the abandonment of the yield targeting policy. On Thursday, USDJPY dipped below 145, and EURJPY fell under 156.
Simultaneously, markets are laying that Fed and ECB rates have reached a plateau, and the next step will be to lower them. The logical outcome of this divergence is an accelerated narrowing of yield spreads between Japanese government bonds and other major economies, which brings capital back into the yen.
Yen appreciation has been on a steady course since early November, a couple of weeks after the peak in US 10-year yields, when markets became convinced that their decline had become a trend.
Also, the yen may work the cautious mood of the stock markets in recent days. The yen is very often used as a funding currency to buy risky assets. The shift of market sentiment to profit-taking on major indices triggered a predictable deleveraging on the yen.
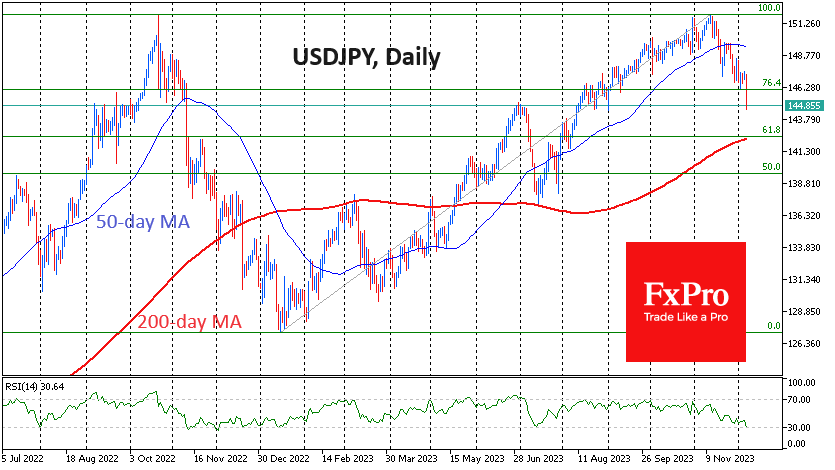
Technically, USDJPY formed a double top at 151.9, which was touched in October 2022 and November 2023. The most conservative approach suggests a final reversal signal only after a failure under the local low below 128, which took four months last time but may take two or three quarters.
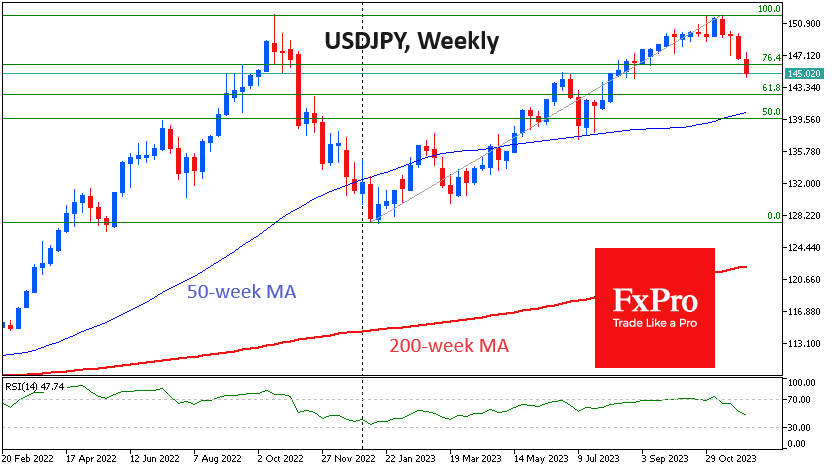
On lower – daily – timeframes, we can talk about the breaking of the uptrend if the USDJPY falls below 142.4. The 200-day moving average and the level of 61.8% of this year’s growth amplitude intersect here. A consolidation below will indicate the breakdown of the uptrend and open the way to 128. Still, we should be ready for a long tug-of-war and recharging of the JPY bulls on the approach to 143, as the pair will be significantly oversold by RSI even on weekly charts. At the same time, an oversold exit on daily timeframes is likely to be just a reason for local stops in the declines, just as it was in the yen strengthening cycle a year ago.
EURCHF Wave Analysis
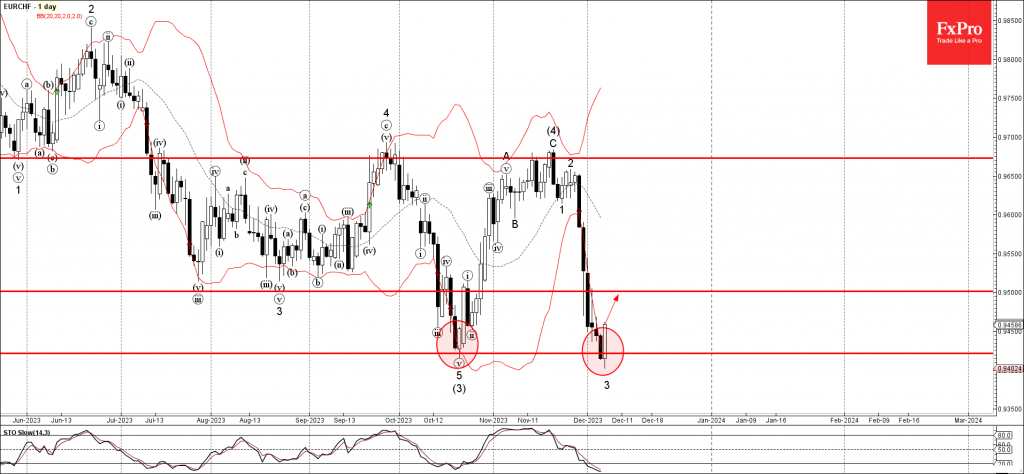
- EURCHF reversed from support level 0.9420
- Likely to rise to resistance level 0.9500
EURCHF recently reversed from the strong support level 0.9420, which stopped the previous strong downtrend in the middle of October.
The upward reversal from the support level 0.9420 is likely to form today the Bullish Engulfing – strong buy signal for this currency pair.
Given the strength of the support level 0.9420 and the oversold daily Stochastic, EURCHF can be expected to rise further to the next resistance level 0.9500.
CADJPY Wave Analysis
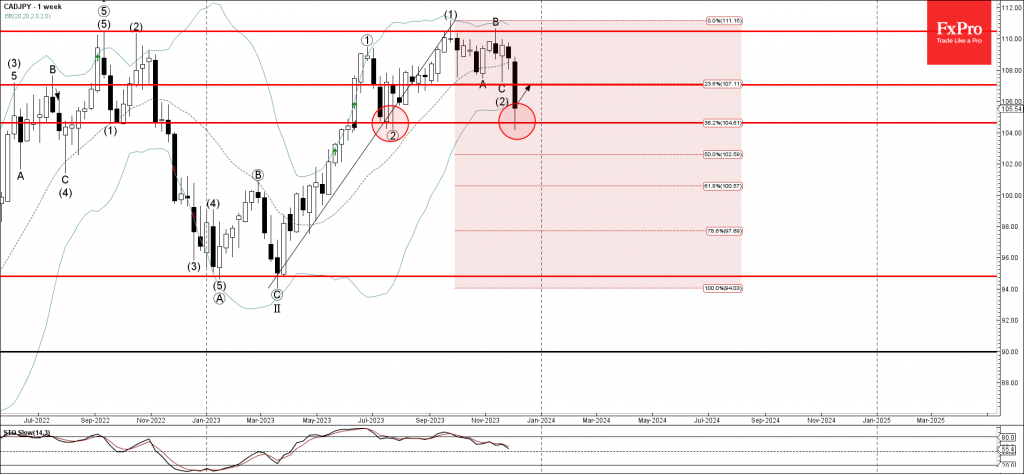
- CADJPY reversed from support level 104.60
- Likely to rise to resistance level 107.00
CADJPY rising strongly after the price reversed up from the key support level 104.60, which reversed the price twice in July.
The support level 104.60 was strengthened by the 38.2% Fibonacci correction of the upward impulse from March.
Given the strength of the support level 104.60 and the clear daily uptrend, CADJPY can be expected to rise further to the next resistance level 107.00.
Sunset Market Commentary
Markets
A fairly thin eco calendar and blackout-periods for major central bankers made this morning’s Japanese moves the main talking point. Comments by deputy governor Himino and governor Ueda suggest a sense of urgency within the BoJ to normalize policy rates before the window of opportunity closes. November Tokyo inflation figures suggest a faster return to the 2% inflation target while markets on a global level are betting on H1 2024 pivot points in monetary policy. It kind of resembles efforts by the Swedish Riksbank in late 2018-2019 (when Fed rates already peaked at 2.5% coming from the zero border) to get rid of negative interest rates even as the growth momentum window was rapidly closing. In hindsight, the ECB missed out on that opportunity. Japanese officials seem to replace the question “should we end our negative interest rate policy” by “when should we end it and how far can we take it?” The timing of the Himino/Ueda comments is peculiar as well given that the Japanese yen finally got some breathing space over the past month as global core bond yields fell significantly. We always figured that a final swoon in JPY would eventually force the BoJ’s hand at gunpoint. Now all of sudden, it’s the BoJ December policy meeting which might have the biggest market impact instead of the Fed, ECB or BoE. A flopped 30-yr Japanese bond auction this morning proves that investors all of a sudden are on red alert. Japanese bond yields closed 6 bps (2-yr) to 11.9 bps (10-yr) higher. The Japanese yen rallied from 147.31 to currently 145, falling out of this year’s upward trend channel and testing the end of August/early September lows at 144.45/54. EUR/JPY declines from 158.60 to 156.30 with first important support looming around 155.
US weekly jobless claims served as distraction today between US JOLTS & non-manufacturing ISM on Tuesday, ADP employment change yesterday and finally payrolls tomorrow. Claims printed… bang in line with consensus (220k). The sharp uptrend in continuing claims however came to an unexpected and abrupt end, declining from 1925k (highest since end of November 2021) to 1861k (vs 1910k forecast). Markets ignored the release with US Treasuries and UK Gilts following the Japanese drift south (to a lesser extent) and Bunds trading more or less flat. EUR/USD is some technically insignificant ticks higher at 1.0780 as is EUR/GBP at 0.8575. Stock markets marginally lose ground.
The Belgian Debt Agency announced its 2024 borrowing requirements today. The gross requirement is almost €53bn, mainly compelling a net financing need of €21.5bn and redemptions of slightly over €29bn. The OLO funding need is estimated at €41bn, down from €44.82bn this year. News & Views
The Swiss franc briefly touched the strongest level since the Swiss National Bank ditched a currency cap in 2015. EUR/CHF hit an intraday low of 0.94, moving just south of the previous multiyear low seen in September 2022. It then pared losses in a technically inspired rebound back to 0.944. The Swiss franc is profiting from euro area bond yields having declined dramatically over the recent weeks on rising bets for quick ECB rate cuts, potentially as soon as March 2024. A first, full cut by the Swiss National Bank isn’t priced in before June 2024. This discrepancy comes even as Swiss inflation (1.4%) is considerably lower than in the euro area (2.4%). It are the SNB’s strong (hawkish) credentials that prevent markets from running ahead of themselves in ways similar to the Fed and ECB. The central bank’s credible readiness to intervene in FX markets serves as a backstop that markets aren’t willing to test.
World’s biggest job site Indeed said that the UK’s labour market remains tight, despite a fall in job postings over the course of 2023 and broader weakness in the economy. Indeed said that there are still 10% more job postings at the start of December than before the Covid-19 pandemic. While that has shrunk from the 48% at the start of December 2022, it still suggests ongoing resilience with the imbalance of labour demand and supply only gradually easing, the platform’s economist Jack Kennedy said. The labour market is a key variable in the Bank of England’s inflation judgement. Wage growth in particular is considered a critical component to the notoriously more sticky services inflation. Advertised salaries in the UK on the Indeed website were 7% higher in the three months to end October. This compares to 4.2% in the US and 3.8% in the euro area.