

Sample Category Title
NIKKEI Analysis: Japanese Stock Market Outlook
In the first half of 2023, the Japanese stock market was dominated by bullish sentiment due to (still) negative interest rates — while the rest of the G7 countries raised their rates to combat inflation.
The NIKKEI-225 index grew by 30% in the first half of the year. But then the balance of supply and demand was achieved, judging by the daily chart, where a range was formed (shown in blue), framing the index’s fluctuations in the second half of the year. Judging by the change in the slope of the bullish trend lines, demand was sufficient to maintain the price at the lower limit of the range, but not enough to go beyond the upper limit.
The situation is fundamentally reversed. While interest rates in the US, Europe and elsewhere are thought to be near the top, there is growing talk in Japan that the central bank will begin raising them after years of being stuck in negative territory:
→ Bloomberg: The next meeting of the Bank of Japan will be held on December 19 – speculation is growing that the Bank will move away from negative interest rates as early as this month.
→ Reuters: 22 of 26 economists (85%) surveyed in November believe the Bank of Japan will abandon its negative interest rate policy by the end of next year.
The winding down of ultra-loose monetary policy could have a negative impact on the growth of Japanese companies - accordingly, the growing bearish sentiment is reflected in the index quote. Since the end of November, the NIKKEI 225 has dropped almost 5%.
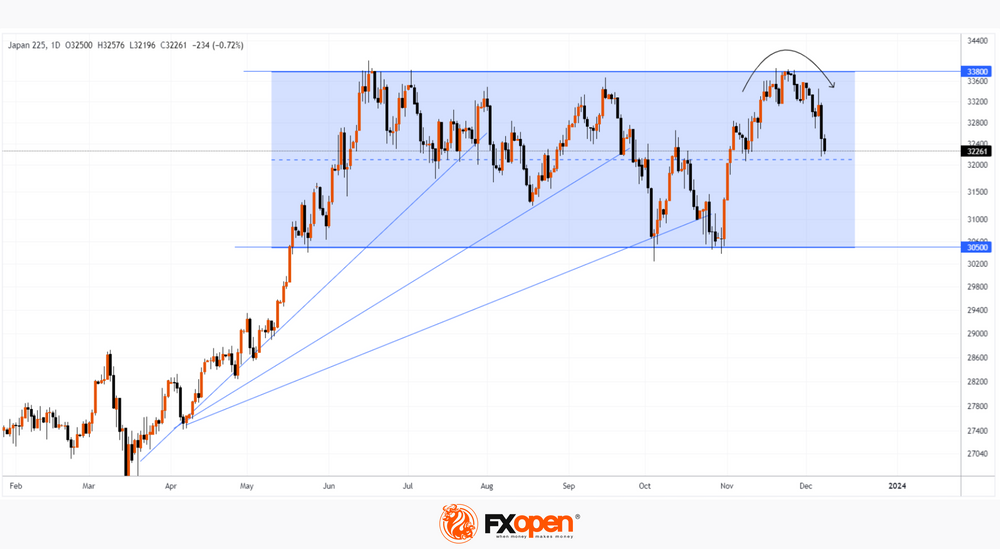
The chart shows that the November top:
→ did not exceed the annual maximum set in June;
→ only slightly exceeded the September high – in fact, a false breakout;
→ the price forms a rounding (shown by an arrow) - a sign of gradual depletion of demand, which is replaced by the dominance of supply.
It is possible that the bears, which are gaining power, will be able to form a breakdown of the median line of the blue channel as early as December.
This article represents the opinion of the Companies operating under the FXOpen brand only. It is not to be construed as an offer, solicitation, or recommendation with respect to products and services provided by the Companies operating under the FXOpen brand, nor is it to be considered financial advice.
GBP/JPY Daily Outlook
Daily Pivots: (S1) 178.41; (P) 181.75; (R1) 184.88; More...
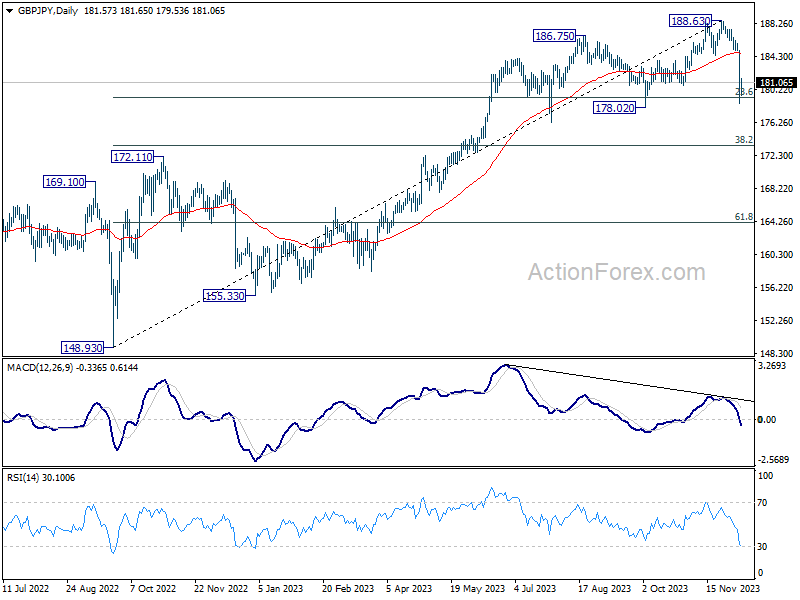
GBP/JPY's fall from 188.63 extended to as low as 178.58, and breached 23.6% retracement of 148.93 to 188.63 at 179.26 briefly. There is no sign of bottoming yet and intraday bias stays on the downside. Sustained trading below 179.26 will pave the way to 38.2% retracement at 173.46 next. On the upside, above 182.65 minor resistance will turn intraday bias neutral and bring consolidations first, before staging another fall.
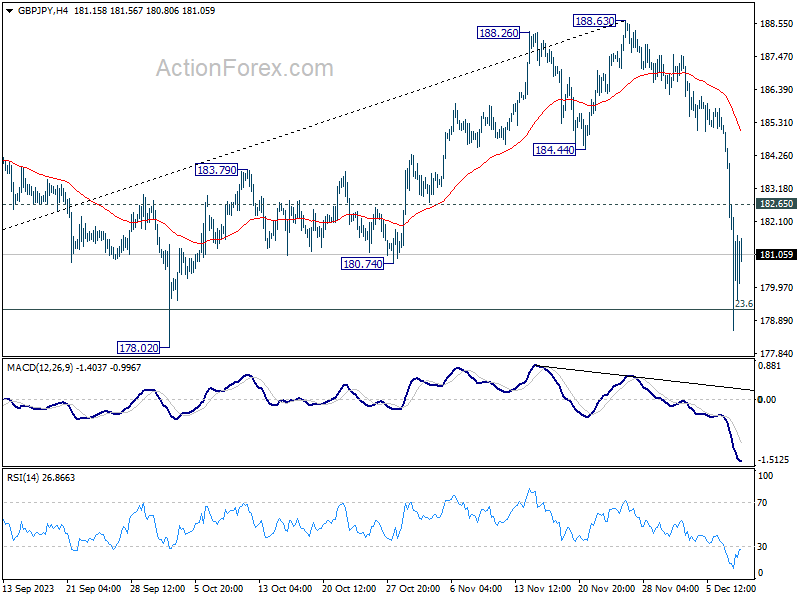
In the bigger picture, while a medium term top is in place at 188.63, there is no clear sign of long term bearish trend reversal yet. As long as 55 W EMA (now at 175.67) holds, price actions from 188.63 are seen as a corrective move only. Larger up trend from 123.94 (2022 low) could resume at a later stage.
EUR/JPY Daily Outlook
Daily Pivots: (S1) 152.94; (P) 155.85; (R1) 158.48; More..
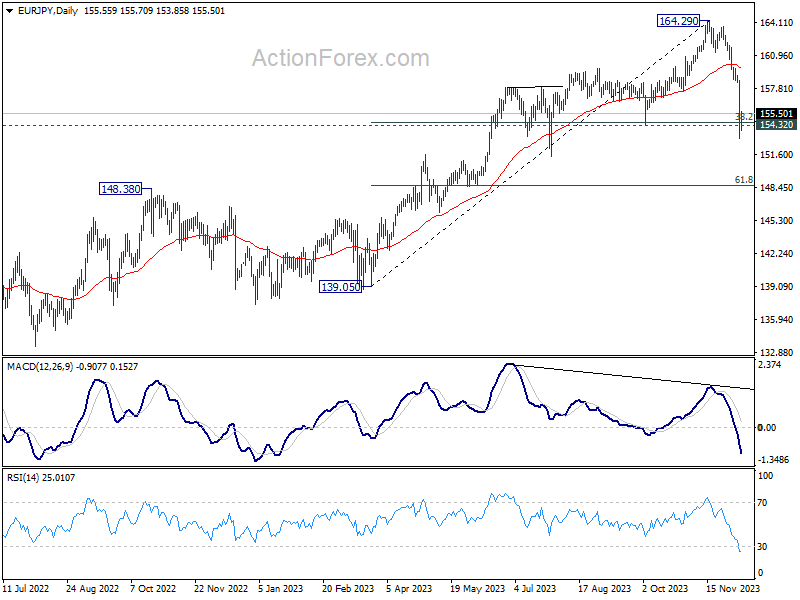
EUR/JPY's fall from 164.29 extended to as low as 153.15 and breached 154.32 cluster support (38.2% retracement of 139.05 to 164.29 at 154.64). There is no clear sign of bottoming yet and intraday bias stays on the downside. Sustained trading below 154.32 will target 61.8% retracement at 148.69 next. On the upside, above 156.42 minor resistance will turn intraday bias neutral and bring consolidations first, before staging another decline.
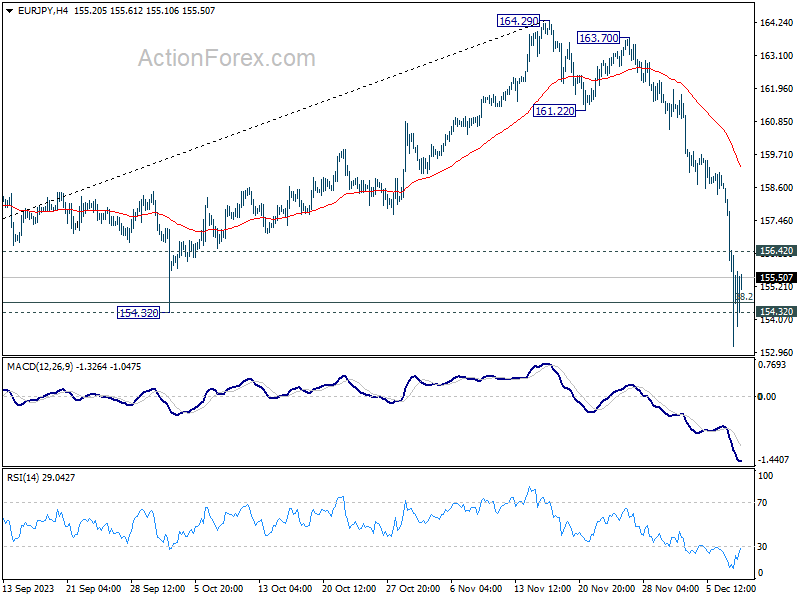
In the bigger picture, bearish divergence condition in 55 D EMA indicates that a medium term top was e formed at 164.29 already. Price actions from there are tentatively seen as a correction only. There is no clear sign that the up trend from 144.42 (2020 low) has completed yet. As long as 55 W EMA (now at 152.12) holds, another rally through 164.29 is still in favor as a later stage.
EUR/GBP Daily Outlook
Daily Pivots: (S1) 0.8556; (P) 0.8570; (R1) 0.8585; More....
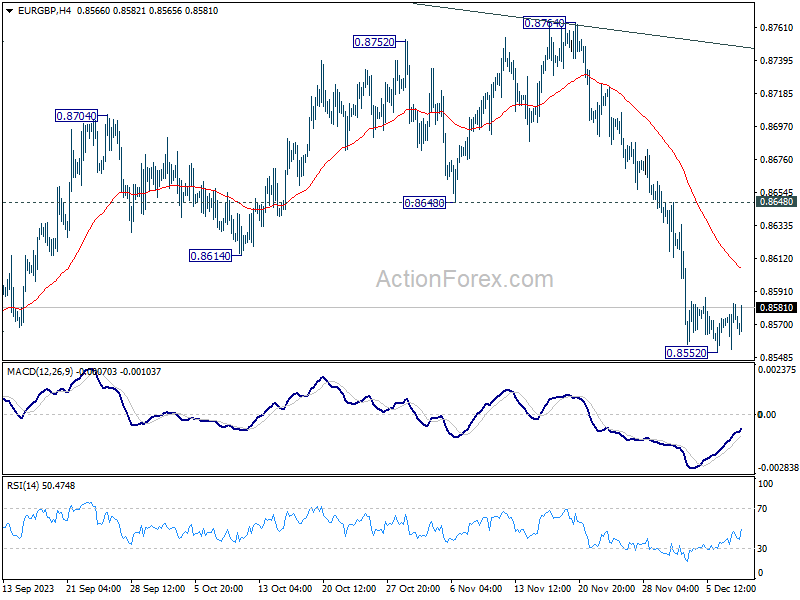
Intraday bias in EUR/GBP is turned neutral as a temporary low is formed at 0.8552. Some consolidations could be seen and stronger recovery cannot be ruled out. But upside should be limited by 0.8648 support turned resistance to bring another fall. Below 0.8552 will target 0.8491 low first. Firm break there will resume larger down trend.
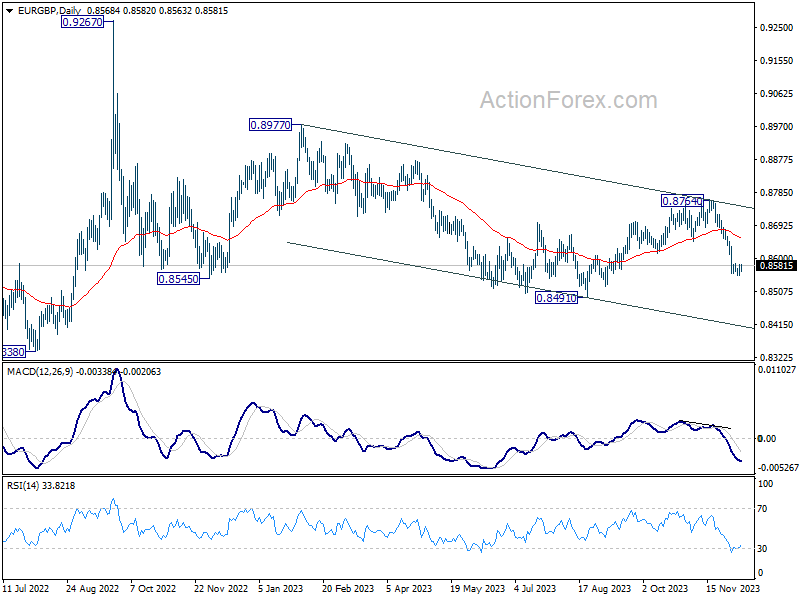
In the bigger picture, current development suggests that down trend from 0.9267 (2022 high) is still in progress. This decline is now seen as the third leg of the pattern from 0.9499 (2020 high). Break of 0.8201 will target 100% projection of 0.9499 to 0.8201 from 0.9267 at 0.7969. In any case, outlook will stay bearish as long as 0.8764 resistance holds.
EUR/AUD Daily Outlook
Daily Pivots: (S1) 1.6295; (P) 1.6392; (R1) 1.6446; More...
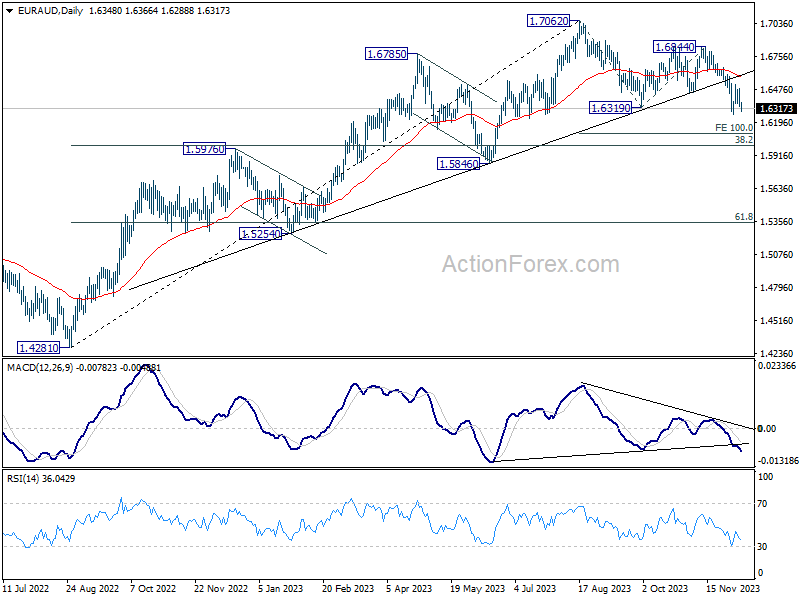
EUR/AUD falls sharply after rejection by 55 4H EMA, but stays above 1.6267 low. Intraday bias remains neutral first and outlook remains bearish. On the downside, break of 1.6267 will resume larger decline from 1.7062 to 100% projection of 1.7062 to 1.6319 from 1.6844 at 1.6106 next. However, break of 1.6515 resistance will turn bias back to the upside for stronger rebound.

In the bigger picture, the break of medium term trend line support now suggests fall from 1.7062 correcting the whole up trend from 1.4281 (2022 low). Deeper decline would be seen to 38.2% retracement of 1.4281 to 1.7062 at 1.6000. Strong support could be seen there to bring rebound on first attempt. But risk will stay on the downside as long as 1.6844 resistance holds. Sustained break of 1.6000 would bring further fall to 61.8% retracement at 1.5343.
EUR/CHF Daily Outlook
Daily Pivots: (S1) 0.9413; (P) 0.9438; (R1) 0.9471; More...
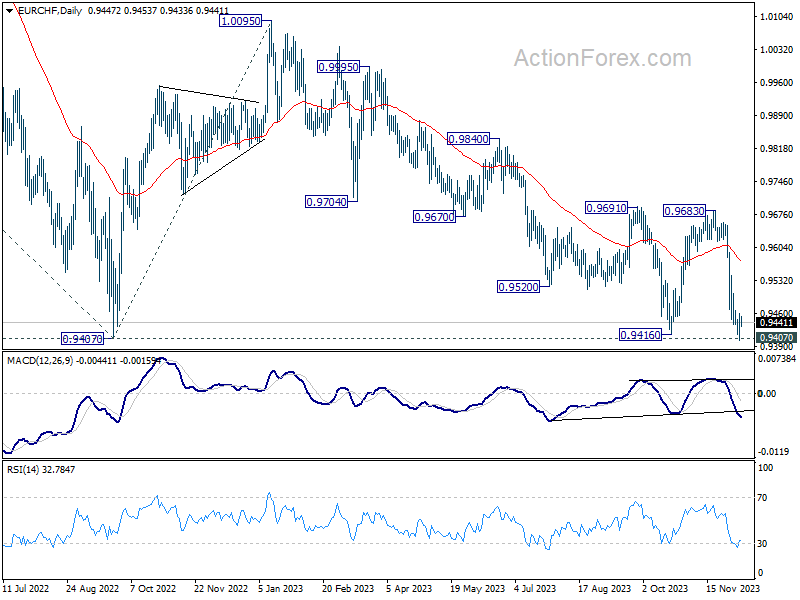
EUR/CHF recovered after breaching 0.9407 low briefly and intraday bias is turned neutral. Some consolidations would be seen but further fall is expected as long as 0.9543 resistance holds. Decisive break of 0.9407 will resume larger down trend.
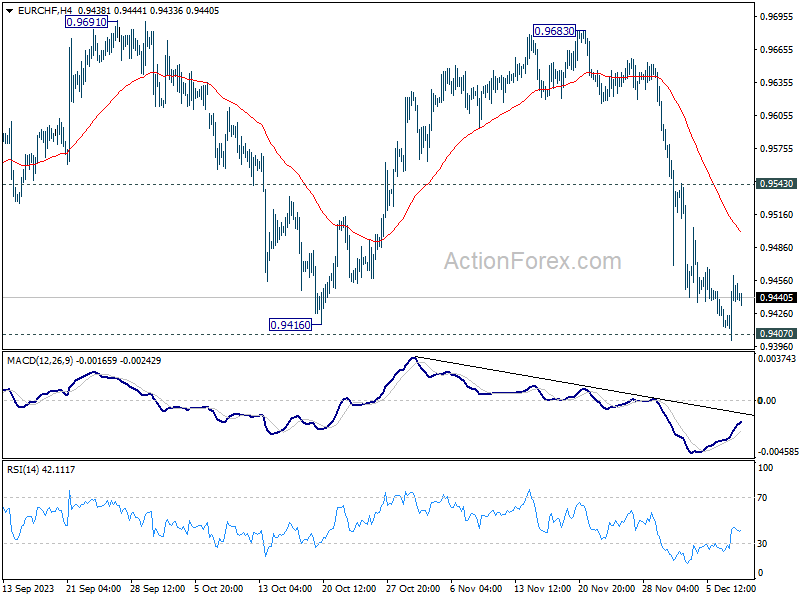
In the bigger picture, medium term outlook remains bearish as long as 0.9683 resistance holds. Firm break of 0.9407 (2022 low) will resume long term down trend. Next target will be 61.8% projection of 1.1149 to 0.9407 from 1.0095 at 0.9018.
Japanese Yen Stays Top of Mind
Markets
The Japanese yen stays top of mind. BoJ deputy governor Himino and his boss Ueda triggered a scorching rally amid rising bets of an imminent (December 19) policy shift. USD/JPY fell from an open at 147.31 to an intraday low of 141.71. The pair eventually closed at 144.13 with strong support from the 200dMA (142.33) and the 38.2% retracement (142.48) on the 2023 advance for the time being a too tough nut to crack. JPY’s advance against the euro was equally impressive. The same technical references (resp. 154 and 154.4) came to the rescue, allowing EUR/JPY to pare 5.5 yen losses to 3 yen with a close at 155.58. JPY had a lot of momentum at the start of Tokyo dealings this morning but the rally again bumped into the above mentioned resistance levels. Both USD/JPY and EUR/JPY trade a tad weaker than yesterday’s close nonetheless. Japanese bond yields add another 5.7 bps at the long end of the curve. The 10-y tried but failed to take out the 0.80% barrier. Core markets yesterday were uninspired. German yields whipsawed with minor changes on a net daily basis. US yields added a few bps at the long end. Support for the 10-y yield between 4.09% and 4.13% survived as a result. The US dollar caught a breather after its recent advance. The trade-weighted index dropped from 104.2 to 103.54. EUR/USD recovered from 1.0764 to 1.0794. European stocks marched gradually lower after the likes of the DAX hit a new record high earlier this week and the EuroStox50 hit a new YtD high intraday on Wednesday. US equities printed higher though, with the Nasdaq (+1.37%) outperforming.
This week’s eco calendar culminates into today’s payrolls report (and a lesser extend Michigan consumer confidence). Together with next week’s November CPI it’s the final important input to the Fed December 13 policy meeting. Consensus expects job growth of 183k with the “unofficial” (whisper) number at a lower 169k. The unemployment rate is seen stabilizing at 3.9% with wage growth just a tad lower at 4%. Recent market positioning was incredible but we are wary to call the end of it ahead of important data such as today’s. In terms of rate cut pricing, in theory there’s still some room left for a kick-off in March (two in three probability discounted). While obviously not our preferred scenario, disappointing payrolls could further cement the idea. Both the US 2-y and 10-y yield are at critical technical support zones. The former breaking sub 4.60% sustainably offers perspective for a 20 bps move further down. The 4.09/4.13% area has to hold in the 10-y to prevent a fast return sub 4%.
News & Views
The Reserve Bank of India today left its policy rate at 6.50%. The decision was largely expected. The committee maintained a policy focus on ‘withdrawal of accommodation to ensure that inflation progressively aligns to the target, while supporting growth’. Since the previous policy meeting, headline inflation cooled to 4.9% in October from 7.4% in July and the moderation was observed in all components of CPI. However, the MPC sees upside risks to food price inflation in the coming months. Economy activity was buoyant in Q2 (7.6% Y/Y) due to strong domestic demand. The bank upwardly revised its growth forecast for the 2023-24 fiscal year to 7.0% from 6.5%. It sees growth at 6.4% in Q3 2024-25. CPI inflation is expected at 5.4% for 2024-25 and is projected to slow to between 4.0% and 5.2% in the first three quarters of 2024-25. The RBI concludes that the target of 4.0% is yet to be reached and that it has to stay course, suggesting that rates still might stay at current levels for some meetings to come. The Indian rupee is trading little change near USD/INR 83.7, holding near historic low levels against the US dollar.
The final reading of the Japan Q3 GDP brought an unexpected negative surprise as growth was substantially downwardly revised from a contraction of -0.5% Q/Q to -0.7%. The revision was mainly due to a downgrade of private consumption (-0.2% Q/Q from unchanged). Inventories also contributed more negatively than expected and business spending contracted (-0.4% Q/Q). The contribution of net exports was maintained at a -0.1 ppt. The Q3 contraction was the biggest since the pandemic and might complicate the debate on starting BoJ policy normalization in the near term. On the flipside, October labour cash earnings printed stronger than expected at 1.5% Y/Y. However, real earnings remain negative (-2.3%). Households spending in October also was less negative than feared (-2.5% Y/Y vs -2.9% expected). The BoJ meets on December 19.
USD/JPY Technical: Potential Counter-trend Rebound Within Medium-Term Downtrend
- Recent bizarre hawkish rhetoric from BoJ top officials ahead of Japan’s 2024 nationwide spring wage negotiations sparked a further rally in JPY.
- Increasing expectations of a BoJ pivot to scrap its decade-long plus of short-term negative interest rate policy to come as early as this month, 19 December monetary policy meeting.
- The interest rates swap market has priced in a 45% chance of removal of negative interest rate on 19 December, a jump from the 3.5% chance seen earlier this week.
- USD/JPY reached oversold condition as it tested the key 200-day moving average acting as a support now at 141.85/60.
The price actions of the USD/JPY have plummeted and broken below 144.80 short-term support as highlighted in our previous report, which printed an intraday low of 141.62 in yesterday’s (7 December) US session.
JPY’s swift rally against the USD is an outlier
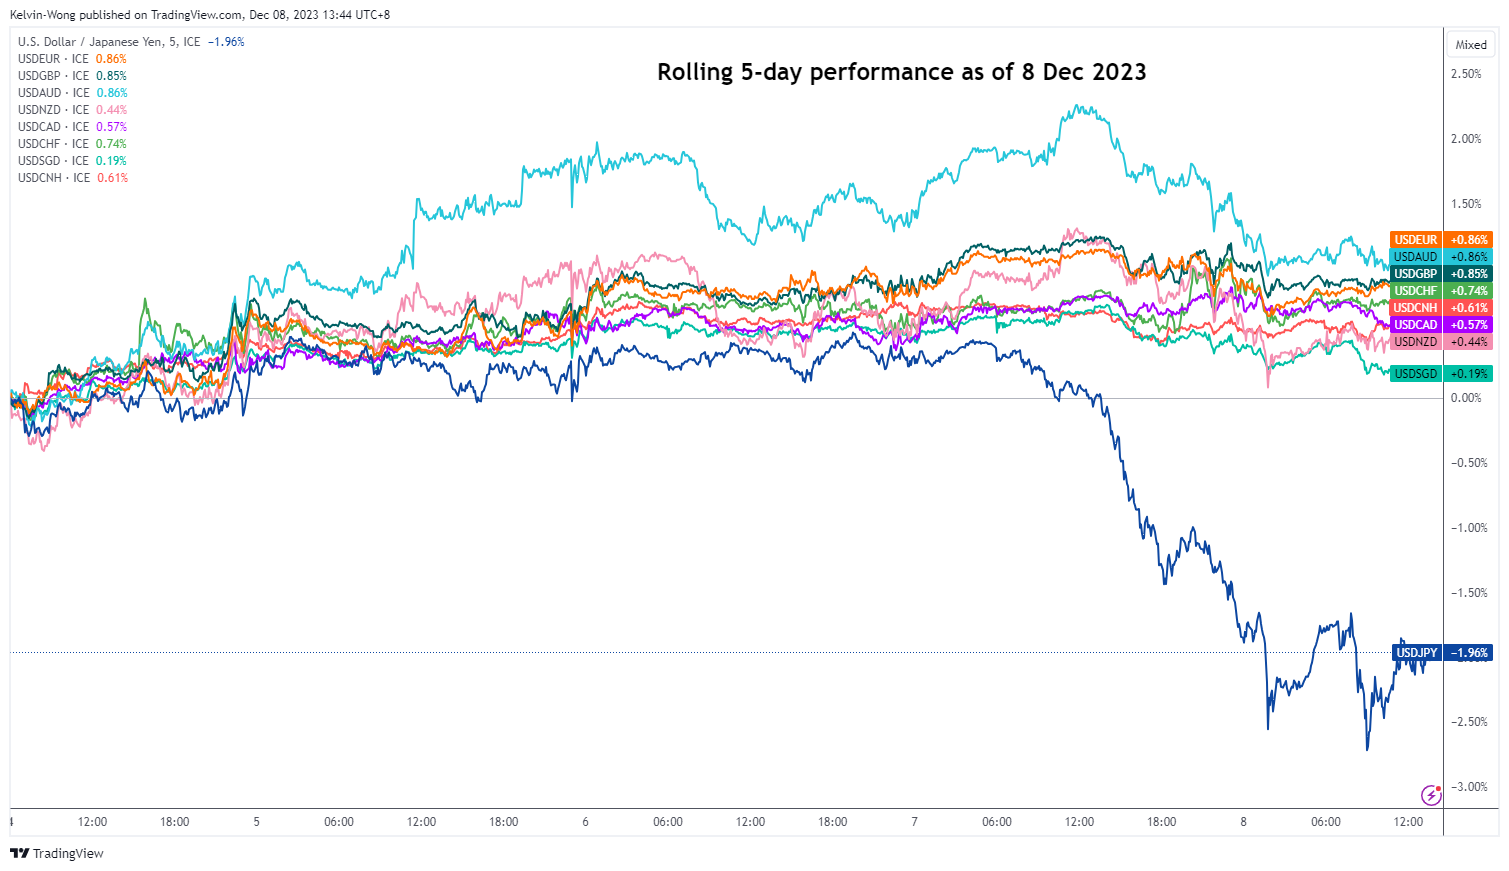
Fig 1: US dollar performance against major currencies as of 8 Dec 2023 (Source: Reuters, click to enlarge chart)
Yesterday’s swift tumble seen in the USD/JPY has made it an outlier in terms of its five-day rolling performance (see Fig 1) against other major US dollar pairs; the USD was the weakest against the JPY and USD/JPY recorded a daily loss of -2.14% yesterday, the steepest single-day decline since 12 January 2023.
The primary driver of this current bout of JPY strength has been attributed to the Bank of Japan’s (BoJ) key officials’ bizarre change of monetary policy rhetoric from a conservative “wait and see” approach to a slight “outlandish hawkish” guidance before the outcome of next year nationwide spring wage negotiations. As BoJ Governor Ueda has repeatedly stressed he needs to see a sustainable trend of wage increases to back demand-driven price increases in goods and services before BoJ can consider its options to exit the current decade-long plus of short-term negative interest rate policy.
Bizarre hawkish rhetoric from BoJ top officials ahead of Fed FOMC
Yesterday, BoJ Governor Ueda made a reply in parliament that BoJ would face a more challenging situation at the year-end and the start of 2024, citing that it had several options at hand on which interest rates to target once it moved short-term interest rates up from its current negative territory.
In addition, BoJ Deputy Governor Himino highlighted in his public speech yesterday that an exit from its current ultra-loose monetary policy would benefit the Japanese economy.
Therefore, the latest unusual hawkish rhetoric from BoJ’s top two officials ahead of the Fed’s monetary policy meeting and the release of its latest dot plot on 13 December have sounded the alarm bell that BoJ may start to pivot away from its short-term negative interest rate policy sooner than expected.
The interest rates swap market has indicated a significant jump in expectations of an approximate 45% chance that BoJ would end its negative interest rate policy on the 19 December monetary policy from just a mere chance of 3.5% before BoJ’s Ueda and Himino’s remarks.
Tested 200-day moving average with oversold conditions
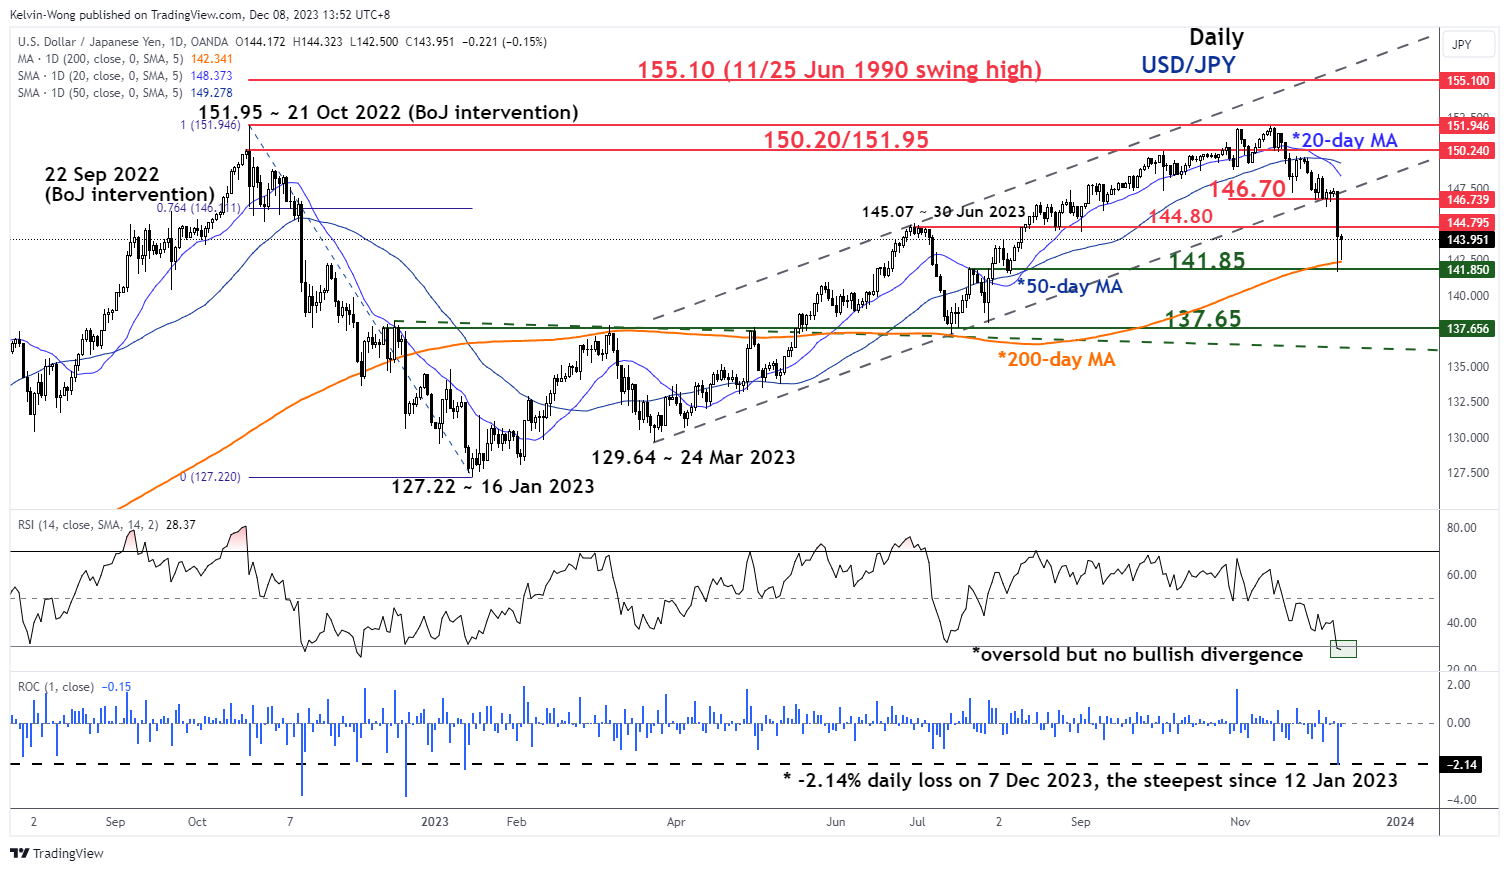
Fig 2: USD/JPY medium-term trend as of 8 Dec 2023 (Source: TradingView, click to enlarge chart)
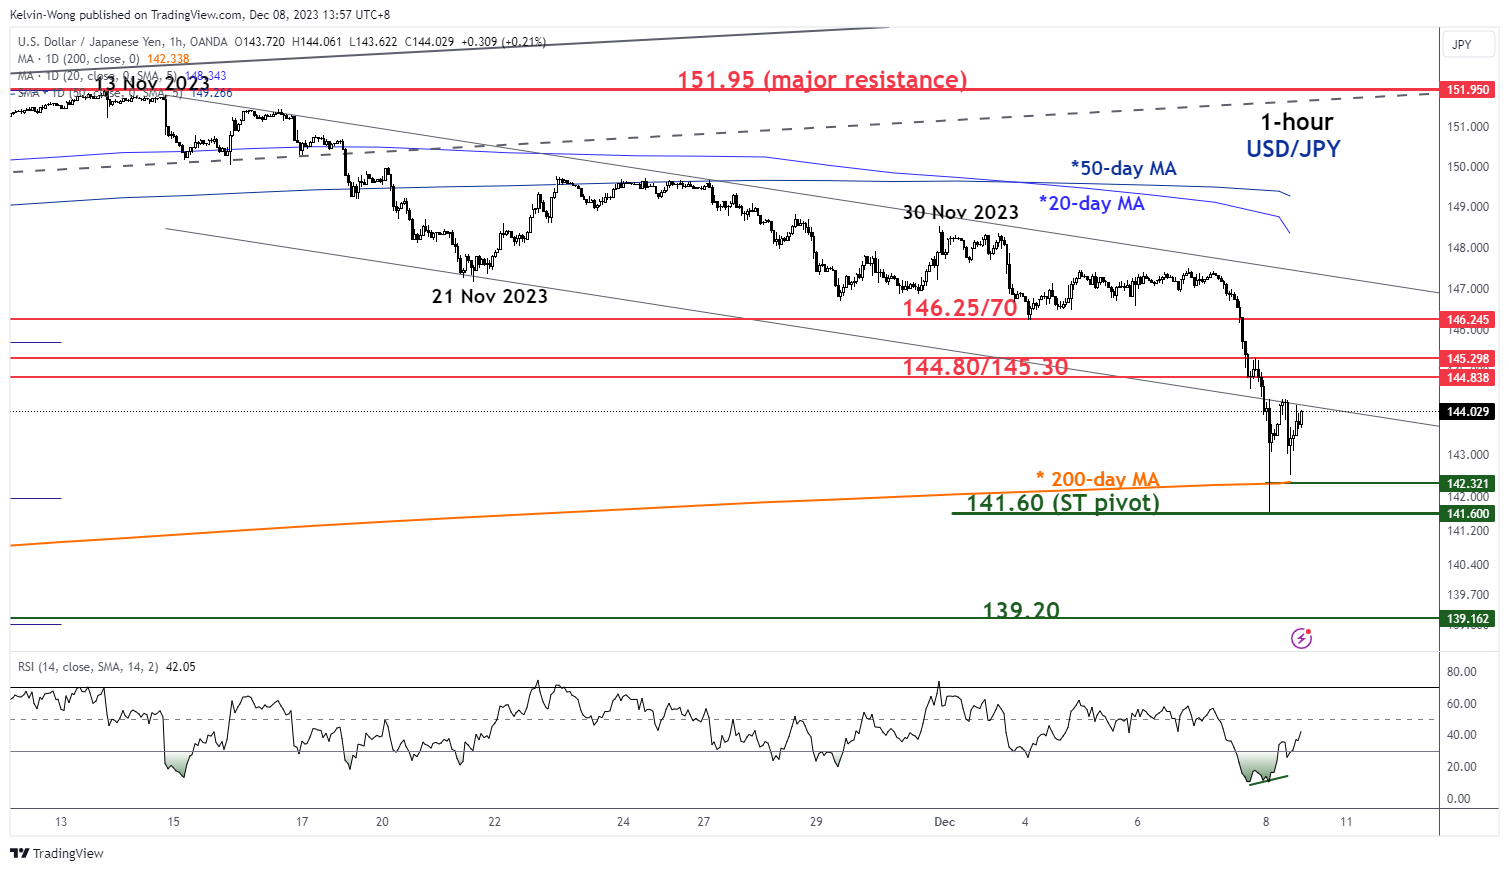
Fig 3: USD/JPY minor short-term trend as of 8 Dec 2023 (Source: TradingView, click to enlarge chart)
The break breakdown of the medium-term ascending channel support at 146.20/145.90 in place since the 24 March 2023 low has increased the odds that the short-term downtrend phase of the USD/JPY that kickstarted on 13 November 2023 has morphed into a potential medium-term downtrend phase.
In technical analysis speak, prices do not move in a vertical direction but instead oscillate within their trend phases that can evolve into counter-trend movements.
The swift intraday decline seen in USD/JPY has led it to retest the key 200-day moving average now acting as a support at 141.85/60
In addition, the daily RSI momentum indicator has reached an oversold condition while the shorter-term hourly RSI has flashed out a bullish divergence condition at its oversold region. These observations suggest that the current short-term impulsive down move from the 30 November 2013 minor swing high of 148.52 has hit an overextended condition where a potential minor counter-trend rebound may occur at this juncture within its ongoing medium-term downtrend.
Watch the 141.60 key short-term pivotal support with the intermediate short-term resistance zone coming in at 144.80/145.30 and 146.25/70 further out next if 145.30 surpasses.
However, a breakdown below 141.60 resumes the bearish tone to expose the next intermediate support at 139.20 (swing low area of 27/28 July 2023 & close to 50% Fibonacci retracement of the former medium-term uptrend phase from 16 January 2023 low to 13 November 2023 high).
Nikkei Futures (NKD_F) Reached Support Area
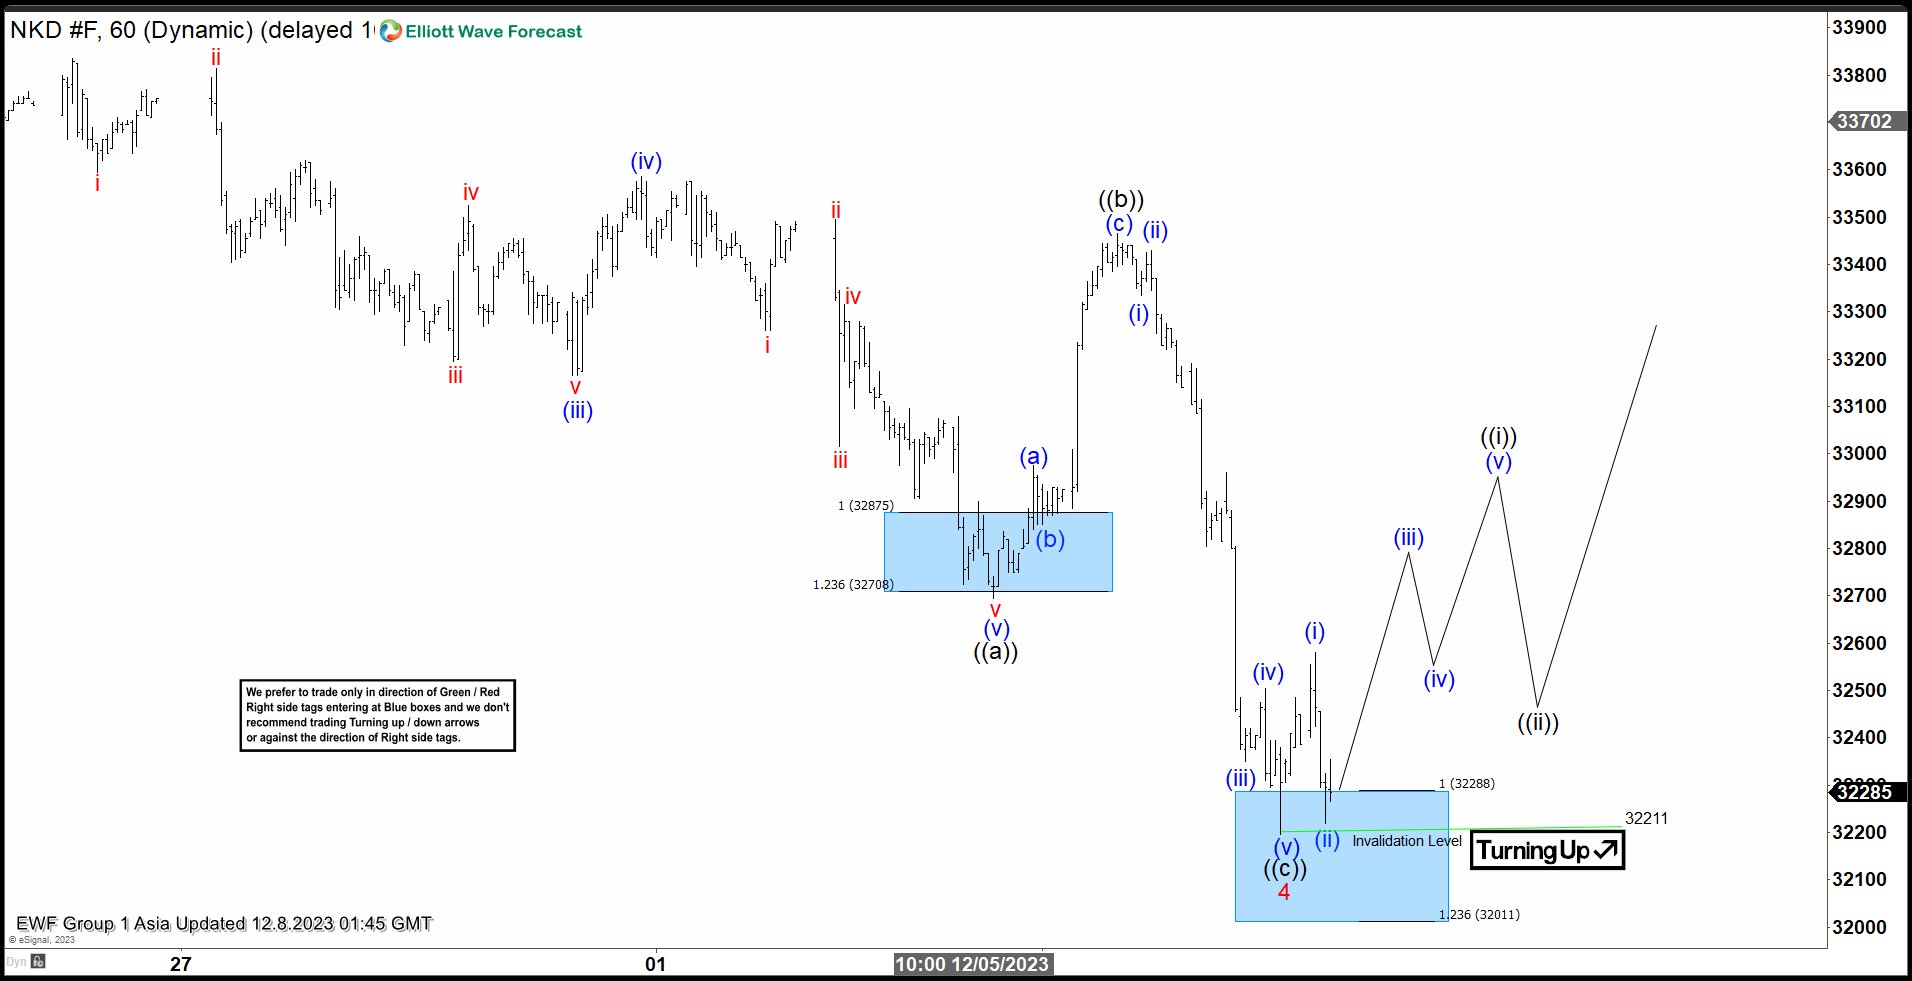
Cycle from 10.4.2023 low in Nikkei Futures (NKD) is in progress as a 5 waves Elliott Wave diagonal. Up from 10.4.2023 low, wave 1 ended at 32690 and pullback in wave 2 ended at 30405. The Index extended higher in wave 3 towards 33870. Wave 4 ended as a zigzag structure. Down from wave 3, wave (i) ended at 33200 and rally in wave (ii) ended at 33835. Index extended lower again in wave (iii) towards 33195 and wave (iv) ended at 33585. Wave (v) lower ended at 32695 which completed wave ((a)).
Corrective rally in wave ((b)) unfolded as a zigzag structure. Up from wave ((a)), wave (a) ended at 32975 and pullback in wave (b) ended at 32850. Final leg wave (c) ended at 33465 which completed wave ((b)). The Index then extended lower in wave ((c)) as a 5 waves impulse. Down from wave ((b)), wave (i) ended at 33335 and wave (ii) ended at 33430. Wave (iii) lower ended at 32350 and wave (iv) ended at 32505. Final leg wave (v) ended at 32211 which completed wave ((c)) of 4. Wave 5 higher is currently in progress. As far as pivot at 32211 low stays intact, expect the Index to extend higher. Break below 32211 from here suggests the Index is still in the process of ending wave 4.
Nikkei Futures (NKD) 60 Minutes Elliott Wave Chart
NKD_F Elliott Wave Video
https://www.youtube.com/watch?v=yfhas70y-GM
USD/JPY Tumbles, Upsides Could Be Capped
Key Highlights
- USD/JPY started a major decline below the 146.20 support.
- A major bearish trend line is forming with resistance near 146.20 on the 4-hour chart.
- EUR/USD is consolidating near the 1.0765 support zone.
- The US nonfarm payrolls could increase from 150K to 180K in Nov 2023.
USD/JPY Technical Analysis
The US Dollar started a major decline from the 150.00 resistance zone against the Japanese Yen. USD/JPY declined below the 148.20 and 147.50 levels to move into a bearish zone.

Looking at the 4-hour chart, the pair settled below the 146.20 pivot level, the 100 simple moving average (red, 4 hours), and the 200 simple moving average (green, 4 hours).
There was a move below the 145.00 support and the pair traded as low as 141.63. It is now attempting a recovery wave above the 143.00 level. On the upside, immediate resistance is near the 144.50 level. It is close to the 50% Fib retracement level of the downward move from the 147.50 swing high to the 141.63 low.
The next key resistance is near the 145.50 level. The main resistance is near the trend line and 146.20. A close above the 146.20 zone could open the doors for more upsides. The next stop for the bulls might be 147.50.
On the downside, the pair might find support near the 143.00 level. The next key support is near 142.20, below which the pair might accelerate lower toward 141.20 in the near term. Any more losses might call for a move toward 140.00.
Looking at EUR/USD, the pair is showing a few bearish signs, but the bulls are attempting to protect the 1.0765 support zone.
Economic Releases
- US nonfarm payrolls for Nov 2023 – Forecast 180K, versus 150K previous.
- US Unemployment Rate for Nov 2023 - Forecast 3.9%, versus 3.9% previous.