Sample Category Title
EUR/USD Mid-Day Outlook
Daily Pivots: (S1) 1.0747; (P) 1.0776; (R1) 1.0792; More...
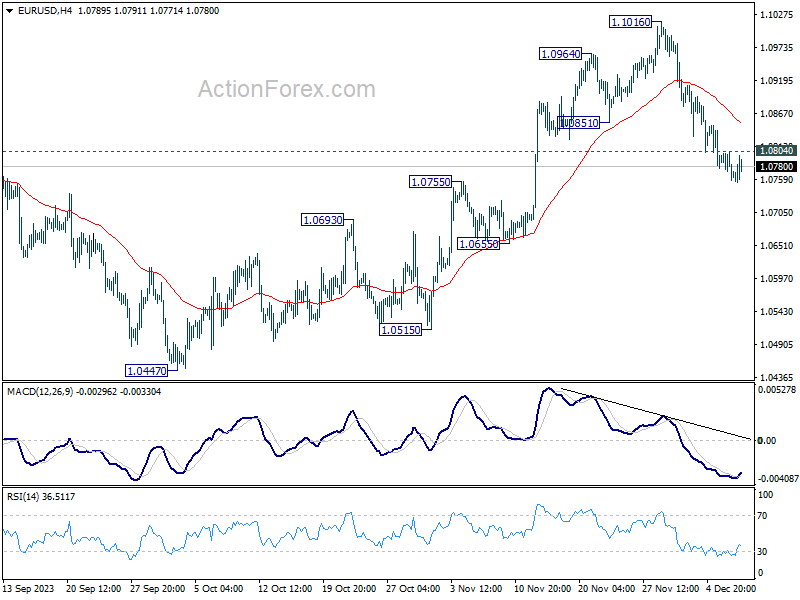
Intraday bias in EUR/USD remains mildly on the downside for the moment. Sustained break of 55 D EMA (now at 1.0770) will extend the fall from 1.1016 short term top to retest 1.0447 support. On the upside, above 1.0804 minor resistance will turn intraday bias neutral first. But risk will stay on the downside as long as 1.1016 resistance holds, in case of recovery.
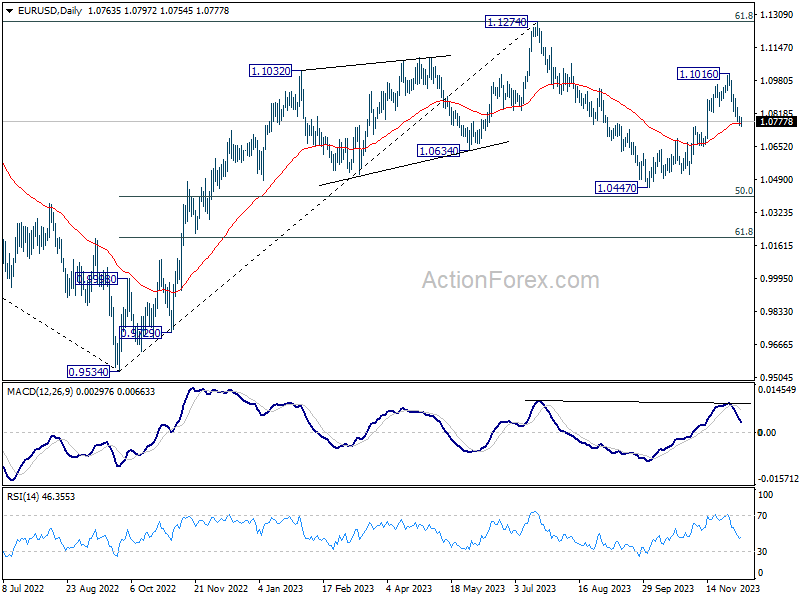
In the bigger picture, price actions from 1.1274 are viewed as a corrective pattern to rise from 0.9534 (2022 low). Rise from 1.0447 is tentatively seen as the second leg. Hence while further rally could be seen, upside should be limited by 1.1274 to bring the third leg of the pattern. Meanwhile, sustained break of 55 D EMA will argue that the third leg has already started for 1.0447 and below.
GBP/USD Mid-Day Outlook
Daily Pivots: (S1) 1.2536; (P) 1.2575; (R1) 1.2598; More...
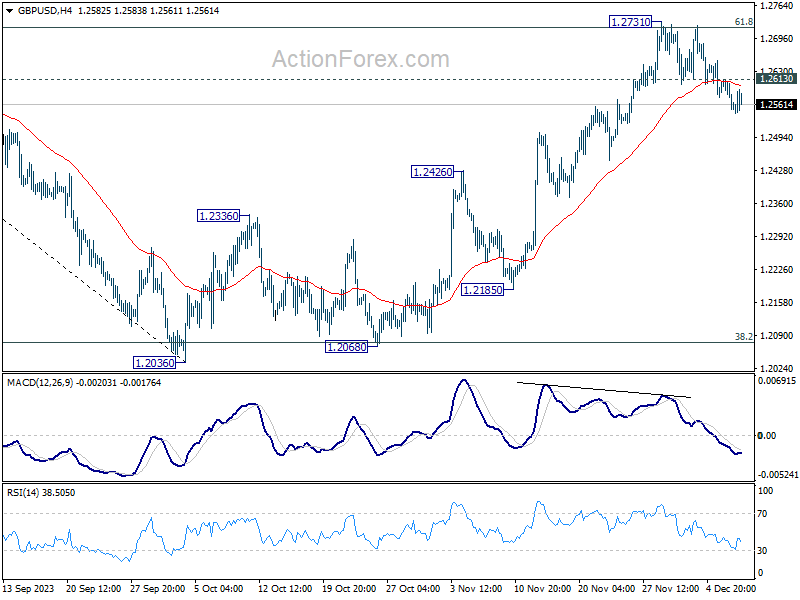
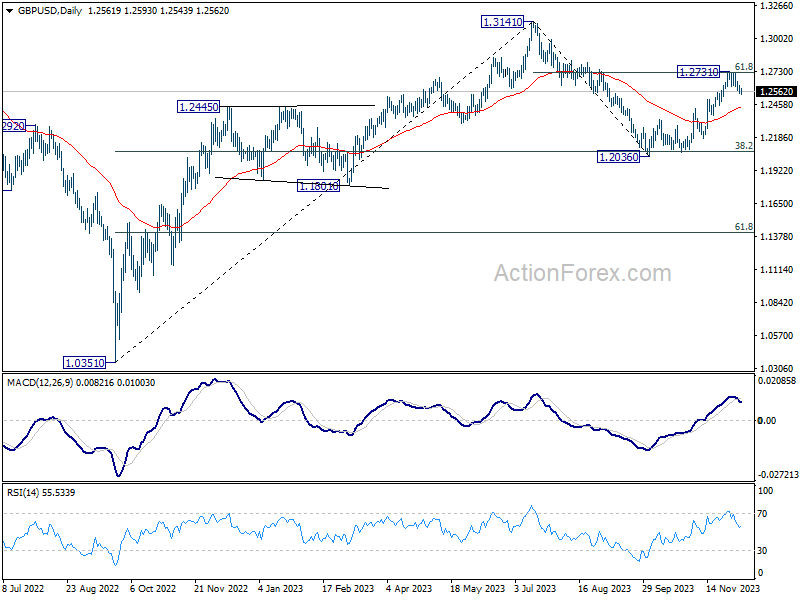
Intraday bias in GBP/USD stays on the downside at this point. Fall from 1.2731 short term top would target 55 D EMA (now at 1.2436). On the upside, above 1.2613 minor resistance will turn intraday bias neutral first. But risk will stay on the downside as long as 1.2731 resistance holds, in case of recovery.
In the bigger picture, price actions from 1.3141 are seen as a corrective pattern to rise from 1.0351 (2022 low). Strong rebound from 38.2% retracement of 1.0351 (2022 low) to 1.3141 at 1.2075 suggests that current rise from 1.2036 is already the second leg. However, while further rally could be seen, upside should be limited by 1.3141 to bring the third leg of the pattern.
USD/CHF Mid-Day Outlook
Daily Pivots: (S1) 0.8731; (P) 0.8746; (R1) 0.8762; More....
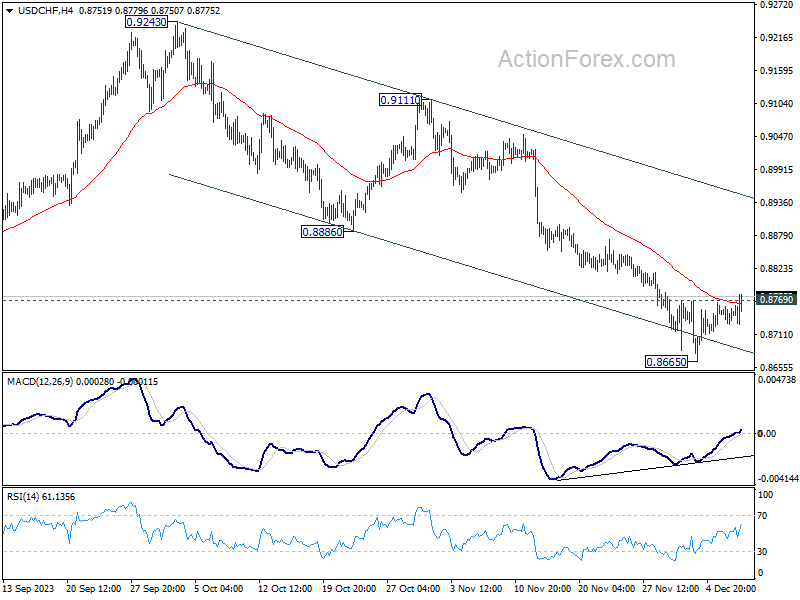
USD/CHF's break of 0.8769 minor resistance indicates short term bottoming at 0.8665, on bullish convergence condition in 4H MACD. Intraday bias is back on the upside for 0.8886 support turned resistance first. Decisive break there will indicate that whole fall from 0.9243 has completed, and bring stronger rally to 0.9111 resistance next. For now, risk is mildly on the upside as long as 0.8665 support holds, in case of retreat.
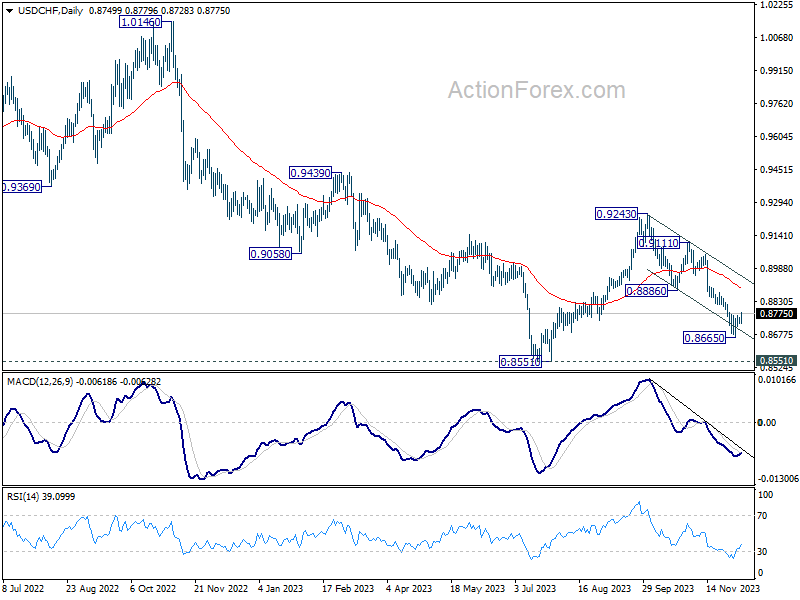
In the bigger picture, price actions from 0.8551 are currently seen as part of a corrective pattern to the decline from 1.0146 (2022 high). Fall from 0.9243 is seen as the second leg for now. Deeper decline could be seen to 0.8551 low but strong support should be seen there to bring rebound. For now, this will remain the favored case as long as 0.8886 support turned resistance holds.
USD/JPY Mid-Day Outlook
Daily Pivots: (S1) 146.97; (P) 147.23; (R1) 147.57; More...
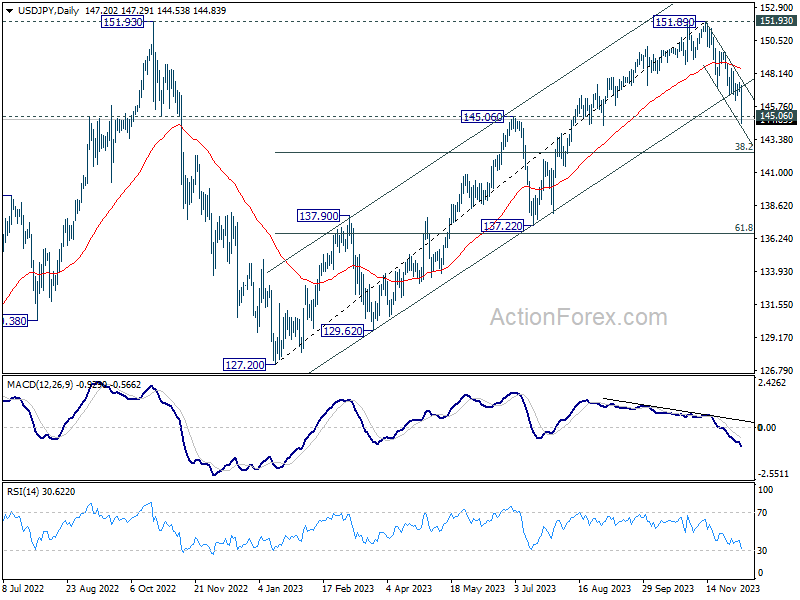
USD/JPY's decline accelerates to as low as 144.53 so far and there is no sign of bottoming yet. Intraday bias remains on the downside. Sustained trading below 145.06 will carry larger bearish implication and target 142.45 fibonacci level next. On the upside, break of 146.22 minor resistance will turn intraday bias neutral and bring consolidations first.
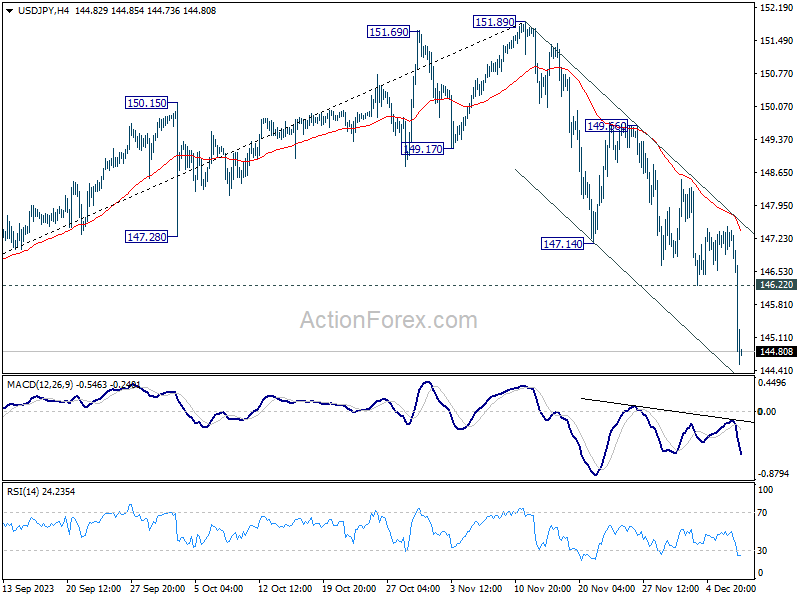
In the bigger picture, rise from 127.20 (2023 low) is seen as the second leg of the pattern from 151.93 (2022 high). Decisive break of 145.06 resistance turned support will confirm that this second leg has completed, after rejection by 151.93. Deeper fall would be seen through 38.2% retracement of 127.20 to 151.89 at 142.45 to 61.8% retracement at 136.63. Nevertheless strong bounce from 145.06 will retain medium term bullishness for another test on 151.93 at a later stage.
Yen Dominates with Strong Rally, USD/JPY Enters Bearish Trend Reversal
Yen is trading as the runaway leader in today's market, dominating traders' focus. This rally was initially triggered by comments from BoJ Governor Kazuo Ueda regarding the central bank's potential strategies upon exiting negative interest rates. Buying momentum for then intensified further following Ueda's meeting with Japanese Prime Minister Fumio Kishida to discuss his monetary policy stance.
While the specifics of the conversation between Ueda and Kishida were not disclosed, some market observers perceive this as strategic "staged" move to signal potential policy shift by BoJ. This speculation is reflected in the overnight-indexed swaps, which now price in over 40% chance of BoJ ending its negative rate policy at the upcoming meeting on December 18-19. This represents a significant increase from just a 3% probability two days ago.
It is important to note that, logically, BoJ is not poised to exit negative rates soon. The central bank has communicated clearly that its next move will depend heavily on wage negotiations in Spring. Updated price forecasts expected in January and April could support a case for policy change, making these meetings more critical for adjustments. However, the possibility of a minor tweak at this month's meeting can't be dismissed, and traders are positioning themselves for this potential outcome.
For now, Swiss Canadian Dollar is the worst performer of the day, followed by Swiss Franc and then Dollar. Australian Dollar is the second strongest, for RBA is still having a chance to hike again next year. Euro is the third strongest, followed by Sterling.
Technically, the case of bearish trend reversal in USD/JPY is building up further with today's break of 145.06 resistance turned support. Sustained trading below this level should pave the way to 38.2% retracement of 127.20 to 151.89 at 142.45, or even further to 61.8% retracement at 136.63.
Additionally, judging from today's price actions, the downside acceleration in USD/JPY is dragging down Dollar against others. This pattern will be closely monitored to assess its continuation and implications on currency markets.
In Europe, at the time of writing, FTSE is up 0.04%. DAX is down -0.18%. CAC is down -0.19%. Germany 10-year yield is up 0.006 at 2.207. UK 10-year yield is up 0.031 at 3.976. Earlier in Asia, Nikkei fell -1.76%. Hong Kong HSI dropped -0.71%. China Shanghai SSE fell -0.09%. Singapore Strait Times fell -0.42%. Japan 10-year JGB yield rose sharply by 0.1082 to 0.756.
US initial jobless claims rose to 220k, vs exp 226k
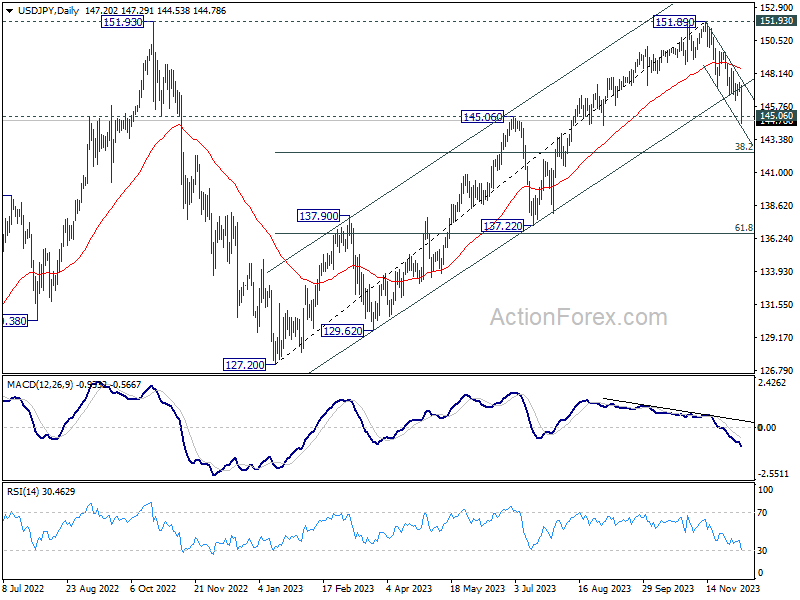
US initial jobless claims rose 1k to 220k in the week ending December 2, below expectation of 226k. Four-week moving average of initial claims rose 500 to 220.75k.
Continuing claims fell -64k to 1861k in the week ending November 25. Four-week moving average of continuing claims rose 7kk to 1872k, highest since December 11 2021.
Eurozone GDP growth finalized at 0.1% qoq in Q3
Eurozone GDP growth in Q3 was finalized at 0.1% qoq. Household final consumption expenditure increased by 0.3%. Government final consumption expenditure increased by 0.3% Gross fixed capital formation remained stable. Exports decreased by -1.1%. Imports decreased by -1.2%.
EU GDP was flat qoq. Malta (+2.4%) recorded the highest increase of GDP compared to the previous quarter, followed by Poland (+1.5%) and Cyprus (+1.1%). The highest decreases were observed in Ireland (-1.9%), Estonia (-1.3%) and Finland (-0.9%).
China's Exports Rebound in November While Import Slump
China's export figures for November 2023 showed an unexpected rise, growing by 0.5% yoy to USD 291.9B, surpassing the anticipated -0.8% yoy decline. This increase marks the first growth in exports China has seen in seven months.
Notably, exports to US rose by 7% yoy. However, exports to EU and ASEAN experienced declines, falling by -14.5% yoy and -7.0% yoy, respectively.
Conversely, imports decreased by -0.6% yoy to USD 223.5B, significantly underperforming against the expected rise of 3.0% yoy. This decline in imports contributed to widening of trade surplus, which expanded from USD 56.5B to USD 68.4B, exceeding the forecasted USD 58.1B surplus.
Looking at the broader January to November period, China's exports contracted by -5.2% yoy, while imports declined by -6.0% yoy. The cumulative trade balance for this period stood at a surplus of USD 748.13B.
BoJ's Ueda sees multiple options for target interest rates post-negative rate era
BoJ Governor Kazuo Ueda noted there are various options for its interest rate targets once it transitions away from negative short-term borrowing costs. However, he emphasized that no decision has been made yet regarding this shift. Ueda reiterated BoJ's commitment to continuing its monetary easing under Yield Curve Control to support economic activity and foster a cycle of wage growth.
Speaking to the parliament, Governor Ueda noted the economy is to continue recovering moderately. But there is "extremely high" uncertainty surrounding the outlook. He emphasized, "We have not yet reached a situation in which we can achieve [our] price target sustainably and stably and with sufficient certainty."
Regarding shifts in BoJ's monetary policy, Ueda outlined that once the central bank moves away from its negative interest rate policy, it could consider various options for its interest rate targets. These include continuing to target the interest rate applied to reserves that financial institutions hold with the central bank or reverting to a policy that focuses on the overnight call rate. He clarified, "We have not made a decision yet on which interest rate to target once we end our negative interest rate policy."
USD/JPY Mid-Day Outlook
Daily Pivots: (S1) 146.97; (P) 147.23; (R1) 147.57; More...
USD/JPY's decline accelerates to as low as 144.53 so far and there is no sign of bottoming yet. Intraday bias remains on the downside. Sustained trading below 145.06 will carry larger bearish implication and target 142.45 fibonacci level next. On the upside, break of 146.22 minor resistance will turn intraday bias neutral and bring consolidations first.
In the bigger picture, rise from 127.20 (2023 low) is seen as the second leg of the pattern from 151.93 (2022 high). Decisive break of 145.06 resistance turned support will confirm that this second leg has completed, after rejection by 151.93. Deeper fall would be seen through 38.2% retracement of 127.20 to 151.89 at 142.45 to 61.8% retracement at 136.63. Nevertheless strong bounce from 145.06 will retain medium term bullishness for another test on 151.93 at a later stage.
Economic Indicators Update
| GMT | Ccy | Events | Actual | Forecast | Previous | Revised |
|---|---|---|---|---|---|---|
| 00:30 | AUD | Trade Balance (AUD) Oct | 7.13B | 7.45B | 6.79B | 6.18B |
| 03:00 | CNY | Trade Balance (USD) Nov | 68.4B | 58.1B | 56.5B | |
| 05:00 | JPY | Leading Economic Index Oct P | 108.7 | 108.2 | 108.2 | 108.9 |
| 06:45 | CHF | Unemployment Rate Nov | 2.10% | 2.10% | 2.10% | |
| 07:00 | EUR | Germany Industrial Production M/M Oct | -0.40% | -0.20% | -1.40% | |
| 07:45 | EUR | France Trade Balance (EUR) Oct | -8.6B | -8.5B | -8.9B | |
| 08:00 | CHF | Foreign Currency Reserves (CHF) Nov | 642B | 658B | ||
| 09:00 | EUR | Italy Industrial Output M/M Oct | -0.20% | -0.60% | 0.00% | |
| 10:00 | EUR | Italy Retail Sales M/M Oct | 0.40% | 0.10% | -0.30% | |
| 10:00 | EUR | Eurozone GDP Q/Q Q3 F | -0.10% | -0.10% | -0.10% | |
| 10:00 | EUR | Eurozone Employment Change Q/Q Q3 F | 0.20% | 0.30% | 0.30% | |
| 12:30 | USD | Challenger Job Cuts Nov | -40.80% | 8.80% | ||
| 13:30 | USD | Initial Jobless Claims (Dec 1) | 220K | 226K | 218K | 219K |
| 13:30 | CAD | Building Permits M/M Oct | 2.30% | 1.10% | -6.50% | |
| 15:00 | USD | Wholesale Inventories Oct F | -0.20% | -0.20% | ||
| 15:30 | USD | Natural Gas Storage | 8.3B | 10B |
US initial jobless claims rose to 220k, vs exp 226k
US initial jobless claims rose 1k to 220k in the week ending December 2, below expectation of 226k. Four-week moving average of initial claims rose 500 to 220.75k.
Continuing claims fell -64k to 1861k in the week ending November 25. Four-week moving average of continuing claims rose 7kk to 1872k, highest since December 11 2021.
AUD/JPY Analysis: Rate Falls to Important Support
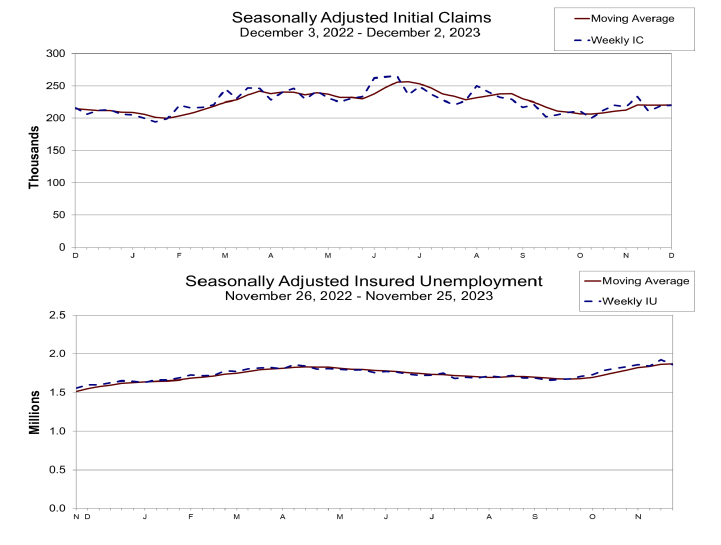
This morning, the AUD/JPY rate dropped below 95.2 yen per Australian dollar for the first time since late October.
The weakening of the AUD was contributed by:
→ negative news regarding the Chinese economy. The Hang Seng Index set its 2023 low yesterday;
→ Australian GDP data published yesterday, which is growing at a weaker-than-expected pace.
And the strengthening of the yen occurs against the backdrop of expectations of an increase in interest rates in Japan, which intensified according to the statement of the head of the Bank of Japan. Kazuo Ueda said yesterday the central bank has several options for targeting interest rates once it gets short-term borrowing costs out of negative territory.
At the same time, the AUD/JPY chart shows that:
→ the rate has reached important support from the lower border of the channel shown in blue;
→ the rate has broken through the level of 96.25, and now the level may act as resistance;
→ RSI dropped into the extreme oversold zone. This increases the temptation for bears to take profits.
Given these factors, it is reasonable to assume that the market is vulnerable to a short-term bullish correction after a strong downward impulse. However, if the current fundamental background does not change, it is possible that the strengthening yen will break through important support in the pair against AUD in December (which is also true for other currencies).
This article represents the opinion of the Companies operating under the FXOpen brand only. It is not to be construed as an offer, solicitation, or recommendation with respect to products and services provided by the Companies operating under the FXOpen brand, nor is it to be considered financial advice.
What’s Next for Gold Price – XAU/USD Technical Analysis
Talking Points:
- Why did gold prices decline sharply?
- Daily Chart Analysis
- 4-Hour Chart Analysis
- What’s next for Gold Prices?
Why did gold prices decline sharply?
Gold Price fell significantly last week after reaching an all-time high of $2150/Oz, the price fell to $2020/Oz within a day which left many traders stunned and unable to comprehend what has happened, and the more difficult question remains unanswered, what’s next for Gold Prices? Over the past few weeks/months, inflation has been in a downtrend in all the major economies globally, this kept the markets divided on how the FOMC and other major central bank’s next move will be regarding Interest rates.
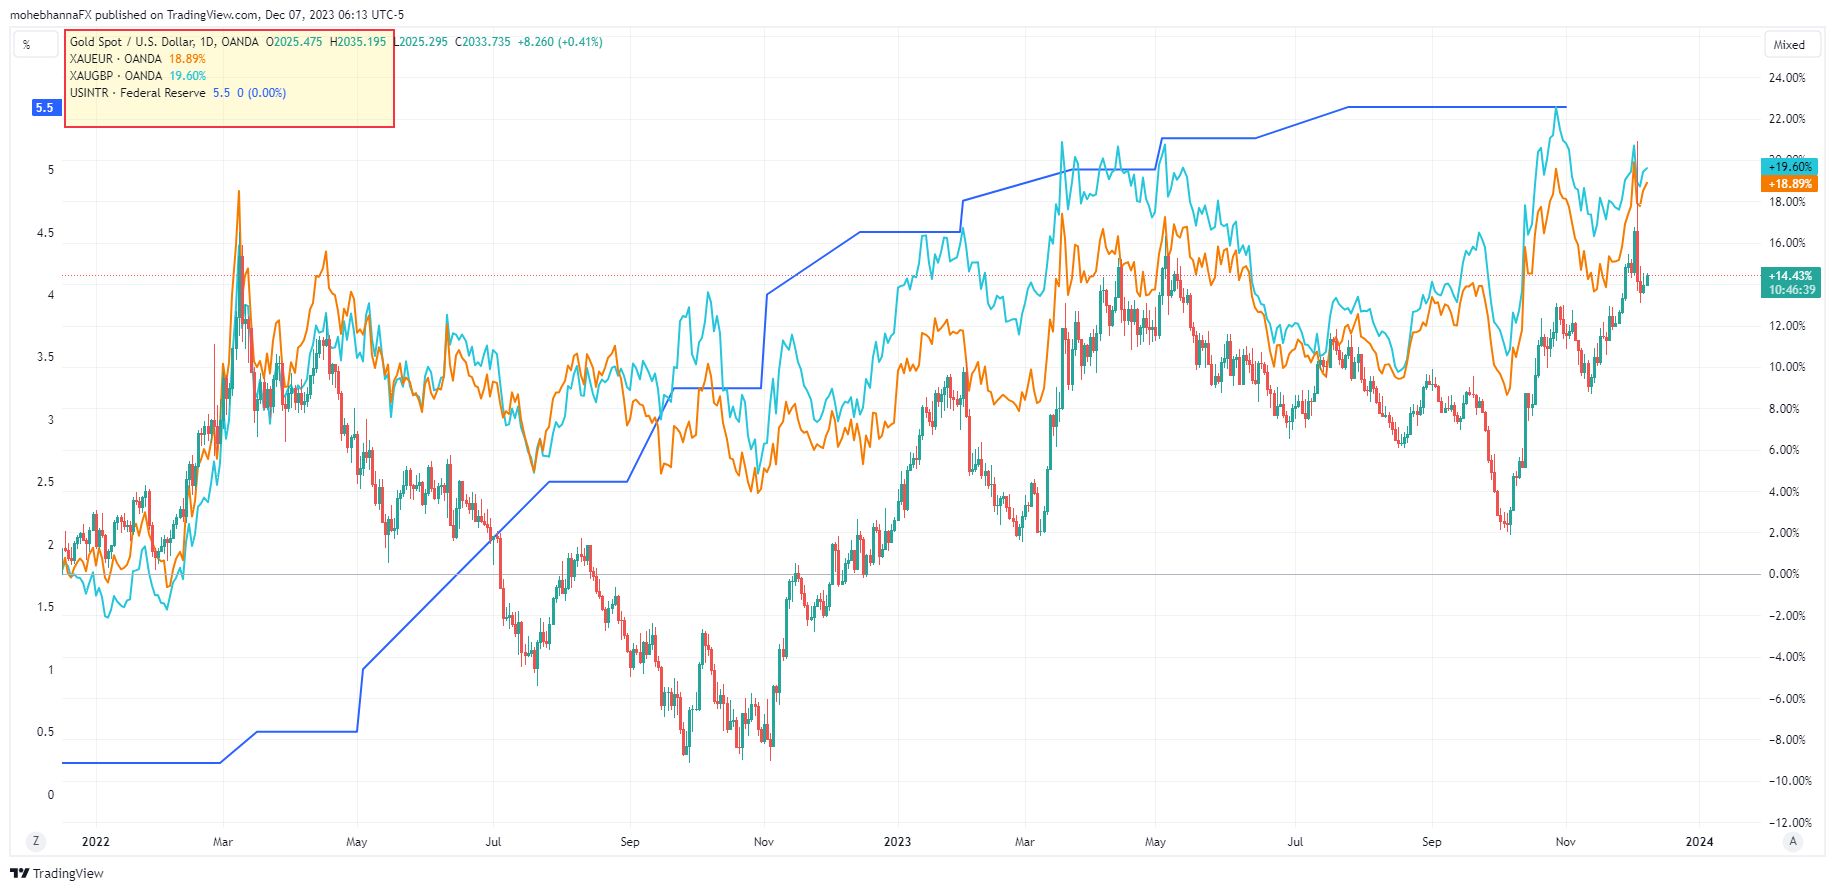
Markets are convinced to a certain extent that the FOMC will end up having to cut rates in 2024 and the speculation around the number of rate cuts kept traders on edge, on the other hand, the Central Bank officials continue their hawkish interest rate tone, but markets are not fully listening with some traders go as far as expecting a 75-basis point rate but by mid-2024. Traders learned over the years that the phrase “Don’t fight the FED” remains in full effect, however, historically but to a much lesser extent, it has happened before when markets were ahead of the FED.
The above chart is for XAUUSD with XAUEUR and XAUGBP overlay on the same percentage scale, the latest price move on the three instruments is almost the same which indicates that interest rate speculation on USD was most likely the main reason for the recent decline in gold prices, the same chart also includes USA interest rates overlay on the left percentage scale reflecting the recent gold price action compared to interest rates on the Dollar since the FED began raising interest rates.
Daily Chart Analysis
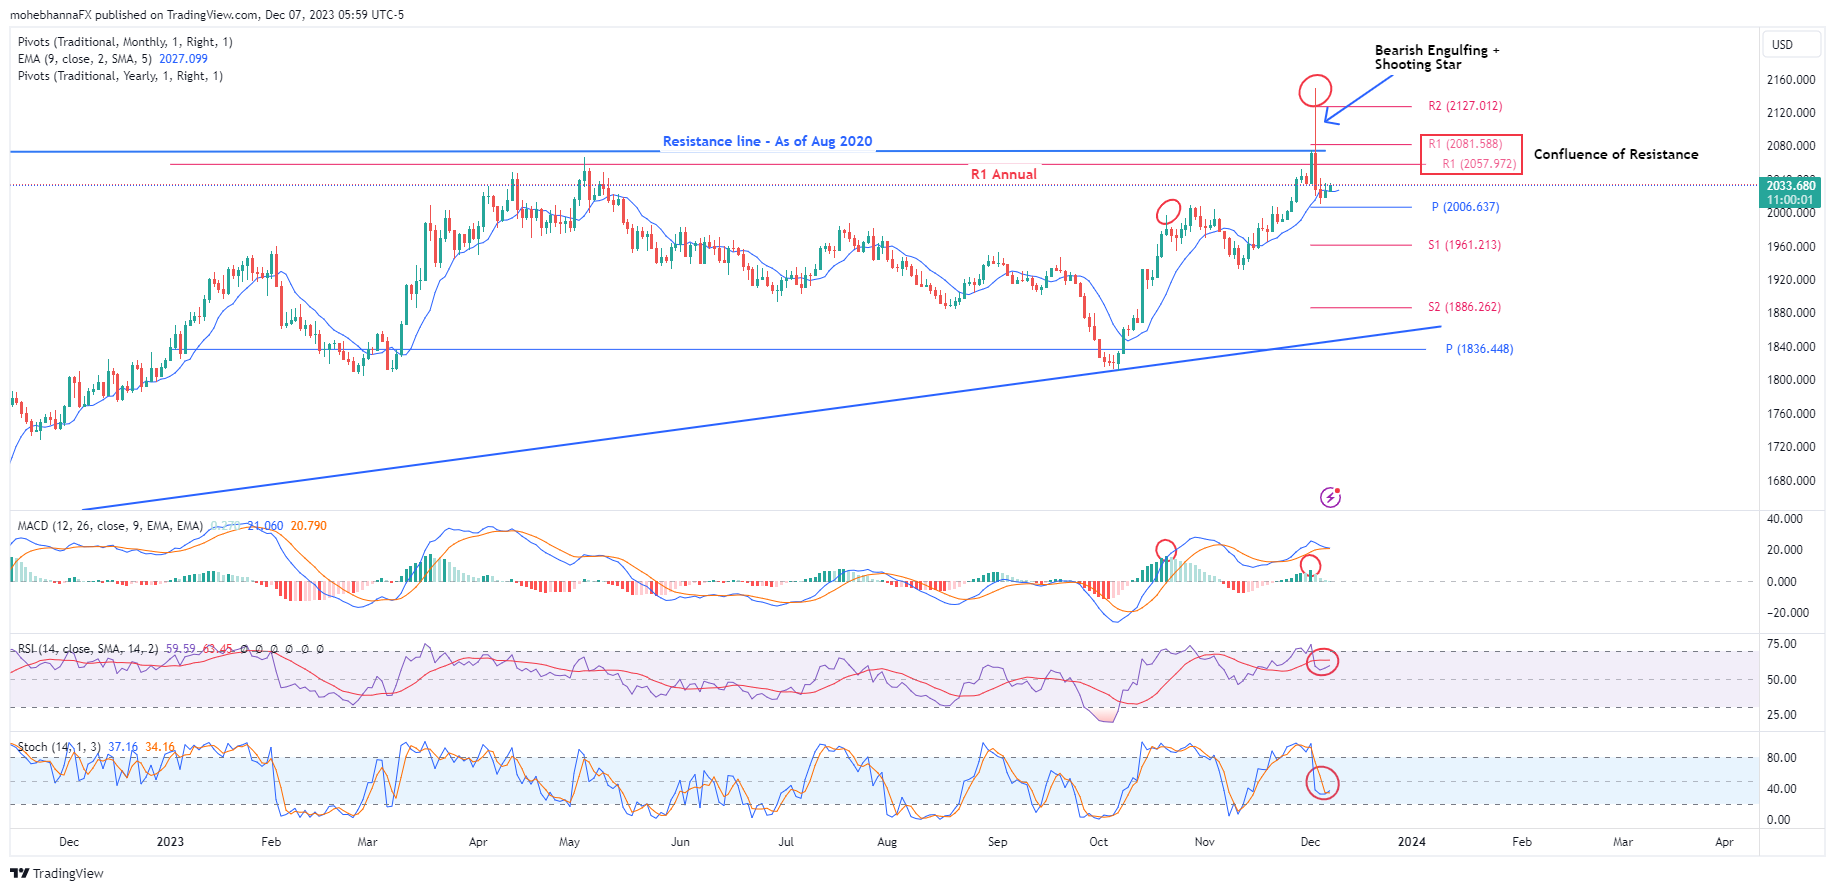
- Price attempted to break above the horizontal trendline connecting gold price’s all-time highs since August 2020, a significant failure represented by a high range, bearish engulfing, and shooting star candlestick pattern which took the price from its peaks of $2150/OZ range back down to $2020/OZ.
- Price broke below an annual support which has now turned into a resistance, the price range between $2081.59 and $2057.97 currently represents a confluence of resistance represented by the annual and monthly R1 as well as previously mentioned trendline connecting historic highs.
- The declining price action has found support so far above the annual pivot point of $2006.64, the price action is also attempting to remain above its Non-Smoothed EMA9 (Offset by 2), if price action fails to hold, breaks, and closes below these levels, it may result in further declines.
- Stochastic and RSI default settings continue to follow price action and are not generating any signals, however, both oscillators are attempting to break above their averages but are yet to materialize.
- The MACD line is moving closer to its signal line and attempting to break below, a slight negative divergence between price action and MACD Histogram can be identified.
4-Hour Chart Analysis
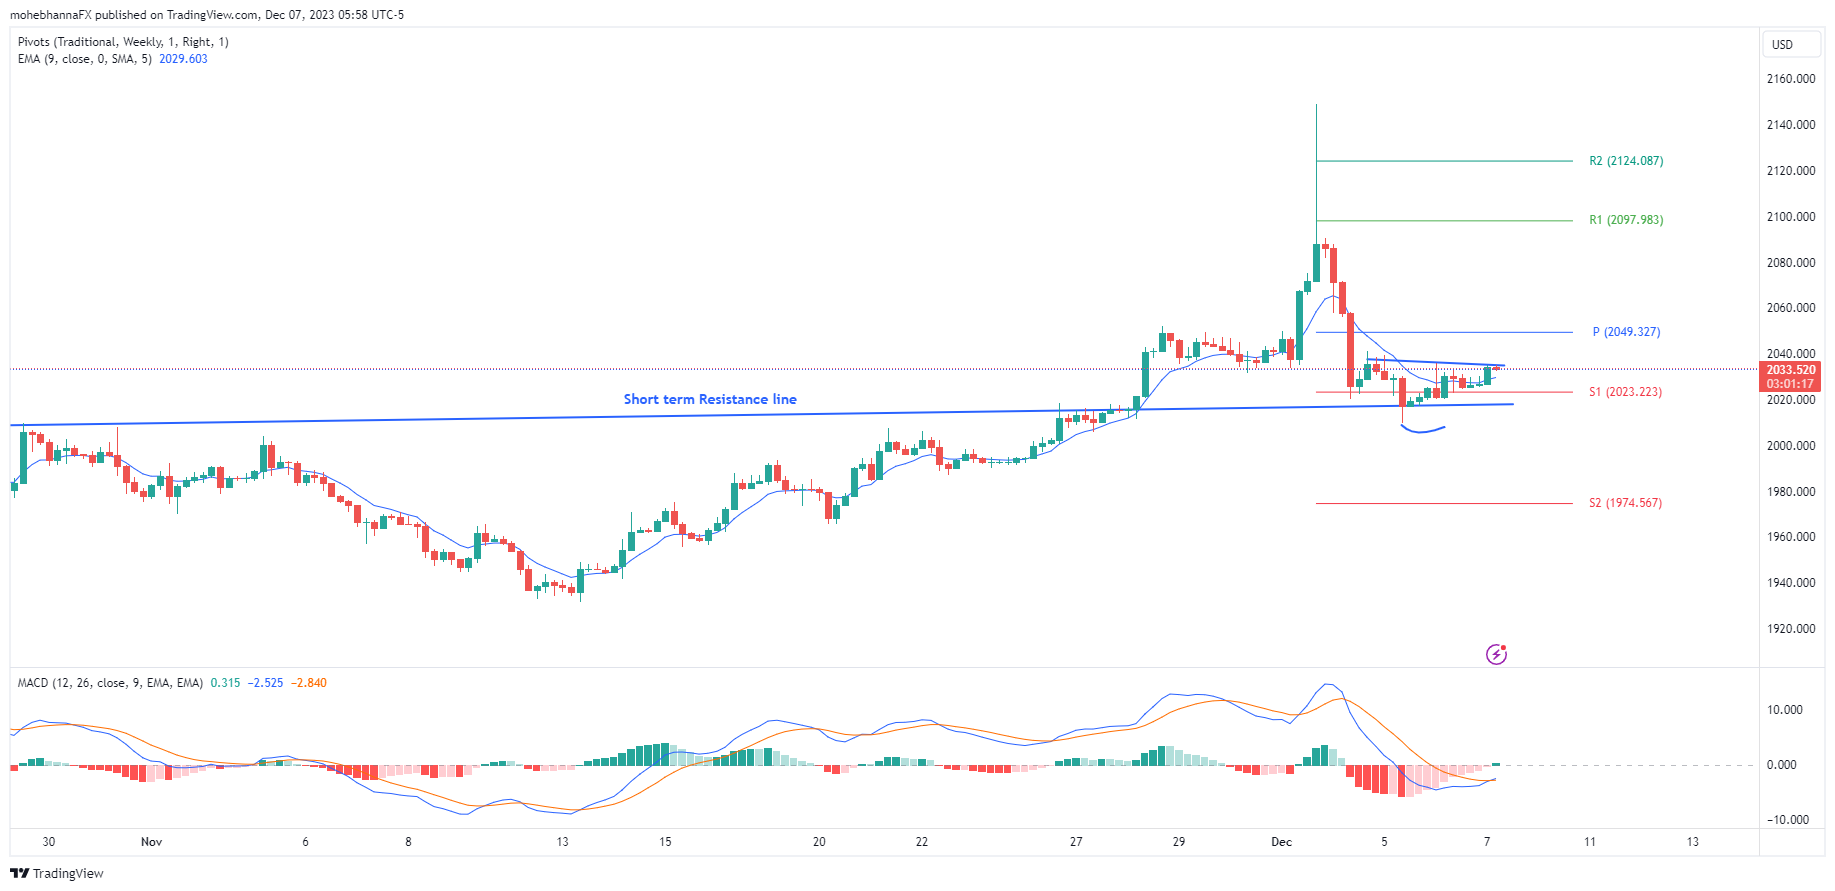
- An inverted Head and Shoulder as price action attempts a reversal after the recent decline. If the pattern materializes, price action may reach the weekly pivot at $2049.32, however, if the pattern fails, a break below the identified short-term resistance line and the Support level S1 near $2023.22, may open the way for the price to follow the path of least resistance.
- Price is so far trading above its fast non-smoothed EMA, a break and a close below the respective EMA9 may keep price action under pressure.
- MACD is in line with price action, currently the MACD line is attempting to cross above its signal line, a false MACD cross along with a failed H&S pattern may also add pressure to the price decline.
What’s next for Gold Prices?
We do have multiple significant levels to watch for, a break and a close below the EMA9 may allow the price to decline further to its monthly PP at $2006.63, the respective support level below that would be S1 at $1961 and S2 at $1886.26. On the other hand, a break and a close above the confluence of resistance identified on the charts may open the way for further upside price action. The patterns and price action on shorter time frames can help identify potential next moves. On the shorter time frame, the 4-hour chart, the weekly critical levels are S1 at $2023.22, S2$1974, R1 at $2097.98, and R2 at $2124.08.
EURGBP Moves Sideways After Significant Plunge
- EURGBP fails to extend negative structure
- 20- and 200-SMAs post death cross
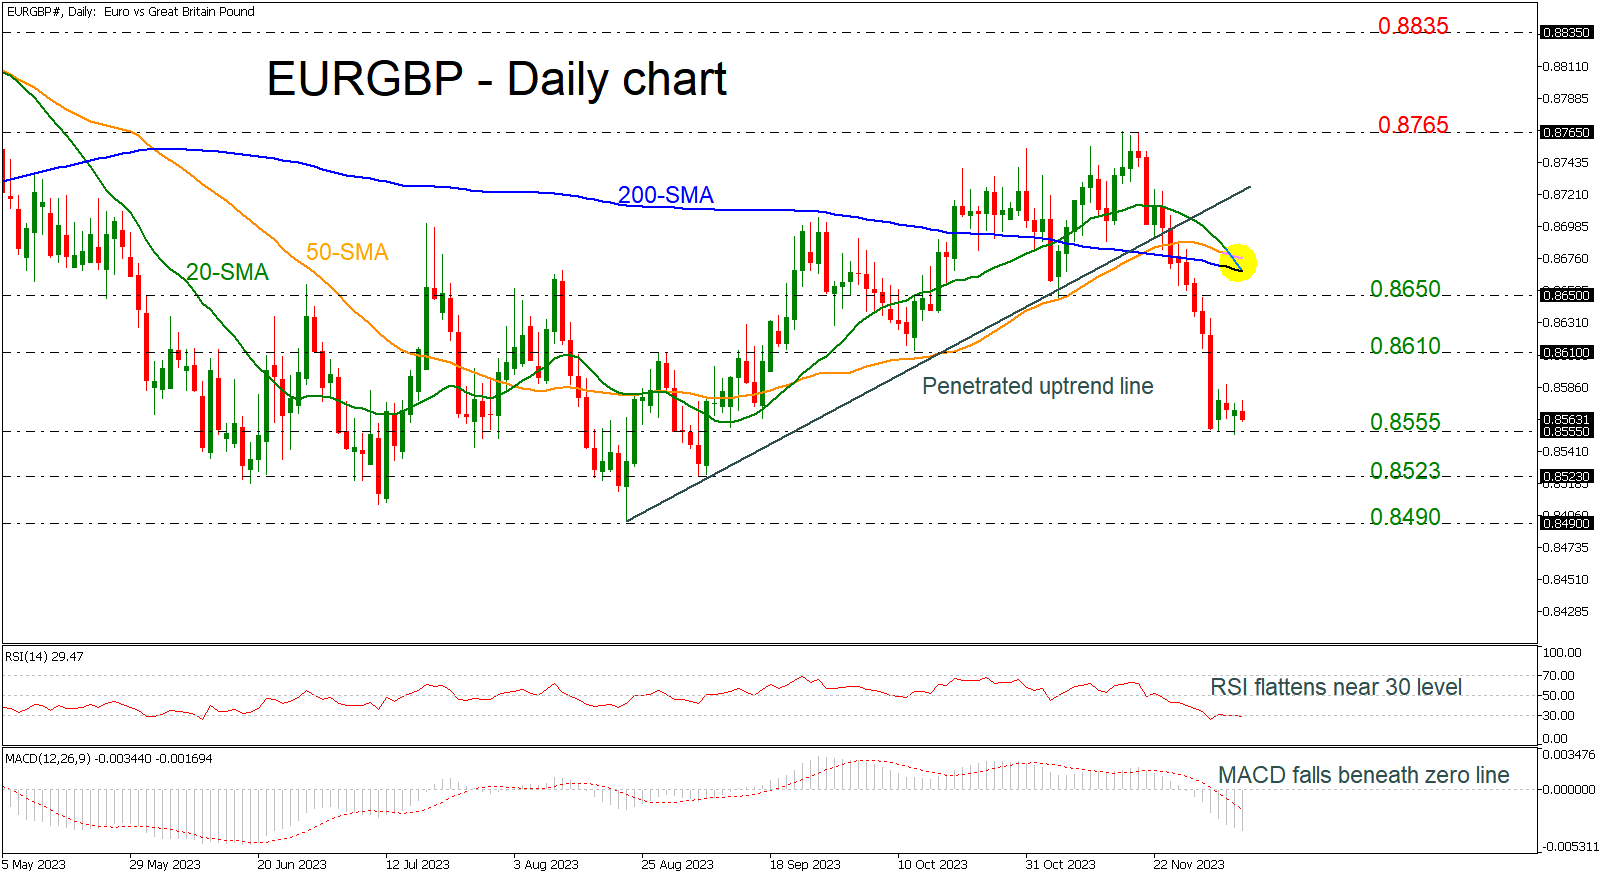
EURGBP is stubbornly fighting the nearby 0.8555 support level for the fifth consecutive trading day, after the strong sell-off from the 0.8765 resistance. The pair is holding well below the penetrated uptrend line and the 20- and the 200-day simple moving averages (SMAs) are ready for a death cross.
The technical picture suggests a neutral-to-bearish bias at the moment as the MACD remains negatively charged below its trigger line, while the RSI is currently flattening near the 30 level.
If the market retreats further and crosses beneath the immediate level of 0.8555, then the price could meet the 0.8523 barrier ahead of the 0.8490 bottom.
In the positive scenario where the price moves higher, the 0.8610 mark could be the next target before challenging the 0.8650 resistance and the bearish cross of the SMAs around 0.8670. A jump above these levels may switch the outlook to positive, hitting the uptrend line again at 0.8710.
As regards the very short-term outlook, EURGBP is maintaining a neutral trajectory. A move below 0.8555 could confirm the recent bearish structure.
US 500 Cash Index on the Brink of a Bearish Move
- US 500 index is trading sideways amidst key market events
- It failed to record a new 2023 high, denting bullish sentiment
- Momentum indicators point to increasing bearish pressure
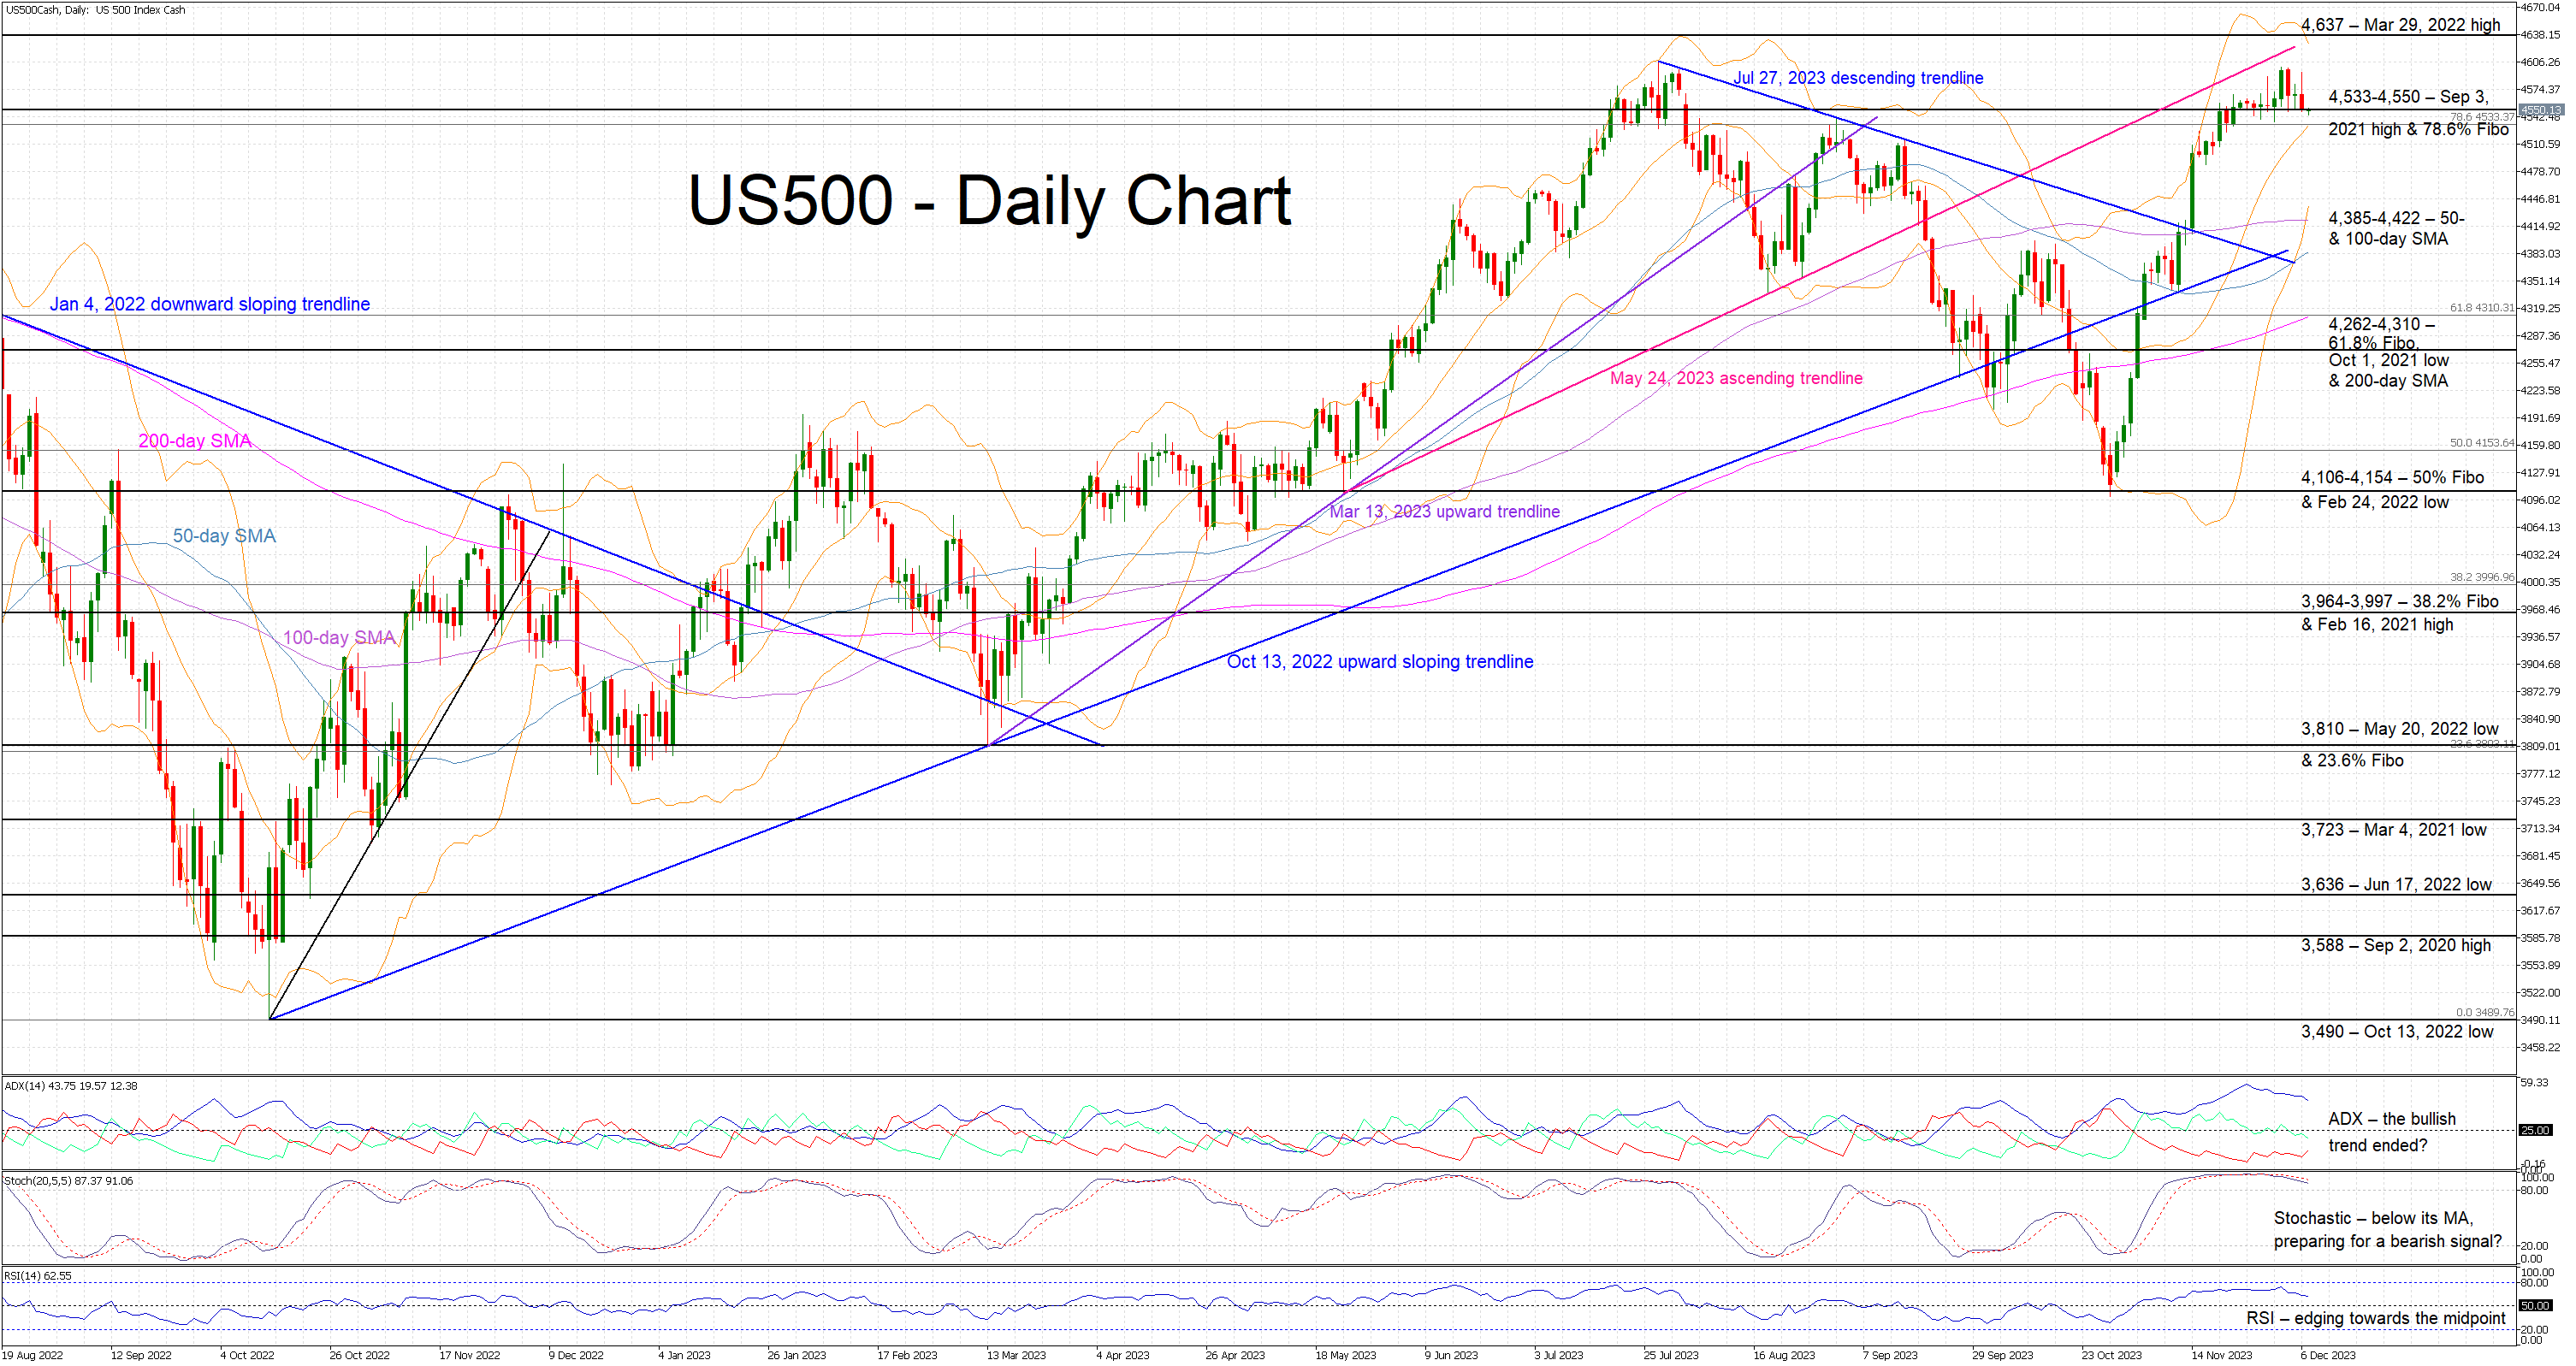
The US 500 cash index is trying to record a green candle today as it trades in the busy 4,533-4,550 area. The aggressive move from the October 27 low appears to have run out of steam, especially after the US 500 index failed to record a new 2023 high, above the July 27, 2023 high of 4,607.
The current bullish trend is still assumed to be in place, but the momentum indicators are ready to turn bearish. The Average Directional Movement Index (ADX) peaked on November 24 but it is now edging lower and thus pointing to an aggressively weakening bullish trend. Similarly, the RSI traded at a 3-month high, but it is now heading towards its 50-midpoint. More importantly, the stochastic oscillator has broken below its moving average and appears ready to exit its overbought territory. Should this move take place, it will be seen as a strong bearish signal.
Should the bulls wish to record a higher high, they could first try to keep the US 500 index above the 4,533-4,550 area, which is populated by the September 3, 2021 high and the 78.6% Fibonacci retracement level of the January 4, 2022 – October 12, 2022 downtrend. They could then have a go at recording a new 2023 high and possibly test the resistance set by the March 29, 2022 high at 4,637.
On the flip side, the bears are trying to regain the upper hand, and are keen to break below the 4,533-4,550 area. If successful, they could then stage a sell-off towards the 4,385-4,422 range, which is set by the 50- and 100-day simple moving averages (SMAs). Even lower, the 4,262-4,310 area could prove tougher to crack than currently envisaged.
To conclude, the impressive rally in the US 500 index from the October lows has probably run its course as momentum indicators are ready to signal the start of a new bearish move.