Sample Category Title
GBP/USD Daily Outlook
Daily Pivots: (S1) 1.2536; (P) 1.2575; (R1) 1.2598; More...
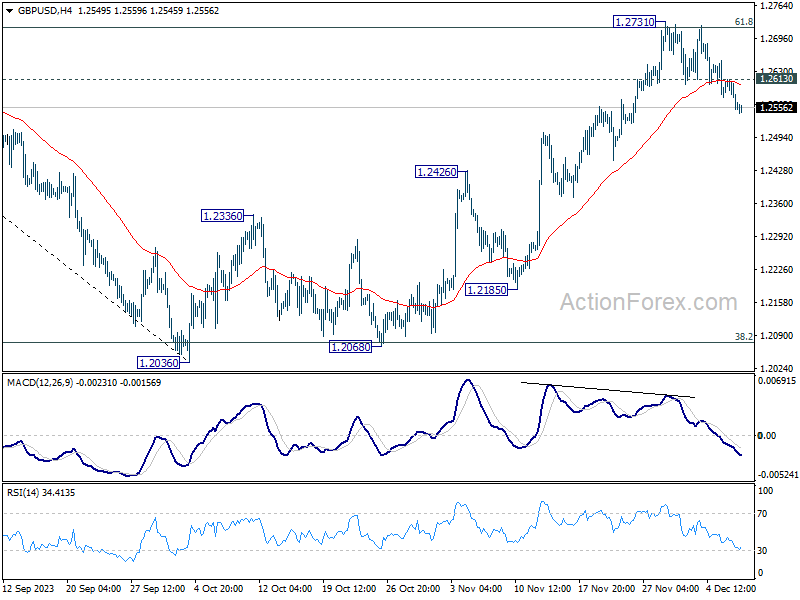
GBP/USD's fall from 1.2731 short term top is in progress. Intraday bias stays on the downside for 55 D EMA (now at 1.2436). On the upside, above 1.2613 minor resistance will turn intraday bias neutral first. But risk will stay on the downside as long as 1.2731 resistance holds, in case of recovery.
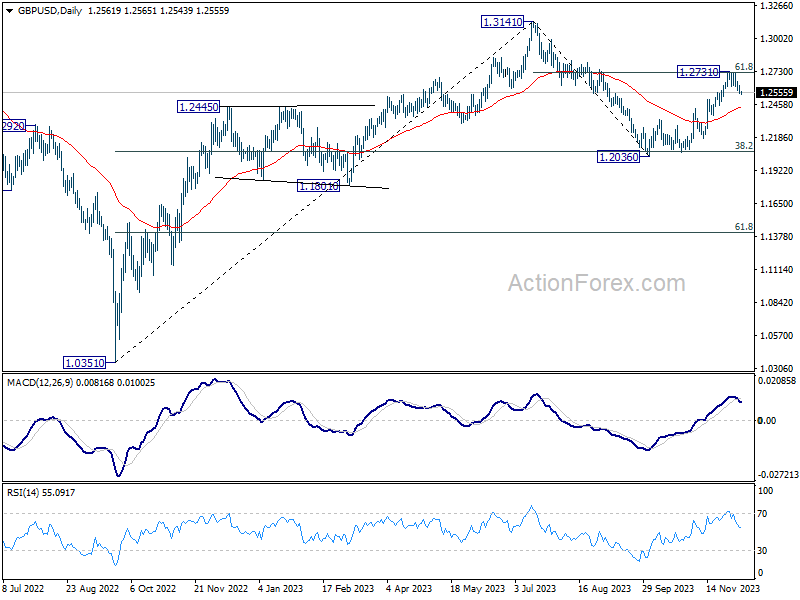
In the bigger picture, price actions from 1.3141 are seen as a corrective pattern to rise from 1.0351 (2022 low). Strong rebound from 38.2% retracement of 1.0351 (2022 low) to 1.3141 at 1.2075 suggests that current rise from 1.2036 is already the second leg. However, while further rally could be seen, upside should be limited by 1.3141 to bring the third leg of the pattern.
USD/CHF Daily Outlook
Daily Pivots: (S1) 0.8731; (P) 0.8746; (R1) 0.8762; More....
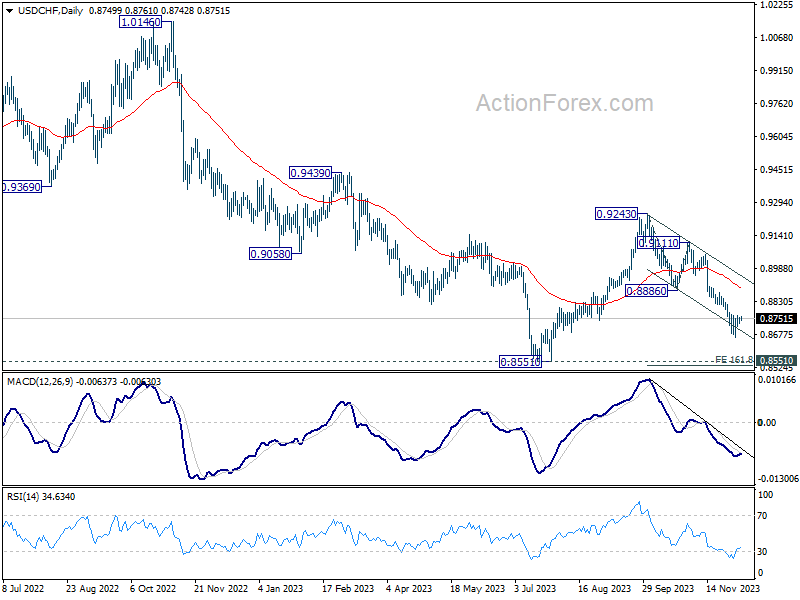
Intraday bias in USD/CHF remains neutral as range trading continues. Another fall is in favor as long as 0.8769 minor resistance holds. Below 0.8665 will resume the decline from 0.9243 to 161.8% projection of 0.9243 to 0.8886 from 0.9111 at 0.8533, which is close to 0.8551 low. However, break of 0.8769 minor resistance should indicate short term bottoming, and turn bias back to the upside for stronger recovery to 0.8886 support turned resistance.
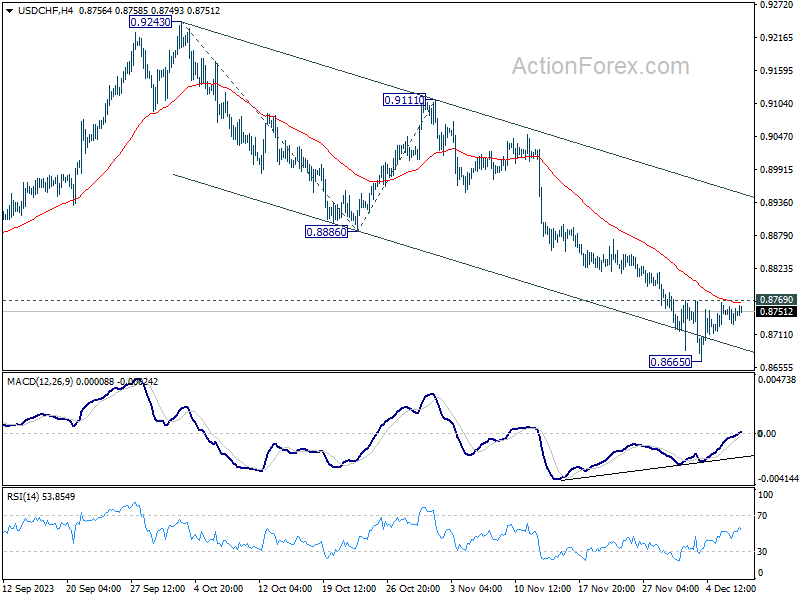
In the bigger picture, price actions from 0.8551 are currently seen as part of a corrective pattern to the decline from 1.0146 (2022 high). Fall from 0.9243 is seen as the second leg for now. Deeper decline could be seen to 0.8551 low but strong support should be seen there to bring rebound. For now, this will remain the favored case as long as 0.8886 support turned resistance holds.
Hang Seng Index Technical: Entrenched in a Downward Spiral
- China’s negative import growth in November suggests a sticky weak domestic demand environment.
- China and Hong Kong stock markets have failed to reignite bullish animal spirits despite the weakening trend seen in the US 10-year Treasury yield in the past month.
- Hang Seng Index now faces a potential major bearish breakdown that may retest the 12,200 October 2008 GFC swing low area in Q1 2024.
China and Hong Kong stock markets have continued to wobble despite the recent one-month of risk-on-herding behaviour seen in other global stock markets triggered by the medium-term downtrend phases of the US 10-year Treasury yield and US dollar weakness (see Fig 1).
Underperformance of China & Hong Kong benchmark stock indices
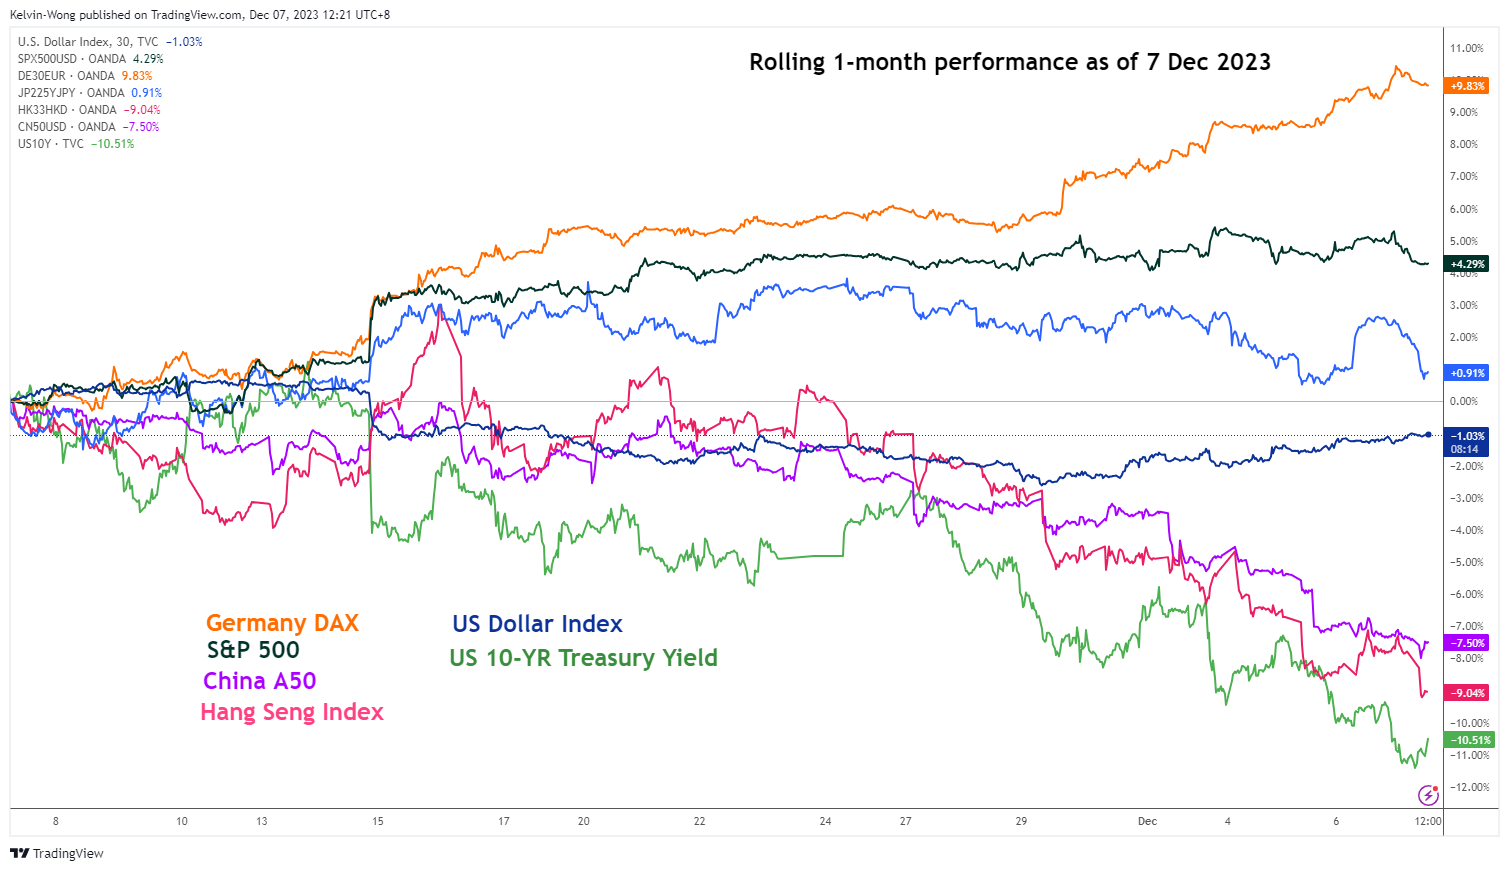
Fig 1: Rolling 1-month performances of global benchmark stock indices with US Dollar Index & US 10-year Treasury yield as of 7 Dec 2023 (Source: TradingView, click to enlarge chart)
The month of November 2023 has witnessed stellar monthly performances in the S&P 500 (+8.9%), Germany DAX (+9.5%), Nikkei 225 (+8.5%), and MSCI Emerging Markets ex China (+9.7%). In contrast, bears dominated China A50 (2%), CSI 300 (-2.1%), and Hang Seng Index (-0.4%) over the same period.
The persistent weakness seen in the China and Hong Kong stock markets since China’s COVID re-opening optimism fizzled out in Q1 2023 has been primarily driven by structural vulnerabilities due to rising debt risks in major property developers that may trigger a deflationary spiral in China.
Domestic demand has also remained lacklustre in China despite ongoing revival efforts by policymakers via targeted monetary and fiscal stimulus measures. The latest trade data for November has indicated a surprise contraction in China’s imports which slipped to -0.6% y/y, below consensus estimates of a further improvement in growth to 3.3% y/y from 3% recorded in October.
Hence, it seems that the prior one-month recovery of import growth recorded in October is likely a “blip” and November’s negative y/y growth rate suggests the rolling twelve months of negative growth trend in imports remains intact.
Hang Seng Index faces the risk of a major bearish breakdown
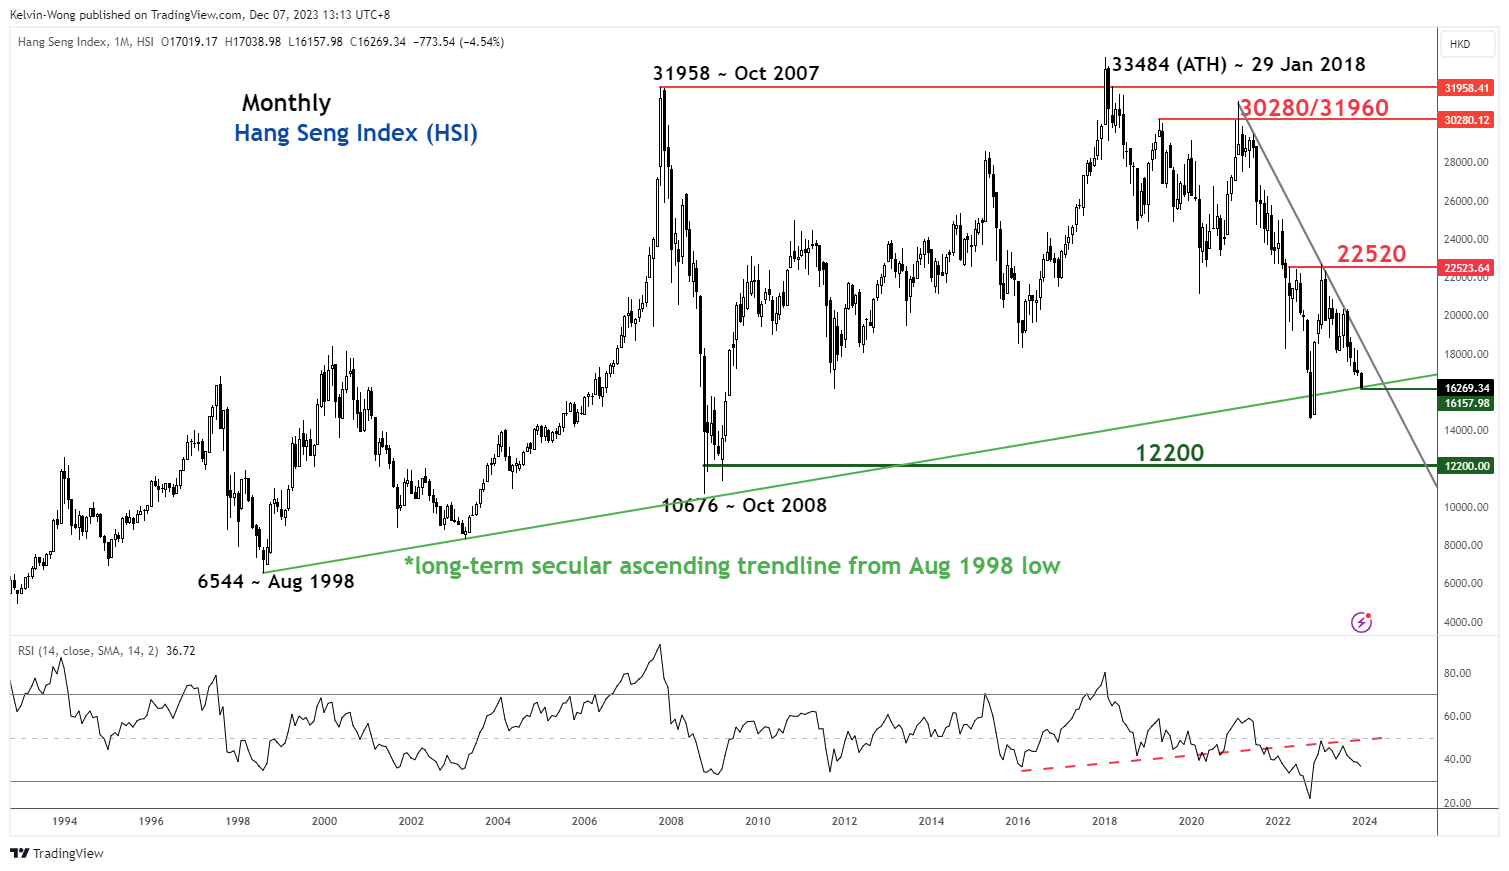
Fig 2: Hang Seng Index long-term secular trend as of 7 Dec 2023 (Source: TradingView, click to enlarge chart)
Through the lens of technical analysis, bearish momentum readings have been flashed out in the long-term monthly chart of the Hang Seng Index.
It is now retesting a long-term secular ascending support in place since the major August 2028 low (Asian Financial Crisis), the last retest and rebound occurred on October 2022 in line with China’s COVID re-opening theme play that coincided with an extremely oversold reading of 21.90 seen in monthly RSI momentum indicator.
In contrast, the current retest on the long-term secular ascending trendline now acting as support at around 16,100 has not been accompanied by bullish reading seen in the monthly RSI indicator; not in the oversold region at this juncture, and bearish momentum remains intact as it traced out a lower high right below a parallel resistance at the 50 level.
Therefore, the Hang Seng Index may see further potential weakness in Q1 2024 with the next major support coming in at 12,200 (October 2008 GFC swing low area & the lower limit of a major sideways range configuration in place since October 2007 major swing high).
Watch the 16,680 key short-term resistance
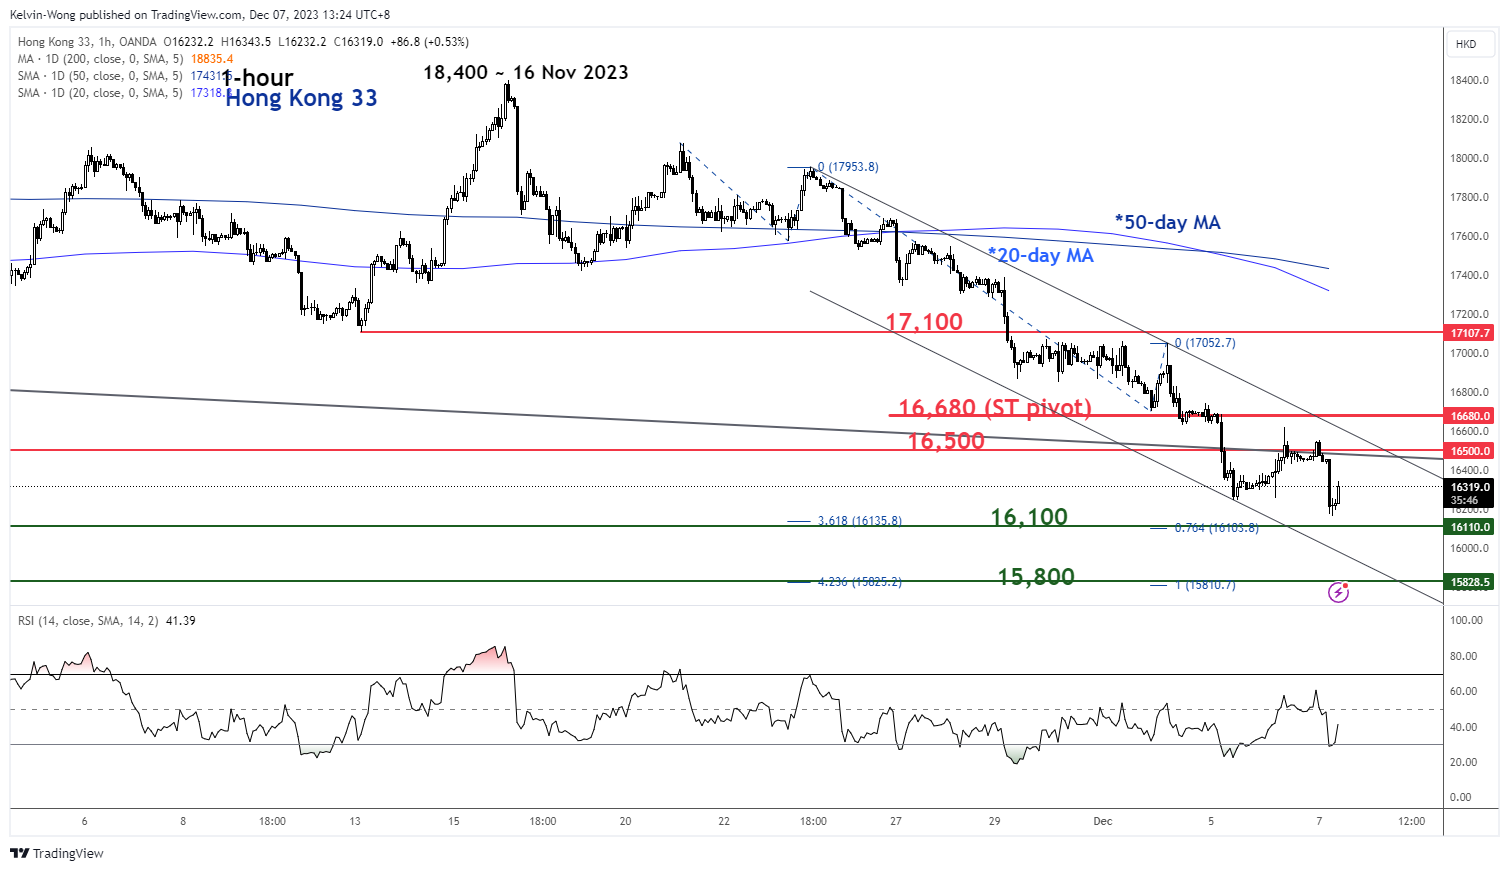
Fig 3: Hong Kong 33 minor short-term trend as of 7 Dec 2023 (Source: TradingView, click to enlarge chart)
Based on the shorter-term hourly chart, the price actions of the Hong Kong 33 Index (a proxy of the Hang Seng Index futures) are still evolving within a minor downtrend phase in place since the 16 November 2023 high of 18,400.
Key short-term pivotal resistance will be at 16,680 (also the upper boundary of the minor descending channel). A breakdown below 16,100 exposes the next near-term support at 15,800 (lower boundary of the minor descending channel & Fibonacci extension cluster) in the first step.
On the flip side, a clearance above 16,680 negates the bearish tone for a potential minor counter-trend rebound towards 17,100 intermediate resistance (also close to the downward-sloping 20-day moving average).
Scream Correction
US crude plummeted 4% yesterday and sank below the $70pb mark and Brent slipped below $75pb. Momentum traders and falling volumes worsened crude’s recent plunge while OPEC’s latest announcement of output cuts and Saudi’s additional threats that they will extend their solo cut beyond Q1 went totally unheard. Worse, as the bears saw that investors ignored the supply cuts and threats, they feel more confident to increase their bets against crude. And indeed, the cartel’s shrinking share of global output and frictions among members regarding the supply cut strategy mean that either the supply cuts don’t make much difference, or further action will be difficult and perhaps too costly. Add the global slowdown woes into that mix, the dwindling falling interest and algorithmic trades’ lack of emotion regarding the OPEC news, you understand why the barrel of crude is below $70pb and not above $100pb this December, as many banks had forecasted at the start of the year. And if a more than 4.5mio barrel fall in the US oil reserves last week couldn’t halt yesterday’s oil selloff, it is because the most recent number was blurred by a big margin error, the biggest on record – or the bulls just couldn’t find the energy to swim against such a strong tide.
The question on the back of everyone’s mind is: could crude oil extend losses? At the current levels, crude oil is trading near oversold market territory, therefore your algorithmic models based on market metrics should take than into account and slow selling. As such, we shall see a certain rebound at the current levels. Yet any price recovery could remain limited at $75/78 range, including the minor 23.6% Fibonacci retracement and the 200-DMA, and once the time is right, we could see this negative move extent to $65/67 region.
Remains the question of US strategic reserves that the US is said to consider refilling between $67/72 region. Yes, that will certainly help slow the downside pressure at this range but keep in mind that these buybacks are limited to about 3 mio barrels per month due to physical constraints and won’t reverse the tide.
Now that OPEC risk is out of the way, the biggest upside risk for oil is Middle East tensions.
Too dovish
Falling energy prices help softening global inflation expectations and keep the central bank doves in charge of the market, along with sufficiently soft economic data that points at the end of the global monetary policy campaign. This week, the Reserve Bank of Australia (RBA) and the Bank of Canada (BoC) kept rates unchanged – although the RBA said that they could hike again if home-grown inflation doesn’t slow. But overall, the Federal Reserve (Fed) is expected to cut as soon as in May next year, and the European Central Bank (ECB) is expected to announce six 25 basis point cuts next year. If that’s the case, the ECB should start cutting before the Fed, sometime in Q1. It sounds overstretched to me.
Data released earlier this week showed that French industrial production fell unexpectedly for the 3rd straight month in October, Spanish output declined, and German factory orders fell 3.7% in October versus a 0.2% increase penciled in by analysts. The slowing European economies and falling inflation help building a case in favour of an ECB rate cut, but I don’t see the ECB cutting rates anytime in the H1. Remember, economic slowdown is the natural response that the ECB was looking for to slow inflation. Now that it happens, the bank won’t leave the battlefield before making sure that inflation shows no sign of life. But the EURUSD is understandable extending its losses within the bearish consolidation zone, as the German 10-year yield sinks below the 2.20% level. The EURUSD is now testing the 100-DMA to the downside. Trend and momentum indicators are comfortably bearish and the RSI hints that we are not yet dealing with oversold market conditions. Therefore, the selloff could deepen toward the 1.07/1.730 region.
The direction of the EURUSD is of course also dependent on what the USD leg of the pair will do. We see the dollar index recover this week despite the falling yields driven lower by a soft set of US jobs data released so far this week. The JOLTS data showed a significant fall in job openings in October, while yesterday’s ADP print revealed around 100K new private job additions last month, much less than 130K penciled in by analysts. There is no apparent correlation between this data and Friday’s official NFP read, but the fact that independent data point at further loosening in the US jobs market comforts the Fed doves in the idea that, yes, the US jobs market is finally giving in. On the yields front, the US 2-year yield remains steady near 4.60%/4.65% region, while the 10-year yield fell to 4.10% yesterday, from above 5% by end of October. This is a big, big decline, and it means that investors are now ramping up the US slowdown bets. That’s also why we don’t see the US stocks react to the further fall in yields. The S&P500 and Nasdaq both fell yesterday, while their European peers extended gains regardless of the overbought conditions. The Stoxx 600 closed yesterday’s session above the 470 level. The softening ECB expectations are certainly the major driver of the European stocks toward the ytd highs; German stocks hit an ATH yesterday despite the undoubtedly morose economic outlook. Actual levels scream correction.
AUD/USD Daily Report
Daily Pivots: (S1) 0.6531; (P) 0.6565; (R1) 0.6582; More...
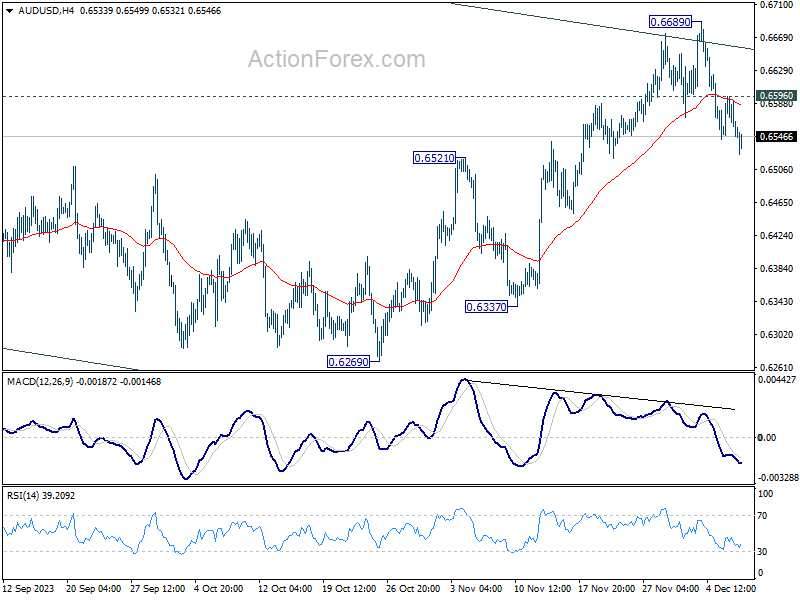
Intraday bias in AUD/USD remains on the downside as fall from 0.6689 short term top is in progress. Deeper decline would be seen to 55 D EMA (now at 0.6489). On the upside, above 0.6596 minor resistance will turn intraday bias neutral first. But risk is mildly on the downside as long as 0.6689 resistance holds, in case of recovery.
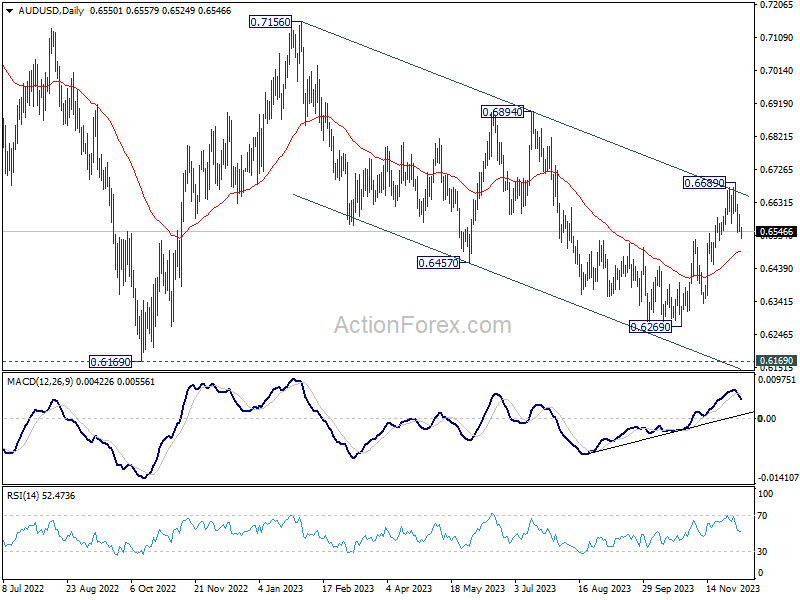
In the bigger picture, there is no confirmation that down trend from 0.8006 (2021 high) has completed. price actions from 0.6169 (2022 low) could be just a medium term corrective pattern, with rise from 0.6269 as the third leg. For now, range trading should be seen between 0.6169 and 0.7156 (2023 high), until further developments.
USD/CAD Daily Outlook
Daily Pivots: (S1) 1.3562; (P) 1.3581; (R1) 1.3613; More...
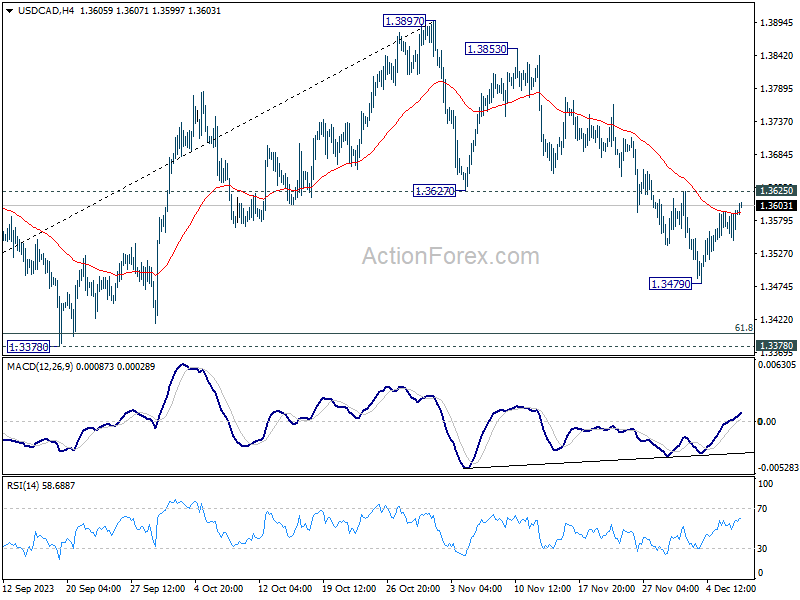
Intraday bias in USD/CAD stays neutral and outlook is unchanged. On the downside, below 1.3479 will resume the corrective fall from 1.3897. But downside should be contained by 1.3378 support, which is close to 61.8% retracement of 1.3091 to 1.3897 at 1.3399, to bring rebound. On the upside, break of 1.3625 resistance will indicate short term bottoming, and turn bias back to the upside for stronger rise.
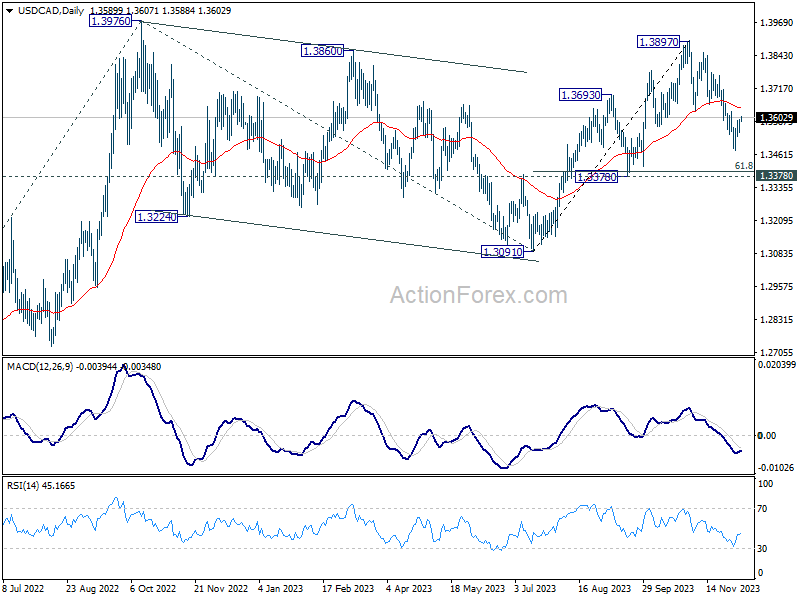
In the bigger picture, rise from 1.3091 is seen as the fifth leg of the whole rise from 1.2005 (2021 low). Further rally is expected as long as 1.3378 support holds, to 61.8% projection of 1.2401 to 1.3976 from 1.3091 at 1.4064. However, decisive break of 1.3378 will dampen this view and bring deeper fall back to 1.3091 instead.
EUR/GBP Daily Outlook
Daily Pivots: (S1) 0.8556; (P) 0.8568; (R1) 0.8582; More....
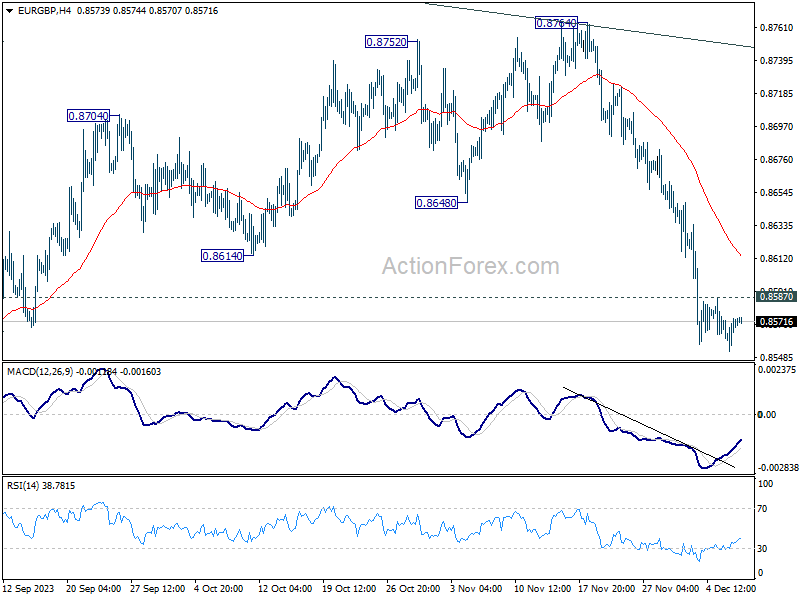
Intraday bias in EUR/GBP stays on the downside with 0.8587 minor resistance intact, despite loss of downside momentum. Current fall from 0.8764 should target a retest on 0.8491 low. Firm break there will resume larger down trend. On the upside, above 0.8587 minor resistance will turn intraday bias neutral and bring consolidations first, before staging another decline.
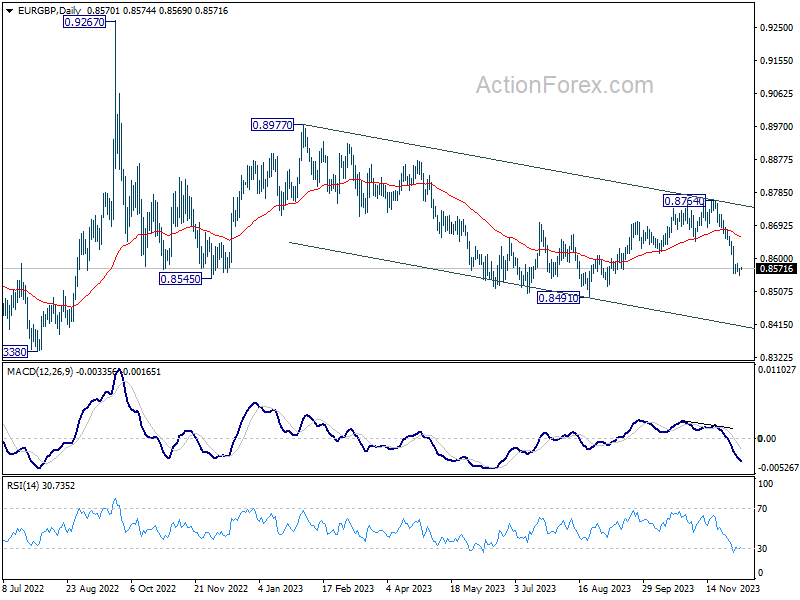
In the bigger picture, current development suggests that down trend from 0.9267 (2022 high) is still in progress. This decline is now seen as the third leg of the pattern from 0.9499 (2020 high). Break of 0.8201 will target 100% projection of 0.9499 to 0.8201 from 0.9267 at 0.7969. In any case, outlook will stay bearish as long as 0.8764 resistance holds.
EUR/AUD Daily Outlook
Daily Pivots: (S1) 1.6370; (P) 1.6427; (R1) 1.6493; More...
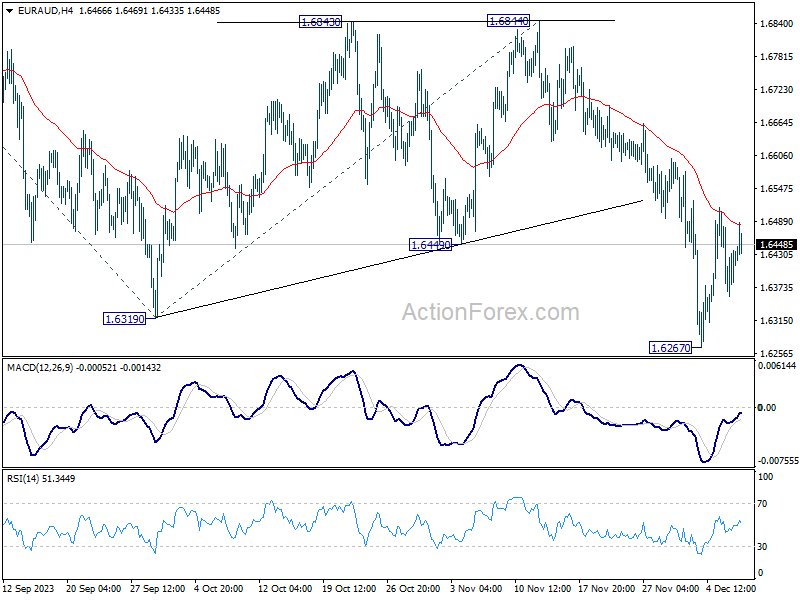
EUR/AUD is staying in consolidation from 1.6267 and intraday bias remains neutral at this point. Outlook stays bearish as long as 55 D EMA (now at 1.6593) holds. On the downside, break of 1.6267 will resume larger decline from 1.7062 to 100% projection of 1.7062 to 1.6319 from 1.6844 at 1.6106 next.
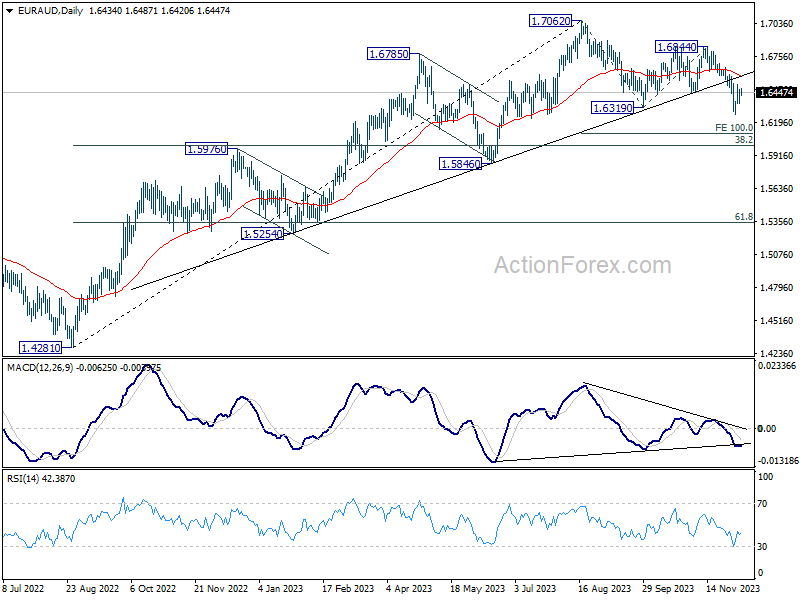
In the bigger picture, the break of medium term trend line support now suggests fall from 1.7062 correcting the whole up trend from 1.4281 (2022 low). Deeper decline would be seen to 38.2% retracement of 1.4281 to 1.7062 at 1.6000. Strong support could be seen there to bring rebound on first attempt. But risk will stay on the downside as long as 1.6844 resistance holds. Sustained break of 1.6000 would bring further fall to 61.8% retracement at 1.5343.
EUR/CHF Daily Outlook
Daily Pivots: (S1) 0.9405; (P) 0.9427; (R1) 0.9437; More...
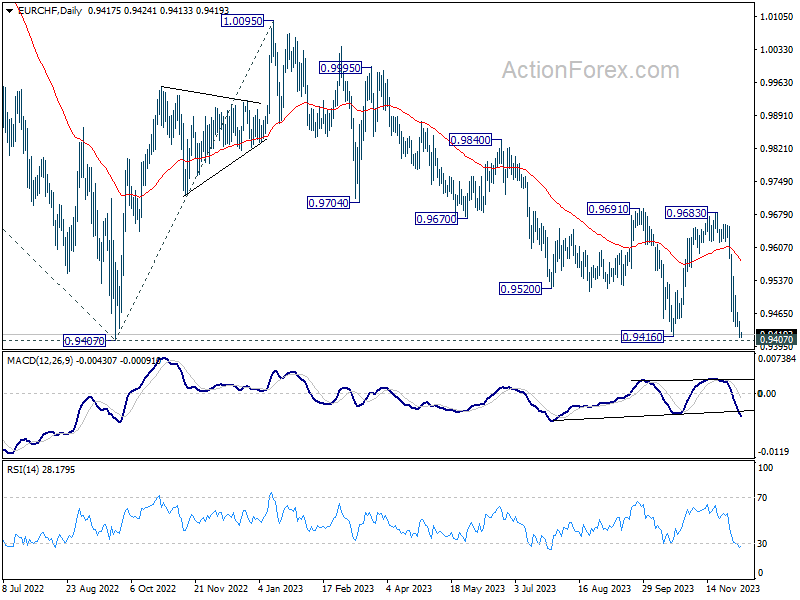
Intraday bias in EUR/CHF stays on the downside with focus on 0.9407 low. Decisive break there will confirm resumption of larger down trend. On the upside, above 0.9467 minor resistance will delay the bearish case and turn intraday bias neutral for consolidation first.
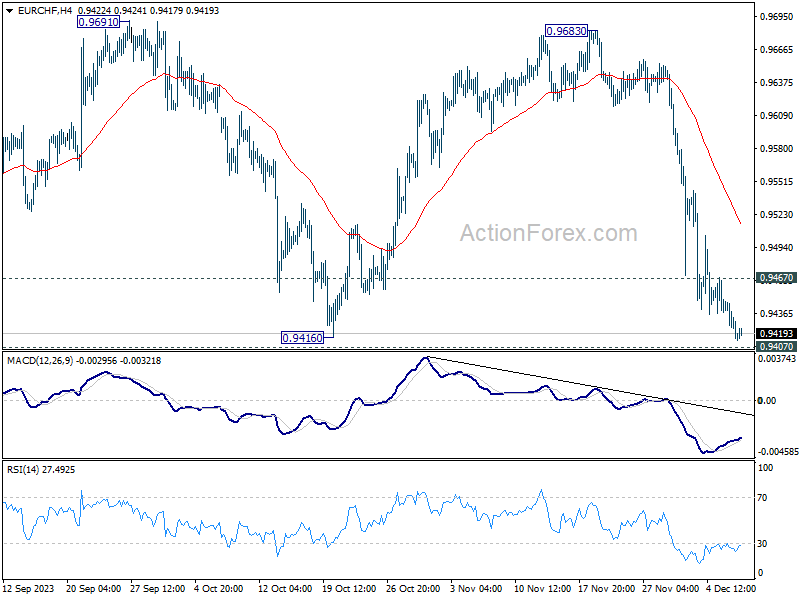
In the bigger picture, medium term outlook remains bearish as long as 0.9683 resistance holds. Firm break of 0.9407 (2022 low) will resume long term down trend. Next target will be 61.8% projection of 1.1149 to 0.9407 from 1.0095 at 0.9018.
EUR/JPY Daily Outlook
Daily Pivots: (S1) 158.26; (P) 158.69; (R1) 159.01; More..
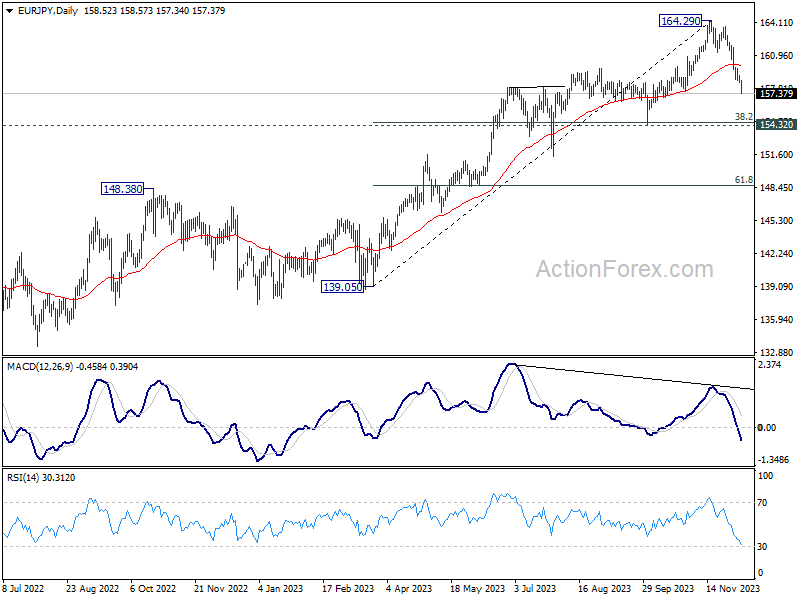
EUR/JPY's fall from 164.29 accelerates to as low as 157.34 so far. Intraday bias stays on the downside and deeper decline would be seen to 154.32 cluster support (38.2% retracement of 139.05 to 164.29 at 154.64). On the upside, above 158.56 minor resistance will turn intraday bias neutral and bring consolidations first, before staging another decline.
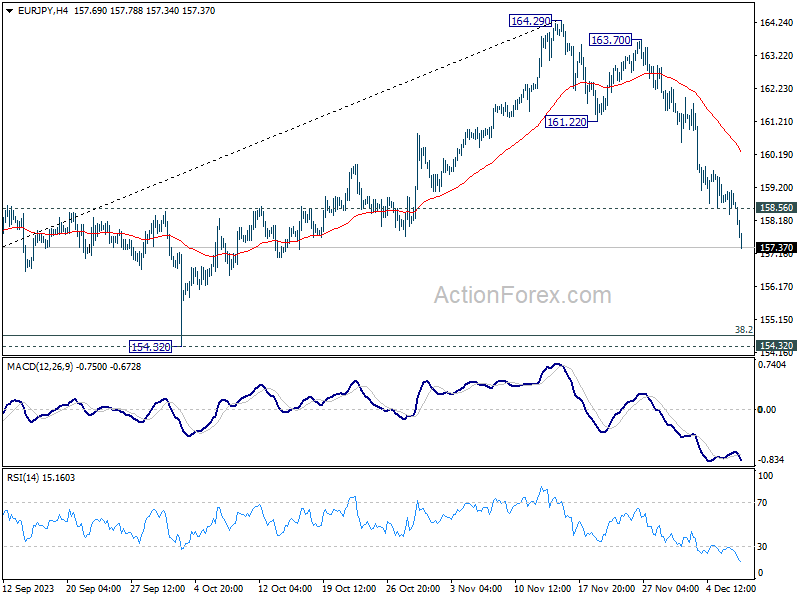
In the bigger picture, bearish divergence condition in 55 D EMA indicates that a medium term top could be formed at 164.29 already. Price actions from there are tentatively seen as a correction only. There is no clear sign that the up trend from 144.42 (2020 low) has completed yet. As long as 55 W EMA (now at 152.12) holds, another rally through 164.29 is still in favor as a later stage.