Sample Category Title
S&P 500 Analysis: Why Santa May Have Problems Rallying
It is traditionally believed that the Santa Rally occurs at the end of December and the first days of January, but according to many opinions it is acceptable to think that it begins much earlier.
At the beginning of December, the values of the S&P 500 index came close to the highs of the year in the area of 4,611, but have declined to date, forming a number of bearish signs:
→ the candle on November 29 has a long upper shadow — a sign of seller activity;
→ the same can be said about yesterday’s candle;
→ candles on December 1-4 form a bearish engulfing pattern;
→ all of the listed candles form a head-and-shoulders pattern (shown by the letters SHS).
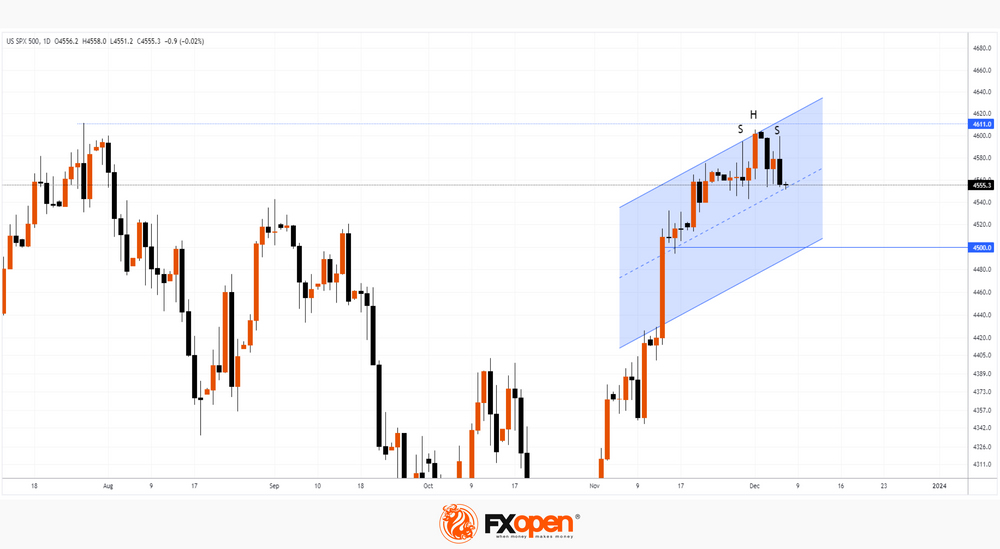
That is, the chart indicates activation of sellers near the yearly high — and this is a problem that can affect the so-called Santa Claus rally (the active channel, shown in blue, actualizes the theme associated with the rally).
The mentioned signs of increased supply forces give reason to assume that the values of the S&P 500 index may roll back to the lower border of the parallel channel, approximately the psychological level of 4,500, which can work as support. By the way, this level already provided support during the formation of consolidation on November 15-17.
Fundamentally, tomorrow's news (issued at 16:30 GMT+3) from the US labor market could serve as a trigger for a rollback. On the other hand, it is possible that the news will give impetus to the bulls to attack the level of the year's high.
Today's session will be interesting from the point of view of the market's ability to form a rebound from the median line of the blue channel. Price action will indicate current sentiment ahead of important news.
This article represents the opinion of the Companies operating under the FXOpen brand only. It is not to be construed as an offer, solicitation, or recommendation with respect to products and services provided by the Companies operating under the FXOpen brand, nor is it to be considered financial advice.
BTC and ETH Pause as Altcoins Take the Spotlight
Market picture
Cryptocurrency market capitalisation changed little at the end of trading on Wednesday, remaining close to $1.59 trillion (-0.14% d/d). But this modest result is a show of strength, given the pressure in equity markets, which intensified selling in Bitcoin and Ether.
Meanwhile, Altcoins got their chance to catch up with the leaders. For example, XRP added 2% in 24h) and Cardano added 4%.
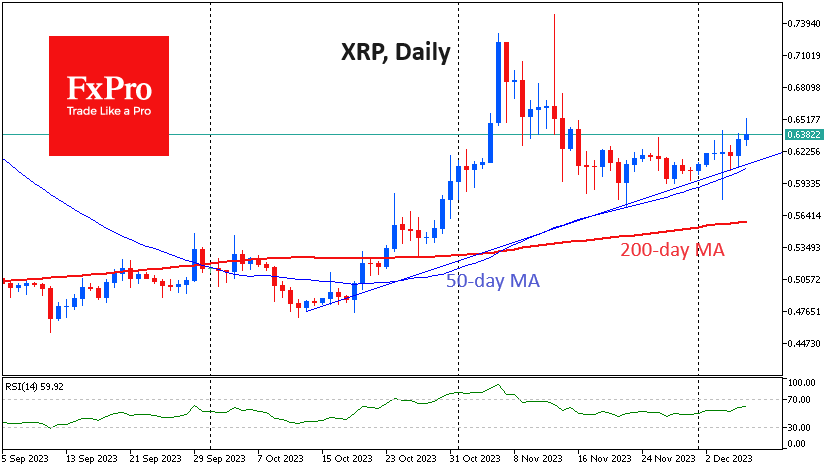
XRP has formed an upward trend since mid-October. An attempt to accelerate growth last month failed, but it also failed to break this line at the start of December. In addition to the trend line, the 50-day moving average, the touch of which stops the sell-off for the last 50 days, also turned out to be on the side of buyers.
News background
Since the beginning of this year, the number of BTC addresses holding the cryptocurrency has increased by 20 per cent to more than 50 million, Santiment noted. BTC’s growth is fuelled by the drop of its supply on exchanges to a six-year low.
Bitcoin has moved into the acceleration phase of the bull market, but the situation remains largely within its early stages, Glassnode noted. BTC’s 142% YTD growth is consistent with the 2015-2017 and 2018-2022 cycles. Most bitcoin investors have entered the plus side, with several on-chain indicators moving into enthusiastic stage territory in an uptrend.
Coinbase crypto exchange CEO Brian Armstrong called bitcoin a great alternative to the US dollar and other fiat currencies. According to him, BTC can be an antidote to inflation.
The US SEC has asked the court to clarify whether the crypto assets sold by Terraform Labs are unregistered securities. The regulator strongly believes that these cryptocurrencies meet the criteria of securities.
With traditional finance out of reach, cryptocurrencies act as an alternative, especially in emerging markets and younger populations, the ECB study said.
Dogecoin (DOGE), the most successful meme cryptocurrency, is ten years old. It was created by programmer Billy Marcus and engineer Jackson Palmer as a parody of Bitcoin. DOGE has jumped 16% this week, hitting highs over the past year above $0.106.
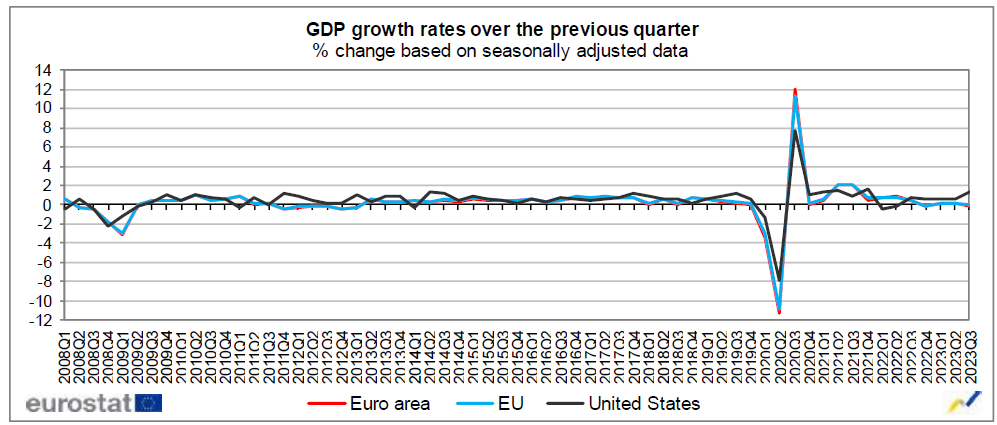
Eurozone GDP growth finalized at 0.1% qoq in Q3
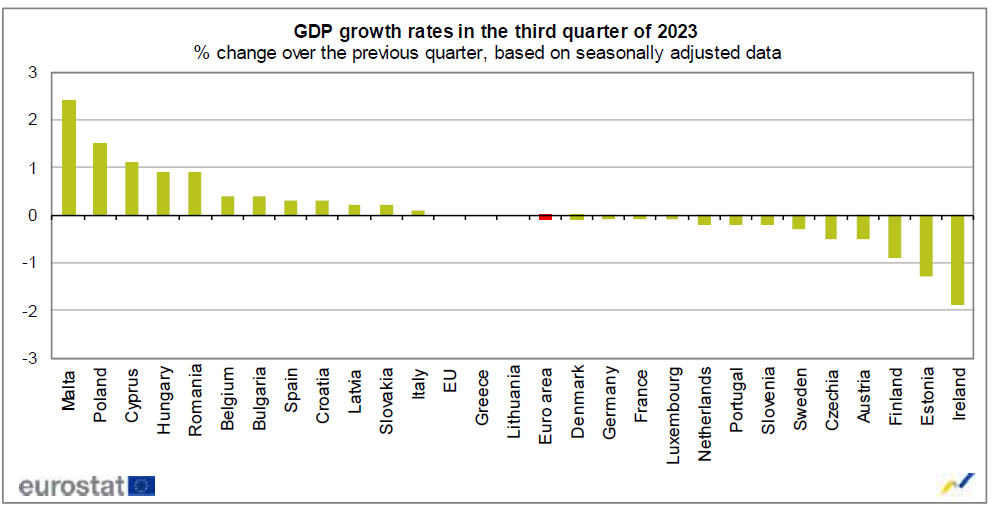
Eurozone GDP growth in Q3 was finalized at 0.1% qoq. Household final consumption expenditure increased by 0.3%. Government final consumption expenditure increased by 0.3% Gross fixed capital formation remained stable. Exports decreased by -1.1%. Imports decreased by -1.2%.
EU GDP was flat qoq. Malta (+2.4%) recorded the highest increase of GDP compared to the previous quarter, followed by Poland (+1.5%) and Cyprus (+1.1%). The highest decreases were observed in Ireland (-1.9%), Estonia (-1.3%) and Finland (-0.9%).
Nasdaq 100 Technical: Impending Corrective Decline Within Major Uptrend
- Medium-term breadth condition (% of Nasdaq 100 stocks above 50-day MA) has reached an overbought condition that led to significant corrective declines in past occasions on 16 August 2022, 1 December 2022, and 19 July 2023.
- Broke below the 20-day moving average.
- Watch the 15,690 near-term support as a potential downside trigger.
The price actions of the US Nas 100 Index (a proxy for the Nasdaq 100 futures) have inched higher since our prior publication and tested the first resistance of 19,160 last Wednesday, 29 November, and failed to make any breakthrough above it so far.
Several technical elements have not flashed warning signs of an impending potential corrective decline to retrace a portion of the prior five-week rally of 15% from the 26 October 2023 low of 14,060.
Overstretched medium-term breadth condition
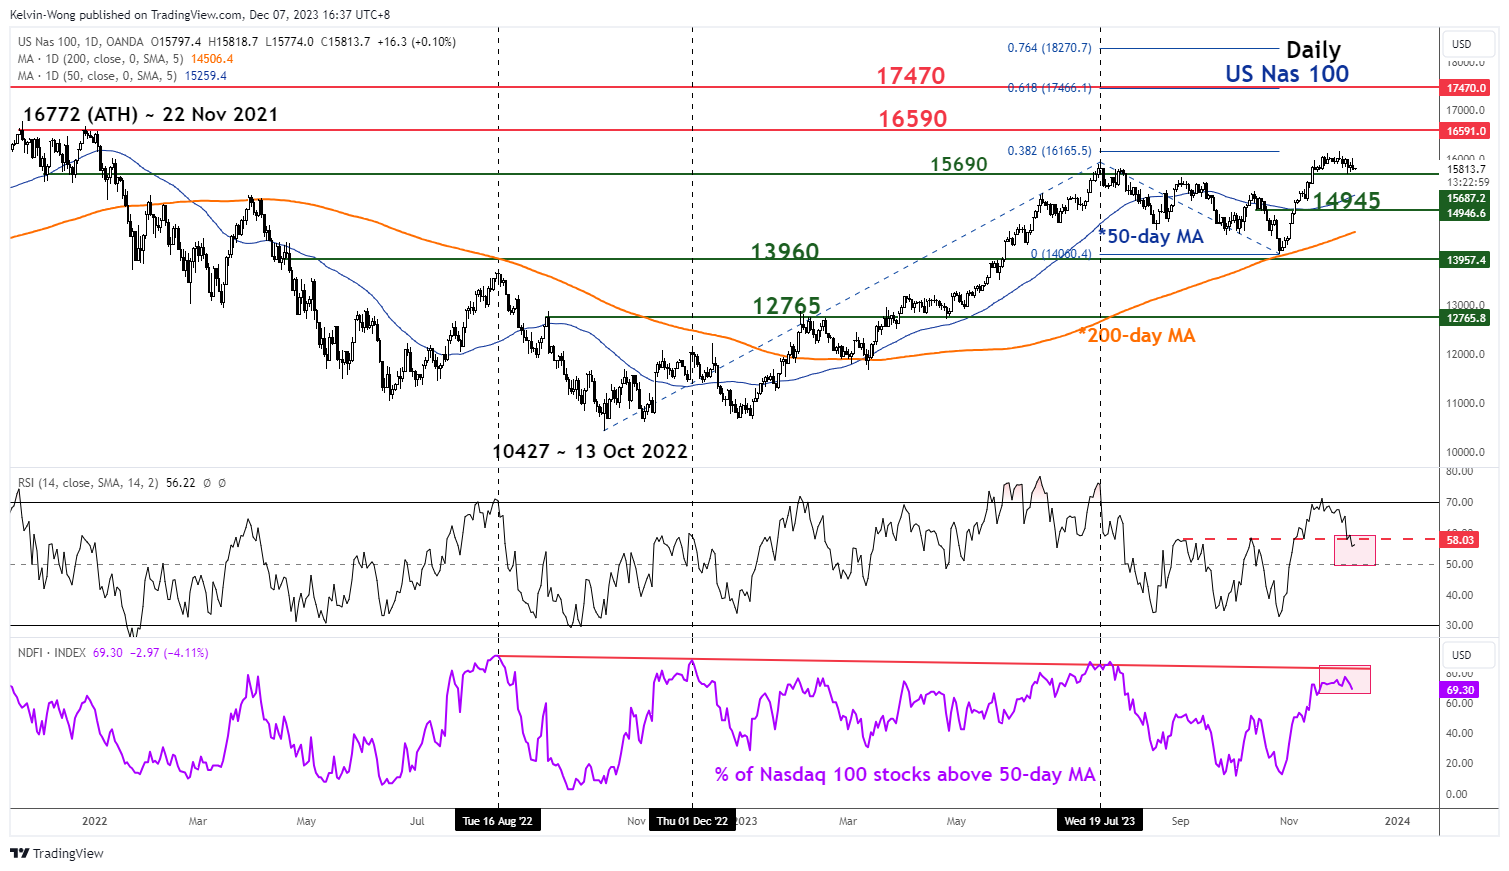
Fig 1: US Nas 100 medium-term trend as of 7 Dec 2023 (Source: TradingView, click to enlarge chart)
The rise in the number of Nasdaq 100 component stocks that are trading above their respective medium-term 50-day moving averages has reached close to overstretched/overbought condition at 84% (recorded 77% on 1 December 2023) where past price actions of the US Nasdaq 100 Index has reacted negatively that led to significant corrective pullbacks on 16 August 2022, 1 December 2022, and 19 July 2023.
In addition, the daily RSI momentum indicator has broken below the parallel support at the 58 level after it reached an overbought region on 20 November 2023 which also advocates a potential corrective pull-back in price actions.
Broke below 20-day moving average
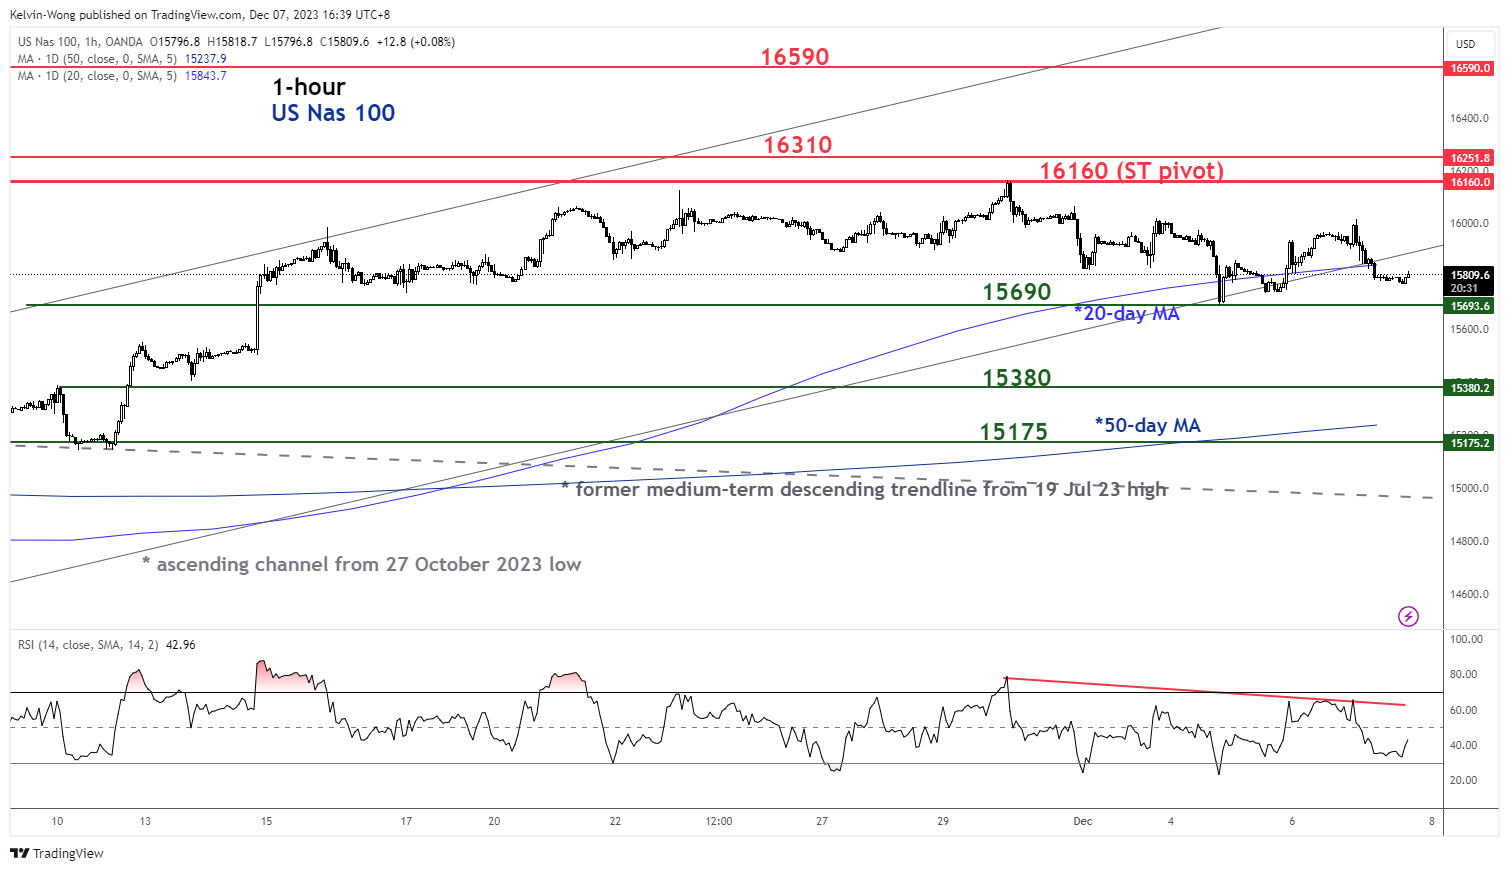
Fig 2: US Nas 100 minor short-term trend as of 7 Dec 2023 (Source: TradingView, click to enlarge chart)
Current price actions have broken below the 20-day moving average and the ascending channel support from 27 October 2023 low.
In the short-term, watch the 16,160 key short-term pivotal resistance and a break below 15,690 exposes the next intermediate supports at 15,380 and 15,175 (also the 50-day moving average & close to the 50% Fibonacci retracement of the recent rally from 26 October 2023 low to 29 November 2023 high).
On the other hand, a clearance above 16,160 revives the bullish tone to see the next intermediate resistances coming in at 16,310 and 16,590 (major swing high areas around the 16,772 all-time high level printed on 22 November 2021).
USD/JPY: Japanese Yen Surges on Signals that BoJ is About to Exit Ultra-Loose Policy
USDJPY accelerated lower (down 1.4% in Asian/early European session) on Thursday, driven by growing market expectations that the Bank of Japan will soon start exiting its long lasting ultra-low monetary policy, which strongly boosts demand for yen.
On the other hand, the US Federal Reserve is likely done with tightening and markets speculate that the US central bank may start cutting rates as early as March 2024.
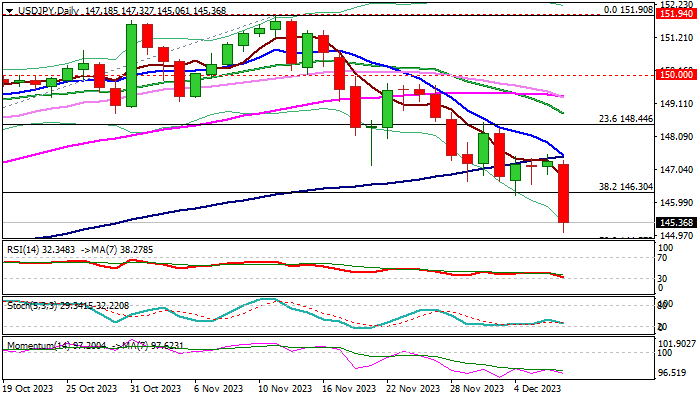
Fresh weakness broke below pivotal Fibo support at 146.30 (38.2% of 137.23/151.90) which contained attacks earlier this week and kept bears on hold for consolidation.
Technical picture is getting more bearish on daily chart, as MA’s are in bearish configuration and created a number of bear-crosses and 14-d momentum turned south, deeply in the negative territory, validating bearish near-term outlook.
Bears eye next target at 144.57 (50% of 137.23/151.90) and could travel much lower in such environment, with limited corrections expected to provide better selling levels.
Broken Fibo 38.32% (146.30) reverts to resistance which should cap and keep bears intact.
Only return above converged 10/100DMA’s would harm bears and neutralize downside risk.
Res: 146.30; 147.00; 147.45; 148.44.
Sup: 145.00; 144.57; 144.00; 142.84.
USDJPY’s 2023 Performance is Positive
- USDJPY remains above uptrend line
- Bearish correction may be on the cards
- RSI and stochastic indicate negative move
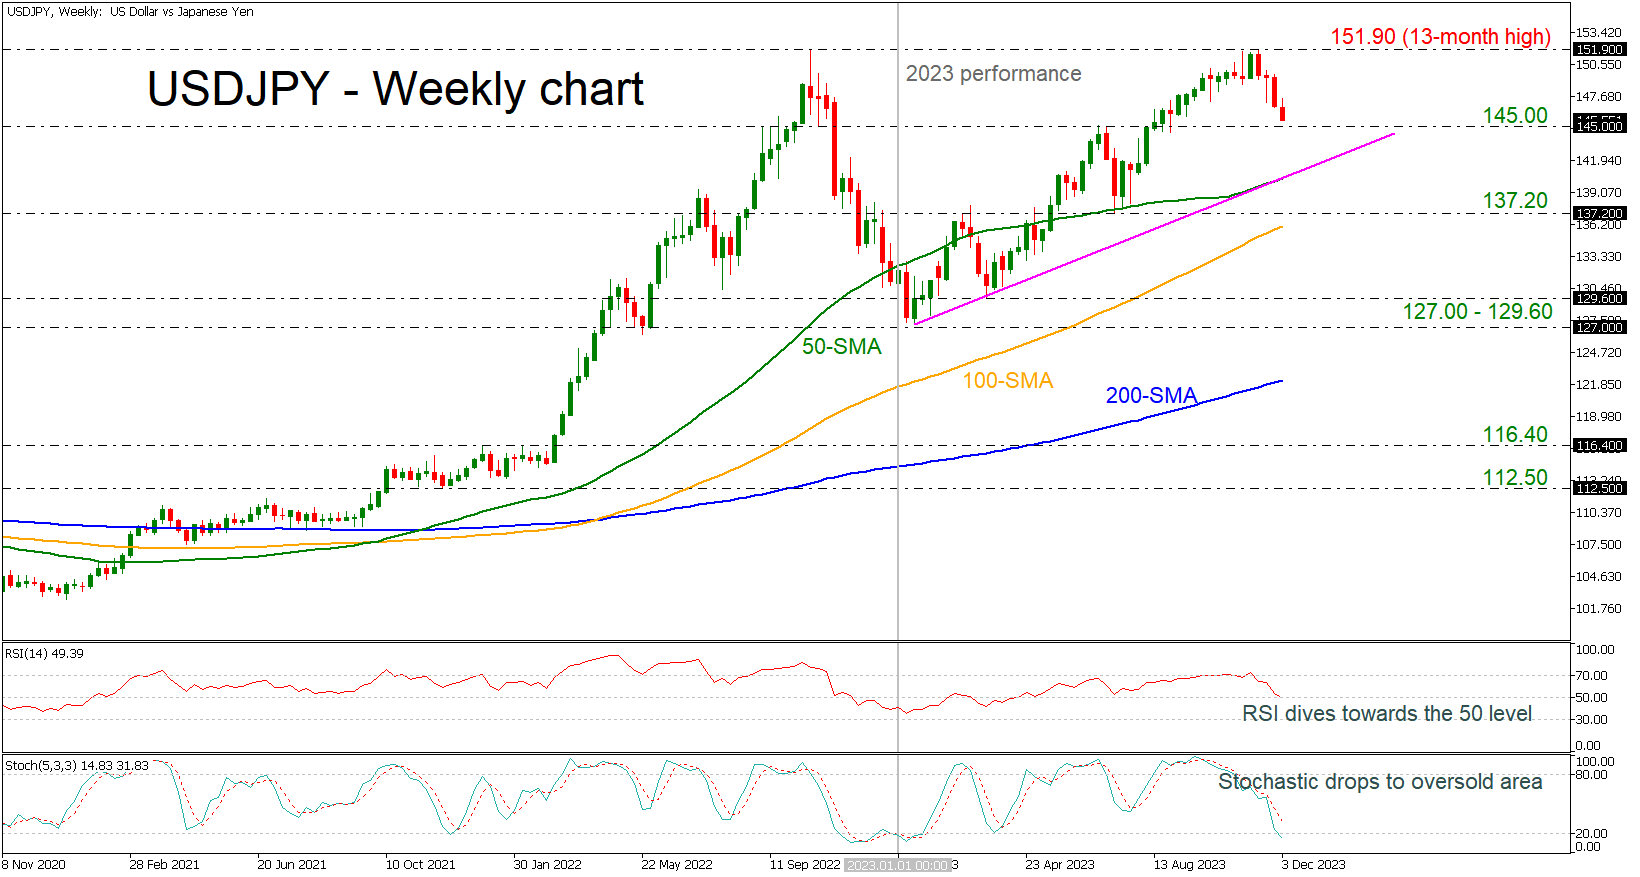
USDJPY has been in ascending movement since the beginning of 2023, but now is creating the fourth consecutive red week after the pullback off the 13-month high of 151.90.
Technically, the bulls might still be in the town as the market is developing above the long-term uptrend line. However, the technical indicators are suggesting a bearish correction, mirroring the latest downward move in price. The RSI is diving towards the neutral threshold of 50, while the stochastic is moving towards the oversold territory.
In the event the price stays resilient above the 145.00 handle, the bulls might push for a close above the 13-month peak of 151.90. Therefore, a successful move higher could immediately shift the attention to the April 1990 peak at 160.70, only if the market surpasses the next psychological levels such as, 152.00 and 155.00.
On the other hand, if downside pressure continues, selling forces could intensify towards the 145.00 support. Then, additional losses from there could retest the uptrend line, which overlaps with the 50-day simple moving average (SMA) at 140.00. A move south below this hurdle could open the way for a negative structure until 137.20.
In a nutshell, USDJPY may remain supported in the coming sessions, though room for improvement could be limited before the next bearish round takes place above the uptrend line.
WTI Oil Futures: Is the Sell-off Overdone?
- WTI oil futures test critical 2023 support zone
- Technical signals point to oversold levels
- Sellers await a weekly close below 70
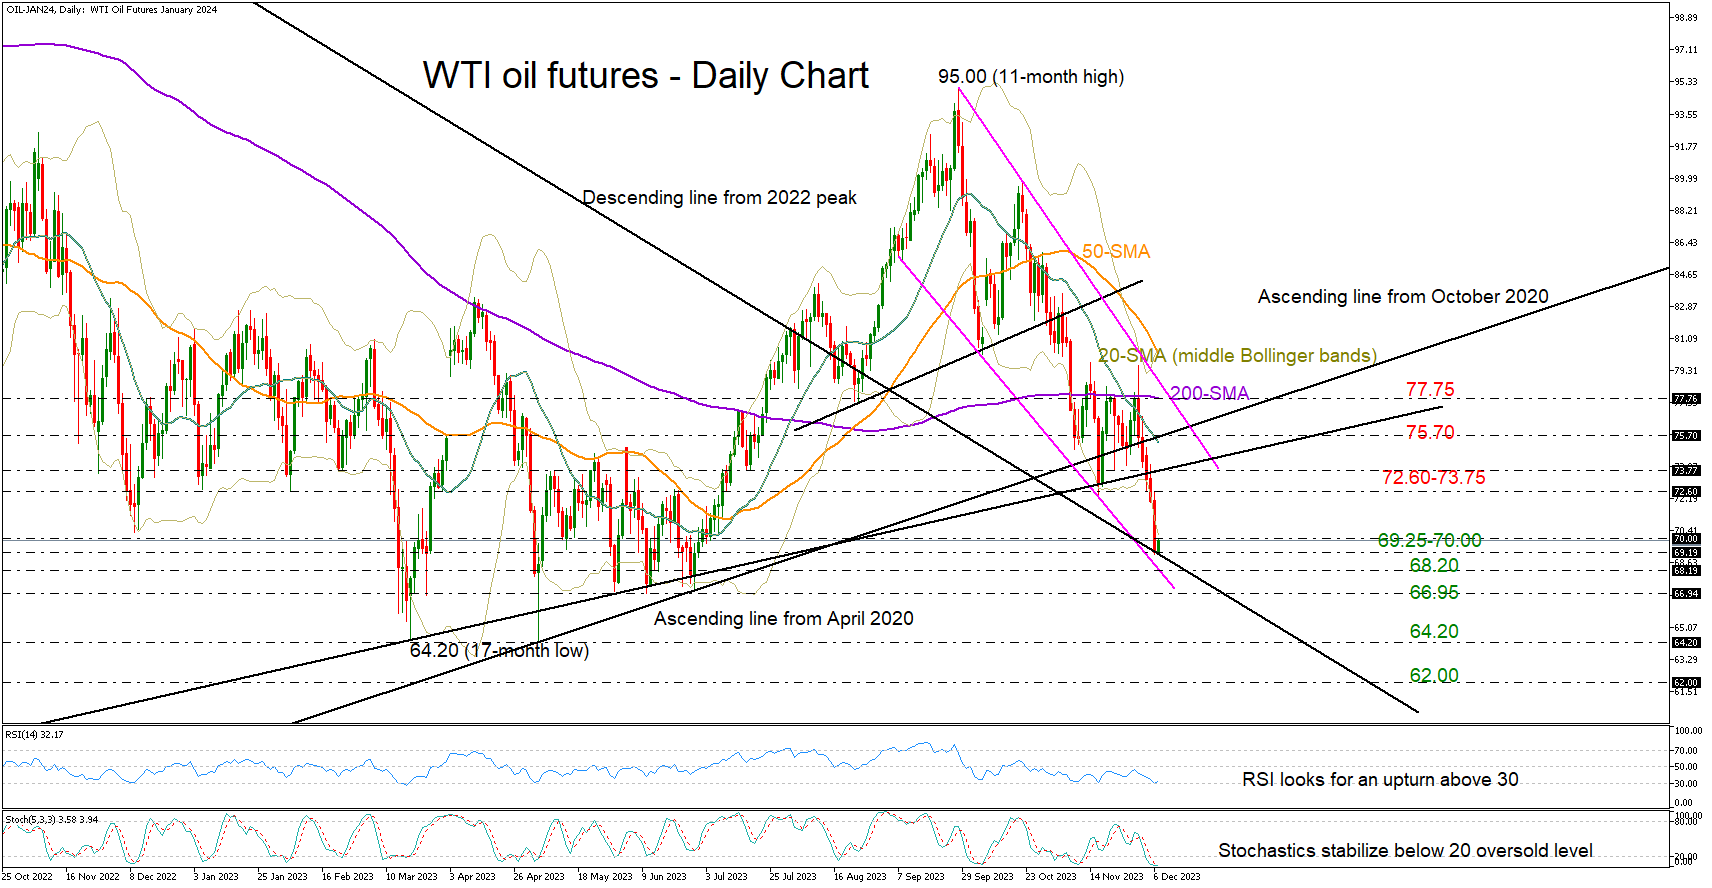
WTI oil futures were sold dramatically on Wednesday, extending their weekly losses to a more than a four-month low of 69.10.
The bears are leading for the seventh consecutive week, increasing speculation that a bullish correction could soon take place as the RSI and the stochastic oscillators are looking for an upside reversal near their oversold levels. Moreover, the market action is developing below the lower Bollinger band, suggesting that the latest downfall might be overdone.
It’s worthy to note that the market is currently testing the critical 200-period simple moving average (SMA) in the weekly chart at 70. The line paused the downtrend from 14-year highs in March and prevented a negative outlook revision in 2023. Hence, sellers might stay patient until a clear close below that threshold is achieved.
Meanwhile, in the daily timeframe, the price is struggling to crawl back above 70. If downside pressures dominate, the slide could halt immediately around the falling line from September at 68.20. The extension of the descending line drawn from the 2022 top could also block the bears around the important March-June 2023 floor of 66.95. Should the bear run continue, all the attention will turn to the 2023 base of 64.20 ahead of the 2021 floor of 62.00.
In the bullish scenario, where the recovery stretches above 70.00, buyers might drive towards the 72.60-73.75 constraining region. The ascending line from the October 2020 low is adding some credence to the area, while slightly higher, the bulls will need to climb above the 20-day SMA and the upward-sloping line from April 2020 at 75.70 to gain direct access to the 200-day SMA at 77.75.
All in all, WTI oil futures are looking oversold near a major support area after an aggressive decline. A continuation below 70 could add more fuel to the bearish wave.
Japanese Yen Outperforms This Morning
Markets
Yesterday’s slightly disappointing US ADP job report reverberated through the long end of the yield curve in particular. Maturities from 10 year to 30 year shed between 6.1 and 8.9 bps. The 10-y tenor dropped below support at 4.13% (50% retracement on the 2023 rise) but held above the next reference that pops up shortly after at 4.09%. Declines in the 5-7y bucket amounted to 3.1 and 5 bps while the front even managed to eke out a marginal 1.6 bps gain. It could mean that current pricing for Fed rate cuts (66% chance for a start in March with a cumulative 125 bps discounted by end 2024) went far enough. We don’t want to draw that conclusion just yet with Friday’s official payrolls report still due. German yields trailed US peers in a similar shift of the curve. Moves varied between +1 bp up front and -7.5 bps at the long end. Gilts outperformed. As bets for a quick and sharp Fed/ECB pivot rise, markets find it increasingly harder to assume the Bank of England to buck the trend. Money markets are currently pricing in a first full rate cut in June compared to August last week with a 60% chance for a move in May. We immediately shift towards Asian dealings this morning to dive into the Japanese bond market. JGB’s hugely underperform, with extensions to US Treasuries, following a triple whammy. Japanese yields rally 6.2 (2-y) to 12.6 (10-y) bps. It started with BoJ deputy governor Himino yesterday portraying the different scenarios in case the era of negative interest rates would be over. He indicated that the first rate hike since 2007 wouldn’t be as harmful as some fear. Governor Ueda in an appearance before parliament this morning flagged several options about which policy rate to target upon ending the sub zero rate experiment. Simply talking about hikes fuels market speculation about actually doing so, turning the December meeting into a live one. The third blow was directly related to bets for a BoJ policy twist with a 30-year bond auction completely flopping. Bid-to-cover dropped to the lowest since 2015 with the tail the biggest on record. The Japanese yen outperforms this morning, pushing USD/JPY to the lowest (146.32) since early September. EUR/JPY extends a losing streak to nine days with the pair currently trading at 157.45. Moves in other currency pairs are muted. EUR/USD is trading stable after a late-session hit yesterday pushed the pair sub 1.08 towards 1.076. Sterling’s momentum eased. EUR/GBP bounced off support at 0.8557 to finish at 0.857. Today’s uninspiring economic calendar paves the way for technical trading going into tomorrow’s payrolls as the final input for the Fed’s policy meeting next week.
News & Views
The National bank of Poland (NBP) yesterday left its policy rate as expected unchanged at 5.75%. Activity remains low, despite increasing again in Q3. The labour market remains strong but employment growth slows. Inflation slowed to 6.5% in November, which the NBP mainly attributes to a decline in core inflation. In underpinning the decision, the NBP stated that ‘the adjustment in the NBP interest rates introduced in previous months, together with uncertainty about a future course of fiscal and regulatory policies and their impact on inflation, the Council decided to keep the NBP interest rates unchanged’. As the political situation (formation of a new government is in the early stages) apparently is an important factor the NBP, the policy rate might stay stable through early 2024. The prospect of a guarded easing cycle and a new EU-friendly government keeps the zloty near the strongest levels since the corona crisis (currently EUR/PLN 4.32). NBP governor Glapinski holds a press conference this afternoon.
The Bank of Canada also kept the policy rate steady at 5.0% yesterday. The BoC indicated that it is still concerned about the risks to the inflation outlook and that it remains prepared to raise to policy rate further if needed. However, in its economic assessment, the BoC acknowledges that higher interest rates are clearly restraining spending while the labour market continues to ease as job creation has been slower than labour force growth. The BoC assumes that this quarter, the economy is no longer in excess demand. Inflation eased to 3.1% Y/Y in October. As is the case for most other central banks of developed countries, including the US, markets ‘are sure’ that the BoC has finished its hiking cycle and even see a >50% chance of the BoC starting its easing cycle in March of next year. The BoC decision had no noticeable impact on the Canadian dollar. USD/CAD followed the broader USD rebound closing near 1.36. In a broader perspective the loonie is holding op rather well considering the decline in the oil price.
USD/JPY Daily Outlook
Daily Pivots: (S1) 146.97; (P) 147.23; (R1) 147.57; More...
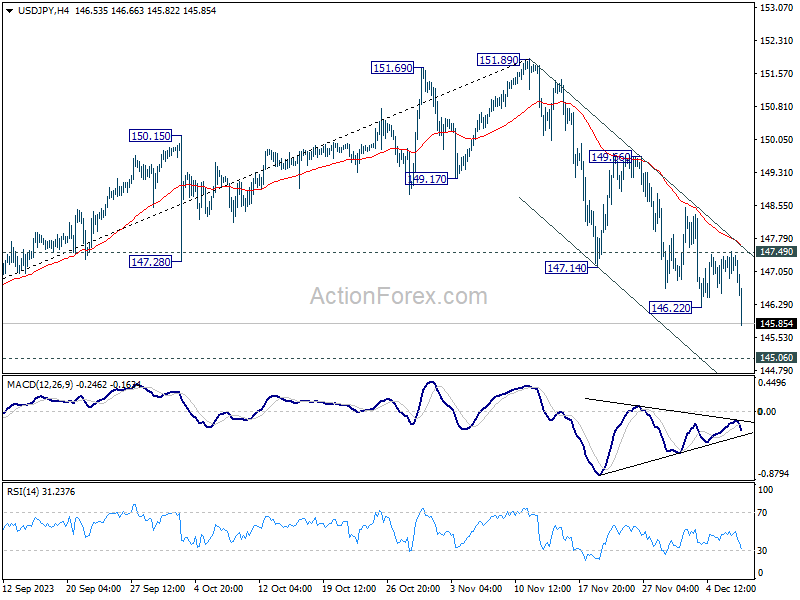
USD/JPY's fall from 151.89 resumed by breaking through 146.22 today. Intraday bias is back on the downside for 145.06 key support. Decisive break there will carry larger bearish implication and target 142.45 fibonacci level next. On the upside, break of 147.49 minor resistance will turn intraday bias neutral and bring consolidations first.
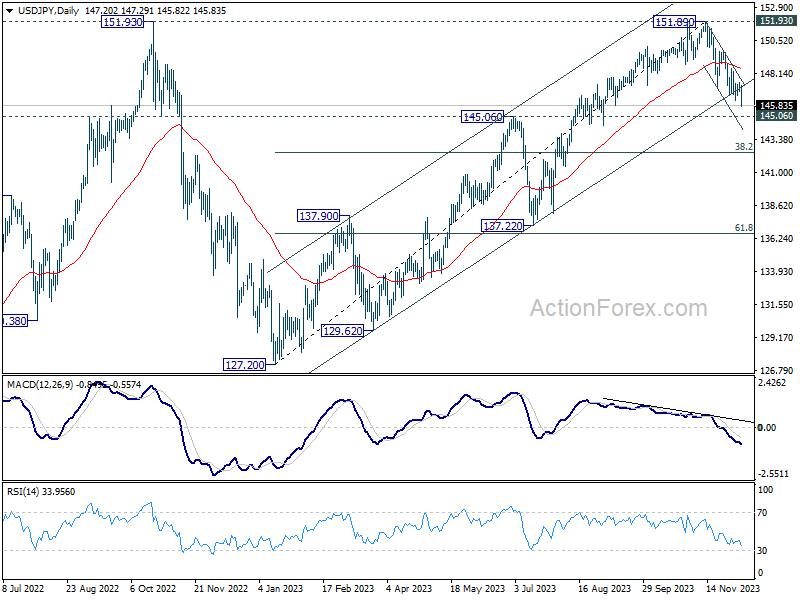
In the bigger picture, rise from 127.20 (2023 low) is seen as the second leg of the pattern from 151.93 (2022 high). Decisive break of 145.06 resistance turned support will confirm that this second leg has completed, after rejection by 151.93. Deeper fall would be seen through 38.2% retracement of 127.20 to 151.89 at 142.45 to 61.8% retracement at 136.63. Nevertheless strong bounce from 145.06 will retain medium term bullishness for another test on 151.93 at a later stage.
EUR/USD Daily Outlook
Daily Pivots: (S1) 1.0747; (P) 1.0776; (R1) 1.0792; More...
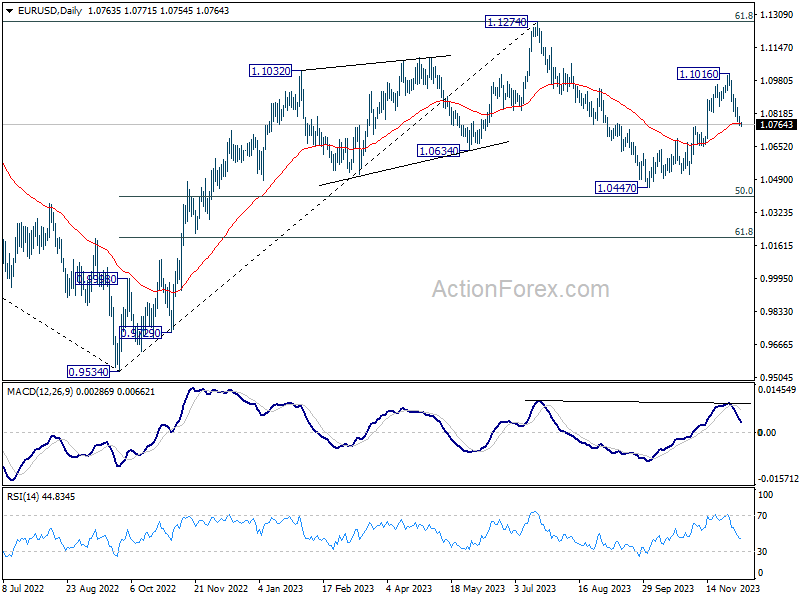
Intraday bias in EUR/USD stays on the downside for the moment, as fall from 1.1016 short term top is in progress. Sustained break of 55 D EMA (now at 1.0770) will pave the way to retest 1.0447 support. On the upside, above 1.0804 minor resistance will turn intraday bias neutral first. But risk will stay on the downside as long as 1.1016 resistance holds, in case of recovery.
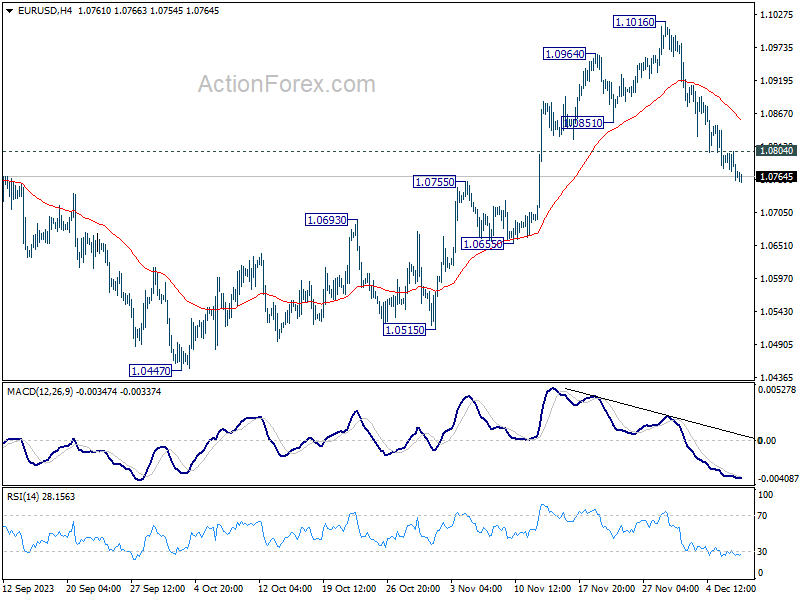
In the bigger picture, price actions from 1.1274 are viewed as a corrective pattern to rise from 0.9534 (2022 low). Rise from 1.0447 is tentatively seen as the second leg. Hence while further rally could be seen, upside should be limited by 1.1274 to bring the third leg of the pattern. Meanwhile, sustained break of 55 D EMA will argue that the third leg has already started for 1.0447 and below.