Sample Category Title
AUD/USD Recovery Could Remain Capped Near 0.6450
Key Highlights
- AUD/USD declined below the 0.6450 and 0.6440 support levels.
- A major bullish trend line is forming with support near 0.6400 on the 4-hour chart.
- EUR/USD is showing heavy bearish signs below 1.0650.
- Gold prices moved lower and traded below the $1,920 support.
AUD/USD Technical Analysis
The Aussie Dollar started a fresh decline from the 0.6515 resistance against the US Dollar. AUD/USD traded below the 0.6450 support to enter a bearish zone.
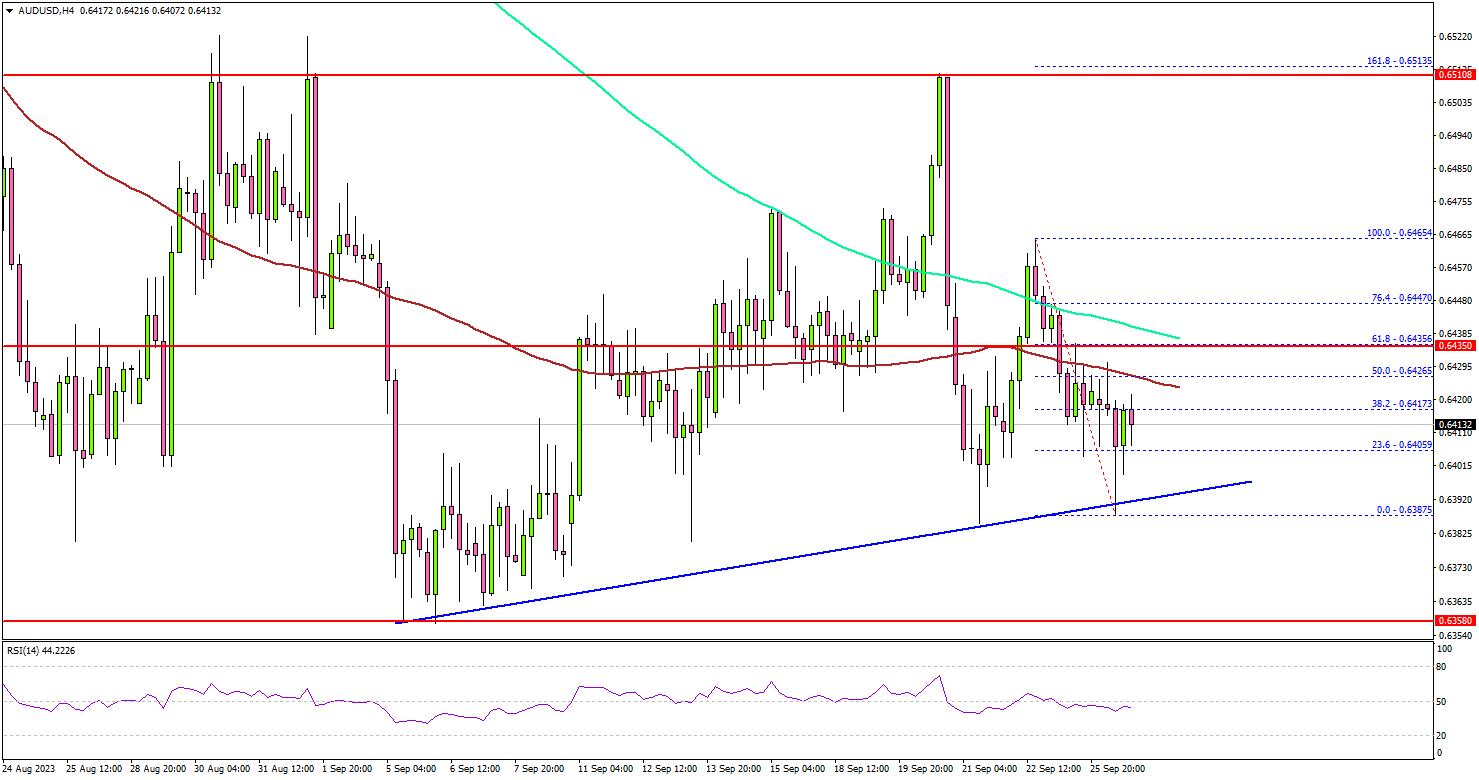
Looking at the 4-hour chart, the pair settled below the 0.6440 level, the 100 simple moving average (red, 4 hours), and the 200 simple moving average (green, 4 hours).
It traded as low as 0.6387 and recently started a minor upside correction. If there is a recovery wave, it could face resistance near the 0.6425 level and the 100 simple moving average (red, 4 hours).
The first major resistance is near the 0.6440 zone and the 200 simple moving average (green, 4 hours). The main resistance is now forming near the 0.6450 level. A close above 0.6450 could start a steady increase toward 0.6500.
Any more gains might send AUD/USD toward the 0.6550 resistance. On the downside, initial support is near the 0.6400 level. There is also a major bullish trend line forming with support near 0.6400 on the same chart.
The next key support is seen near the 0.6385 level, below which it could test 0.6360. If there is a move below 0.6360, the pair could dive toward 0.6320. Any more losses might send the pair toward the 0.6200 level.
Looking at EUR/USD, the pair remained in a bearish zone and might face a strong selling interest unless it recovers above 1.0650.
Economic Releases
- US Durable Goods Orders for August 2023 – Forecast -0.5% versus -5.2% previous.
- US Durable Goods Orders Ex Transportation for August 2023 – Forecast +0.1% versus +0.4% previous.
NZDJPY Rally from Extreme Area and Bullish Sequence
In this blog, we will take a look at the reaction from extreme area in NZDJPY, how buyers appeared in the area as expected and produced a strong reaction higher. We will look at how this area was calculated and also look at the current Elliott wave structure of this Yen cross. We will discuss the current Elliott Wave structure and short-term incomplete sequence that has been created and what it could lead to going forward.
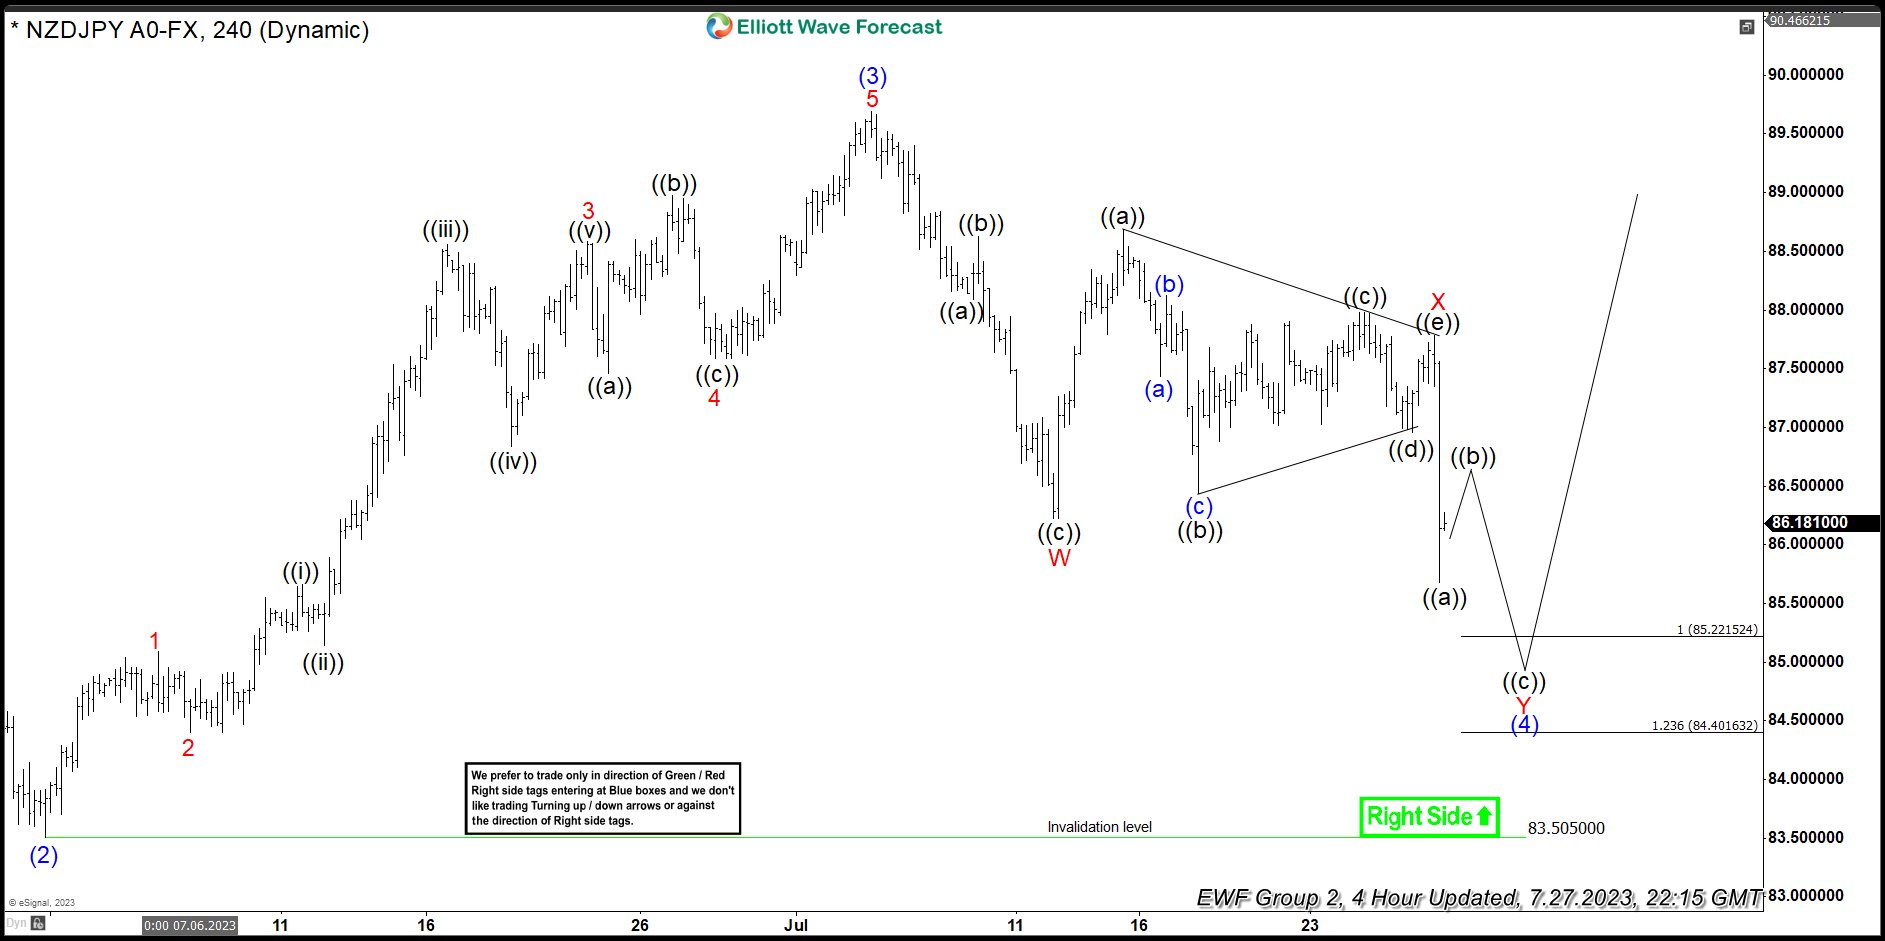
NZDJPY July 27, 4 Hour Elliott Wave Analysis
The chart below shows the pair to be in a double three Elliott wave structure with some more downside needed to complete the structure. It shows an extreme area (100 – 123.6 Fibonacci extension) between 85.22 – 84.40 where we expected the correction to end and buyers to appear to resume the rally or produce 3 waves reaction higher at least.
NZDJPY September 26, Daily Elliott Wave Analysis
The chart below is a daily chart and shows the pair reached the extreme area between 85.22 – 84.40 and turned higher sharply. It rallied to 88.59 which we have labelled as wave 1 of the new cycle. This was followed by a pullback to 85.79 which we have labeled as wave 2. It started rallying again and it has now broken above 88.59 peak which creates a short-term incomplete sequence higher from 7.28.2023 low against 8.21.2023 low and has a 100 – 161.8% Fibonacci extension target area coming between 89.44 – 91.68.
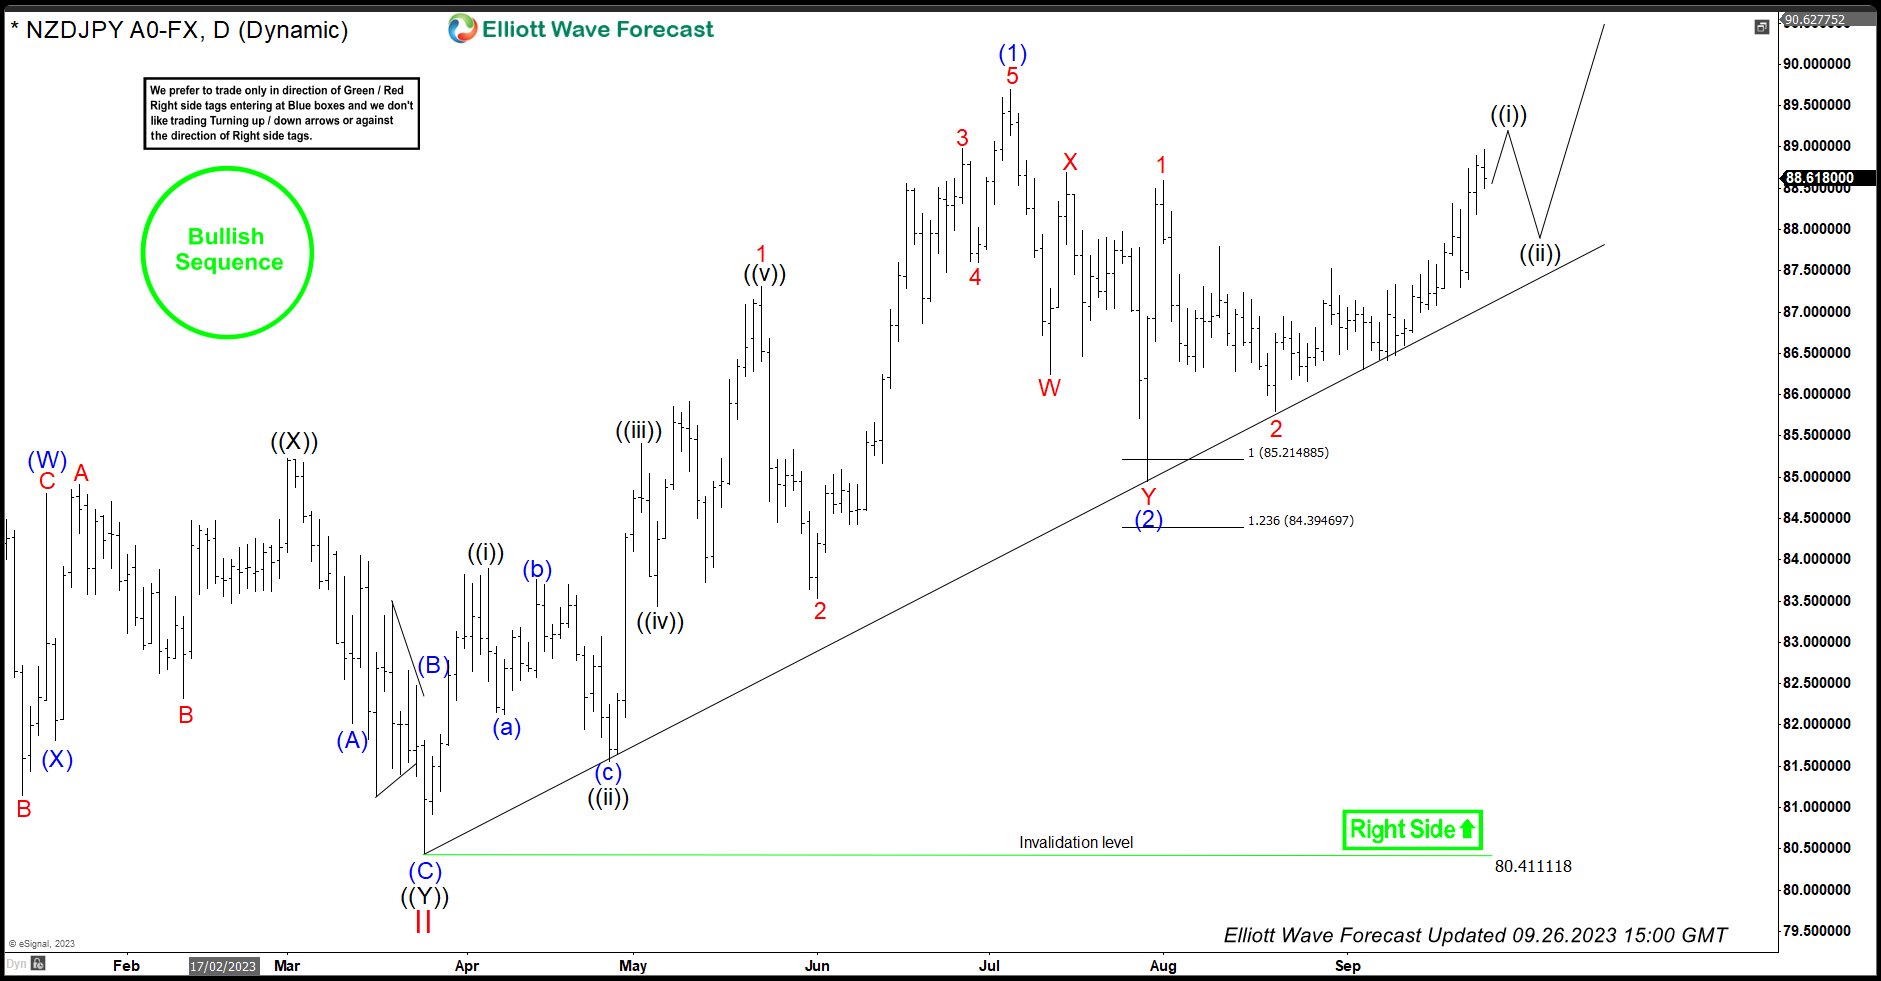
Blue wave (1) peak was seen on 7.5.2023 @ 89.69, a break of this level will create a larger bullish sequence up from 3.24.2023 low against 7.28.2023 low and confirm further upside in NZDJPY and other Yen crosses with 61.8% Fibonacci extension coming at 90.66 and 100% Fibonacci extension coming at 94.20. We don’t like selling the pair and near-term dips should remain supported in 3, 7 or 11 swings for extension higher toward 89.44. Once 7.5.2023 peak breaks, that will create a 4 hour bullish sequence and offer buying opportunities again in the dips in 3, 7 or 11 swings.
[VIDEO]: NZDJPY Reaction from Extreme Area and Incomplete Sequence
https://www.youtube.com/watch?v=mjlZk5WfZE4
Dow Jones index Wave Analysis
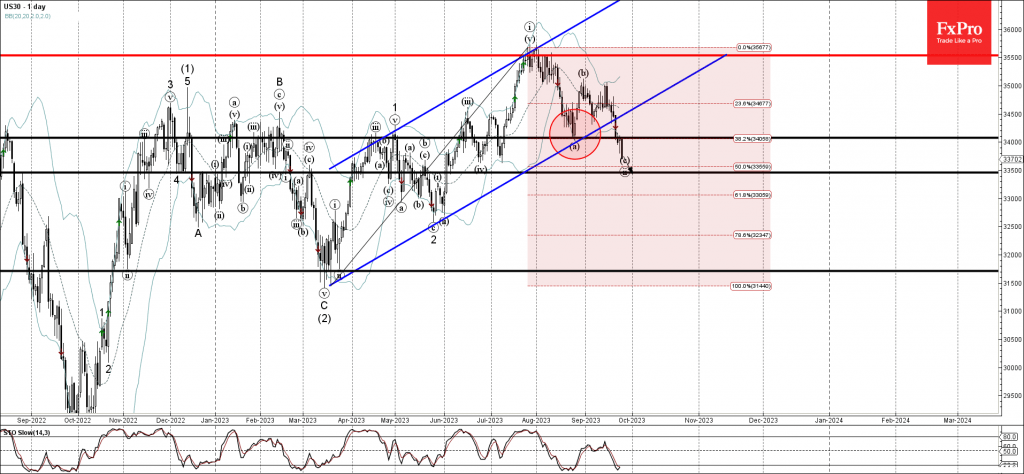
- Dow Jones index broke key support level 34000.00
- Likely to fall to support level 33500.00
Dow Jones index recently broke key support level 34000.00 (low of the previous wave a) intersecting with the 38.2% Fibonacci correction of the previous upward impulse from March.
The breakout of the support level 34000.00 was preceded by the breakout of the daily up channel from March – which accelerated the active wave ii.
Dow Jones index can be expected to fall further toward the next support level 33500.00, target for the completion of the active wave ii.
AUDCAD Wave Analysis
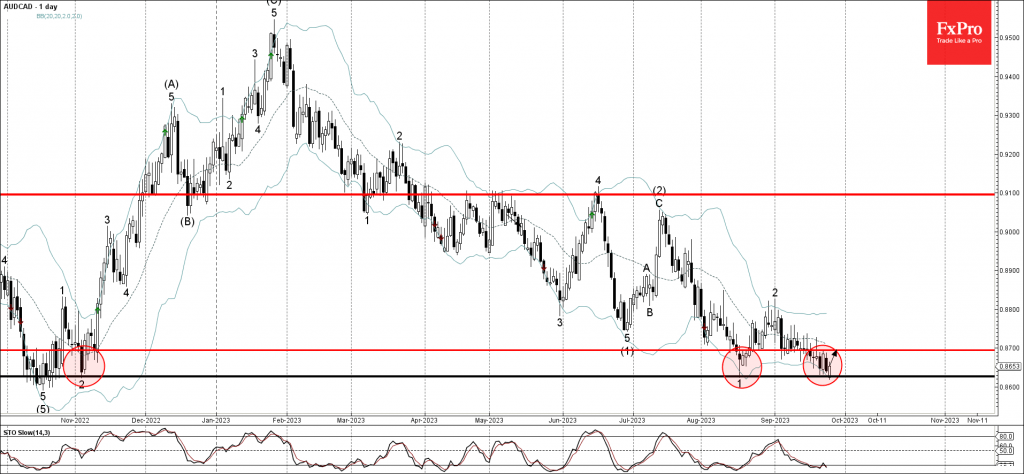
- AUDCAD reversed from key support level 0.8630
- Likely to rise to resistance level 0.8700
AUDCAD recently reversed up from the key support level 0.8630 (which has been repeatedly reversing the pair from last November) intersecting with the lower daily Bollinger Band.
The upward reversal from the support level 0.8630 follows the earlier upward reversal from the same support level – which formed the daily Bullish Engulfing.
Given the oversold daily Stochastic and the strength of the support level 0.8630, AUDCAD can be expected to rise toward the next resistance level 0.8700.
U.S. Government Shutdowns & U.S. Dollar Implications
Summary
A potential U.S. government shutdown that could start October 1st looms, the chances of which are more or less seen as a coin flip at this point. Should a shutdown transpire, there could be a negative impact of the U.S dollar, albeit one that is likely to be modest and short-lived. Recent history suggests the U.S. dollar index (DXY) could fall by around 1%-1.5% in the several weeks following the start of the shutdown. Also in recent shutdown episodes, three months after the shutdown began the dollar had recovered its losses and there was no meaningful or long-lasting impact on the dollar. In the event a U.S. government shutdown does occur, we would expect a similar pattern to unfold, and we would not make significant changes to our longer-term outlook for the U.S. dollar.
Potential U.S. Shutdown Looms For the U.S. Dollar
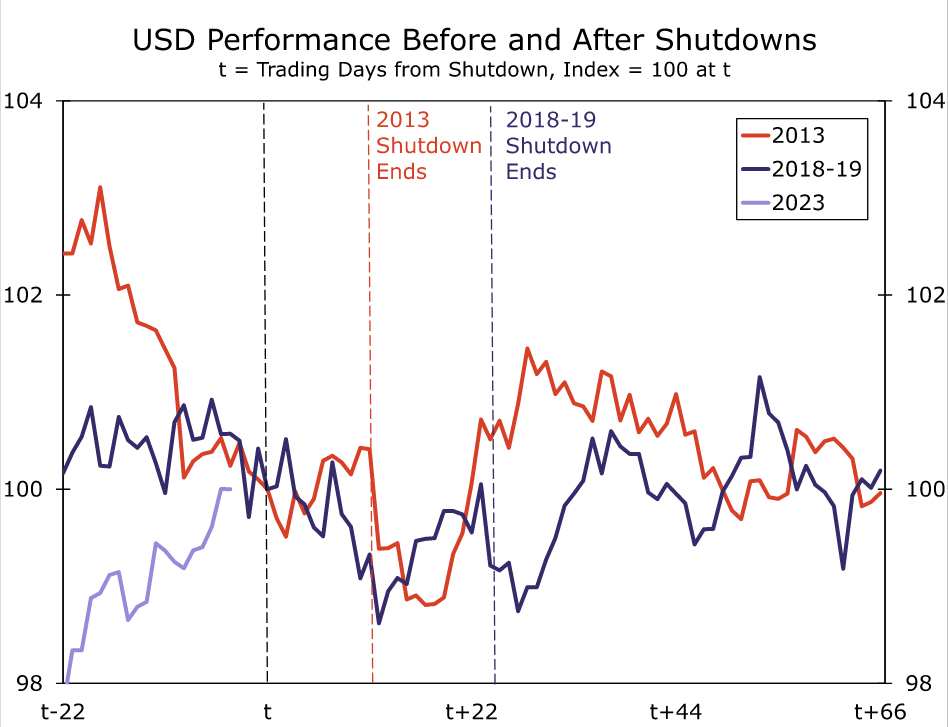
Last week our U.S. economics colleagues wrote about the potential for a U.S government shutdown that could begin on 1 October. At this point, our teammates believe the chances of U.S. government shutdown are more or less a coin flip. In recent U.S. government shut down episodes, the direct hit to U.S. growth was modest. Consumer confidence has historically dipped during periods of a government shutdown, and while the impact to U.S. growth has typically been immaterial, not all the lost economic activity was fully recovered. The above report captures the economic impact of a government shutdown. In this report, we will assess the potential implications of a government shutdown on the U.S. dollar. History of U.S. government shutdowns is somewhat limited, but we can infer the potential impact on the dollar by examining the most recent episodes. To that point, we examined the shutdowns that began in October 2013 (which lasted for 16 calendar days or 11 trading days) and December 2018 (which lasted 35 calendar days or 24 trading days). In our view, these most recent episodes are likely to be the most instructive for a potential shutdown in 2023. The economic and political environment in 2013 as well as 2018-2019 more resembles the current political and economic climate than the backdrop during the prior shutdown of the 1990s.
We assess the greenback's performance using the U.S. dollar index (DXY). Our first observation is that, at least heading into these two shutdowns, the U.S. dollar's performance is varied and driven by the prevailing economic conditions, not necessarily anticipation of the shutdown. In 2013, the U.S. dollar softened in the weeks heading into the shutdown. At that time, U.S. economic growth was subdued and Federal Reserve interest rates were steady at essentially 0%. The 2013 government shutdown occurred toward the end of the Fed's “Taper Tantrum”, which is important to note as longer term U.S. Treasury yields had already started to stabilize and global equity markets had begun to recover. Against this backdrop, the U.S. dollar was softening as risk sentiment started to improve. During the 2013 government shutdown, the U.S. dollar index actually gained very slightly (by 0.4%) over those 11 trading days. However, U.S. dollar sentiment did take a short-term hit such that 17 trading days after the start of the shutdown, the U.S. dollar index saw the largest peak-to-trough decline of 1.2%. Nonetheless, three months from the start of the shutdown, the U.S. dollar index had recovered all of its losses.
In contrast, during the 2018-2019 period, the U.S. dollar was steadier heading into the shutdown. In this instance, the U.S. economic backdrop was firmer relative to 2013 in that U.S. GDP growth was on a clear upwards trend. The Federal Reserve was coming to the end of a rate hike cycle and, towards the end of 2018, U.S. equity markets also corrected lower, providing safe haven support to the greenback during a period of elevated financial market volatility. Over the course of the 2018-19 episode, the U.S. dollar index fell marginally (by 0.8%) during the actual shutdown episode. Once again, U.S. dollar sentiment took a short-term hit such that 12 trading days after the start of the shutdown, the U.S. dollar index saw the largest peak to trough fall, a decline of 1.4%. In similar fashion to 2013, the greenback also fully recovered its losses experienced during this period three months following the start of the shutdown.
Today's environment is quite similar to 2018-2019. The current backdrop is defined by resilient U.S. economic growth as well as a Federal Reserve that is approaching, or has possibly already reached, the end of its tightening cycle. Also, similar to 2018-2019, equity prices are correcting lower. While it is worth noting that the current landscape is most similar to 2018-19, the greenback has followed a consistent pattern once those shutdowns began, regardless of the pre-shutdown trend. That is, a short-lived and modest decline in the value of the dollar. We would expect the greenback to behave very similarly if a U.S. government shutdown transpires this time around, and a shutdown could translate into a 1%-1.5% decline in the DXY dollar index in the weeks after the event transpires. At the same time, we believe the same pattern of a dollar rebound would be repeated this time around. In our view, any greenback depreciation will be short-lived, and we would expect the dollar to recover in the months following the re-opening. Longer-term, once the shutdown ends and is in the rearview mirror, whether U.S. economic resilience survives the shutdown, and how high and for how long the Federal Reserve keeps its policy interest rate, will likely remain more consequential to the U.S. dollar's performance. In our view, with the Fed still leaning hawkish and a U.S. "soft landing" more possible, despite the short-term depreciation forces the dollar could experience, we would continue to forecast a stronger U.S. dollar through the end of 2023 as the broader economic environment proves to be the driving force of the greenback.
Dow Jones Index on Verge of Down-Trend
The Dow Jones Index is testing the long-term trend’s strength in the form of the 200-day moving average. The touching of this curve at the end of May and a brief dip below in March was characterised by increased buying. Are there enough buyers left in the markets to buy out the dive again? There are doubts.
The US Dow Jones has been trading below 34000 since the beginning of the week, back to the lows from early July, when we saw the last bullish attempt to warm up the market. Since August, the initiative has shifted to the bears, and they pretty quickly established a break of the medium-term trend in the form of the 50-day moving average.
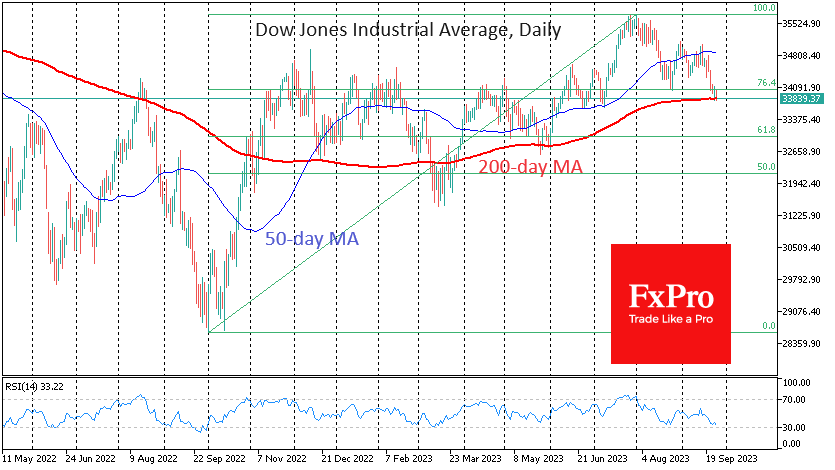
Now, it is time to fight for the long-term trend in the form of the 200-day average. The German DAX40 and the pan-European Stoxx50 pulled back under those lines last week. Early last week, the Russell2000 – the broadest of the popular US indices – was also under this curve. And that only intensified the sell-off.
This week, the US Dow Jones – the oldest of the modern indices – is testing the strength of the 200-day moving average. Based on previous instances, a close under 33800 would open Pandora’s box, intensifying the sell-off.
In addition to breaking the uptrend, we will get confirmation that the market is on a deeper correction scenario, potentially heading for 33000 (61.8% of the October 2022 bottom to the July peak) after failing to cling to the 76.4% at 34000 (a shallower Fibonacci retracement).
We also note the change in the information backdrop. The pull away from risks, i.e. equities, is intensified by the disagreement on the budget, which could cause a US government shutdown. Fed officials are emphasising the chances of further interest rate hikes, while news media highlight the severity of current financial conditions for Americans.
This agenda reinforces the negative news backdrop, which could play into the hands of the bears in the short term, thus triggering a domino effect in another market benchmark.
GBP/USD: Cable Falls Further, Psychological 1.20 Support Coming in Focus
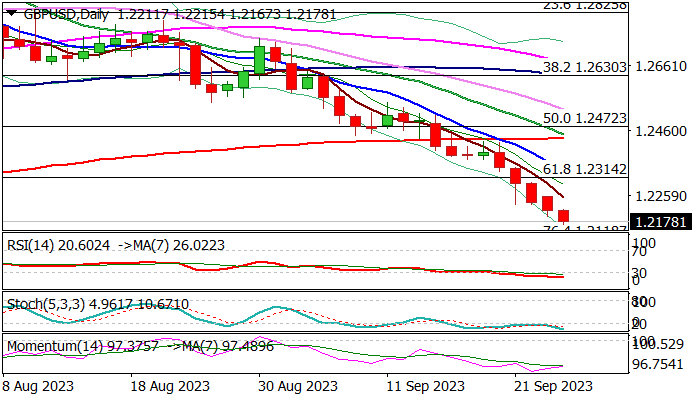
Cable dips below 1.22 mark on Tuesday, hitting the levels last traded in mid-March, in extension of the downtrend which steepened in past five days.
Soured risk sentiment and strong dollar on signals that the Fed may raise interest rates further and keep them high for longer period, continues to weigh on sterling.
Bears eye target at 1.2118 (Fibo 76.4% of 1.1802/1.3141uplrg) and 1.2074 (Fibo 38.2% of larger 1.0348/1.3141 uptrend) which guard psychological 1.20 support.
Firmly bearish daily studies contribute to negative outlook, though strongly overbought conditions suggest that bears may soon start to run out of steam and some price adjustment. Upticks should be limited and ideally capped by broken Fibo 61.8% (1.2314) and nearby falling daily Tenkan-sen (1.2336) to keep bears intact.
Res: 1.2215; 1.2252; 1.2314; 1.2336
Sup: 1.2118; 1.2074; 1.2000; 1.1944
Brent Crude – Oil Pares Gains in Risk-Averse Trade
- Potential profit-taking after immense rally
- Economic pessimism may weigh in the future
- Bullish flag formation may suggest there's more to come
Risk aversion in markets may be weighing on oil prices a little, especially if economic fears are fueling that sentiment.
Oil prices have rallied strongly on the back of supply restrictions and the economy failing to live up to expectations was always going to be one of the primary counter-risks for the price.
I wouldn't say that is now unfolding but clearly, investors are a little concerned about whether the economy can sustain current levels of interest rates for a prolonged period of time.
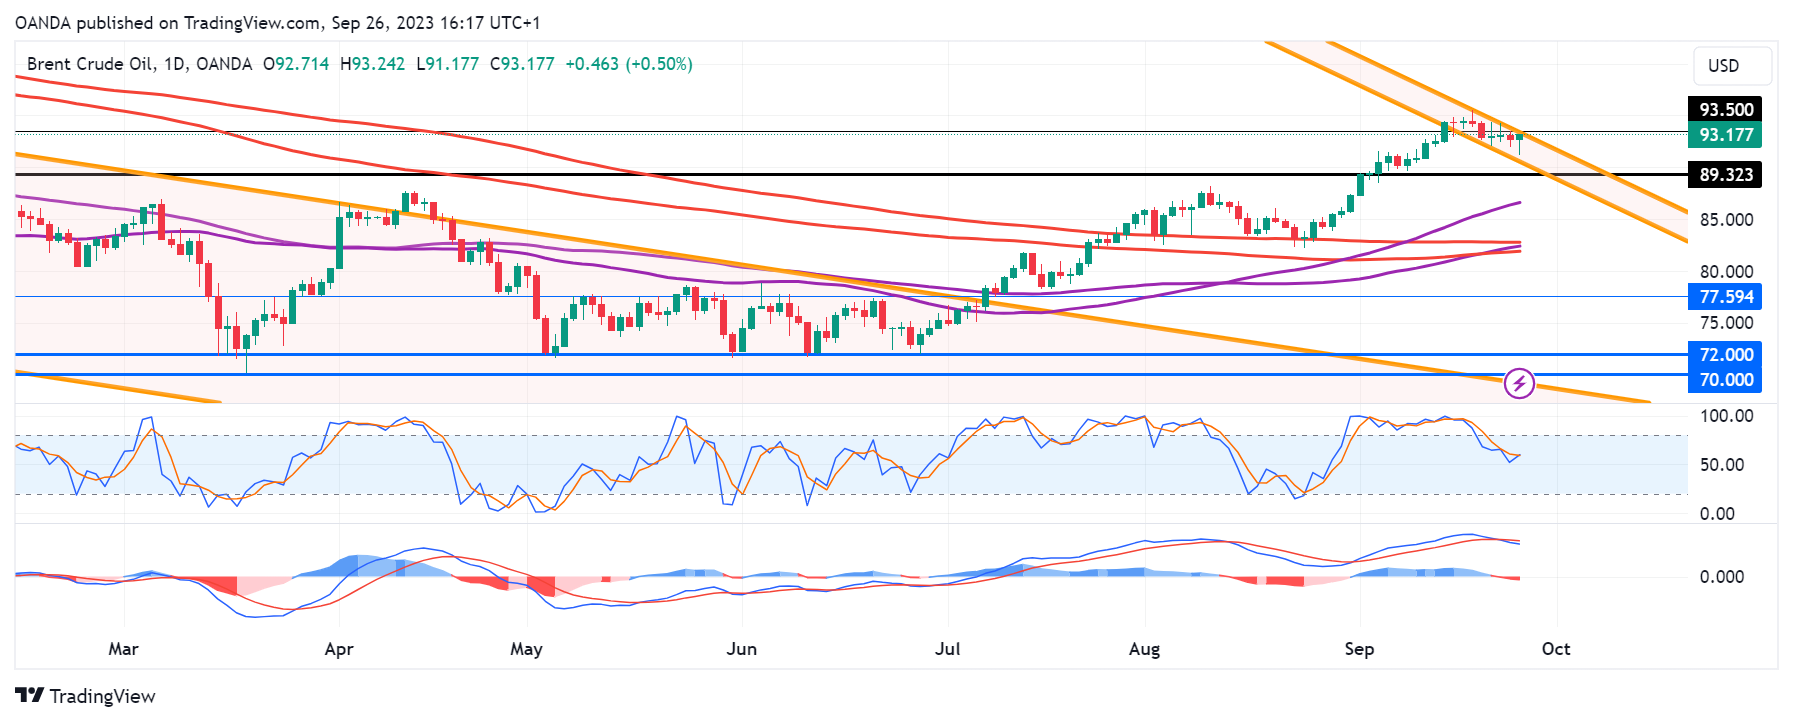
From a technical perspective, I'm not seeing anything particularly concerning about the recent pullback. Brent crude still looks well supported, with today's initial declines being short-lived as the market rebounded around the highs from earlier this month.
We may still see more of a correction but there's no clear sign of sentiment turning bearish after such a strong rally over the summer.
A bullish continuation pattern?
The recent consolidation we've seen after such a strong rally looks a little like a bullish flag formation which may be a further sign that sentiment has not changed in the market over the last week.
Source – OANDA on Trading View
A break through the top of the descending channel could be a sign that the prior trend has resumed, especially if backed by momentum which will be key as we near some major psychological levels.
Euro Slips to 6.5-Month Low, Lagarde Dismisses Rate Cuts
- ECB’s Lagarde says rates to stay restrictive for as long as needed
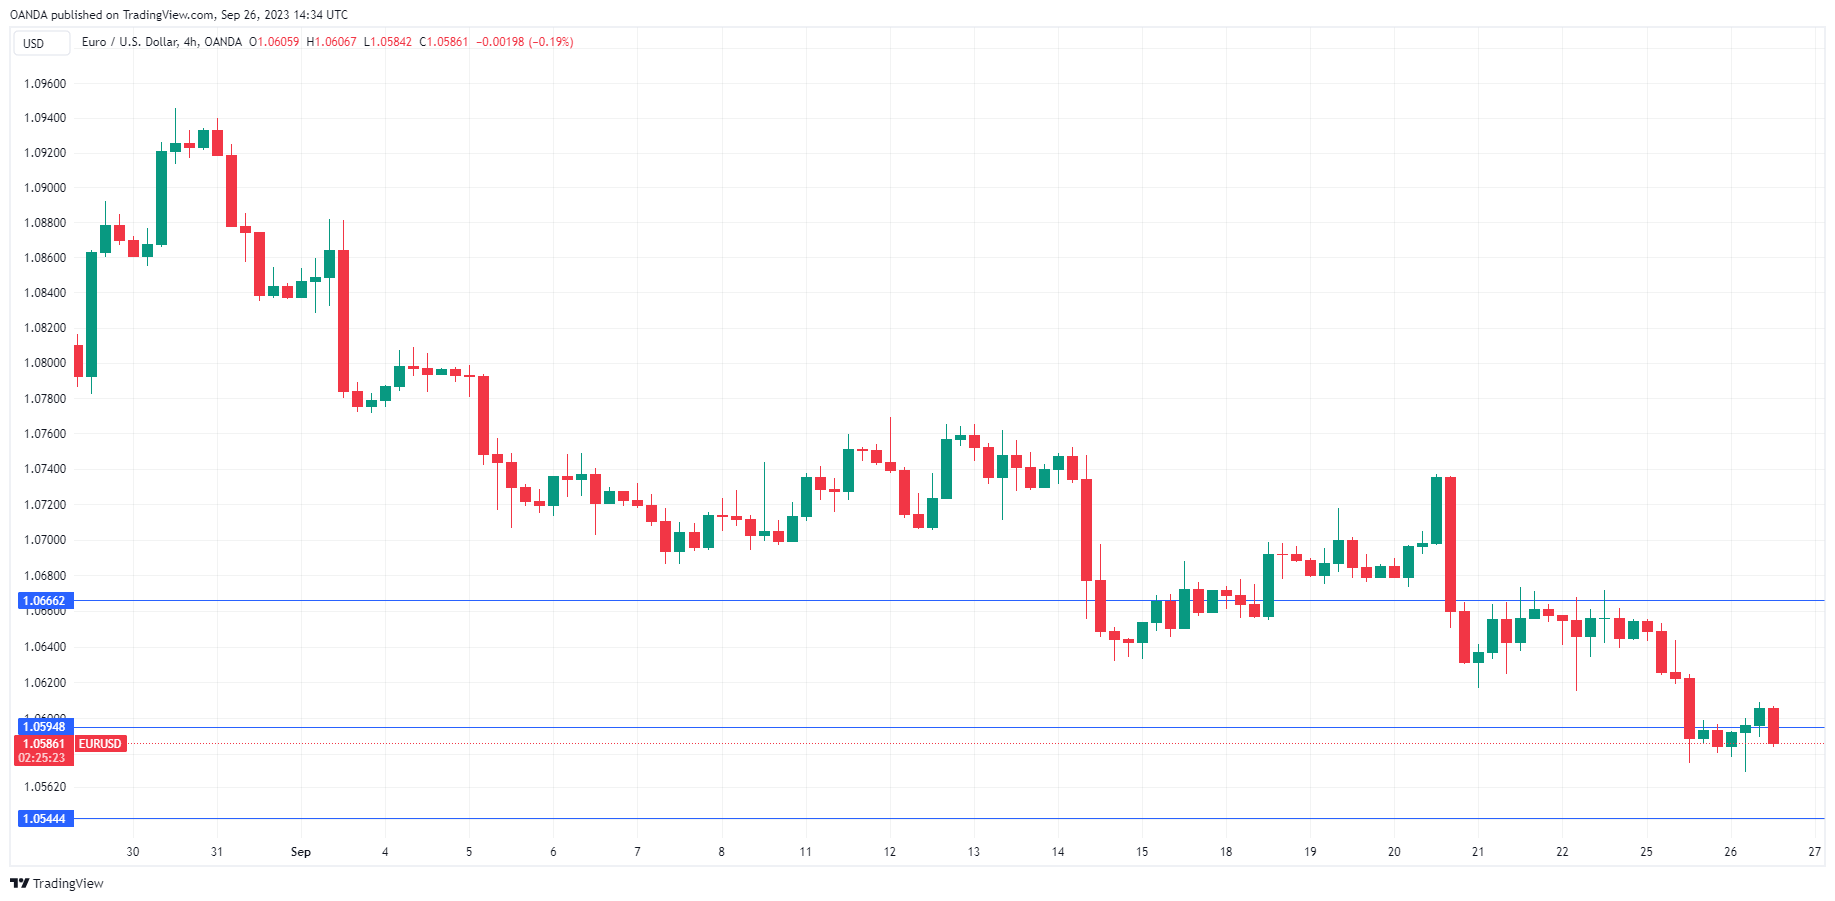
The euro is unchanged on Tuesday, trading at 1.0593.
Euro slips despite Lagarde’s hawkish remarks
ECB President Lagarde said on Monday that interest rates would be “set at sufficiently restrictive levels for as long as necessary”, adding that the ECB was in a long race in the battle to bring down inflation to the 2% target. Lagarde stated categorically that the Governing Council was not considering rate cuts.
At first glance, Lagarde’s comments appeared hawkish. Investors were less than impressed, however, as the euro fell 0.48% on Monday. Last week, the ECB raised its key interest rate to a record high of 4.0%, but that too failed to support the euro, which lost ground after the decision. Lagarde signalled at the meeting and again in her remarks on Monday that rates may have peaked and investors responded on both occasions with a thumbs-down for the euro.
The ECB’s decision was a close call, with both doves and hawks able to present strong cases. Inflation is running at a 5.3% clip, more than double the target rate of 2%, and last week’s rate hike will help curb inflation. At the same time, eurozone growth has weakened and Germany, the traditional powerhouse, is a glaring weak spot. The global economy is weak and the slowdown in China isn’t helping matters.
Against this background of high inflation and sluggish growth, the ECB opted for a ‘dovish hike’, with the rate statement noting that rates have likely reached the peak level. The euro has reeled off 10 straight losing weeks, declining more than 600 basis points during that period. Unless eurozone data shows an improvement, the downswing could continue.
EUR/USD Technical
- EUR/USD is testing resistance at 1.0594. Next, there is resistance at 1.0666
- There is support at 1.0544 and 1.0472