Sample Category Title
EUR/USD Takes Hit While USD/CHF Surges
EUR/USD started a fresh decline below the 1.0615 support. USD/CHF is rising and might aim a move toward the 0.9220 resistance.
Important Takeaways for EUR/USD and USD/CHF Analysis Today
- The Euro struggled to clear the 1.0670 resistance and declined against the US Dollar.
- There is a major bearish trend line forming with resistance near 1.0585 on the hourly chart of EUR/USD at FXOpen.
- USD/CHF is gaining pace above the 0.9135 resistance zone.
- There is a key bullish trend line forming with support near 0.9150 on the hourly chart at FXOpen.
EUR/USD Technical Analysis
On the hourly chart of EUR/USD at FXOpen, the pair failed to clear the 1.0670 resistance. The Euro started a fresh decline below the 1.0615 support against the US Dollar, as mentioned in the previous analysis.
There was a move below the 50-hour simple moving average and 1.0600. The bears were able to push the pair below the 1.0585 pivot level. The pair traded as low as 1.0556 and is currently showing a lot of bearish signs.
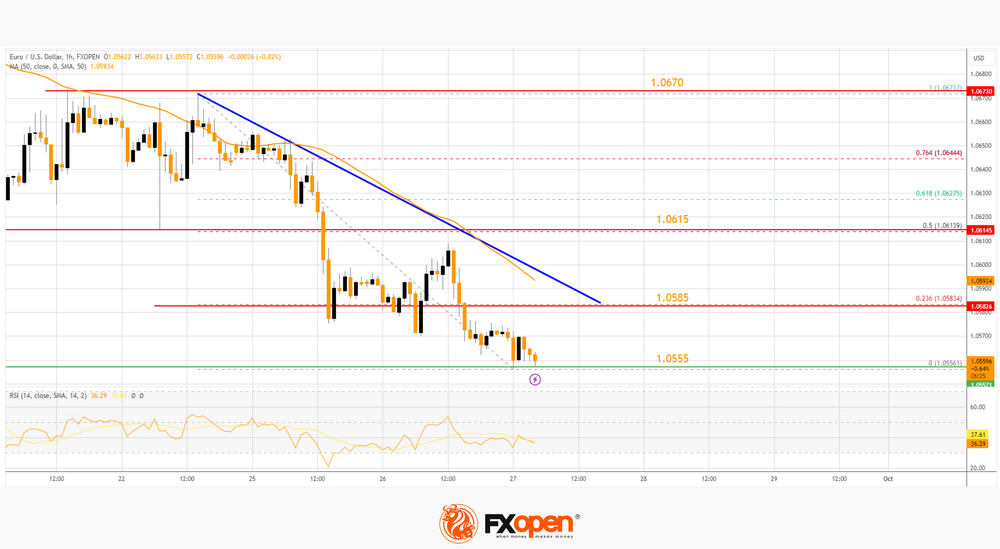
Immediate resistance on the upside is near the 23.6% Fib retracement level of the downward move from the 1.0671 swing high to the 1.0556 low. There is also a major bearish trend line forming with resistance near 1.0585 and the 50-hour simple moving average.
The first major resistance is near the 50% Fib retracement level of the downward move from the 1.0671 swing high to the 1.0556 low at 1.0615. An upside break above the 1.0615 level might send the pair toward the 1.0670 resistance. Any more gains might open the doors for a move toward the 1.0720 level.
On the downside, immediate support on the EUR/USD chart is seen near 1.0555. The next major support is near the 1.0540 level. A downside break below the 1.0540 support could send the pair toward the 1.0500 level.
USD/CHF Technical Analysis
On the hourly chart of USD/CHF at FXOpen, the pair started a decent increase from the 0.8930 support. The US Dollar climbed above the 0.9010 resistance zone against the Swiss Franc.
The bulls were able to pump the pair above the 50-hour simple moving average and 0.9135. A high is formed near 0.9174 and the pair is still showing signs of more upsides. On the upside, the pair is now facing resistance near 0.9175.
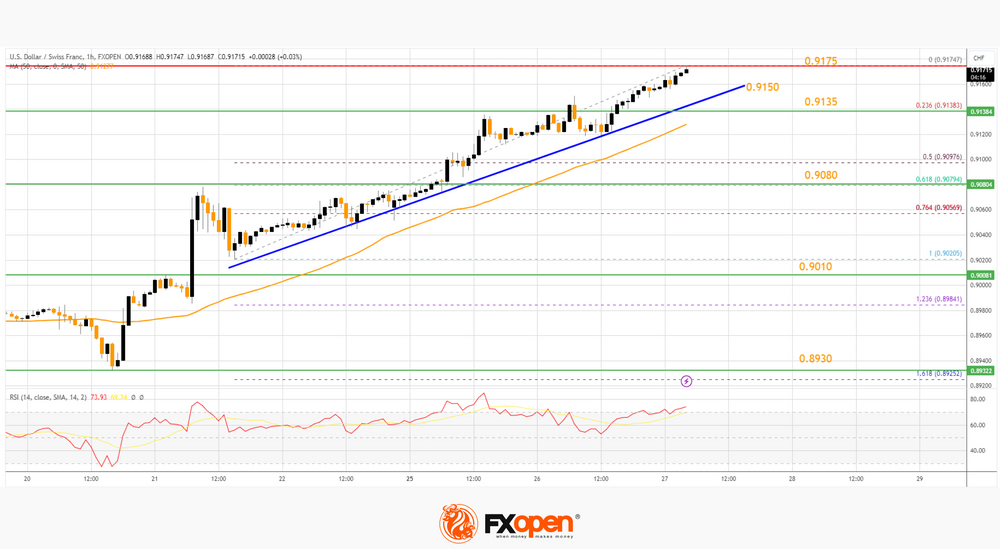
The next major resistance is at 0.9200. The main resistance is now near 0.9220. If there is a clear break above the 0.9220 resistance zone and the RSI climbs above 80, the pair could start another increase. In the stated case, it could test 0.9300.
If not, there could be a downside correction. On the downside, immediate support on the USD/CHF chart is near a key bullish trend line at 0.9150.
The first major support is near the 50-hour simple moving average and the 23.6% Fib retracement level of the upward move from the 0.9020 swing low to the 0.9174 high at 0.9135. A downside break below 0.9135 might spark bearish moves.
The next major support is near the 61.8% Fib retracement level of the upward move from the 0.9020 swing low to the 0.9174 high at 0.9080. Any more losses may possibly open the doors for a move toward the 0.9010 level in the near term.
This article represents the opinion of the Companies operating under the FXOpen brand only. It is not to be construed as an offer, solicitation, or recommendation with respect to products and services provided by the Companies operating under the FXOpen brand, nor is it to be considered financial advice.
Crypto Market is in a Dilemma
Market Picture
Despite the storm in the equity markets, the crypto market remains subdued, losing only 0.3% in 24 hours to $1.045 trillion. The Crypto Market Fear and Greed Index is dipping into “fear” territory. The crypto market did not suddenly become a safe haven. Still, it only temporarily turned out to be of no interest to active speculators, as the movements of shares of technology giants and government bond prices now attract their primary attention.
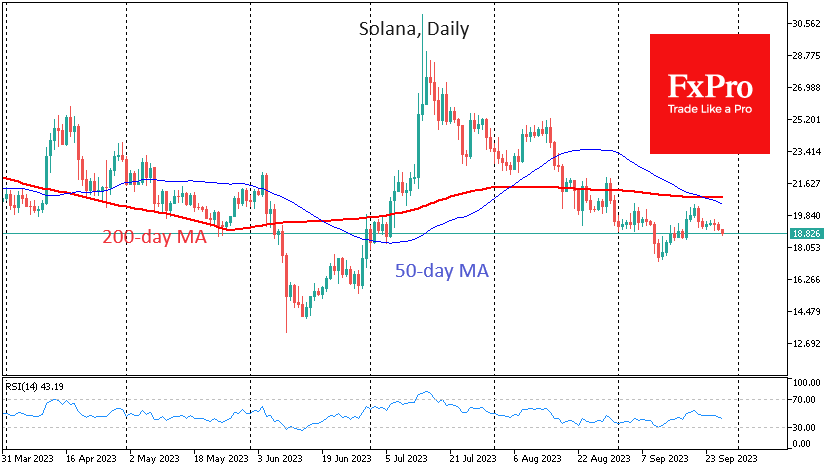
Bitcoin is trading near $26.2K on Wednesday morning, ending Tuesday with another decline. We don’t see the selling accelerating, but for now, it’s going on many popular coins like Ethereum, XRP and Solana all at once.
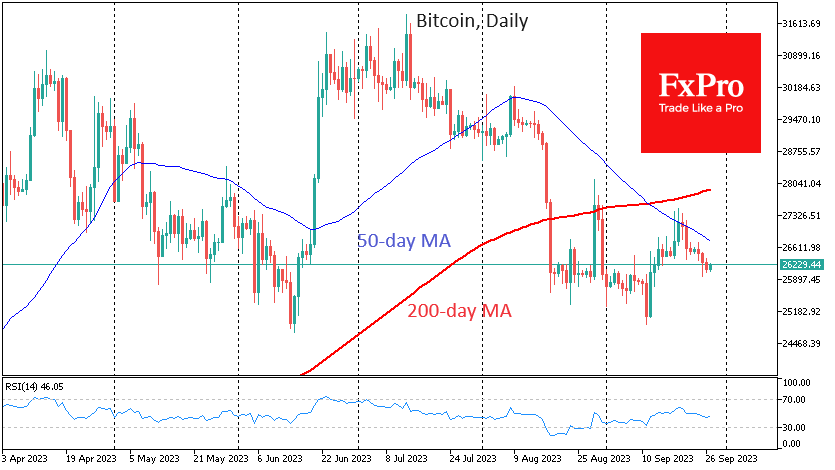
According to CryptoQuant, bitcoin spot trading volume fell to 2018 values last week. The number of transactions has fallen more than 40 times since March.
At the same time, the number of hodlers who view cryptocurrencies as an investment but do not transact in them is on the rise. According to Bitfinex, bitcoin is in the period with the lowest volatility in the history of the asset. The crypto market is clearly in a quagmire.
Perhaps, before the revival of interest in the market, we should see a final frontal liquidation of long positions. But only with a sell-off in the stock and bond markets on worries about stocks and bonds, not with the bankruptcies of large crypto companies.
News background
The SEC opposed the sale of Celsius assets on the Coinbase, citing ongoing litigation against the latter.
98% of Celsius’ bankruptcy-affected creditors supported the crypto lending platform’s reorganisation plan, under which they would recover some assets and get a stake in the new company.
The UK’s Financial Conduct Authority (FCA) has sent cryptocurrency companies a “final warning”, accusing them of not wanting to comply with new rules on advertising digital assets in the country. The deadline for advertising compliance was recently extended to 8 January 2024.
One of the world’s largest financial corporations, Hong Kong-based HSBC, announced that its customers can now pay for their loans using five types of digital assets. The financial group is ready to accept payment in BTC, ETH, XRP, SHIB and DOGE.
Shanghai’s Second Intermediate People’s Court recognised the first cryptocurrency as a “unique and irreproducible” digital asset, affirming its value at a legal level.
EUR/USD: Bears May Take a Breather Before Larger Downtrend Resumes
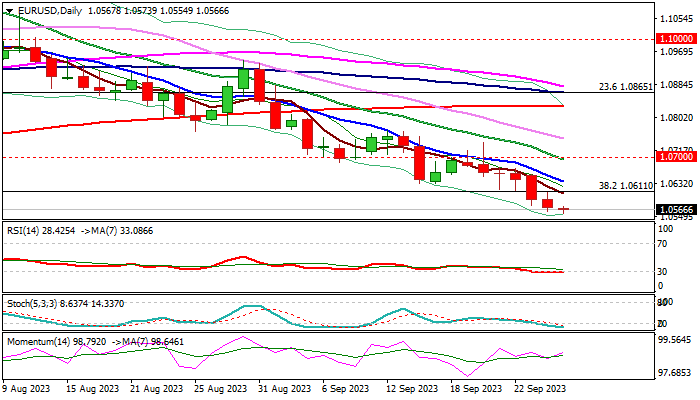
EURUSD hit new multi-month low early Wednesday and showing scope for further weakness after break of pivotal Fibo support at 1.0611 (38.2% of 0.9535/1.1275) generated fresh bearish signal.
Bears cracked next strong support at 1.0553 (top of thickening weekly cloud) and may pause here, as daily studies are oversold.
Overall bearish daily studies reinforce negative near term outlook and suggest limited consolidation before fresh push lower, as the pair is in a steep downtrend for the eleventh consecutive week and all pauses were so far brief.
Broken Fibo support (1.0611), former low of Sep 14 (1.0631) and falling 10DMA (1.0636) should serve as solid resistances and cap upticks to keep bears intact and provide better levels to re-enter larger bearish market for extension through weekly cloud top towards a higher base at 1.0520 zone (Feb/Mar) and 50% retracement of 0.9535/1.1275 at 1.0405.
Caution on break above 10DMA, though larger bias expected to remain with bears while the action stays below 1.0700 zone (psychological / falling 20DMA).
Res: 1.0611; 1.0636; 1.0673; 1.0700.
Sup: 1.0553; 1.0516; 1.0483; 1.0405.
Will USDJPY March Higher?
- USDJPY marks new higher highs
- The current state may be close to overbought territory
- Bulls need a durable move above 149.00
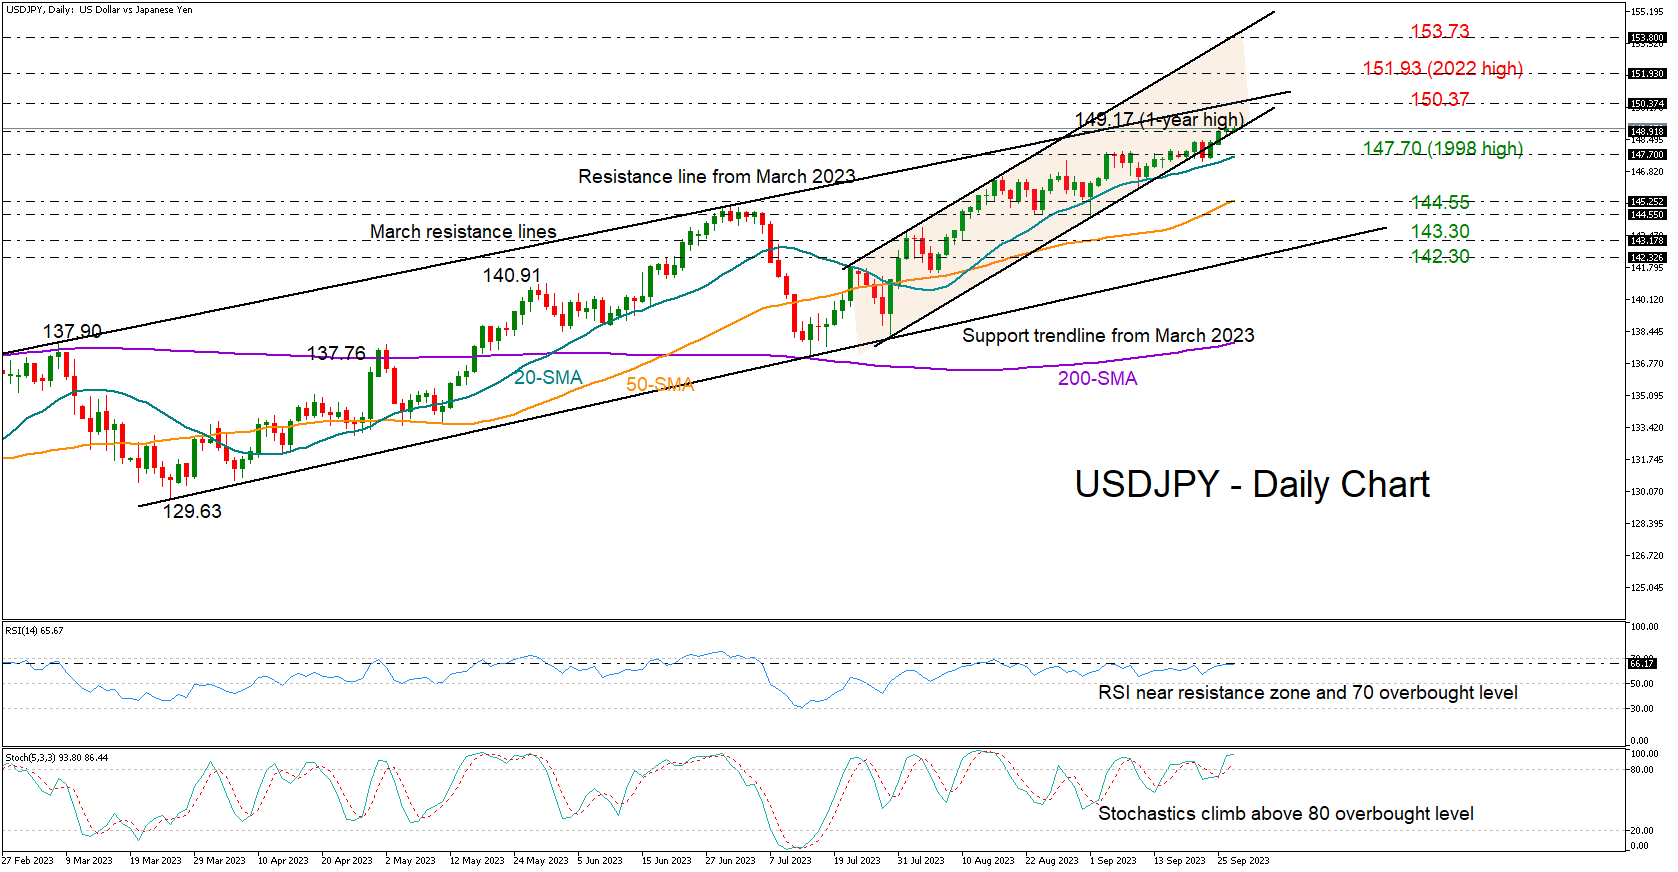
USDJPY managed to keep a footing within a short-term ascending channel and softly rise to a one-year high of 149.17 on Tuesday.
That said, the price momentum remains weak and the RSI and the stochastic oscillator are already flirting with overbought levels, suggesting that buyers might soon exercise caution in the market.
Nevertheless, if the price holds above the channel’s support trendline at 148.90, there is potential for an acceleration towards the tentative resistance line seen at 150.37. Snapping that wall, the bulls could head for the 2022 top of 151.93, a break of which could provide direct access to the channel’s upper band at 153.80.
Alternatively, a close below the channel could instantly see a test of the 20-day simple moving average (SMA) near 147.70. If the bears breach that floor too, they may next target the area between the 50-day SMA and the 144.55 restricted zone. Then a pause could occur around the 143.30 barrier before the support trendline drawn from March comes under examination at 142.30.
In summary, USDJPY might be on track for another bullish correction, but traders could stay patient until the pair closes decisively above 149.00.
Has Recent Sell-off in NZDUSD Run Its Course?
- NZDUSD continues to hover around the 0.5920 level
- Last week’s key events did not result in a new trend in NZDUSD
- The momentum indicators have taken a back seat at this stage
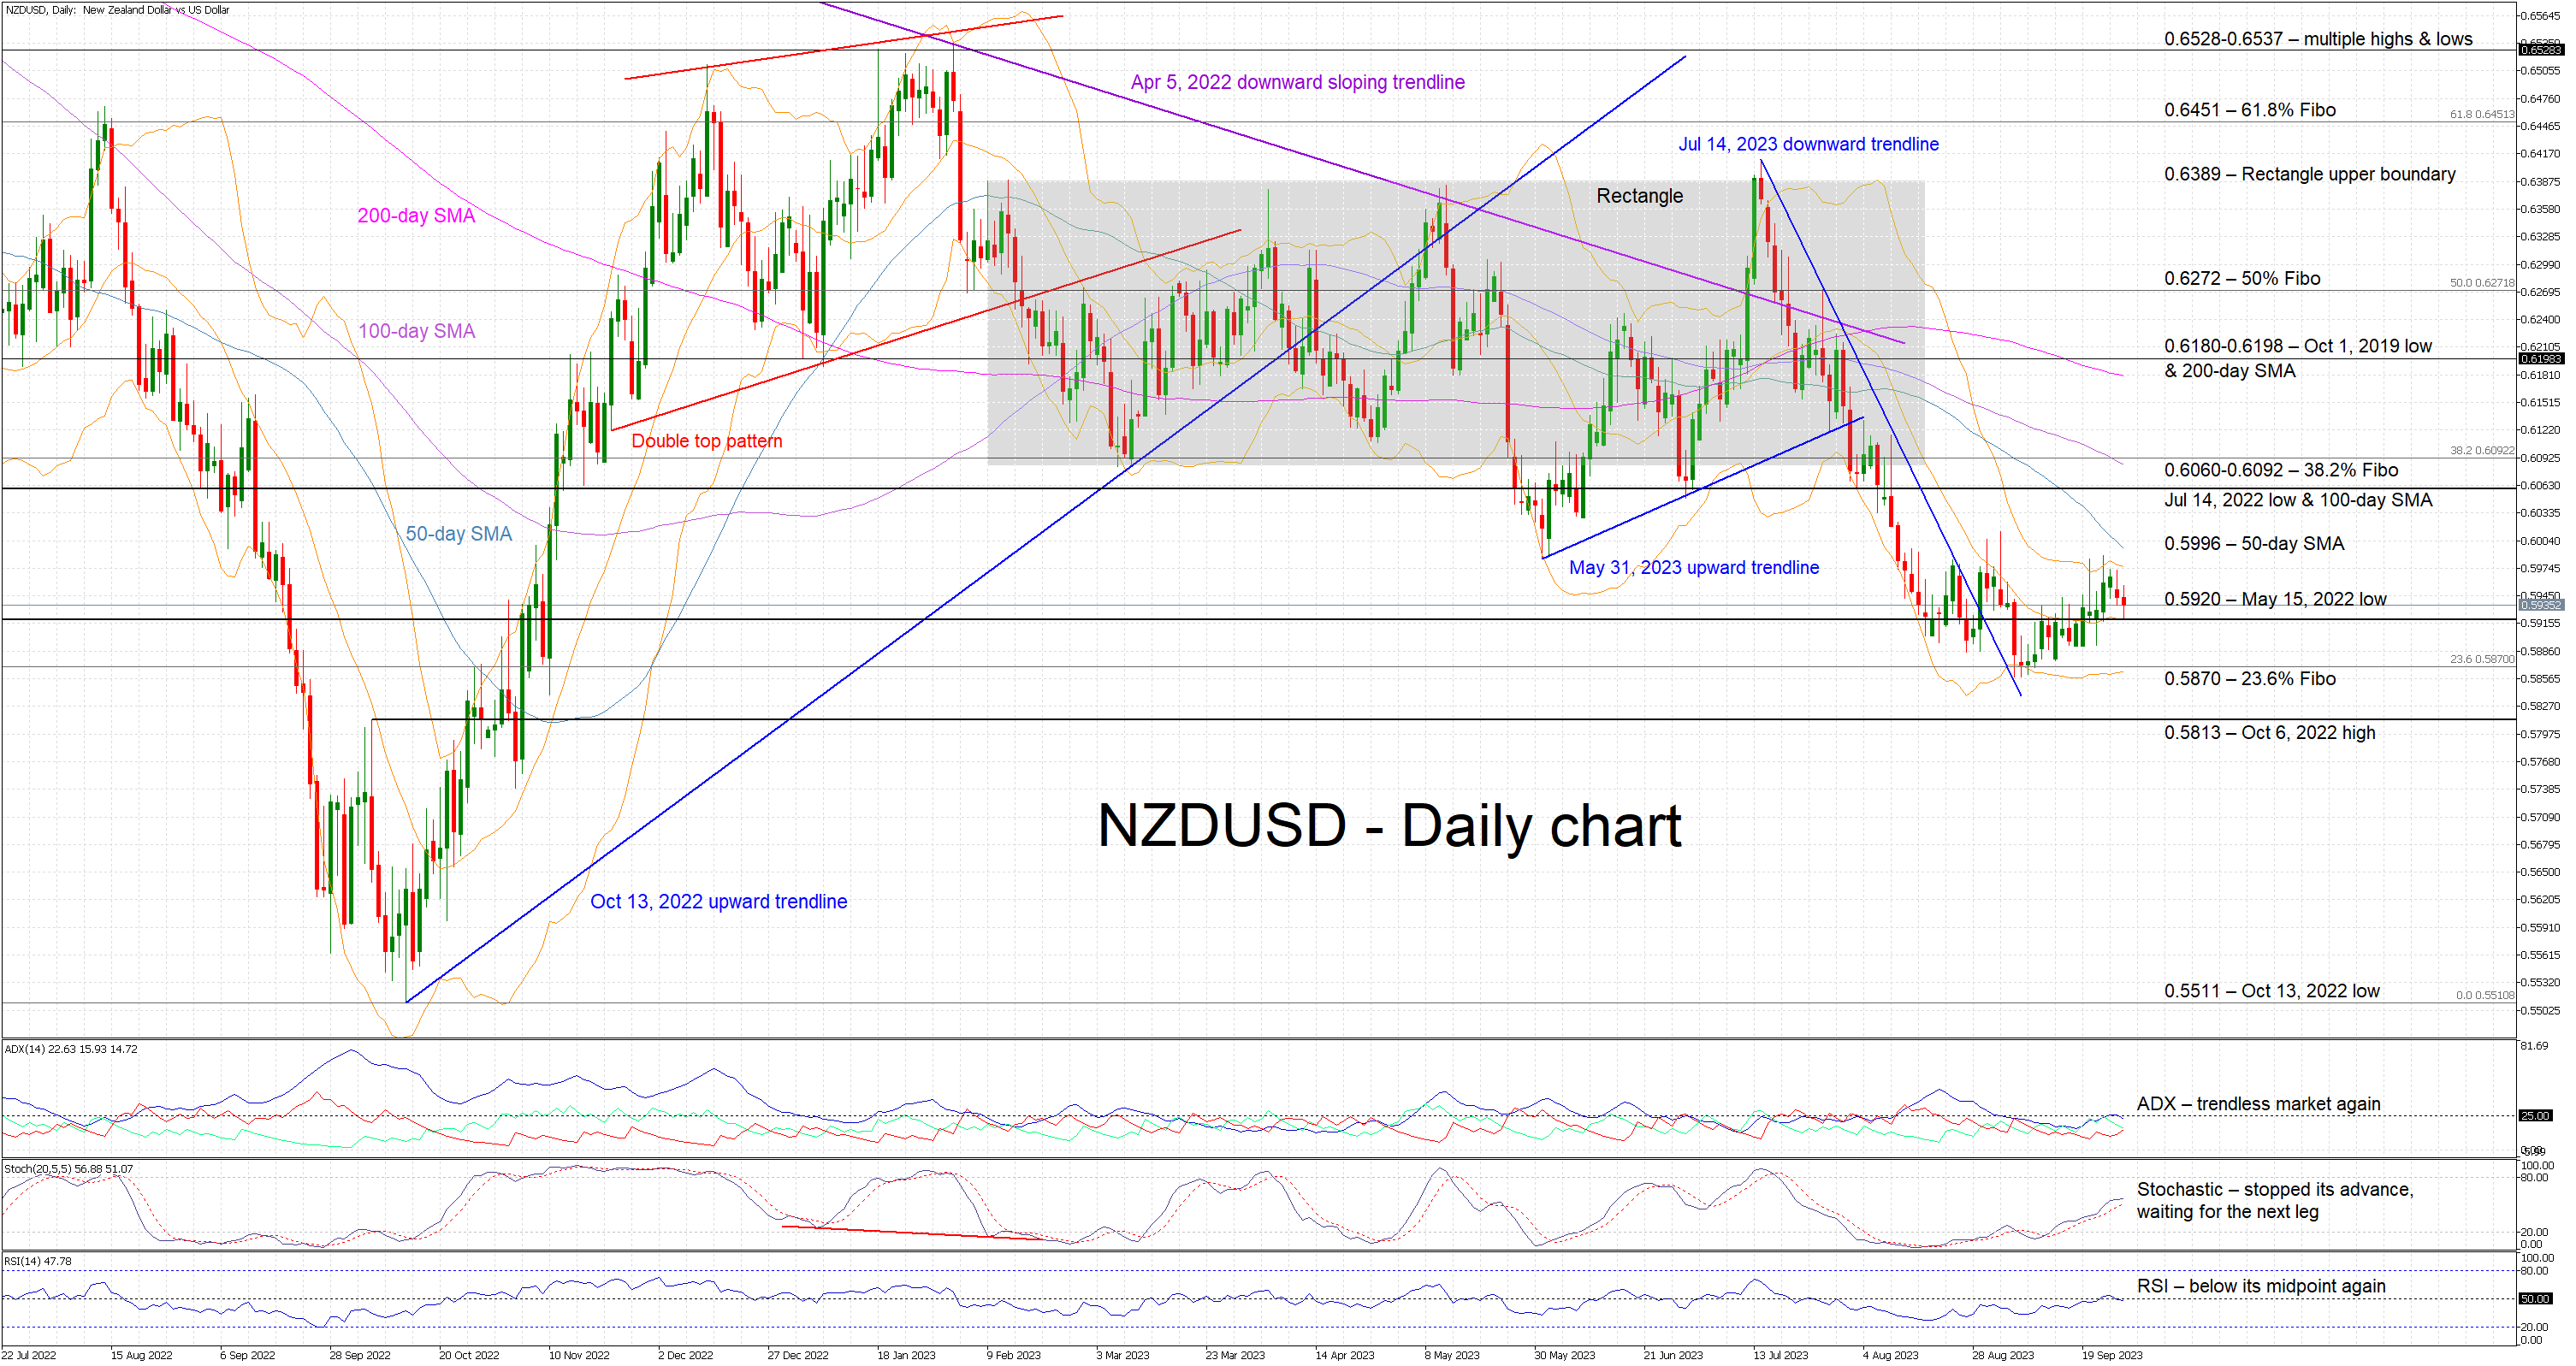
NZDUSD is trading lower, testing the support set by the May 15, 2022 low of 0.5920. The bears have managed to stop the recent series of six consecutive green candles, but they have failed, up to now, to register a significant sell-off.
Similarly, the momentum indicators are trying to find their footing. The Average Directional Movement Index (ADX) points to a trendless market, and the RSI continues to hover around its 50-midpoint. Additionally, the stochastic oscillator’s advance has stopped a tad above its midpoint. It is currently trading sideways, revealing the market participants’ current appetite for new positions in NZDUSD.
Interestingly, an inverse head-and-shoulders pattern could be on its way, provided that we get the formation of the right leg of this structure. Should this take place, it would be another factor to take into consideration going forward.
Should the bears feel confident, they would try to finally break the May 15, 2022 low at 0.5920 and have another go at the 23.6% Fibonacci retracement of the April 5, 2022 – October 13, 2022 downtrend at 0.5870. Their first attempt to overcome this key level failed on September 5. If successful this time around, they could then test the support set by the October 6, 2022 high at 0.5813.
On the flip side, the bulls are keen on defending the 0.5920 level and gradually stage a move lower towards the 50-day simple moving average (SMA) at 0.5996. They could then have a go at breaking the busy 0.6060-0.6092 range, defined by the 38.2% Fibonacci retracement, the July 14, 2022 low and the 100-day SMA. This is the final step before pushing NZDUSD back inside the rectangle that has been in place since February 2023.
To conclude, the 0.5920 level appears to be key for the next leg in NZDUSD. The bears are trying to overcome this area, but they seem to lack the momentum that led NZDUSD aggressively lower from the July 14, 2023 high.
GBP/JPY Daily Outlook
Daily Pivots: (S1) 180.90; (P) 181.39; (R1) 181.72; More...
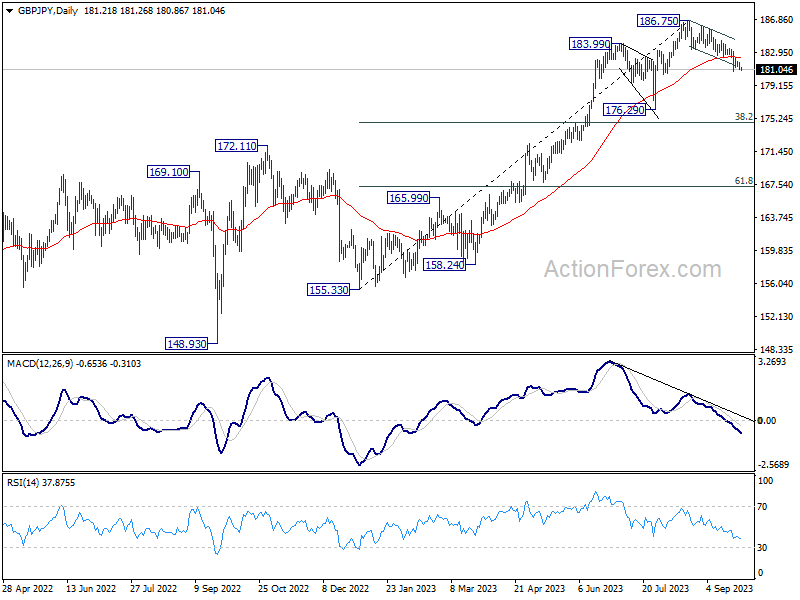
Intraday bias in GBP/JPY remains neutral for the moment, as consolidation from 180.78 is extending. With 183.34 resistance intact, further decline is expected. On the downside, break of 180.78 will resume the fall from 186.75 to 176.29 support next.
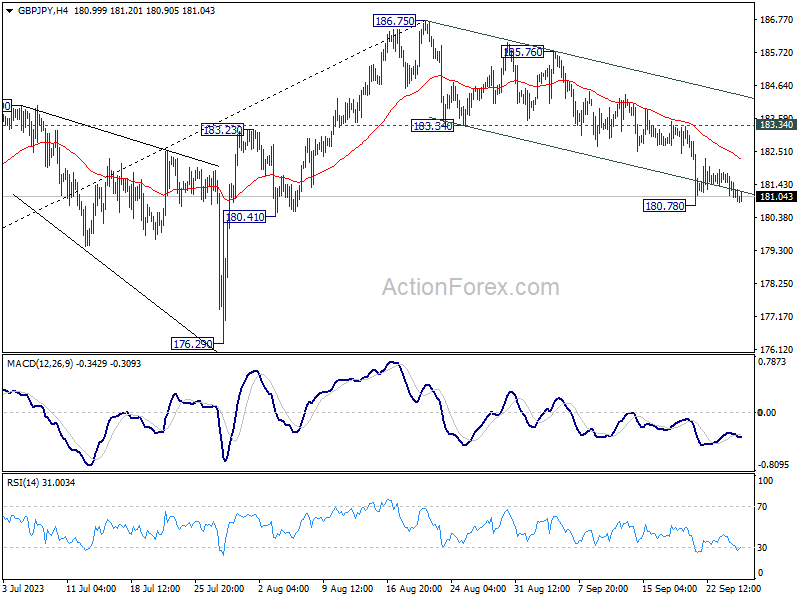
In the bigger picture, fall from 186.75 is currently seen as a corrective move only. As long as 176.29 support holds, larger up trend from 123.94 (202 low) should still be in progress. Break of 186.75 will target 195.86 (2015 high). Nevertheless, firm break of 176.29 will confirm medium term topping, and bring lengthier and deeper consolidations.
EUR/JPY Daily Outlook
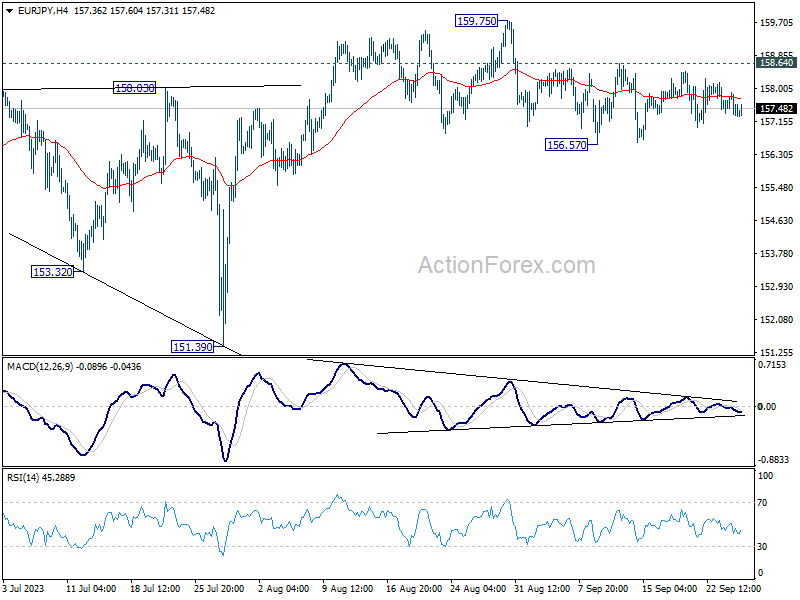
Daily Pivots: (S1) 157.30; (P) 157.61; (R1) 157.91; More....
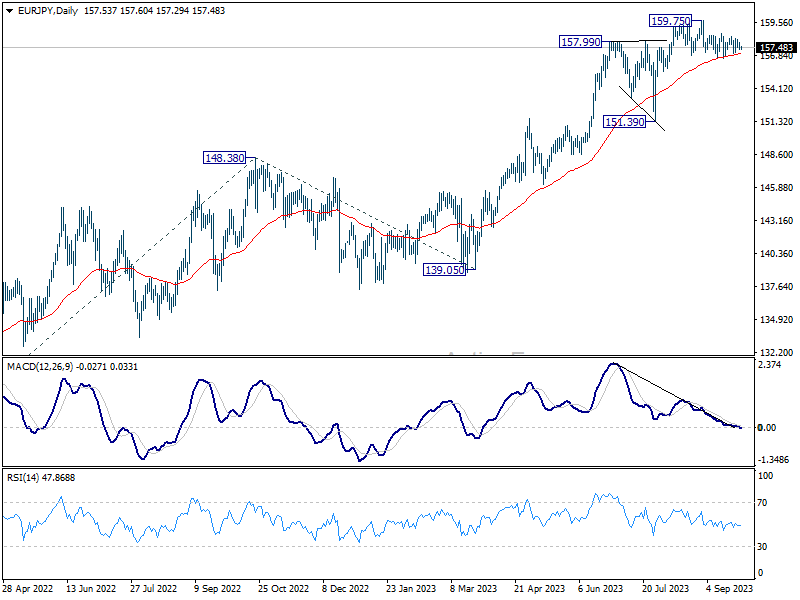
Sideway trading continues in EUR/JPY above 156.57 support and intraday bias remains neutral. Risk stays on the downside with 158.64 resistance intact. On the downside, break of 156.57 support, and sustained trading below 55 D EMA (now at 156.95) will argue that fall from 159.75 is a larger scale correction. Deeper decline would be seen back towards 151.39 support. Nevertheless, above 158.64 would bring retest of 159.75 high instead.
In the bigger picture, as long as 151.39 support holds, rise from 114.42 is still expected to continue. Next target is 100% projection of 124.37 to 148.38 from 139.05 at 163.06. Sustained break there will pave the way to retest long term resistance at 169.96.
EUR/GBP Mid-Day Outlook
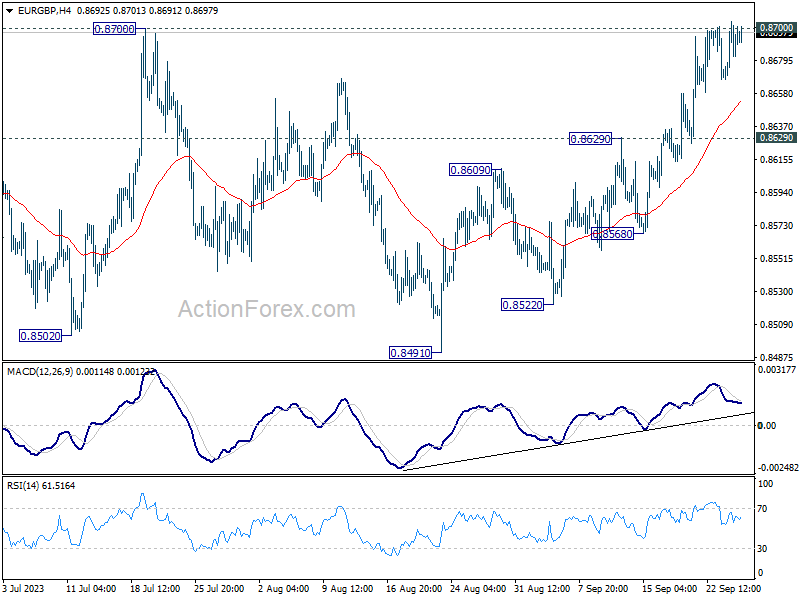
Daily Pivots: (S1) 0.8662; (P) 0.8682; (R1) 0.8695; More....
Focus stays on 0.8700 resistance in EUR/GBP. Decisive break there carry larger bullish implication and bring stronger rally to 0.8874 resistance next. Nevertheless, rejection by this resistance will maintain bearish outlook that larger down trend is not over. Break of 0.8629 resistance turned support will turn bias back to the downside for 0.8568 support first.
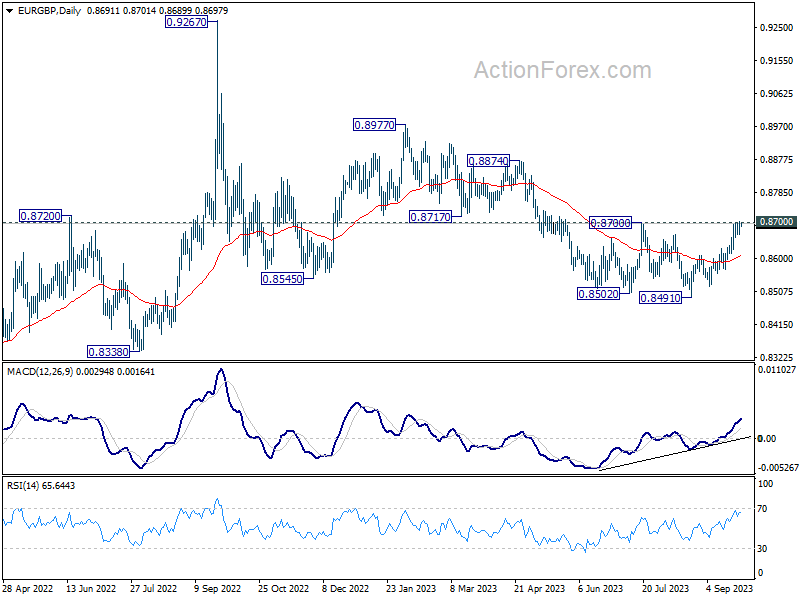
In the bigger picture, the down trend from 0.9267 (2022 high) is seen as part of the long term range pattern from 0.9499 (2020 high). Decisive break there will argue that this decline has completed with three waves down to 0.8491. Rise from 0.8491 could then be another leg inside the pattern that targets 0.8977 and above. However, rejection by 0.8700 will keep the down trend alive for another fall through 0.8491 at a later stage.
EUR/AUD Daily Outlook
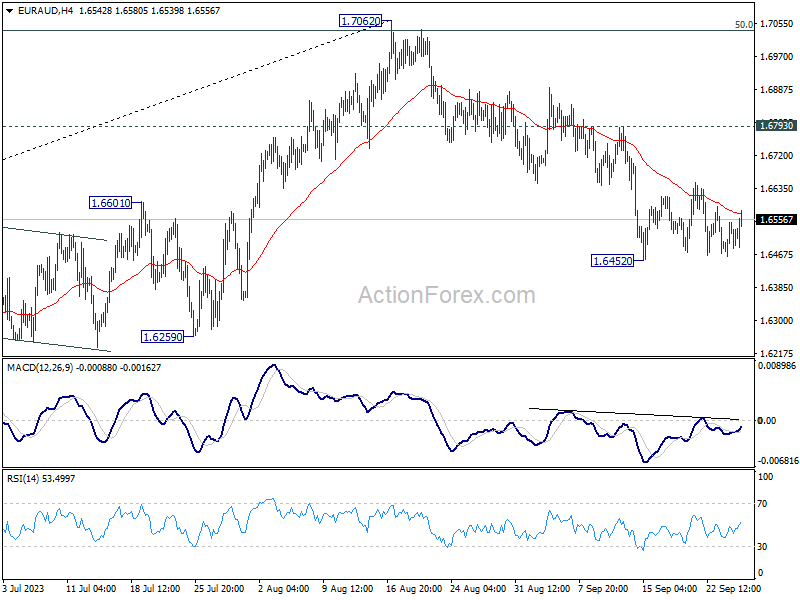
Daily Pivots: (S1) 1.6444; (P) 1.6518; (R1) 1.6562; More...
EUR/AUD is still extending the sideway pattern from 1.6452 and intraday bias remains neutral. Deeper decline is expected with 1.6793 resistance intact. On the downside, break of 1.6452 will resume the fall from 1.7062, as a larger scale correction, to 1.6000 fibonacci level. Nevertheless, firm break of 1.6793 will dampen this view and bring retest of 1.7062 instead.
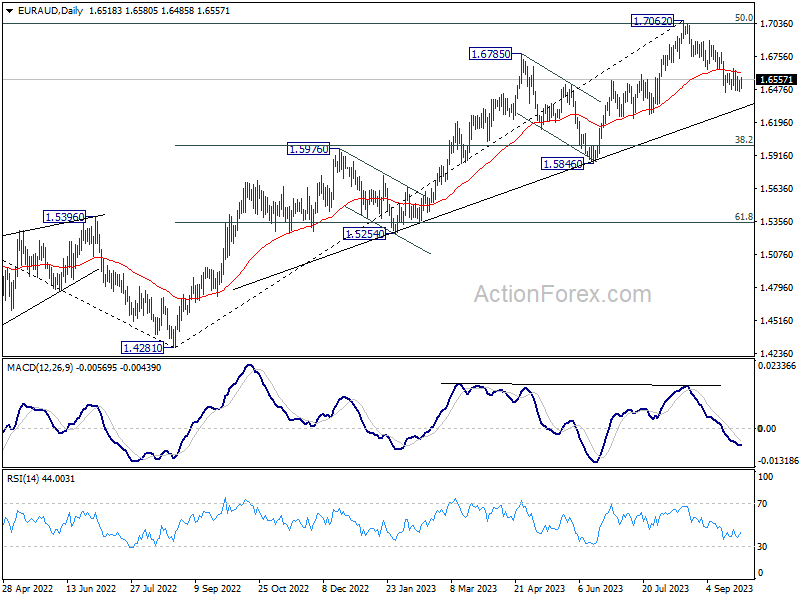
In the bigger picture, fall from 1.7062 is probably correcting whole up trend from 1.4281 (2022 low). Deeper decline would be seen to 38.2% retracement of 1.4281 to 1.7062 at 1.6000. Strong support should be seen there to bring rebound, at least on first attempt.
EUR/CHF Daily Outlook
Daily Pivots: (S1) 0.9665; (P) 0.9674; (R1) 0.9690; More...
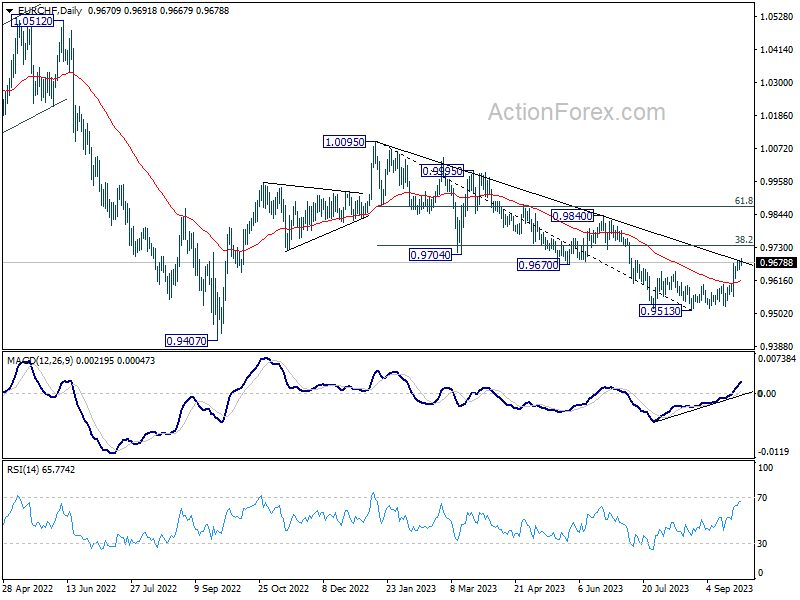
Intraday bias in EUR/CHF is back on the upside as rise from 0.9513 resumed after brief retreat. Further rally would be seen to 38.2% retracement of 1.0095 to 0.9513 at 0.9735. Sustained break there will target 61.8% retracement at 0.9873. On the downside, break of 0.9654 will turn intraday bias neutral again first.
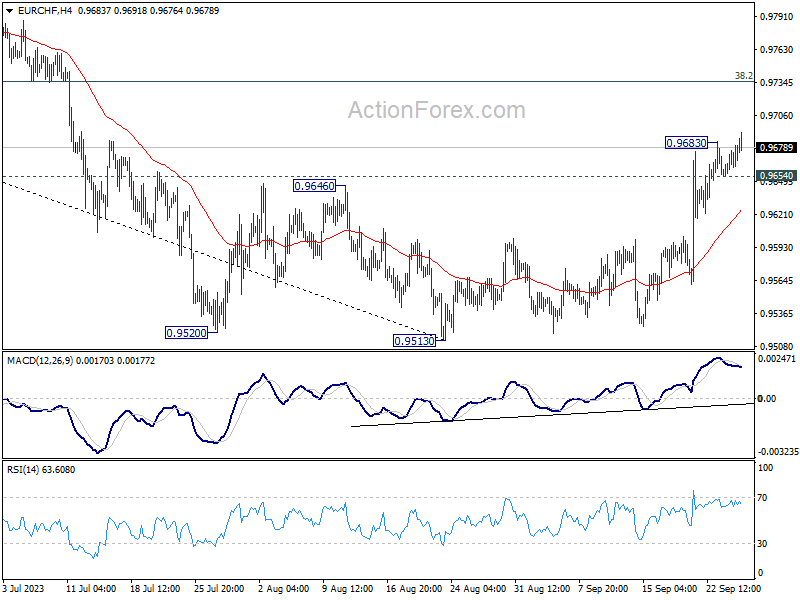
In the bigger picture, medium term outlook will stay bearish as long as the cross is capped well below falling 55 W EMA (now at 0.9799). That is, down trend from 1.2004 (2018 high) could still resume through 0.9407 (2022 low). However, sustained trading above the 55 W EMA will raise the chance that 0.9470 is already a long term bottom. Further rise would then be seen to 1.0095 resistance to indicate bullish trend reversal.