Sample Category Title
EUR/CHF Daily Outlook
Daily Pivots: (S1) 0.9558; (P) 0.9574; (R1) 0.9604; More...
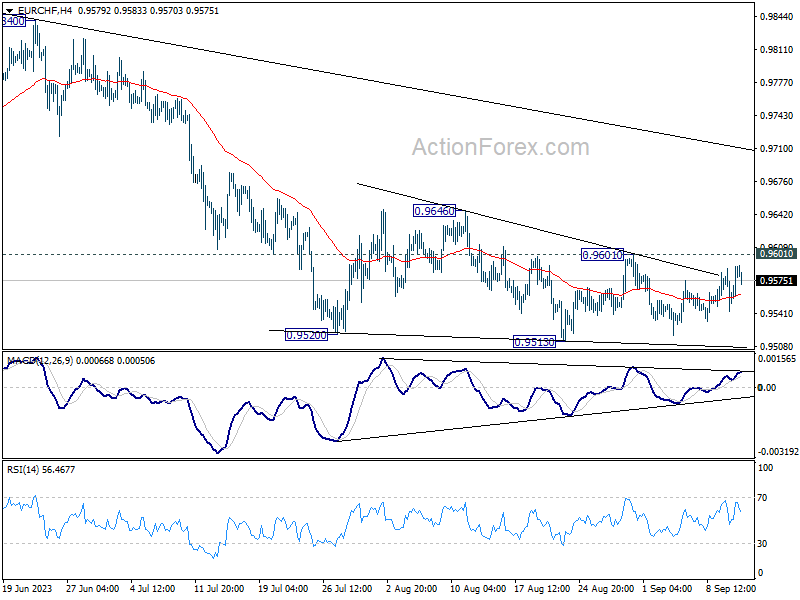
EUR/CHF recovers mildly today but stays in established range. Intraday bias remains neutral at this point. Outlook stays bearish with 0.9601 resistance intact. On the downside, decisive break of 0.9513 will resume the decline from 1.0095, towards 0.9407 low. However, break of 0.9601 resistance will turn bias back to the upside for stronger rebound to 0.9646 resistance and above.
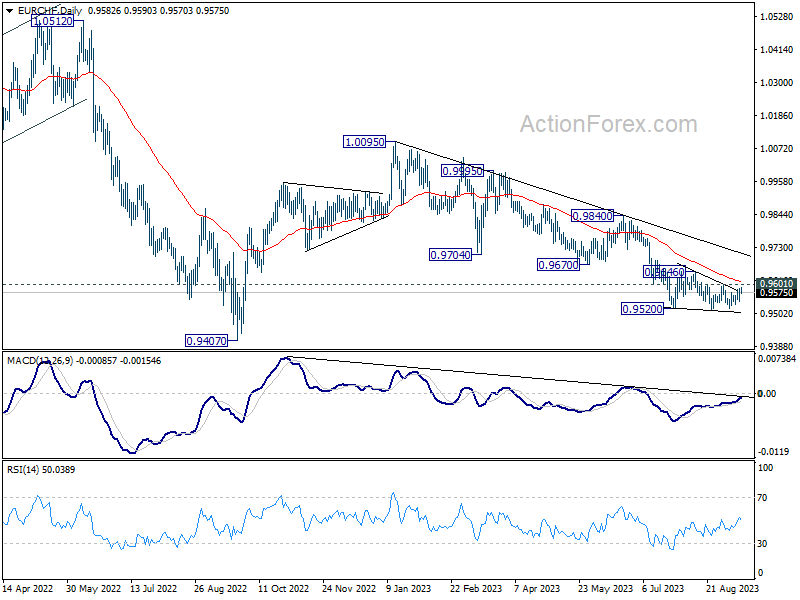
In the bigger picture, medium term outlook is staying bearish as the cross is capped well below falling 55 W EMA (now at 0.9818). Down trend from 1.2004 (2018 high) is in favor to continue. Sustained break of 0.9407 will target 61.8% projection of 1.1149 to 0.9407 from 1.0095 at 0.9018. For now, this will remain the favored case as long as 0.9670 support turned resistance holds, in case of strong rebound.
USD/CAD Daily Outlook
Daily Pivots: (S1) 1.3534; (P) 1.3563; (R1) 1.3583; More....
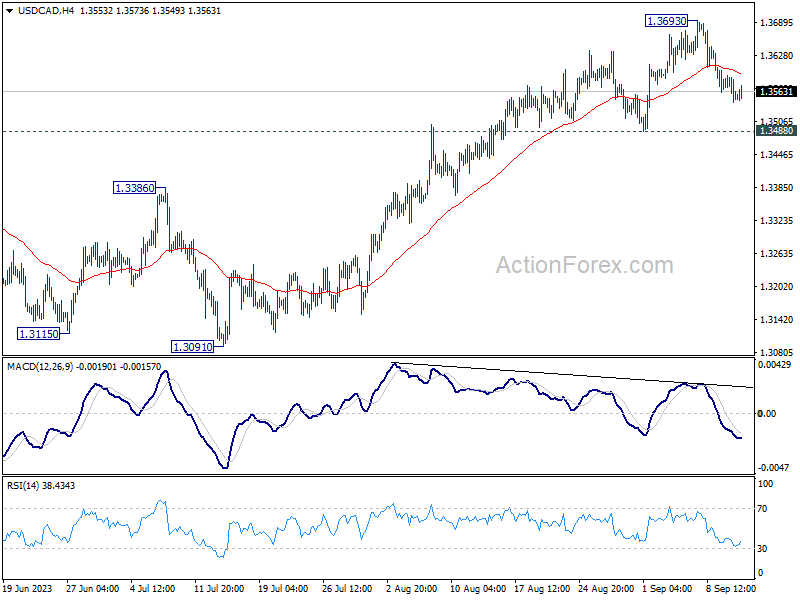
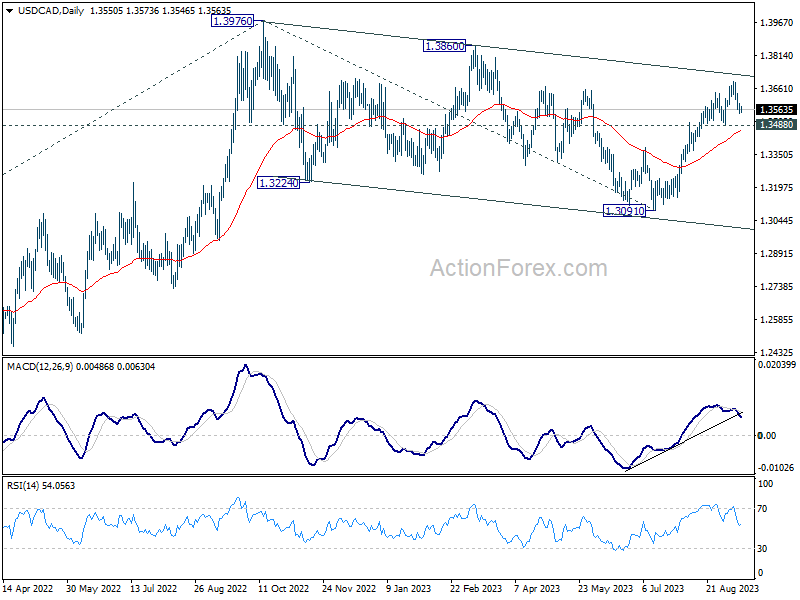
USD/CAD is extending the consolidation from 1.3693 and intraday bias stays neutral. Further rally is expected as long as 1.3488 support holds. Above 1.3693 will resume the rally from 1.3091 to 1.3860 resistance, and then 1.3976 high.
In the bigger picture, price actions from 1.3976 are viewed as a corrective pattern only. Upon completion, rise from 1.2005 (2021 low) would resume through 1.3976. Next target is 61.8% projection of 1.2005 to 1.3976 from 1.3091 at 1.4309. For now, this will remain the favored case as long as 55 D EMA (now at 1.3463) holds.
AUD/USD Daily Report
Daily Pivots: (S1) 0.6409; (P) 0.6427; (R1) 0.6446; More...
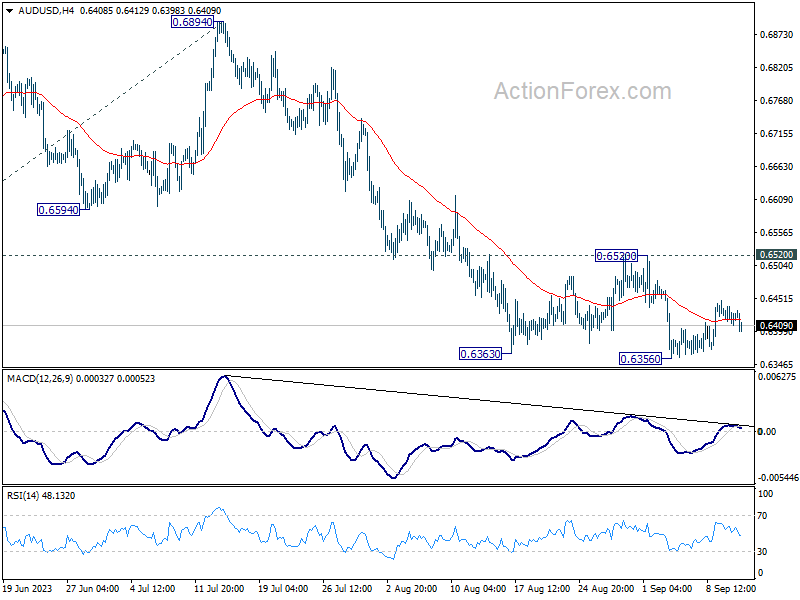
Range trading continues in AUD/USD and intraday bias remains neutral. While stronger recovery might be seen, outlook will stay bearish as long as 0.6520 resistance holds. On the downside, break of 0.6356 will resume larger fall to 100% projection of 0.7156 to 0.6457 from 0.6894 at 0.6195.
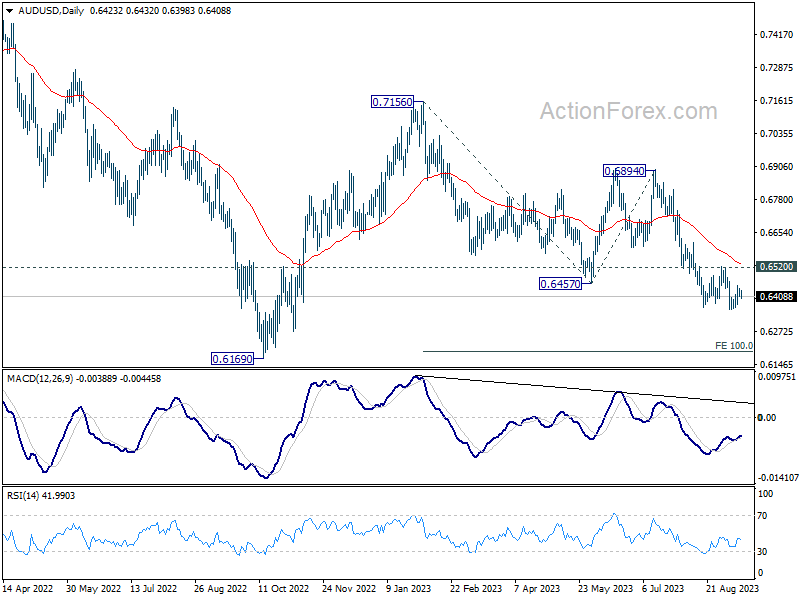
In the bigger picture, current development argues that the down trend from 0.8006 (2021 high) is still in progress. Decisive break of 0.6169 will target 61.8% projection of 0.8006 to 0.6169 to 0.7156 at 0.6021. This will now remain the favored case as long as 0.6894, in case of strong rebound.
USD/JPY Daily Outlook
Daily Pivots: (S1) 146.61; (P) 146.92; (R1) 147.40; More...
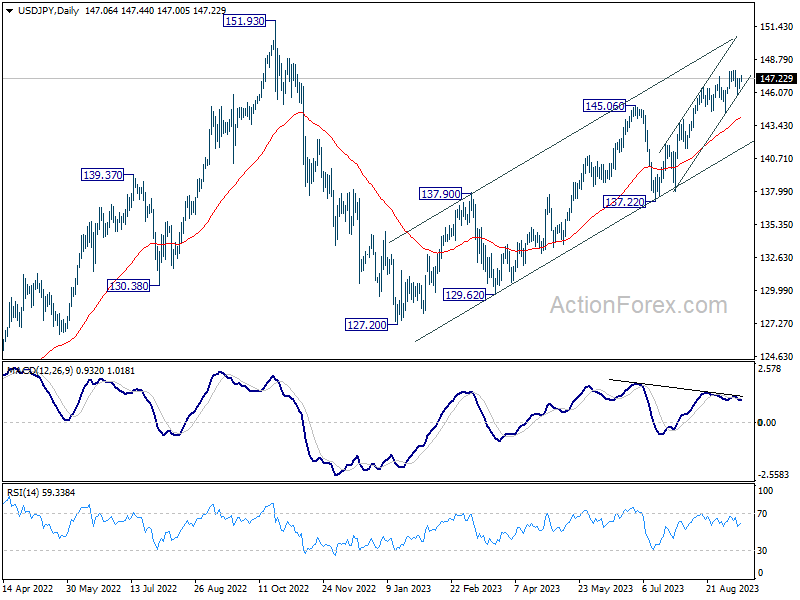
Intraday bias in USD/JPY stays neutral for the moment. Consolidation from 147.88 could extend further. While deeper pullback cannot be ruled out, outlook remains bullish with 144.43 support intact. On the upside, above 147.88 will resume larger rise from 127.20, to retest 151.93 high.
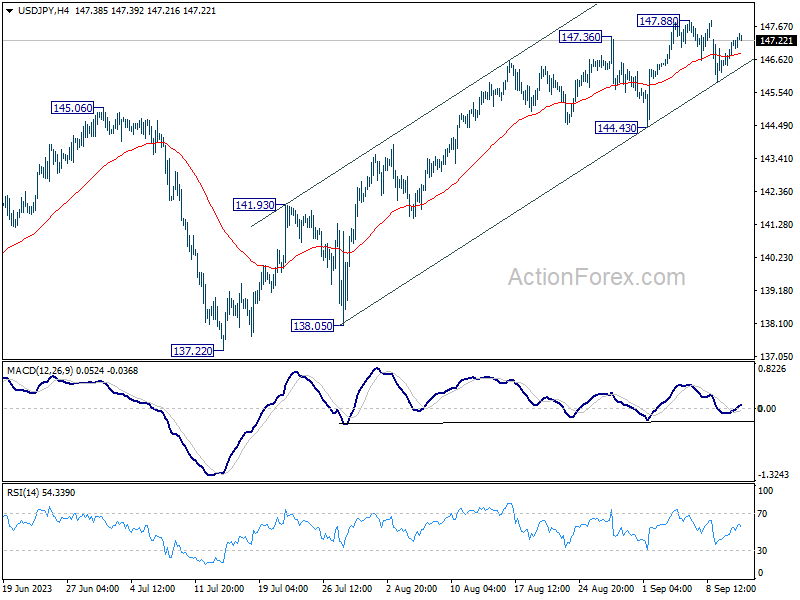
In the bigger picture, while rise from 127.20 is strong, it could still be seen as the second leg of the corrective pattern from 151.93 (2022 high). Rejection by 151.93, followed by break of 137.22 support will indicate that the third leg of the pattern has started. However, sustained break of 151.93 will confirm resumption of long term up trend.
USD/CHF Daily Outlook
Daily Pivots: (S1) 0.8899; (P) 0.8917; (R1) 0.8931; More....
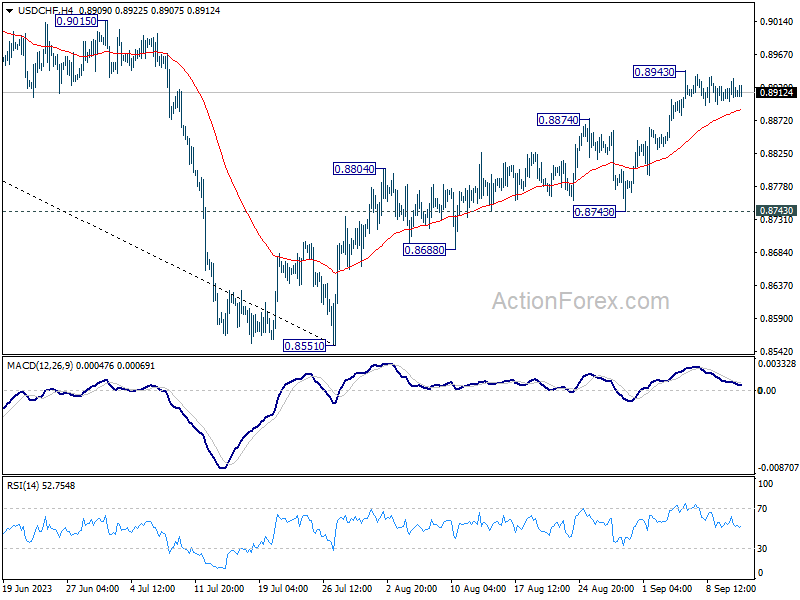
Intraday bias in USD/CHF remains neutral and more consolidations could be seen below 0.8943. While deeper pull back cannot be ruled out, downside should be contained above 0.8743 support to bring another rally. Break of 0.8943 will extend the rise from 0.8551 to 0.9146 cluster resistance.
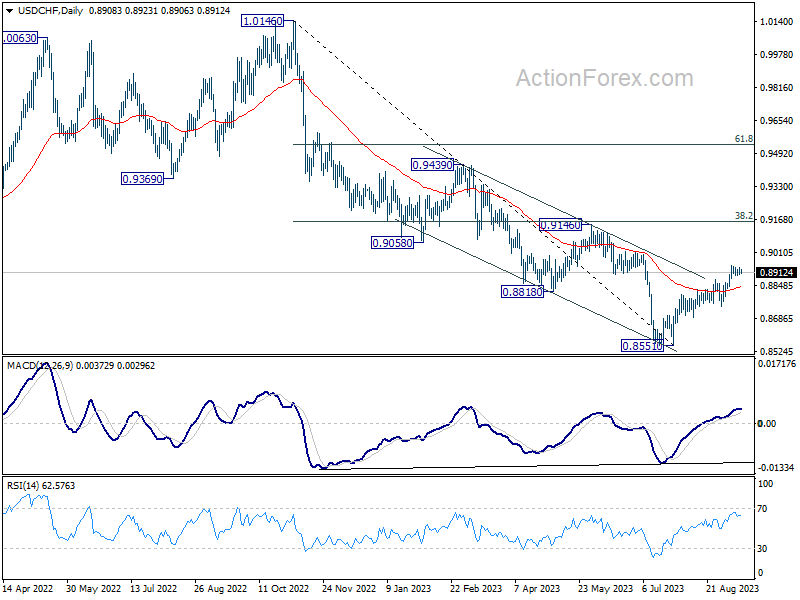
In the bigger picture, rebound from 0.8551 medium term bottom is currently seen as a correction to the downtrend from 1.0146 (2022 high). Further rally would be seen to 0.9146 cluster resistance (38.2% retracement of 1.0146 to 0.8551 at 0.9160). Strong resistance could be seen there to limit upside, at least on first attempt.
GBP/USD Daily Outlook
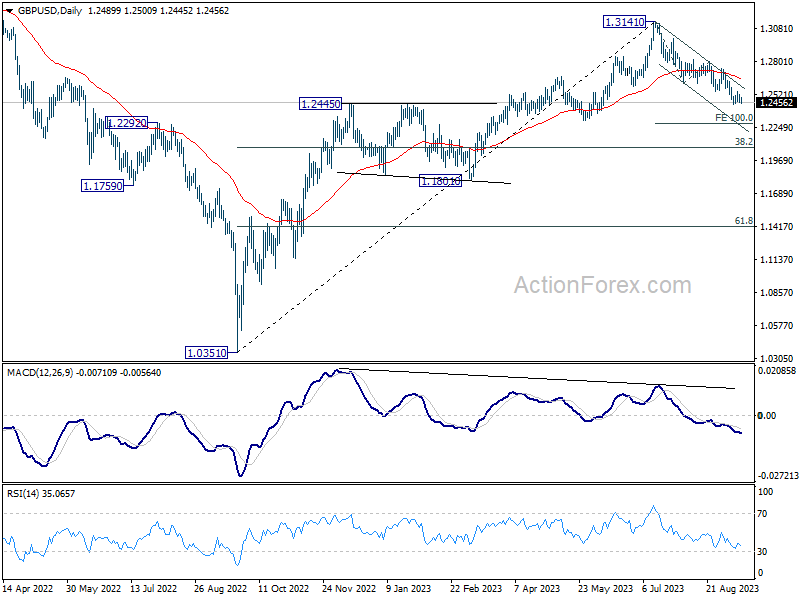
Daily Pivots: (S1) 1.2459; (P) 1.2494; (R1) 1.2529; More...
GBP/USD weakens slightly today but stays above 1.2443. Intraday bias remains neutral at this point and more consolidation could still be seen. In case of another recovery, upside should be limited by 1.2618 support turned resistance to bring another fall. Break of 1.2443 will resume the decline from 1.3141 and target 100% projection of 1.3141 to 1.2618 from 1.2799 at 1.2276.
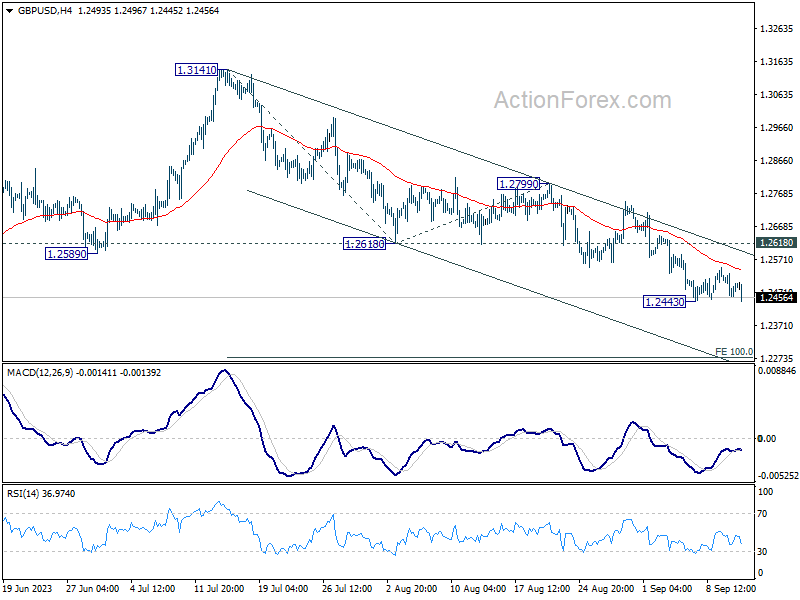
In the bigger picture, fall from 1.3141 medium term top is seen as a correction to up trend from 1.0351 (2022 low). Deeper decline would be seen to 38.2% retracement of 1.0351 to 1.3141 at 1.2075. Strong support would be seen there to bring rebound on first attempt. But outlook will be neutral at best as long as 1.3141 resistance holds, and consolidation from there is set to extend, until further development.
Today’s Focus Goes to US Inflation Numbers
Markets
UK Gilts outperformed yesterday following the latest labour market report. Job losses and a fresh uptick in the unemployment rate (4.3%, highest in 2 years) outweighed accelerating wages. It strengthens the UK stagflation case in which the Bank of England will soon err on the dovish side of expectations. A (final?) 25 bps rate hike at next week’s policy meeting is still the base case though. UK Gilt yields lost 4.5 bps to 5.5 bps with the belly of the curve slightly outperforming the wings. Damage for sterling remained modest with EUR/GBP closing just below minor resistance at 0.8611. Cable closed at 1.2490, holding just above the recent sell-off low (1.2446).
German Bunds underperformed as investors placed some final bets on the outcome of Thursday’s ECB meeting. Though finetuning in nature, money markets now attach a >50% probability to a 25 bps rate hike; our preferred scenario. There was no economic news to drive the move. German yields eventually added up to 2.8 bps at the front end of the curve. German Bunds opened significantly weaker as well this morning after news agency Reuters reported that the ECB’s updated quarterly projections will put inflation north of 3% in 2024. That’s both above the 2% inflation target and above the 3% forecast from June, bolstering the case for a rate hike over a skip even as growth loses momentum. The same source said that growth prognosis will be downgraded for this year (0.9% in June) and next year (1.5%). EUR/USD spiked higher on the report, from 1.073 to 1.076 to currently change hands near 1.075.
US yield changes varied between +3.1 bps (2-yr) and -2.1 bps (30-yr). The US Treasury’s $35bn 10-yr Note auction was awarded at 4.289%, het highest since 2007 and spot on the 1:00 PM bid yield. The bid cover was in line with recent average (2.52). The Treasury ends its refinancing operation tonight with a $20bn 30-yr Bond auction, but today’s focus goes to US inflation numbers. August headline CPI is expected at 0.6% M/M and 3.6% Y/Y (up from 3.2% Y/Y) with core CPI prognosed at 0.2% M/M and 4.3% Y/Y (from 4.7% Y/Y). We believe that an upward surprise won’t alter Fed plans to keep policy rates stable at next week’s meeting. In such scenario, it could even be the longer end of the curve which underperforms. As a WSJ article suggests today: “for the past year, officials have placed the burden on evidence of a slowing economy to justify pausing rate increases. As inflation cools, the burden has shifted toward evidence of an accelerating economy to justify higher rates.”
News and Views
House Speaker Kevin McCarthy launched an impeachment inquiry into President Biden yesterday. The probe centers on whether Biden benefited from his son’s business dealings in Ukraine and elsewhere. "These are allegations of abuse of power, obstruction and corruption, and warrant further investigation by the House of Representatives," McCarthy said. The move is seen as addressing demands of some Republican hardliners that have supported McCarthy as Speaker in January but could now move to oust him if their requests are denied. Whether the inquiry will lead to an actual vote is highly uncertain. And even if it does, it’s unclear it will get enough backing in the House (let alone the Democratic-led Senate), where Republicans hold only a thin majority. Some moderates have already expressed unease with the probe. The impeachment procedure can also be linked to a potential government shutdown by September 30. Some Republicans threatened to vote against funding for the government unless McCarthy proceeded with the inquiry.
The European Parliament yesterday voted to increase the share of renewable power in its energy mix from 30% to 42.5% by 2030. It’s a significant rise that comes with France dropping opposition after securing some concessions for a better recognition of nuclear power – which makes up about 75% of its own energy mix. Legislators also decided to loosen permitting procedures for renewable energy projects. With it, they aim to unlock about 130 gigawatt in pending investments that currently await European approval. Yesterday’s decision follows the G20 summit last weekend, where it was decided to triple green energy capacity by 2030.
Oil Reaches Highest Price this Year Ahead of US CPI
Market movers today
The most important data release of the day will be the US August CPI.
In the euro area, we receive industrial production figures for July. The industry has suffered the whole year and recent business surveys suggest that the suffering only got worse in July.
In the UK, the monthly GDP estimate is due for release for July.
The 60 second overview
Markets. US stocks faced a decline, while oil prices reached their highest levels in 2023. The S&P 500 slipped by 0.6%, primarily due to declines in tech giants such as Apple, despite gains in oil and gas companies. Additionally, the Nasdaq Composite saw a 1% decline. The pan-European Stoxx 600 index concluded the day with a 0.2% dip, revealing a mixed performance across sectors and major bourses. Notably, chemicals stocks experienced a 1.5% decline, leading the losses, while autos and telecoms stocks exhibited a 0.7% rise. 2-year US Treasury yields stayed firm above 5%, while the USD traded in narrow ranges. Brent crude rose by 1.8% and is now above USD 92 per barrel, which is the highest level since November 2022. This morning, Asian markets are in negative territory across the board.
We expect headline US CPI growth to pick up to +0.5% m/m (3.6% y/y) largely due to higher energy prices, but forecast core CPI growth remaining low at only +0.2% m/m (4.3% y/y). Slowing nominal wage growth continues to ease price pressures on the broader core services sector, while past slowdown in rent growth continues to feed into slower shelter inflation. While the Fed is widely expected to stay on hold at next week's meeting, another low print could ease the pressures to keep hiking in the later November and December meetings.
UK labour market report for July/August was broadly in line with expectations. The unemployment rate increased to 4.3% (up from 4.2%). Average wage growth excl. bonuses were relatively steady at 7.83% (from 7.79%) with wage growth incl. bonuses increasing to 8.5% due to NHS and Civil Service one-off payments made in June and July 2023. Private sector pay growth slowed marginally suggesting a peak might be near.
German ZEW expectations surprised with an increase in September to -11.4 (prior: -12.3, cons: -15.0). The assessment of the current economic situation fell to -79.4 from -71.3 in August. Although expectations improved slightly, ZEW signals further declines in PMI ahead and increasing recession risk with the average ZEW value at the lowest level since the pandemic.
Equities: Global equities were lower yesterday and basically reversing the Monday moves. Energy sector was lifted by a higher oil price while banks were doing good on a higher-for-longer push. As tech was the worst performing sector it resulted in a quite visible value outperformance yesterday. In US Dow -0.1%, S&P 500 -0.6%, Nasdaq -1.0% and Russell 2000 +0.01%. Asian markets are broadly lower this morning and European futures down half a percent. US futures are a tad lower.
FI: Yesterday's trading session was mostly a waiting game ahead of today's US CPI and tomorrow's ECB meeting. EGB yields were virtually unchanged on the day in the 10y point as were the intra-euro area spreads. Curves flattened marginally. Today's highlight is the US CPI, which points to 0.5-0.6m/m.
FX: EUR/USD remains around the 1.0750 mark. USD/JPY is trending up again after Ueda's hawkish comments earlier this week, trading around the 147 mark. EUR/GBP rose above the 0.86 mark. EUR/SEK trades above 11.90, while EUR/NOK is hovering around 11.50.
Credit: Credit markets were a little soft yesterday, iTraxx Main went 1.3bp wider to 71.5bp while iTraxx Crossover went 4.2bp wider to 399.1bp. The new issue activity across the Nordic market remains busy demonstrated by deals from Stolt-Nielsen in NOK, New Lansforsakringar Bank and Nordic Investment Bank in SEK, Borgo AB tap in SEK, and Arbejdernes Landsbank in DKK. On a broader primary note, Bloomberg reports of good investor appetite underpinned by sizeable spread compression and oversubscribed book coverage.
Happy CPI-Day, With Love, OPEC
The S&P 500 slipped below its 50-DMA, as Apple’s new iPhone15 failed to spark buying interest for the heavily battered stock on Tuesday’s product reveal. Apple shares fell 1.70%. Oracle dropped 13.5%, the most in 21 years, after reporting slower cloud sales growth whereas investors were hoping AI to make numbers look more beautiful than what was announced. Still, the company chairman said that ‘companies in the area have signed contracts to purchase more than $4 billion of capacity from Oracle’s cloud service.’ It didn’t help. Google on the other hand fell more than 1%, but yesterday’s fall was certainly due to a global lack of risk appetite rather than the fact that the biggest antitrust trial of the modern times against Google started in Washington yesterday. The trial will last two months. Google is accused to have expanded its monopoly through exclusive contacts and deals that made it the default research engine on phones and internet browsers, rather than through innovations. Honestly, I hear that, but the antitrust news has barely impacted any Big Tech in the past, I don’t see why this time would be different.
Crude at a 10-month high
I have a good and a bad news for you, regardless of how bullish or bearish you are in oil. I will start with the good news for planet and inflation. The IEA said that it forecasts demand for coal, natural gas and oil to peak before 2030, thanks to ‘renewables increasingly outmatching gas for producing electricity, the rise of heat pumps and Europe’s accelerated shift away from gas following Russia’s invasion of Ukraine’. The IEA’s executive director Fatih Birol said that this is the ‘beginning of the end of the fossil fuel era’. That’s the good news, and that could’ve pulled oil prices lower. BUT NO, US crude rallied past the $89pb, as OPEC, on its end, forecasted a shortfall of around 3.3mbpd next quarter thanks to Saudi Arabia’s supply cut extension. If that’s the case, a deficit of 3.3mbpd would be the highest in over a decade according to Bloomberg. And the oil deficit next quarter is obviously a bigger concern than a peak in oil demand before 2030.
The million-barrel question is, what’s the upside potential in oil prices? In the actual inflationary environment, the rally should not extend too far, and prices could hardly stay sustainably above $90pb. Rising oil prices lead to rising inflation and inflation expectations, which then fuel hawkish policies from global central banks, and increase the recession odds. Recession odds weigh on demand prospects, hence should jeopardize the oil’s rally at some point. Big Oil companies are however a safer play for energy investors as 1. they immediately benefit from rising oil prices, and they have juicy dividend yields, and regularly announce stock buybacks when they make a lot of cash, and 2. as bad as it sounds, they will be the ones that could make the energy transition happen effectively on a large scale.
US inflation
Today, the US will release its latest inflation update, and it will be very important in terms of where the Federal Reserve (Fed) expectations will be headed, especially for the November meeting. The headline inflation is expected to have ticked higher from 3.2% to 3.6% in August, due to the spike in energy prices, but core inflation may have eased from 4.7% to 4.3%.
How do you interpret the mixed set of numbers? Well, you can’t really tell by looking at yearly numbers at this stage, because the base effect is very strong, which makes the numbers a bit ‘outdated’ if you are trying to predict where inflation is headed next (which really matters). The headline inflation is expected to have jumped to 0.6% on a monthly basis in August, that’s an annual inflation rate of 7.4%. Of course, it doesn’t mean that inflation will hit 7.4% (I hope not). But a 0.6% monthly rise in inflation is a big jump. And energy prices don’t soothe investors’ nerves at this point.
Technical Outlook and Review
DXY:
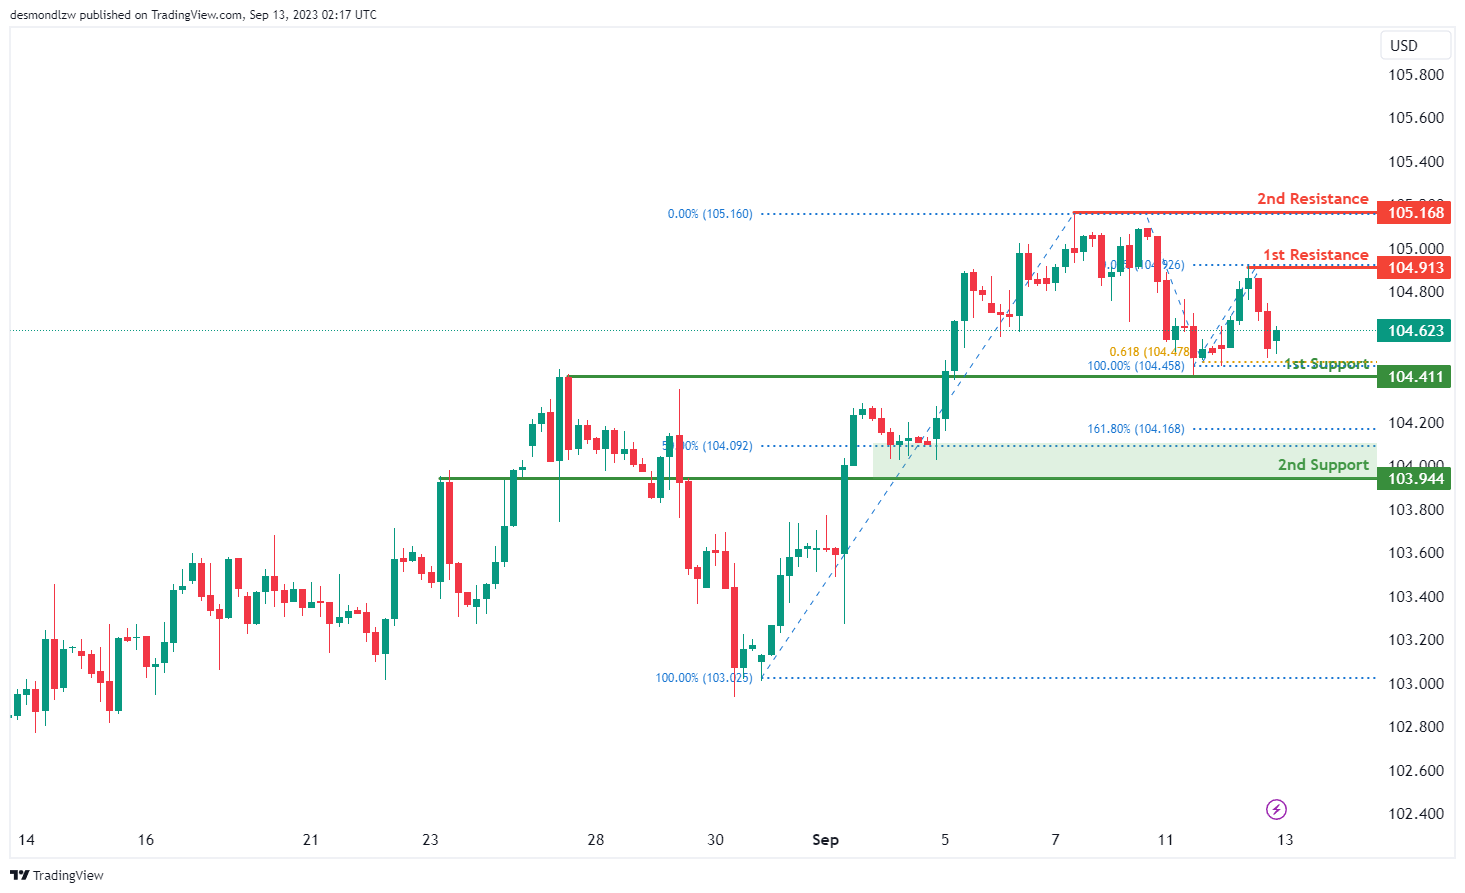
The DXY (US Dollar Index) chart currently demonstrates a bullish momentum, indicating a potential upward trend in price movement. There’s a possibility of a bullish rebound from the 1st support level at 104.41, which is an overlap support. The 2nd support at 103.94 also reinforces the support zone as it aligns with a 50% Fibonacci Retracement level.
On the upside, the 1st resistance at 105.09 represents a multi-swing high resistance, indicating a level where price might face hurdles. Additionally, the 2nd resistance at 105.61, marked as the 161.80% Fibonacci Retracement level, further adds to the potential resistance.
EUR/USD:
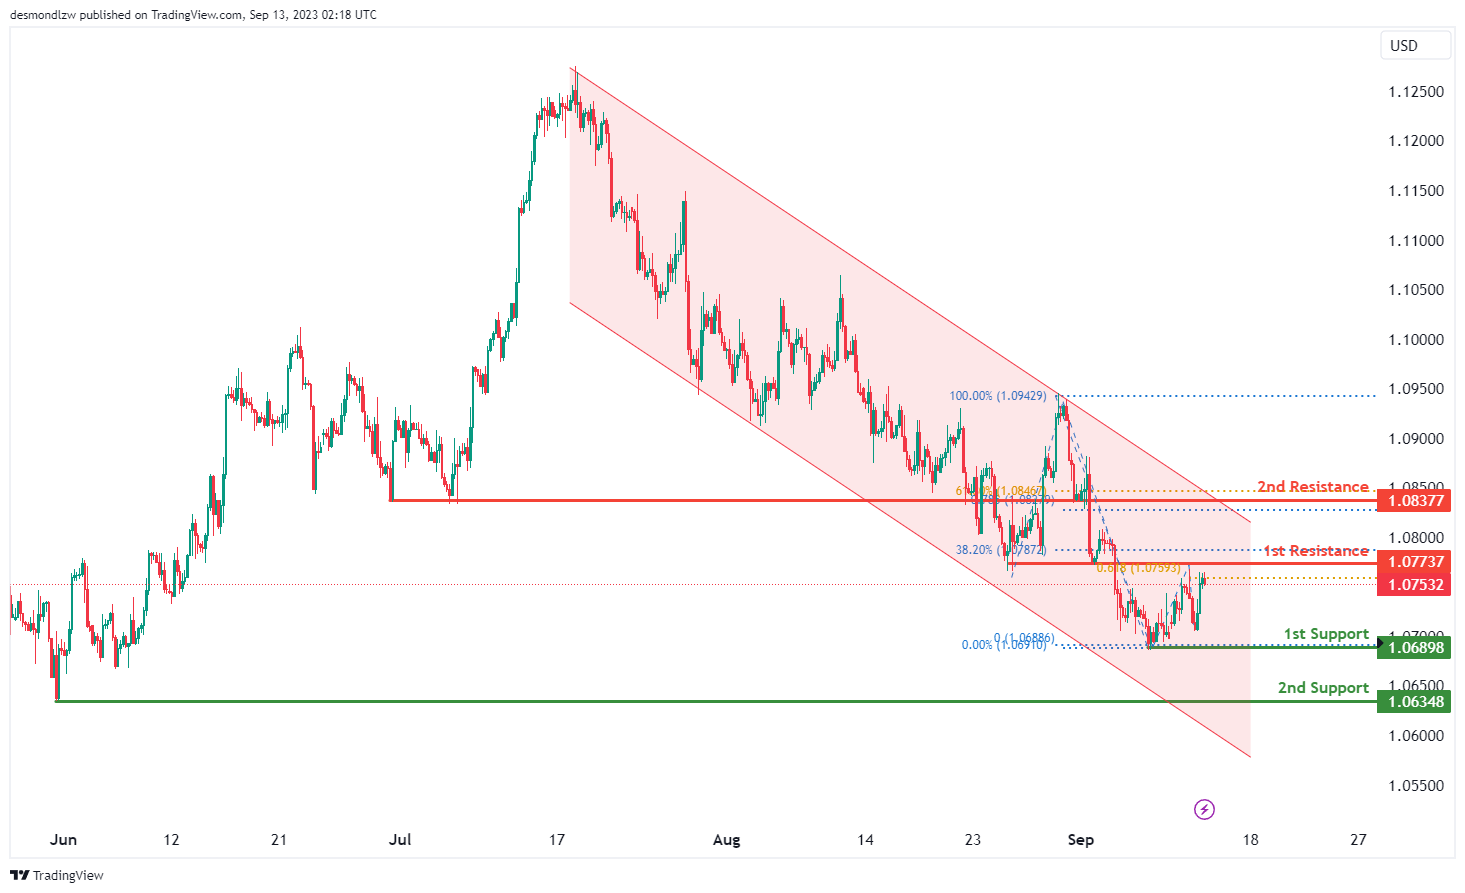
The EUR/USD chart currently maintains a bearish momentum, primarily driven by its movement within a bearish descending channel. This sets the stage for a potential bearish reaction at the 1st resistance level of 1.0773, which holds significance as an overlap resistance. This level aligns with both the 38.20% Fibonacci Retracement and the 61.80% Fibonacci Projection, signifying Fibonacci confluence.
On the downside, the 1st support at 1.0689 serves as a critical level for potential price rebounds, being a swing low support. Additionally, the 2nd support at 1.0634, also corresponding to a swing low support, reinforces its potential as a support zone.
EUR/JPY:
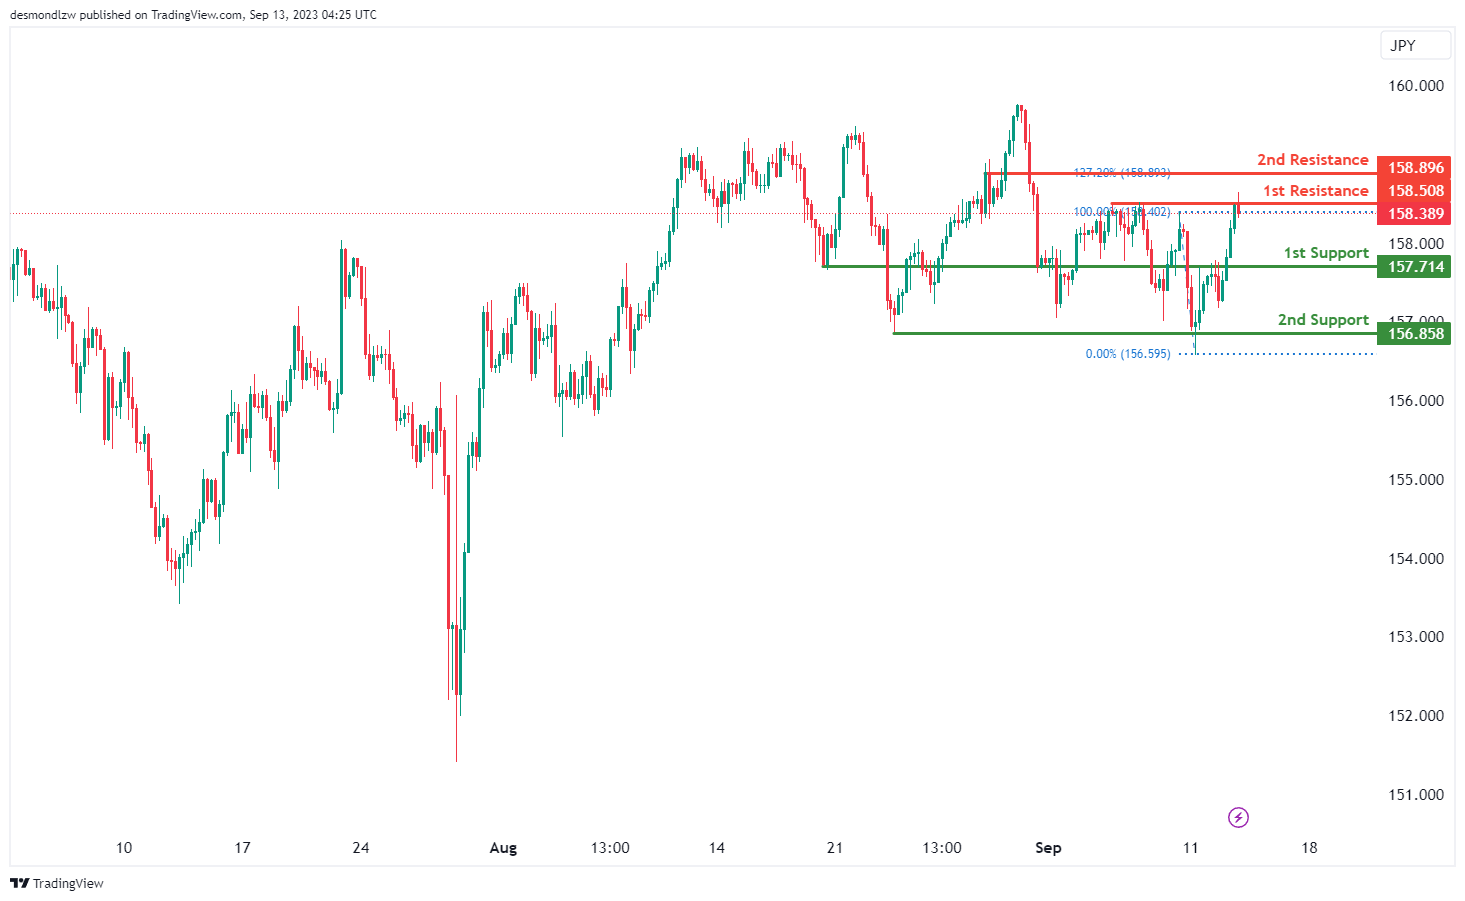
For EUR/JPY, the overall momentum of the chart is currently bearish, indicating a downward trend.
There is potential for the price to have a bearish reaction off the 1st resistance level at 158.50 and drop to the 1st support at 157.71.
The 1st support at 157.71 is considered significant because it represents a pullback support, suggesting potential stability and support at this level.
In case of a more substantial decline, the 2nd support level at 156.85 is also noteworthy, representing multi-swing low support, offering additional reinforcement for the price.
On the upper side, the 1st resistance at 158.50 is considered important due to its characteristics as multi-swing high resistance.
Further upward movement could face resistance at the 2nd resistance level of 158.89, characterized as pullback resistance and aligned with the 127.20% Fibonacci Extension, potentially posing a significant barrier to the bullish momentum within the observed range.
EUR/GBP:
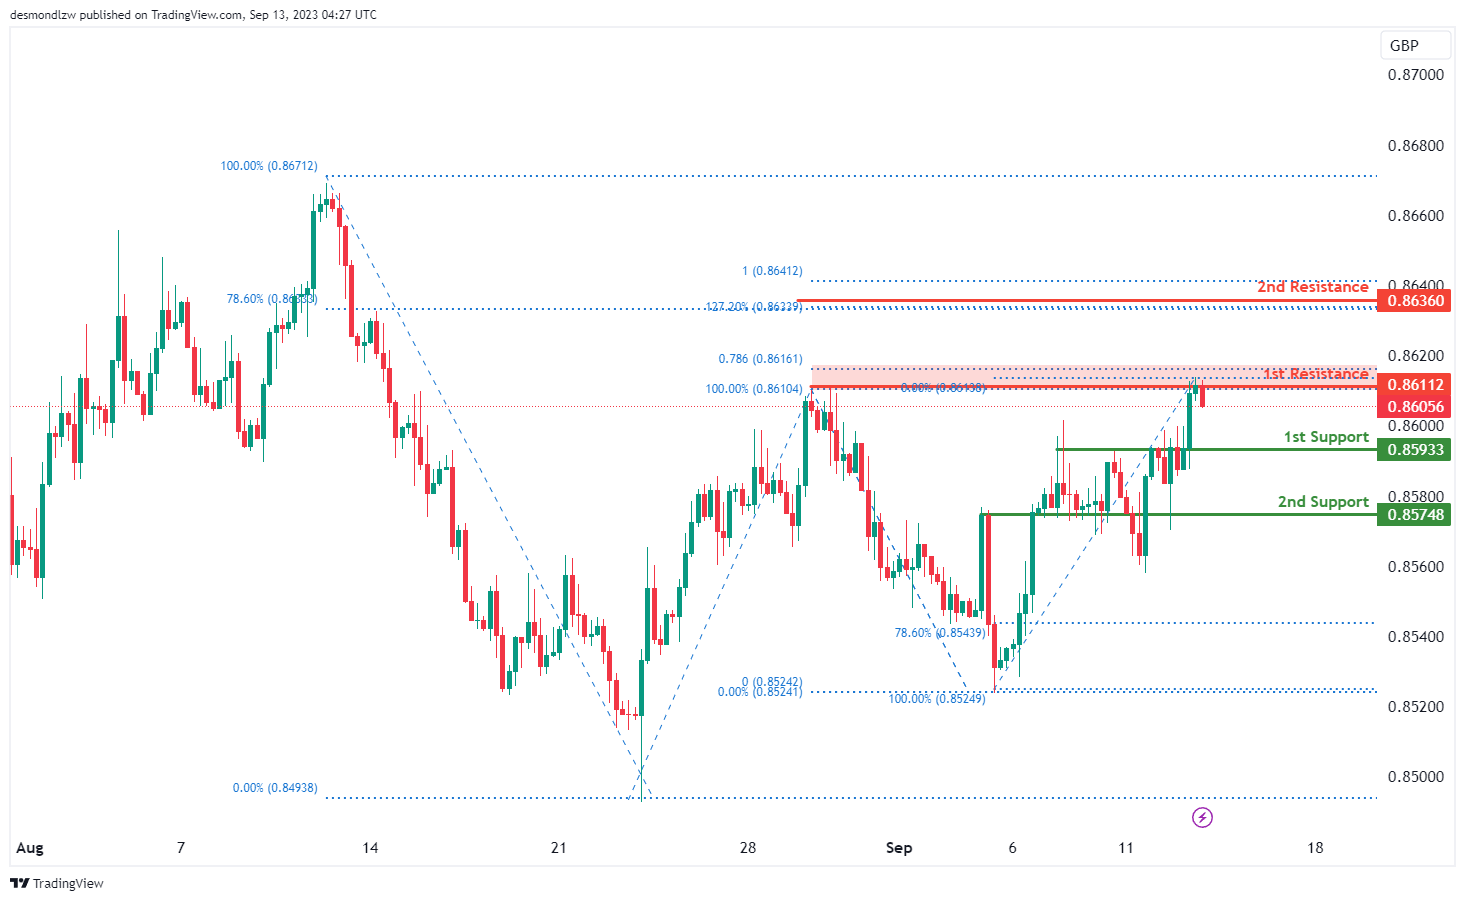
For EUR/GBP, the overall momentum of the chart is currently bearish, indicating a downward trend.
There is potential for the price to continue its bearish movement towards the 1st support level at 0.8593. This 1st support is considered significant because it represents pullback support and aligns with the 23.60% Fibonacci Retracement, indicating potential stability and support at this level.
In case of a more substantial decline, the 2nd support level at 0.8574 is also noteworthy, as it represents an overlap support.
On the upper side, if there’s a reversal in the price, it may face resistance at the 1st resistance level of 0.8611, which is characterized as multi-swing high resistance and is supported by the 78.60% Fibonacci Projection.
Further upward movement could encounter resistance at the 2nd resistance level of 0.8636. This level is notable because it aligns with both the 127.20% Fibonacci Extension and the 78.60% Fibonacci Retracement, indicating strong potential resistance due to Fibonacci confluence.
GBP/USD:
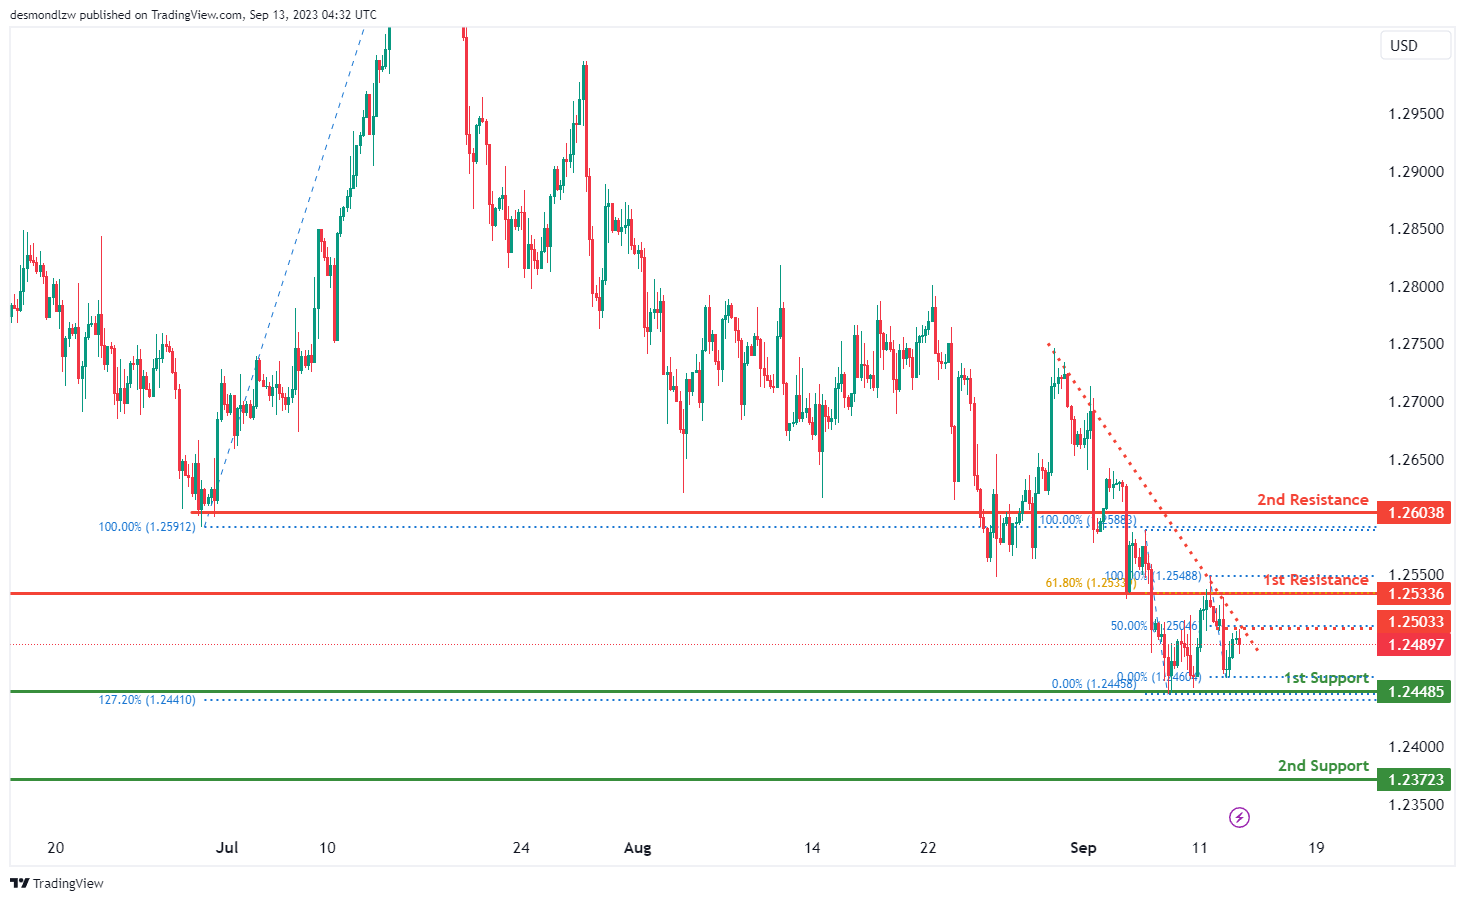
The GBP/USD chart currently displays a bearish overall momentum, with one significant contributing factor being its position below a major descending trendline, which suggests the potential for further bearish movement. In this scenario, there’s the likelihood of a bearish continuation towards the 1st support level at 1.2448, which is marked as an overlap support and is associated with the 127.20% Fibonacci Expansion. Additionally, the 2nd support at 1.2372 is also identified as an overlap support.
On the resistance side, the 1st resistance at 1.2533 serves as an overlap resistance, coinciding with the 61.80% Fibonacci Retracement, which adds to its significance. Similarly, the 2nd resistance at 1.2603 is characterized as an overlap resistance.
GBP/JPY:
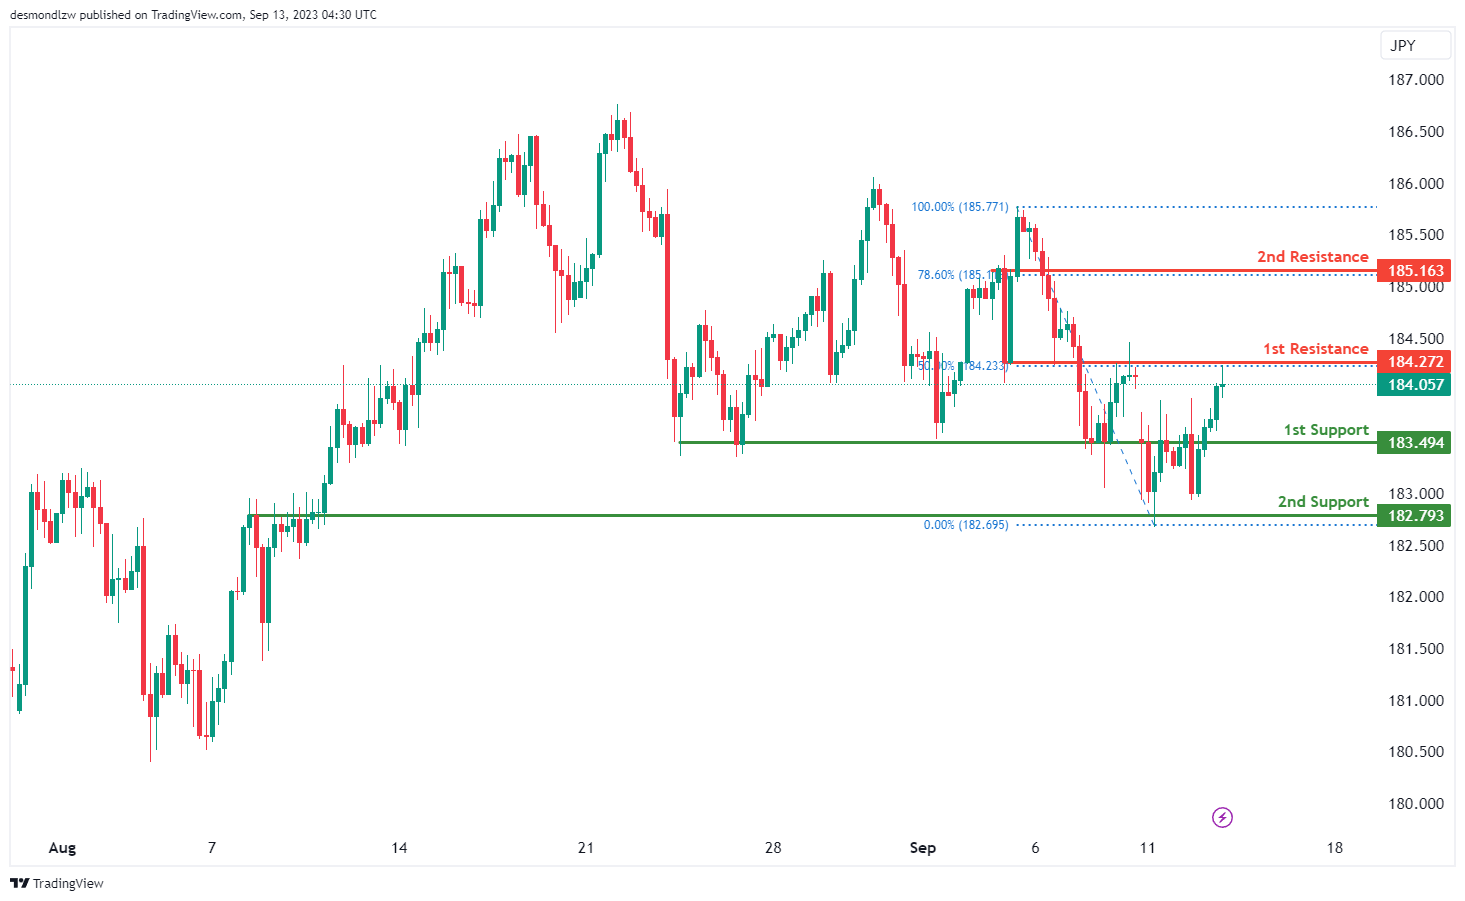
For GBP/JPY, the overall momentum of the chart is currently bearish, indicating a downward trend.
There is potential for the price to have a bearish reaction off the 1st resistance level at 184.27 and drop to the 1st support at 183.49.
The 1st support at 183.49 is considered significant because it represents a pullback support.
In case of a more substantial decline, the 2nd support level at 182.79 is also noteworthy, representing an overlap support.
On the upper side, the 1st resistance at 184.27 is considered important due to its characteristics as an overlap resistance and its alignment with the 50% Fibonacci Retracement level.
Further upward movement could face resistance at the 2nd resistance level of 185.16, characterized as pullback resistance and aligned with the 78.60% Fibonacci Retracement, potentially posing a significant barrier to the bullish momentum within the observed range.
USD/CHF:
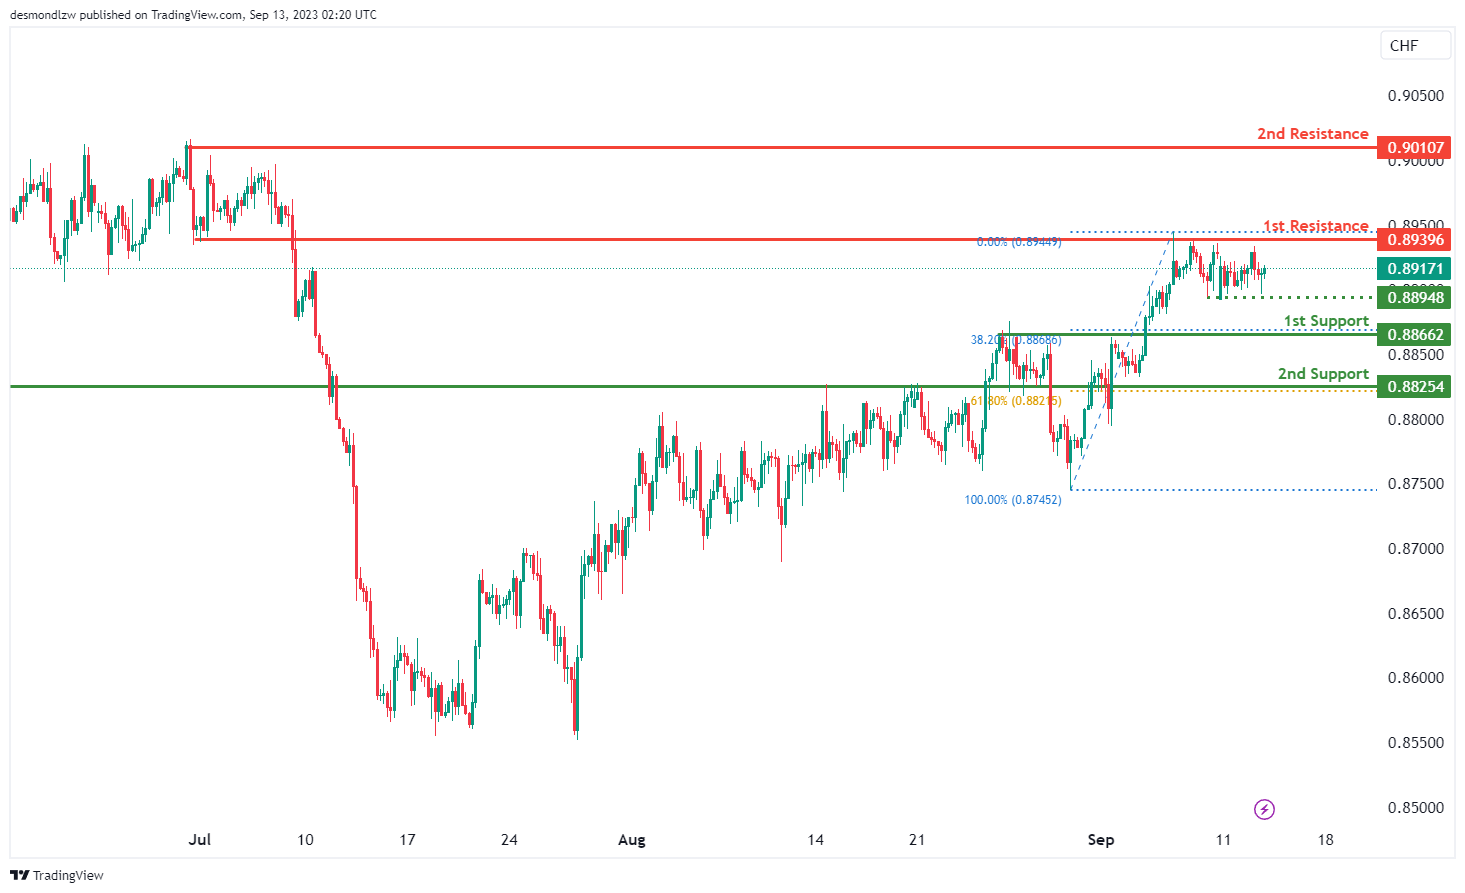
The USD/CHF chart currently exhibits a neutral overall momentum, indicating a lack of a clear bullish or bearish trend. In this context, there’s potential for price to fluctuate between the 1st support and 1st resistance levels.
The 1st support at 0.8866 is identified as a pullback support, while the 2nd support at 0.8825 also serves as a pullback support.
On the upside, the 1st resistance at 0.8939 is noted as an overlap resistance, and the 2nd resistance at 0.9010 is characterized as a swing high resistance.
Furthermore, there’s an intermediate support level at 0.8866, which is considered a multi-swing low support.
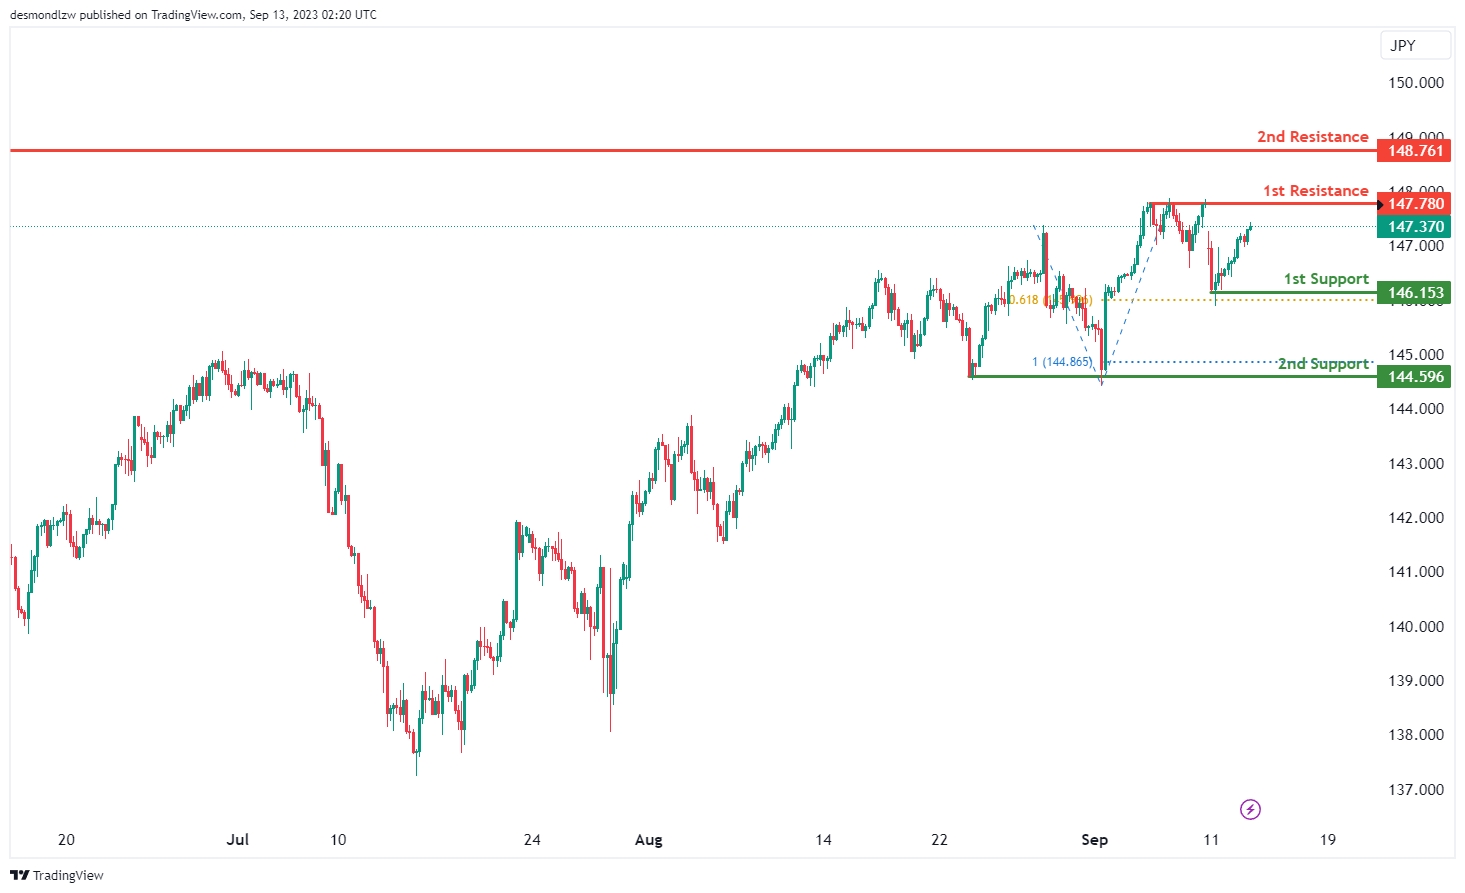
USD/JPY:
The USD/JPY chart currently demonstrates a neutral overall momentum, indicating a lack of a clear bullish or bearish trend. In this context, there’s potential for price to fluctuate between the 1st support and 1st resistance levels.
The 1st support at 146.15 is identified as a swing low support and aligns with the 61.80% Fibonacci Projection. Additionally, the 2nd support at 144.59 is characterized as a multi-swing low support, coinciding with the 100% Fibonacci Projection.
On the upside, the 1st resistance at 147.78 represents a multi-swing high resistance, while the 2nd resistance at 148.76 is marked as a swing high resistance.
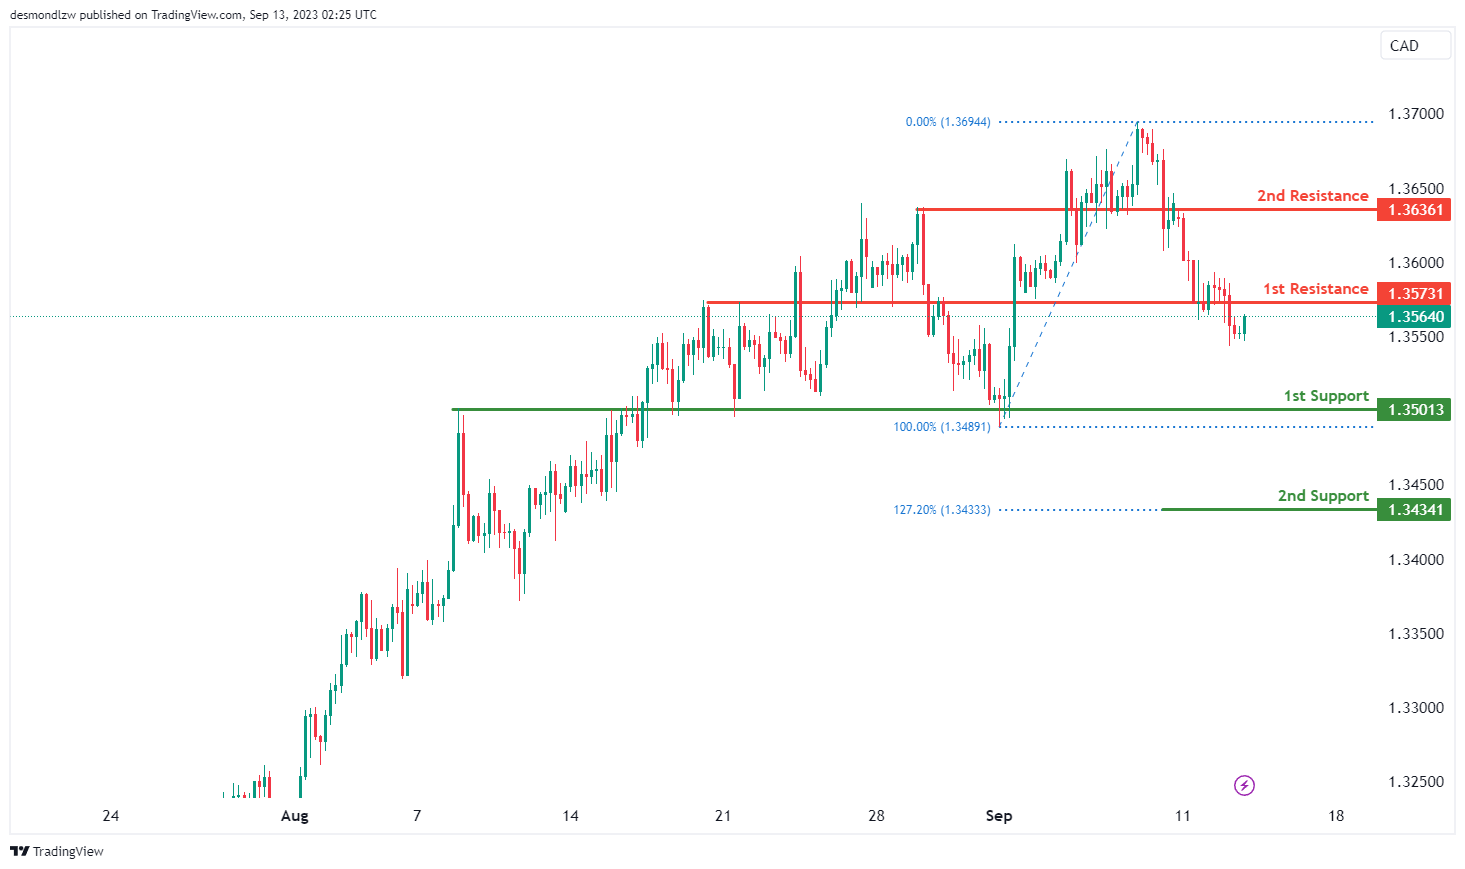
USD/CAD:
The USD/CAD chart currently displays an overall bullish momentum, suggesting a potential upward trend in price movement towards the 1st resistance.
The 1st resistance level at 1.3573 is identified as an overlap resistance while the 2nd resistance level at 1.3636 is also identified as an overlap resistance, indicating its significance as a potential barrier to further bullish movements.
To the downside, the 1st support level at 1.3501 is identified as an overlap support. Additionally, the 2nd support level at 1.3434 is marked as a pullback support that aligns with the 127.20% Fibonacci extension level, reinforcing its potential role as a support level.
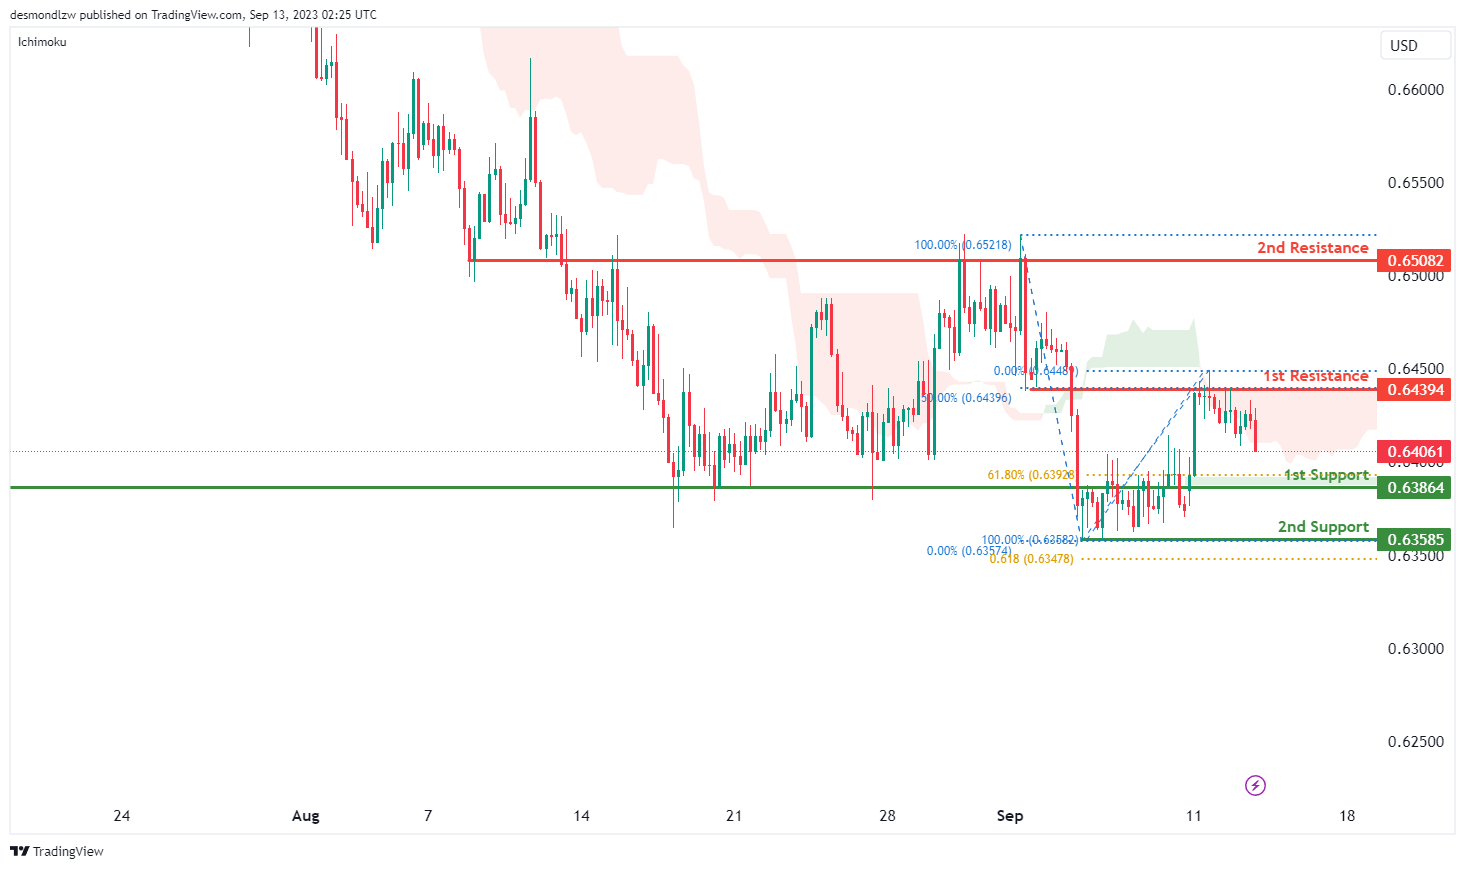
AUD/USD:
The AUD/USD chart currently exhibits an overall bearish momentum, driven by its position below the bearish Ichimoku cloud. There is a potential for a bearish continuation towards the 1st support level.
The 1st support level at 0.6386 is identified as an overlap support that aligns with the 61.80% Fibonacci retracement level. Furthermore, the 2nd support level at 0.6359 is marked as a pullback support that aligns with the 61.80% Fibonacci projection level, reinforcing its potential as a support level.
To the upside, the 1st resistance level at 0.6439 is identified as an overlap resistance that aligns with the 50.00% Fibonacci retracement level. Additionally, the 2nd resistance level at 0.6508 is also marked as an overlap resistance, indicating its significance as a potential barrier to further bullish movements.
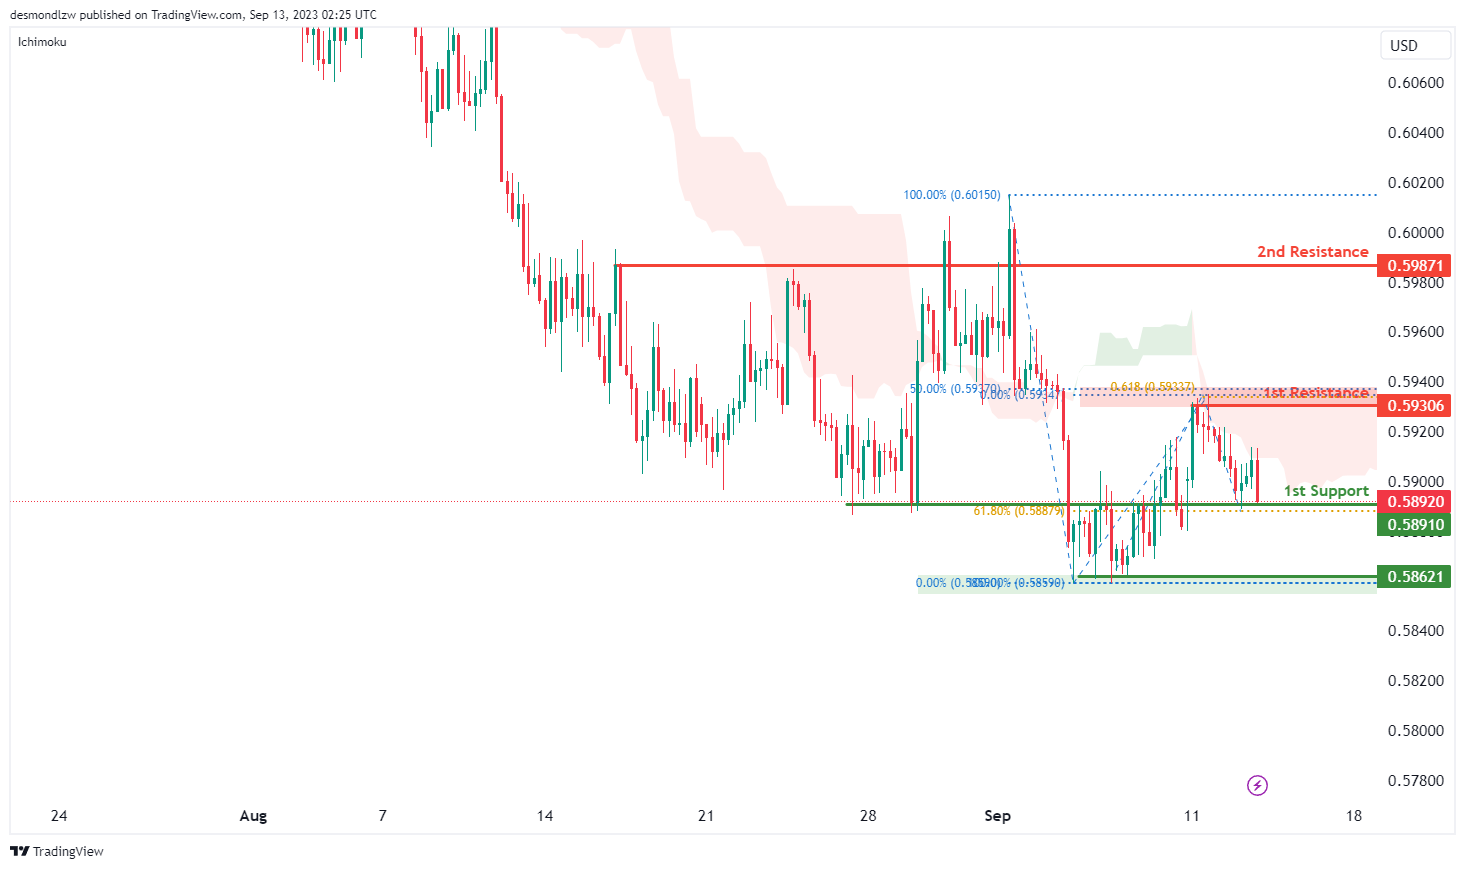
NZD/USD
The NZD/USD chart currently indicates an overall bearish momentum, supported by its position below the bearish Ichimoku cloud. There is a potential for price to experience a bearish breakout through the 1st support level to drop towards the 2nd support level.
The 1st support level at 0.5891 is identified as an overlap support that coincides with the 61.80% Fibonacci retracement level while the 2nd support level at 0.5862 is marked as a pullback support.
To the upside, the 1st resistance level at 0.5931 is identified as an overlap resistance that aligns with a confluence of Fibonacci levels i.e. the 50.00% retracement and the 50% projection levels, indicating a potential area of resistance. Additionally, the 2nd resistance level at 0.5987 is noted as an overlap resistance.
DJ30:
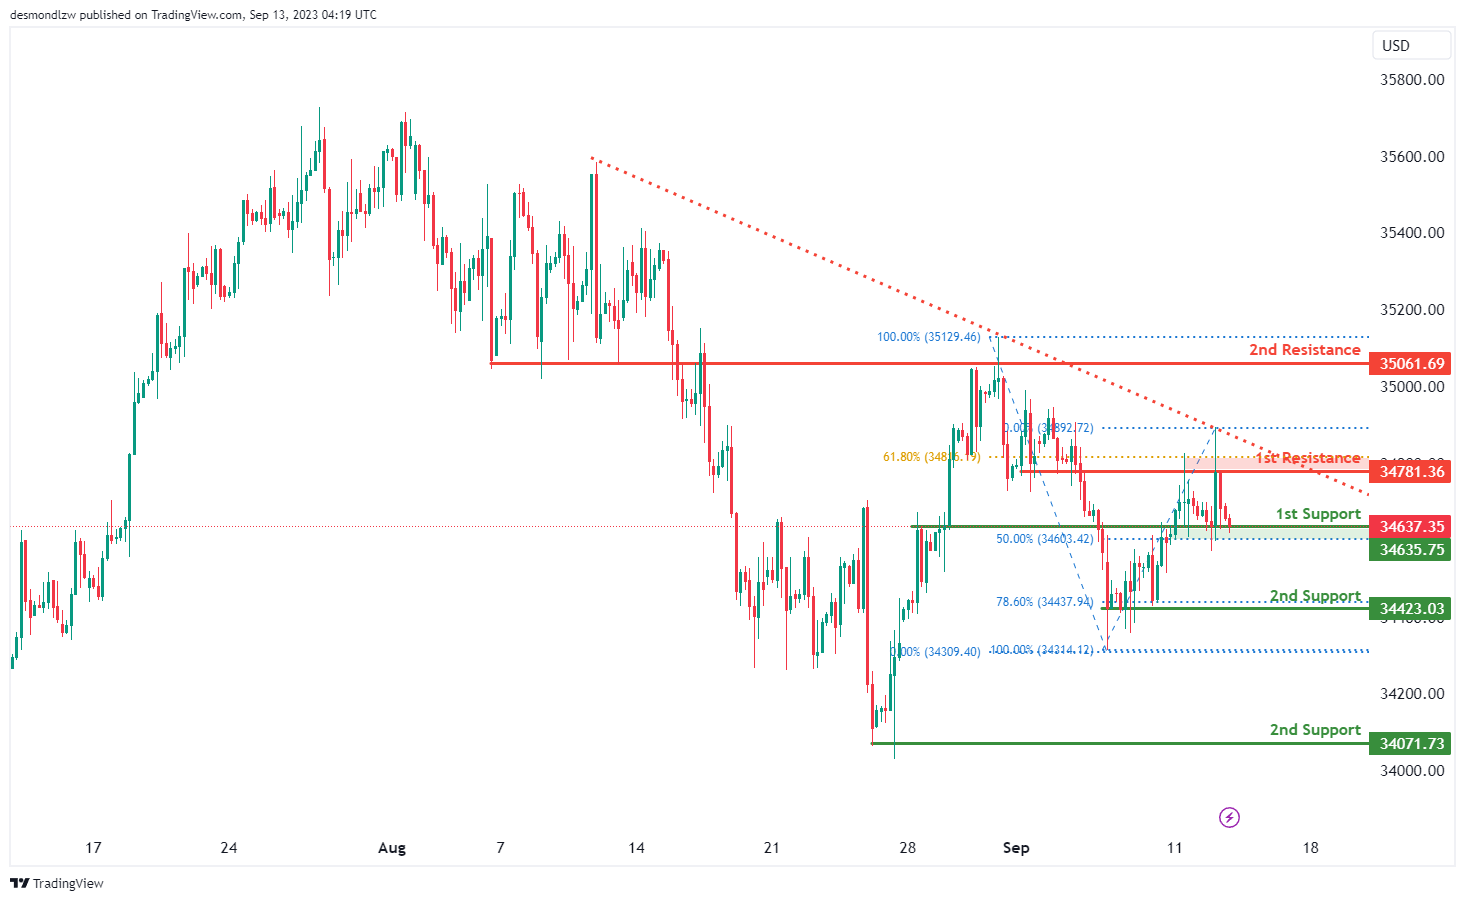
For DJ30, the overall momentum of the chart is currently bullish, indicating an upward trend.
There is potential for the price to make a bullish move by bouncing off the 1st support level at 34635.75 and heading towards the 1st resistance at 34781.36.
The 1st support at 34635.75 is considered significant because it represents an overlap support and aligns with the 50% Fibonacci Retracement level, suggesting potential stability and support at this level.
In case of a more substantial retracement, the 2nd support level at 34423.03 is also noteworthy, as it represents multi-swing low support and aligns with the 78.60% Fibonacci Retracement, offering additional reinforcement for the price.
On the upper side, the 1st resistance at 34781.36 is considered important due to its characteristics as an overlap resistance and its alignment with the 61.80% Fibonacci Retracement level. This level may act as a barrier to downward movement.
Further upward movement could face resistance at the 2nd resistance level of 35061.69, characterized as an overlap resistance, which could pose a significant challenge to the bearish momentum within the observed range.
GER30:
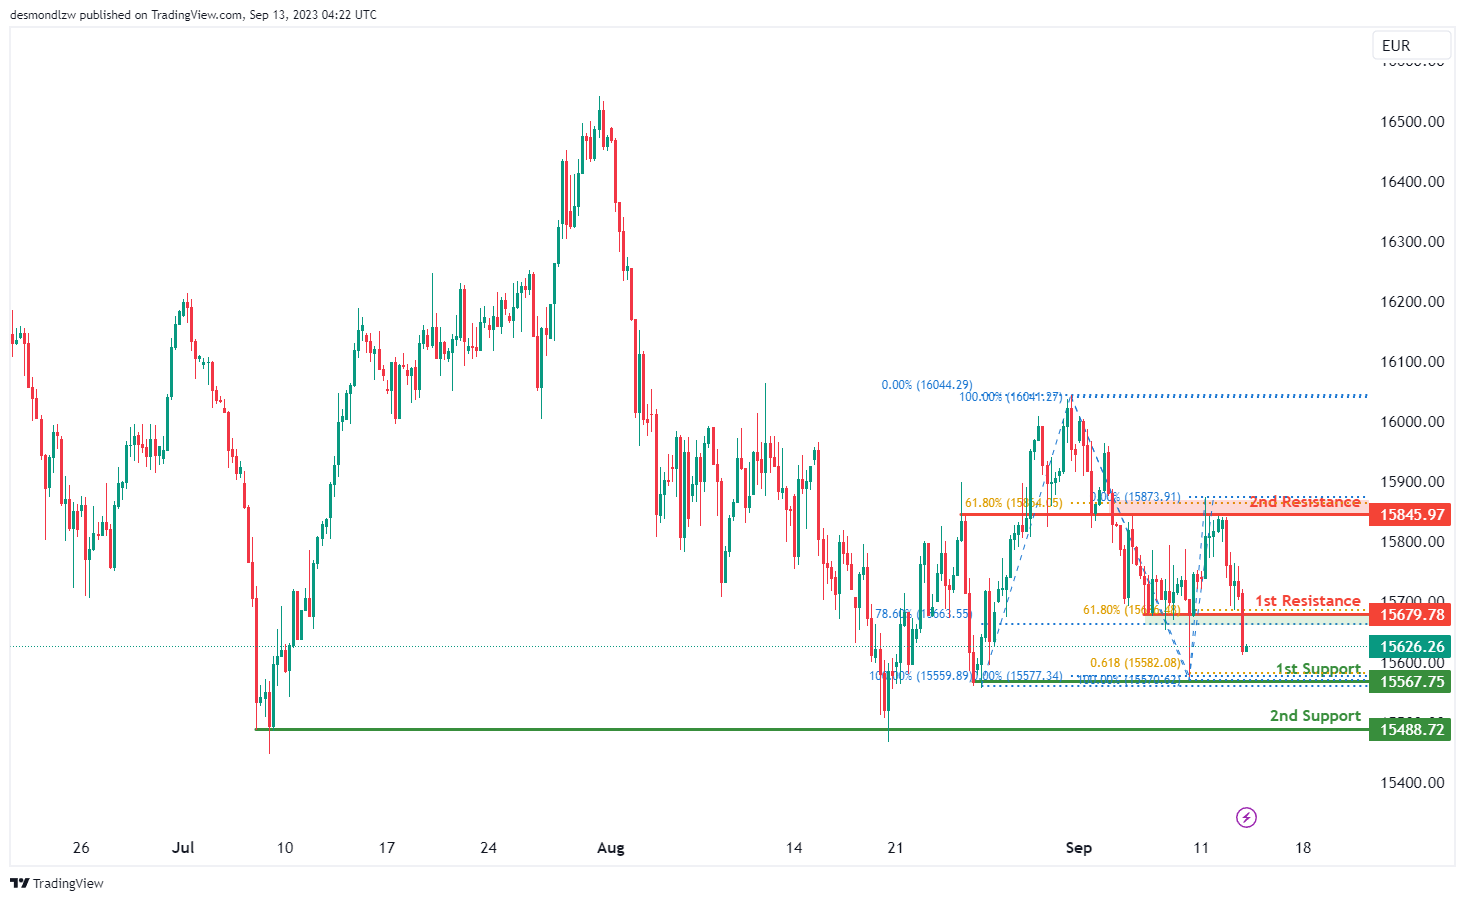
For GER30, the overall momentum of the chart is currently bearish, indicating a downward trend.
There is potential for the price to continue its bearish movement towards the 1st support level at 15567.75. This 1st support is considered significant because it represents multi-swing low support and aligns with the 61.80% Fibonacci Projection, indicating potential stability and support at this level.
In case of a more substantial decline, the 2nd support level at 15488.72 is also noteworthy as it represents a swing low support, offering additional reinforcement for the price.
On the upper side, if there’s a reversal in the price, it may face resistance at the 1st resistance level of 15679.78. This 1st resistance is considered important because it represents pullback resistance and aligns with the 61.80% Fibonacci Retracement.
Further upward movement may encounter resistance at the 2nd resistance level of 15845.97, characterized as multi-swing high resistance and aligned with the 61.80% Fibonacci Retracement, potentially posing a significant obstacle to the bullish momentum.
US500
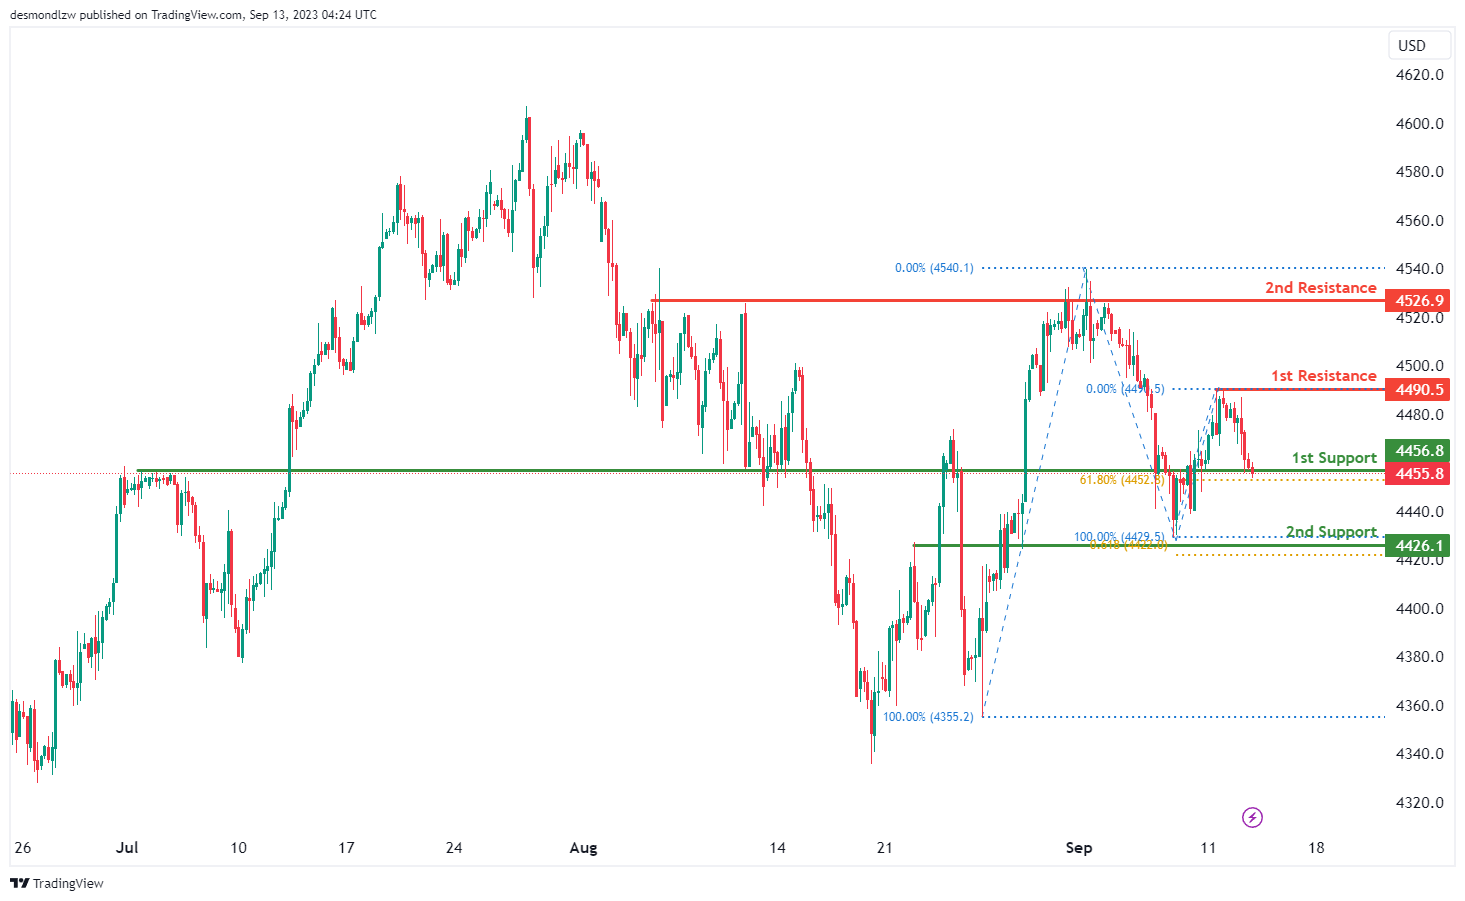
For US500, the overall momentum of the chart is currently bearish, indicating a downward trend.
There is potential for the price to make a bearish move by breaking below the 1st support level at 4456.8 and dropping towards the 2nd support level at 4426.1.
The 1st support at 4456.8 is considered significant because it represents an overlap support and aligns with the 61.80% Fibonacci Retracement level, suggesting potential stability and support at this level.
In case of a more substantial decline, the 2nd support level at 4426.1 is also noteworthy, representing an overlap support and aligning with the 61.80% Fibonacci Projection, providing additional reinforcement for this level.
On the upper side, if there’s a reversal in the price, it may face resistance at the 1st resistance level of 4490.5, which is identified as a swing high resistance.
Further upward movement could encounter resistance at the 2nd resistance level of 4526.9, characterized as multi-swing high resistance, potentially acting as a barrier to the bullish momentum within the observed range.
BTC/USD:
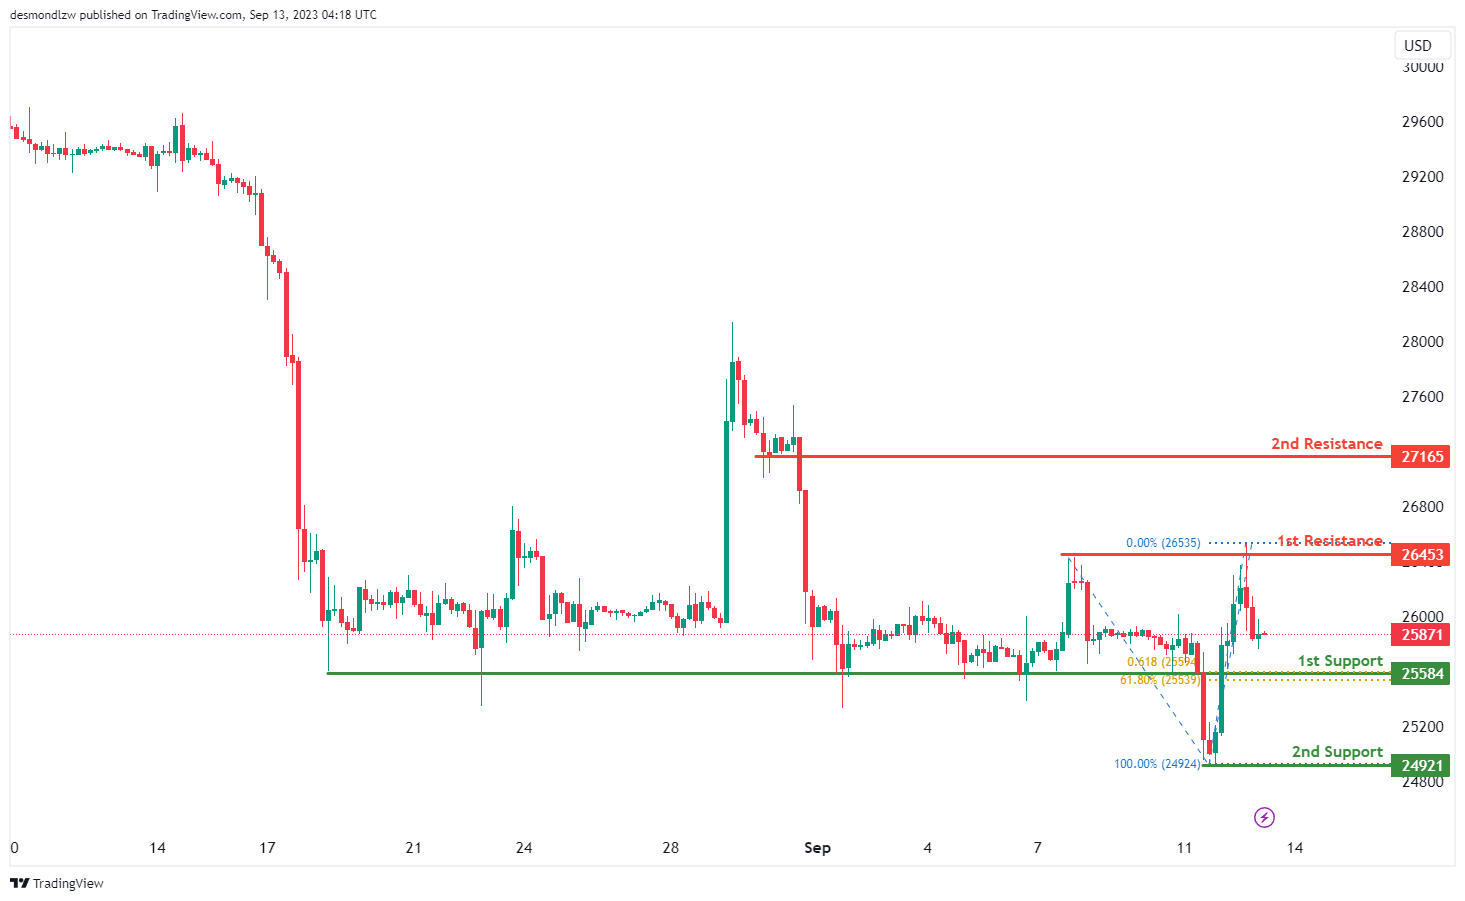
For BTC/USD, the overall momentum of the chart is currently bearish, indicating a downward trend.
There is potential for the price to continue its bearish movement towards the 1st support level at 25584. This 1st support is considered significant because it represents a pullback support and aligns with both the 61.80% Fibonacci Retracement and the 61.80% Fibonacci Projection, indicating strong potential support due to Fibonacci confluence.
In case of a more substantial decline, the 2nd support level at 24921 is also noteworthy, representing a swing low support, which may provide additional reinforcement for the price.
On the upper side, if there’s a reversal in the price, it may face resistance at the 1st resistance level of 26453, which is characterized as multi-swing high resistance.
Further upward movement could encounter resistance at the 2nd resistance level of 27165, identified as pullback resistance, which may act as a barrier to the bullish momentum within the observed range.
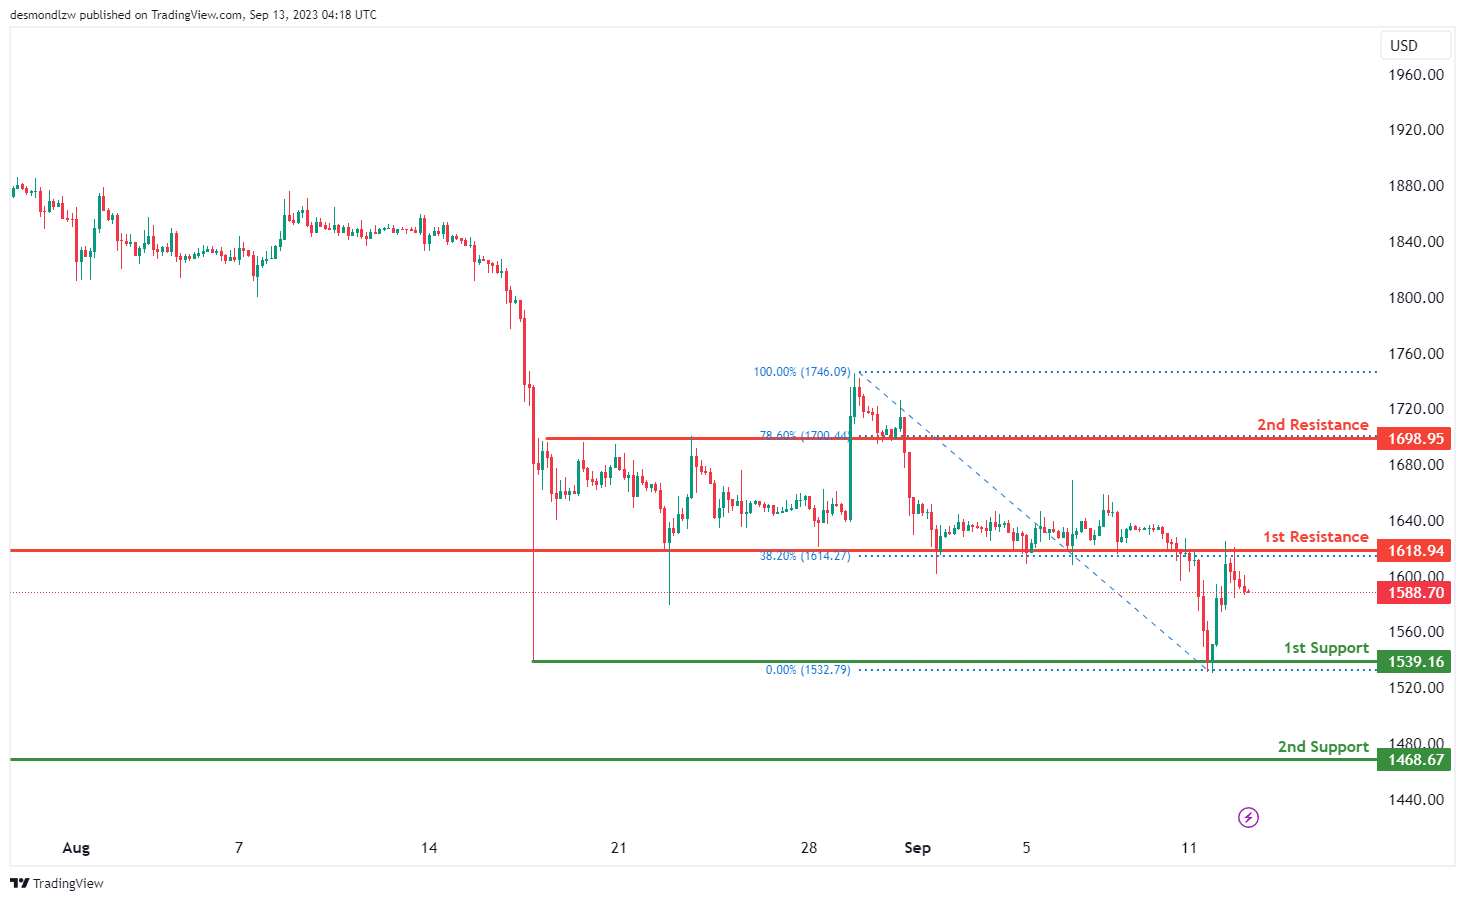
ETH/USD:
For ETH/USD, the overall momentum of the chart is currently bearish, indicating a downward trend.
There is potential for the price to continue its bearish movement towards the 1st support level at 1539.16. This 1st support is considered significant because it represents multi-swing low support, indicating potential stability at this level.
In case of a more substantial decline, the 2nd support level at 1468.67 is also noteworthy, as it represents a swing low support, offering additional reinforcement for the price.
On the upper side, the 1st resistance at 1618.94 is considered important due to its characteristics as pullback resistance, supported by the 38.20% Fibonacci Retracement level. This level may act as a barrier to upward movement.
Further upward movement could face resistance at the 2nd resistance level of 1698.95, characterized as pullback resistance and aligned with the 78.60% Fibonacci Retracement level, potentially posing a significant obstacle to the bullish momentum.
WTI/USD:
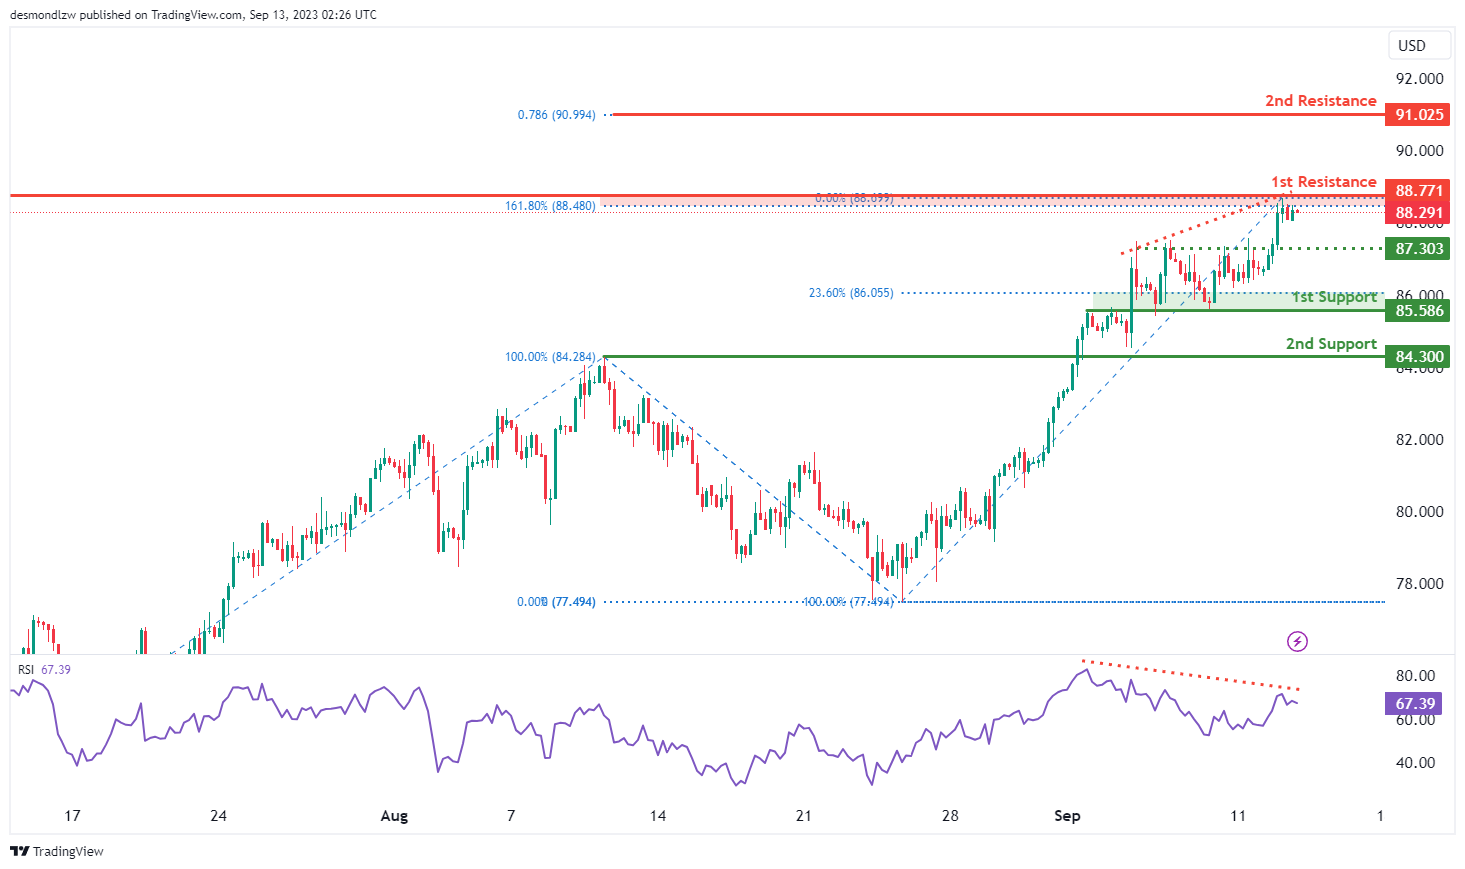
The WTI chart currently indicates a weak bearish momentum with low confidence as the RSI is displaying a bearish divergence versus the price, suggesting the possibility of a reversal in the near future. There is a potential scenario where price could experience a bearish reaction close to or upon reaching the 1st resistance level and subsequently drop towards the 1st support level.
The 1st resistance level at 88.77 is identified as an overlap resistance that coincides with the 161.80% Fibonacci extension level. Furthermore, the 2nd resistance level at 91.03 is noted as a resistance level that aligns with the 78.60% Fibonacci projection level.
To the downside, the intermediate support level at 87.30 is marked as pullback support while the 1st support level at 85.59 is identified as an overlap support that aligns with the 23.60% Fibonacci retracement level. Additionally, the 2nd support level at 84.30 is marked as a pullback support.
XAU/USD (GOLD):
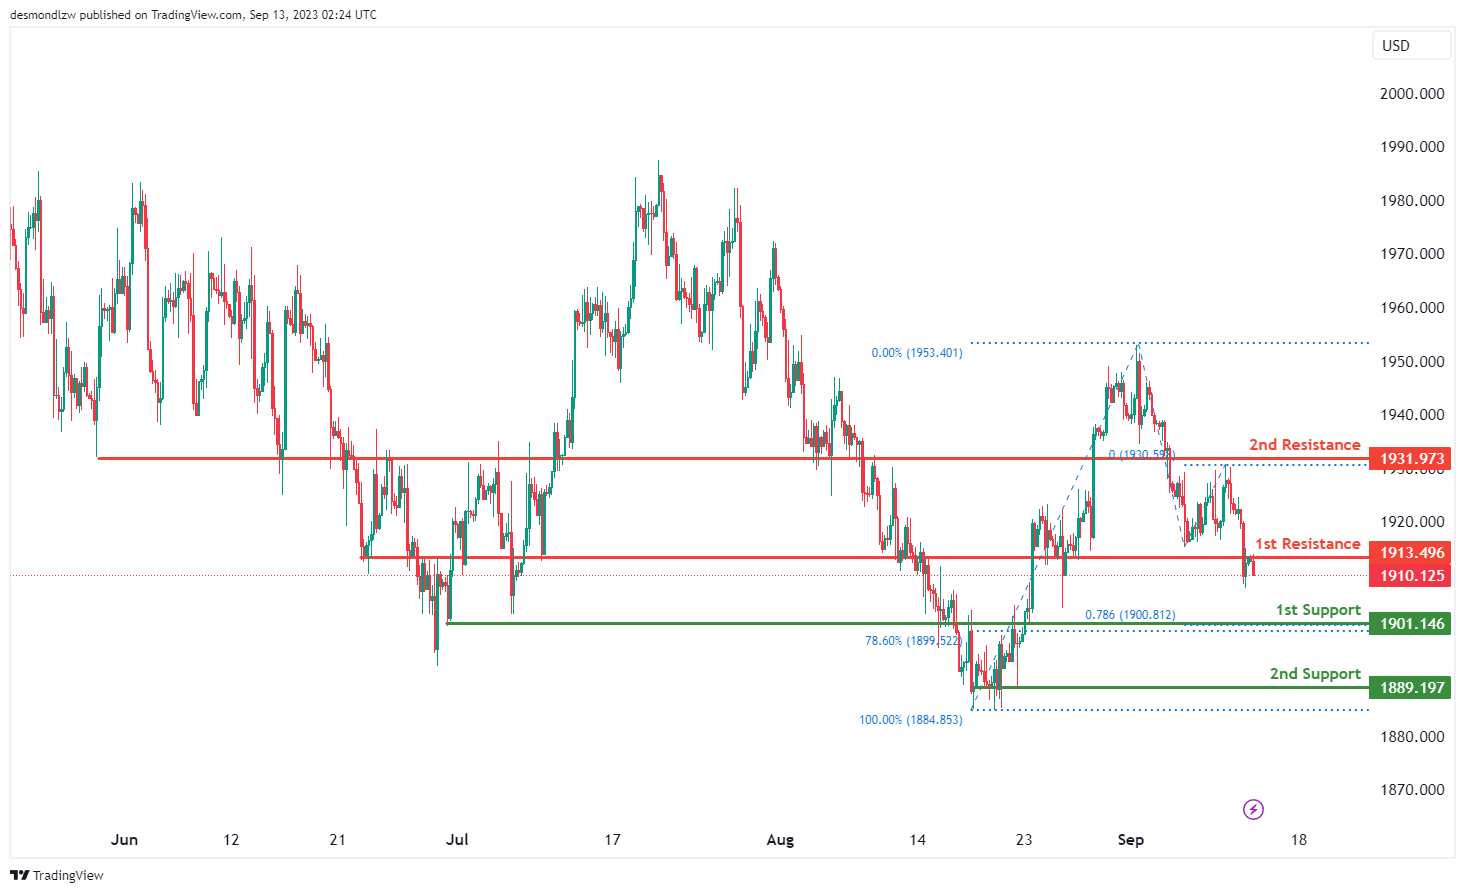
The XAU/USD (Gold/US Dollar) chart currently exhibits a bearish overall momentum, signaling a potential downward trend in price movement. There’s a likelihood of a bearish continuation towards the 1st support level.
The 1st support at 1901.14 is considered a strong support zone, as it aligns with an overlap support, the 78.60% Fibonacci Retracement, and the 78.60% Fibonacci Projection, indicating Fibonacci confluence. Additionally, the 2nd support at 1889.19 is characterized as a multi-swing low support.
On the resistance side, the 1st resistance at 1913.49 represents an overlap resistance, while the 2nd resistance at 1931.97 is also marked as an overlap resistance.