Sample Category Title
GBP/USD Daily Outlook
Daily Pivots: (S1) 1.2631; (P) 1.2673; (R1) 1.2729; More...
Intraday bias in GBP/USD stays neutral as sideway trading continues above 1.2618. On the downside, firm break of 1.2618, and sustained trading below 1.2678 resistance turned support will argue that it's already in a larger correction. Deeper decline would then be seen to 1.2306 support next. Nevertheless, break of 1.2817 minor resistance will indicate that the pull back has completed, and turn bias back to the upside for stronger rebound.
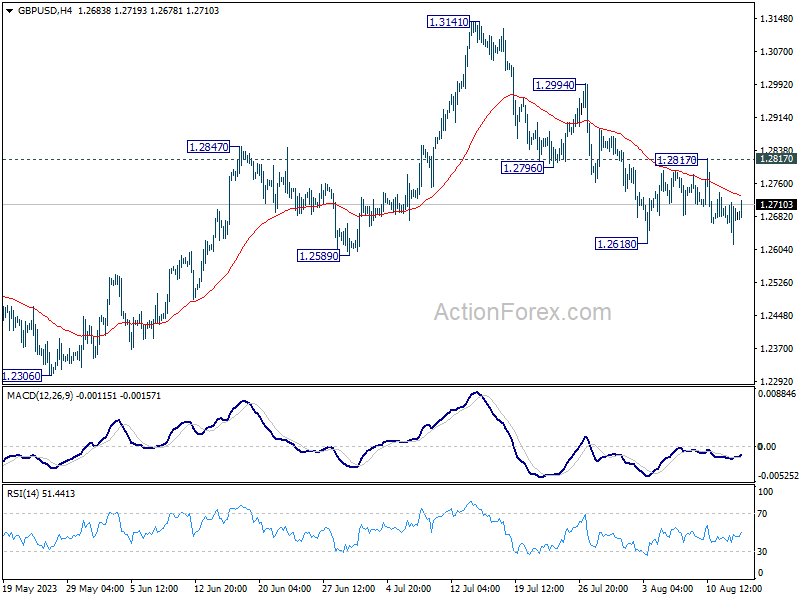
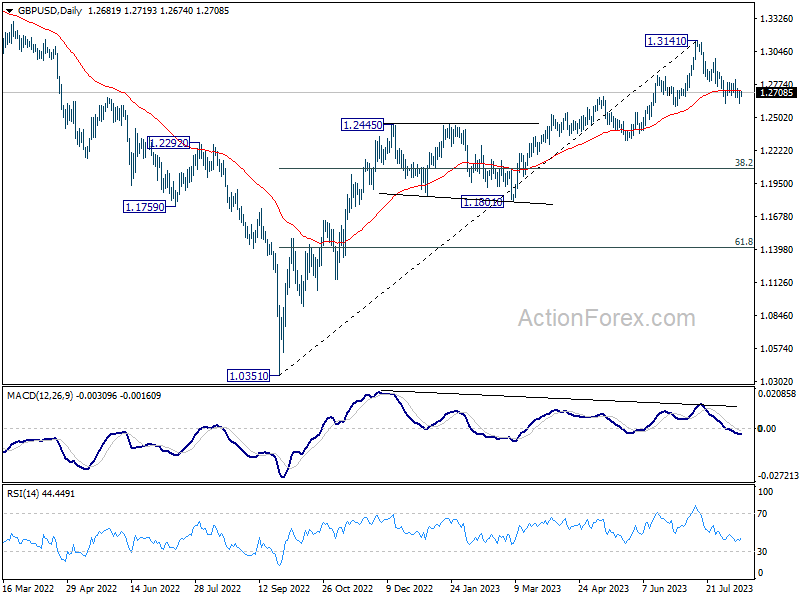
In the bigger picture, a medium term top could be in place at 1.3141 already, on bearish divergence condition in D MACD. Sustained trading below 55 D EMA (now at 1.2725) should confirm this case, and bring deeper fall to 38.2% retracement of 1.0351 to 1.3141 at 1.2075, as a correction to up trend from 1.0351 (2022 low). For now, rise will stay mildly on the downside as long as 1.3141 resistance holds, in case of strong rebound.
USD/CHF Daily Outlook
Daily Pivots: (S1) 0.8747; (P) 0.8787; (R1) 0.8823; More....
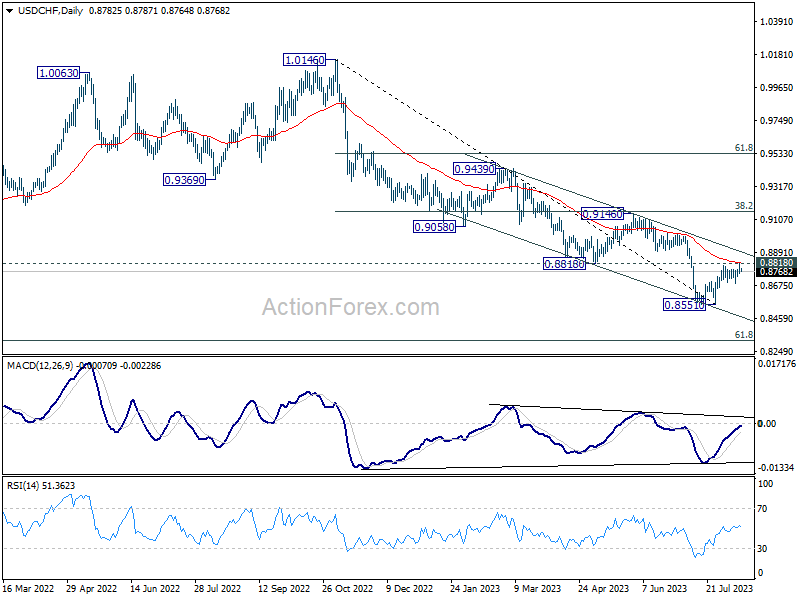
Intraday bias in USD/CHF is turned neutral again as it failed to sustain above 0.8825 and retreated. On the upside, sustained trading above 0.8818 support turned resistance will carry larger bullish implication. Further rally should then be seen to 0.9146 cluster resistance next. However, break of 0.8688 support will indicate rejection by 0.8818, and turn bias back to the downside for retesting 0.8551 low.
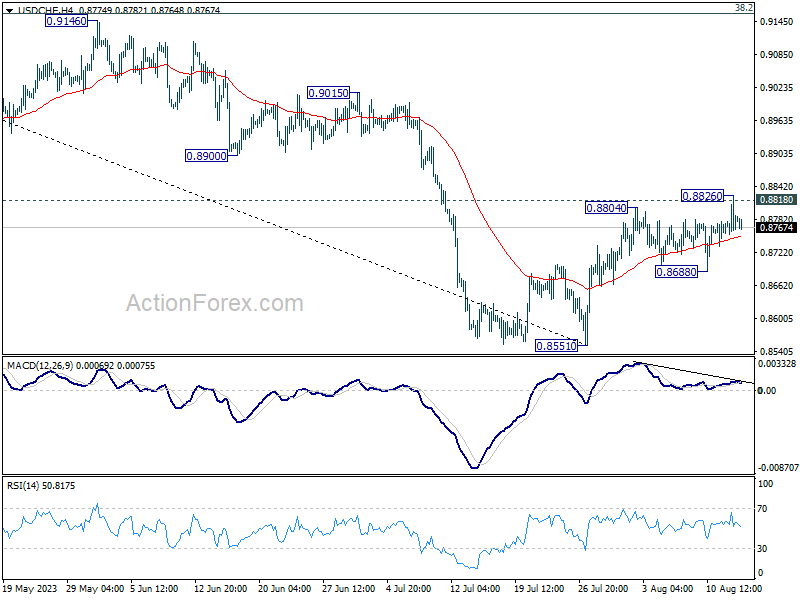
In the bigger picture, a medium term bottom could be in place at 0.8551 already, on bullish convergence condition in D MACD. Sustained trading above 0.8818 will bring further rise to 0.9146 cluster resistance (38.2% retracement of 1.0146 to 0.8551 at 0.9160), even as a correction. Nevertheless, break of 0.8851 will resume the down trend from 1.0146 instead.
USD/JPY Daily Outlook
Daily Pivots: (S1) 144.94; (P) 145.26; (R1) 145.86; More...
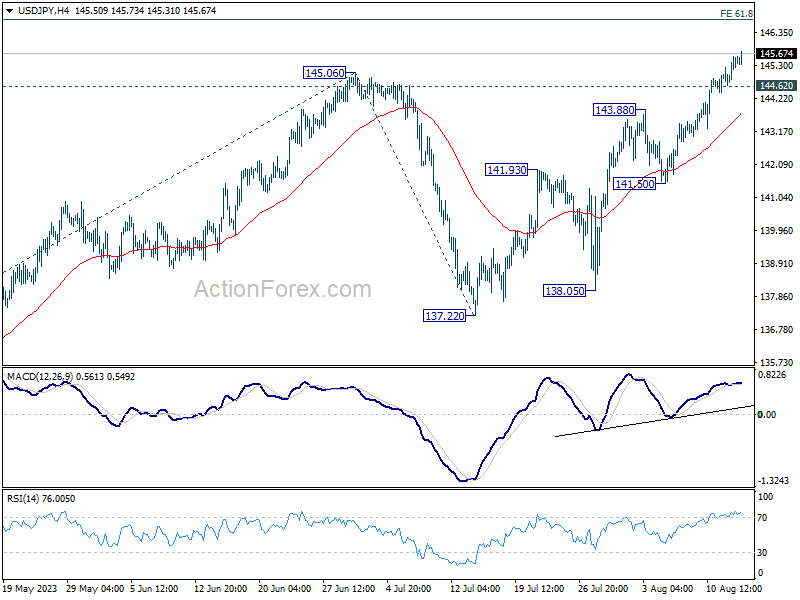
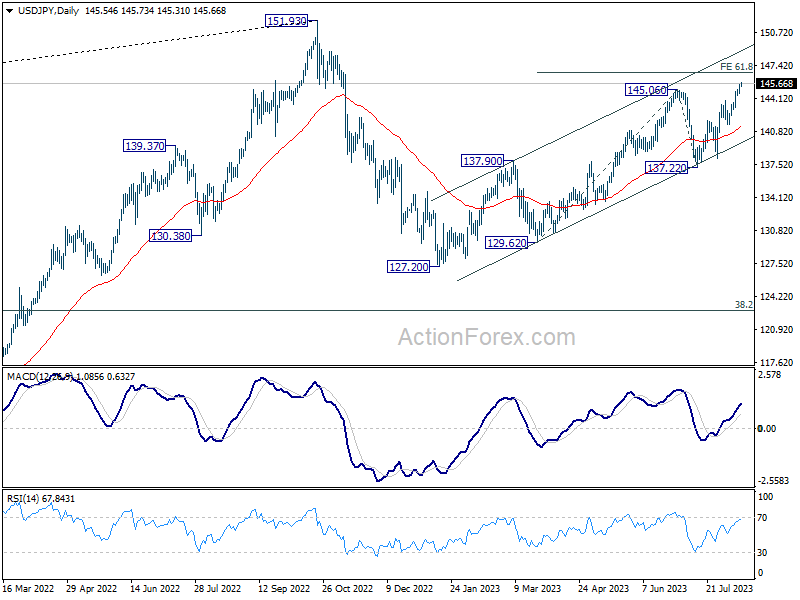
USD/JPY's rally is in progress and intraday bias stays on the upside. Current rise form 127.20 is in progress for 61.8% projection of 129.62 to 145.06 from 137.22 at 146.76. On the downside, below 144.62 minor support will turn intraday bias neutral and bring consolidations first, before staging another rally.
In the bigger picture, overall price actions from 151.93 (2022 high) are views as a corrective pattern. Rise from 127.20 is seen as the second leg of the pattern and could still be in progress. But even in case of extended rise, strong resistance should be seen from 151.93 to limit upside. Meanwhile, break of 137.22 support should confirm the start of the third leg to 127.20 (2023 low) and below.
USD/CAD Daily Outlook
Daily Pivots: (S1) 1.3439; (P) 1.3459; (R1) 1.3482; More....
USD/CAD is still bounded in consolidation below 1.3501 and intraday bias stays neutral. Outlook is unchanged that corrective fall from 1.3976 should have completed with three waves down to 1.3091. Above 1.3501 will resume the rebound from 1.3091 to 1.3653 resistance next. Break there will further confirm this case and target 1.3976 high.
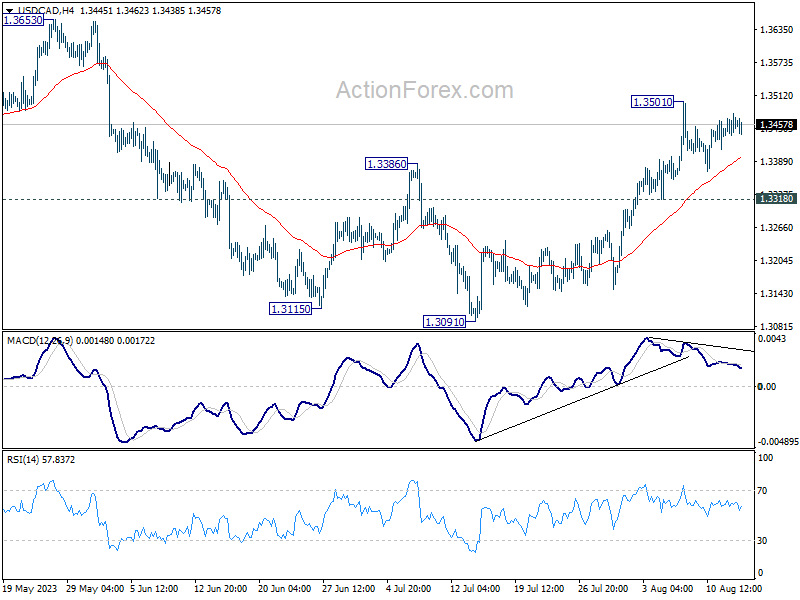
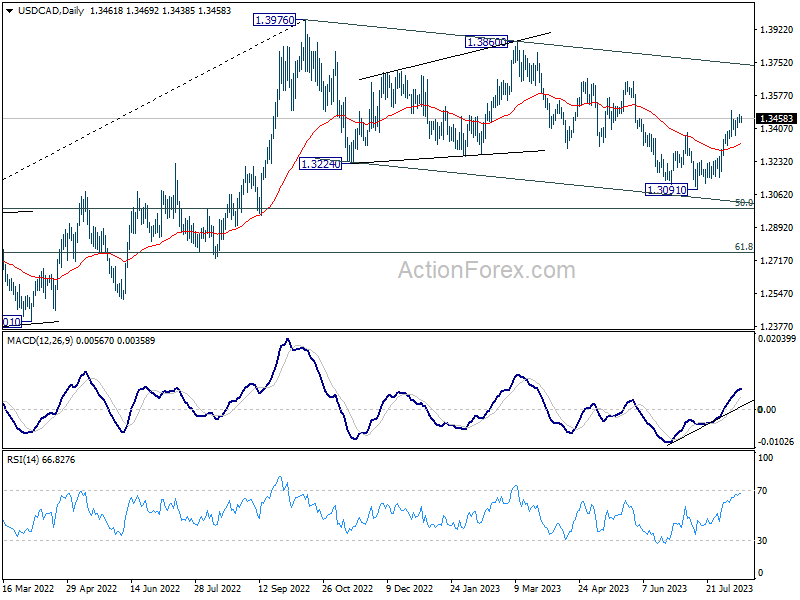
In the bigger picture, price actions from 1.3976 are viewed as a corrective fall only. Upon completion, rise from 1.2005 (2021 low) would resume through 1.3976 towards 1.4667/89 long term resistance zone. In case of another fall, downside should be contained by 61.8% retracement of 1.2005 to 1.3976 at 1.2758.
Minutes to RBA’s August Meeting Strike a More Optimistic Tone
The minutes of the Reserve Bank Board's August meeting show a further evolution consistent with policy being more firmly on hold.
As in May, June and July, the Board again considered two options for policy: to hold the cash rate steady or to increase it by 25bps. The cases for each option were again fairly similar but the key wording around the judgement saw another discernible change.
In May and June, the meeting minutes described the decision to raise rates as "finely balanced".
In July, this phrasing was dropped but the decision to leave rates unchanged came with a clear rider – that the pause was to "reassess the situation at the August meeting", when "the Board would have the benefit of additional data on inflation, the global economy, the labour market and household spending, as well as an updated set of staff forecasts and a revised assessment of the risks."
In August, the decision to leave rates unchanged had no 'temporary' elements to it. The monthly data updates were seen as encouraging, signalling that "the economy was still on the narrow path in which inflation returns to target while employment and the economy continue to grow" – a path that the staff's revised forecasts still saw as the central case outlook. While there were clearly still risks, members noted "these were broadly balanced" albeit asymmetric in terms of cost, particularly "if a sustained period of high inflation led to higher inflation expectations".
The June quarter inflation update looks to have been most influential, the lower-than-expected result described as "reassuring", albeit without showing a material slowing in services, which remains a central concern.
The Board was also unperturbed – at least for now - by the continued resilience in labour markets, noting "there were some signs that the labour market was at a turning point, including a small rise in the underemployment rate", and that interest rate rises were clearly impacting demand, noting weak retail sales results.
In weighing up, the case for a further rate rise rested on the risk of persistent high inflation – a 'stitch in time' rate rise now "mitigating the risk" of potentially having to make more damaging moves later on.
It was also noted that while the staff's forecasts were largely unchanged from May, these were "conditioned on a further increase in the cash rate". The recovery in house prices could also be a "signal that financial conditions were not as tight as they had assessed."
The case for remaining on hold centred on the view that the significant tightening to date was "working as intended", was impacting on consumption and, more tentatively, labour markets, with the full effects yet to be seen.
The bottom line was that members "observed that there was a credible path back to the inflation target with the cash rate staying at its present level", hence the convincing argument to leave the cash rate unchanged.
As with the Governor's decision statement, the language on prospective further tightening was also tweaked in the minutes – "it was possible that some further tightening of monetary policy may be required" a somewhat milder variation on July's "some further tightening of monetary policy may be required".
The checklist is the same: the data-flow data and the evolution of risks with a specific eye on the global economy, trends in household spending, and the outlook for inflation and the labour market. However, the language around it sounds a little more assured.
Conclusion
The minutes to the August meeting reaffirm the message from the Governor's decision statement and other communication that show the Board is now more confident about achieving its inflation objective of getting inflation back below 3% by the end of 2025, and more firmly on hold.
While the data flow and evolution or risks remain important, these are unlikely to constitute a strong enough case for a further hike in September. Indeed, the surprisingly soft June quarter wage cost index result out today likely further entrenches the Board's 'on hold' position.
The July monthly CPI indicator, due out at the end of August, may provide a surprise and might undo some of the encouraging progress on inflation but, even then, is likely to have some 'wrinkles', particularly around energy price increases, that could be viewed as transitory. The July labour force report due out later this week could also question the tentative turning point around jobs – albeit the minutes seem to imply some patience on this front.
All-up, the data-flow is unlikely to build a compelling case for a hike at the Board's next meeting on September 5. Beyond that the key data release will be the June quarter national accounts, due out a day later. This will include updates on the productivity and unit labour cost measures that the RBA has singled out as being particularly critical to achieving a return to low inflation over the medium term. But it will also give a much clearer picture of the weakening in activity – particularly around consumer spending. With inflation updates expected to show a further slowing, the mix is likely to preclude any further need for higher rates.
We reaffirm our view that the current cash rate of 4.10% will be the peak of the 2022-23 tightening cycle and that the next move in rates will be lower with the first cut in the cycle coming in the September quarter of 2024.
China’s Surprise Cut Won’t Be Enough
China surprised by cutting its one-year medium-term lending facility (MLF) rates by 15bp to 2.50% today to give a jolt to its economy that has not only completely missed the expectation of a great post-Covid recovery, but that deals with deepening property crisis, morose consumer, and investor sentiment – which is worsened by Country Garden crisis and missed payments from the finance giant Zhongzhi Enterprises. Data-wise, things looked as worrying as we expected them to look when China released its latest set of economic data today. Growth in industrial production unexpectedly dipped to 3.7%, retail sales unexpectedly fell to 2.5%, unemployment worsened, while growth in fixed investments dropped further. Foreign investment in China fell to the lowest levels since 1998, and the 13F filings showed that Big Short’s Michael Burry already exited Alibaba and JD.com, just months after increasing his exposure to these Chinese tech giants. People’s Bank of China’s (PBoC) surprise rate cut will hardly reverse appetite for Chinese investments as meaningful fiscal stimulus becomes necessary to stop halting.
The Hang Seng remains under pressure, the Chinese yuan fell to the lowest levels against the US dollar since last November, before the post-Covid reopening, and crude oil stagnates around the $82.50pb, close to where it was yesterday morning at around the same time. Tight supply and warnings of increased risk to shipping near the Strait of Hormuz, which is a strategic waterway for oil transit for exporters like Saudi Arabia and Iraq, certainly helped tempering the China-related selloff. But the demand side is weakening and that could stall the oil rally at the actual levels, forcing a return of the barrel of US crude toward the $80pb level, as worries regarding the Chinese recovery are real, and China will have to deploy further stimulus measures to fix things and bring investors back on their side of the table. If that’s the case however, oil prices could take a lift.
Elsewhere, Argentina devaluated its currency by 18% to 350 per dollar and hiked its interest rates by 21 percentage points to 118% after populist Javier Milei won the presidential primary, while the dollar ruble traded past the 100 mark for the first time since Russia invaded Ukraine and the Indian rupee traded near record, as well. So all that helped the US dollar index shortly trade above its 200-DMA yesterday, a day before the release of the FOMC minutes which could hint that most Federal Reserve officials were certainly happy with the progress on inflation, but not yet convinced that the war against inflation is won just yet. And given the rebound in global energy and food prices, the Fed officials’ careful approach to inflation looks like it makes sense. That’s certainly why the US 2-year yield continued its advance toward the 5% mark yesterday, even though the latest survey from New York Fed showed that inflation expectations recorded a sharp drop to 3.6% for the next twelve months and fell to 2.9% for the next three years. The same survey showed that the mean unemployment expectation fell by 1 percentage point, giving support to goldilocks or to the soft landing scenario. Goldman now expects the Fed to cut rates in the Q2 of next year. It also said it expects core PCE to have fallen below 3% by that time.
Today, investors will focus on the US Empire manufacturing index and the retail sales data, and earnings from Home Depot will also hit the wire. While expectation for Empire manufacturing points at a negative number, consensus for July retail sales is a slight acceleration on a monthly basis. Any improvement on the US data is poised to further back the pricing of soft landing and give a further boost to both the US dollar and the US stocks.
The S&P500 recovered yesterday, as Nasdaq 100 advanced more than 1% with technology stocks leading the rebound. Nvidia was one of the best performers with a 7% jump after a Morgan Stanley analyst reiterated his $500 per share price target yesterday. But Tesla didn’t benefit from the tech rally of yesterday and closed the session below $240 per share after cutting its car prices in China, yet again.
The Chinese Central Bank Cuts Rates
Market movers today
Tuesday kicks off with inflation data out from Sweden. Again, and despite last month's miss, we expect Swedish July inflation to print close to Riksbank's forecasts of CPIF 6.6% y/y and CPIF excl. energy 7.8% y/y, as we expect 6.5% y/y and 8.0% y/y. Core inflation is expected to be 0.4% m/m.
The morning also brings GDP indicator for Q2 from Statistics Denmark. This will be the first preliminary estimate of GDP growth, which we expect to print at 0.5% q/q.
We also get German ZEW index for August where both the expectations component and the current state assessment are expected to slump further.
From the US, the main focus will be on July retail sales. Leading indicators and early data suggest that spending growth has remained fairly robust, partly reflecting higher gas prices, but also more broadly.
The 60 second overview
This morning the Chinese central bank unexpectedly lowered key monetary policy rates given the uncertain outlook for the Chinese economy. The yuan weakened on the back of the rate cut. Furthermore, Chinese economic data (industrial production and retail sales) published this morning also showed weakness in the Chinese economy.
The Argentine Peso and the Russian ruble came under significant pressure yesterday. The peso was under pressure due to preliminary election victory of one of the outside candidates, which has promised a radical shift in monetary and financial policies of Argentine. The Argentine central bank devaluated the currency by 18% and raised rates from 97% to 118%.
The ruble is also under pressure and traded above 100 to USD 1. The Russian central bank is holding an emergency meeting.
Equities: Equities were a notch higher on Monday with little news. Reignited fears in the Chinese property sector spilled over to the European session but market recovered at the US opening (S&P 0.6%, Nasdaq 1.1%, Stoxx 600 0.2%). Cyclicals beat defensives but entirely owing to big tech. Otherwise, sector differences were quite small yesterday, except for the weak performance in European materials sector on the back of Chinese worries. The bleeding continues today with Chinese equities about -1% lower, in contrast to Japanese equities which are up on the back of macro profiles. US and European futures are indicating a positive opening as well.
FI: Modest rise in global bond yields as 10Y US Treasuries rose some 3-4bp and 10Y Germany rose 2-3bp. The rise was driven by the risk of tighter regulation/policy action by Chinese regulators in order to curb the mounting risks in the Chinese financial and property markets. However, this kind of risk is usually rather deflationary and thus we should see a reversal also after the Chinese central bank eased monetary policy this morning. Focus this week should be mainly on the minutes from the FOMC meeting on Wednesday and a speech by Fed member Kashkari.
FX: In relatively calm markets yesterday, the USD came out on top vis-à-vis the rest of G10. Both EUR/USD and USD/JPY reached levels they have not seen in some time. USD/JPY climbed firmly above 145 for the first time since last November. EUR/USD tested the 1.09 level for the first time in over a month.
Credit: Credit markets traded mostly sideways yesterday under relatively thin liquidity. The underlying support from less hawkish CB's seemed to be partly offset by renewed focus on problems in the Chinese real-estate sector and its potential spill-over effects to the broader economy. ITraxx main ended the day 0.1bp tighter at 71.6bp whereas Xover tightened a meagre 0.3bp to 404bp. The primary markets remain subdued.
Nordic macro
July inflation outcome is in focus in Sweden this morning. Danske Bank's forecast for CPIF and CPIF excl. Energy is spot on the market consensus i.e. 0.1 % mom/6.5 % yoy and 0.4 % mom/8.0 % yoy, respectively. This is 0.1 p.p. below and 0.1 p.p. below Riksbank's yoy forecasts, respectively. The risk picture appears quite symmetric with a possible downside to food prices while holiday expenditures (airline tickets, charter packs, restaurant/hotel prices and cultural event tickets) may very well continue to surprise on the upside. The latter is more likely to impact Riksbank pricing than the former.
Nasdaq 100 Technical: Potential Minor Countertrend Rebound
- Prior 5-day decline has reached short-term oversold condition right at a 14,950 key minor support.
- Positive price action follow-through seen yesterday has increased the odds of a minor countertrend rebound scenario within a short to medium downtrend phase.
- Watch the key short-term pivotal support at 15,180.
The price actions of the US Nas 100 Index (a proxy for the Nasdaq 100 futures) have shaped a decline that has continued to inch lower below its 20-day moving average and the downside movement has almost reached a significant minor support at 14,945 (printed an intraday low of 14,960 yesterday, 14 August).
The bearish break below its 20-day moving average on 2 August 2023 where prior price actions of the Index have managed to hold above it since 5 May 2023 has increased the odds of a short to medium-term corrective decline phase that is now evolving.
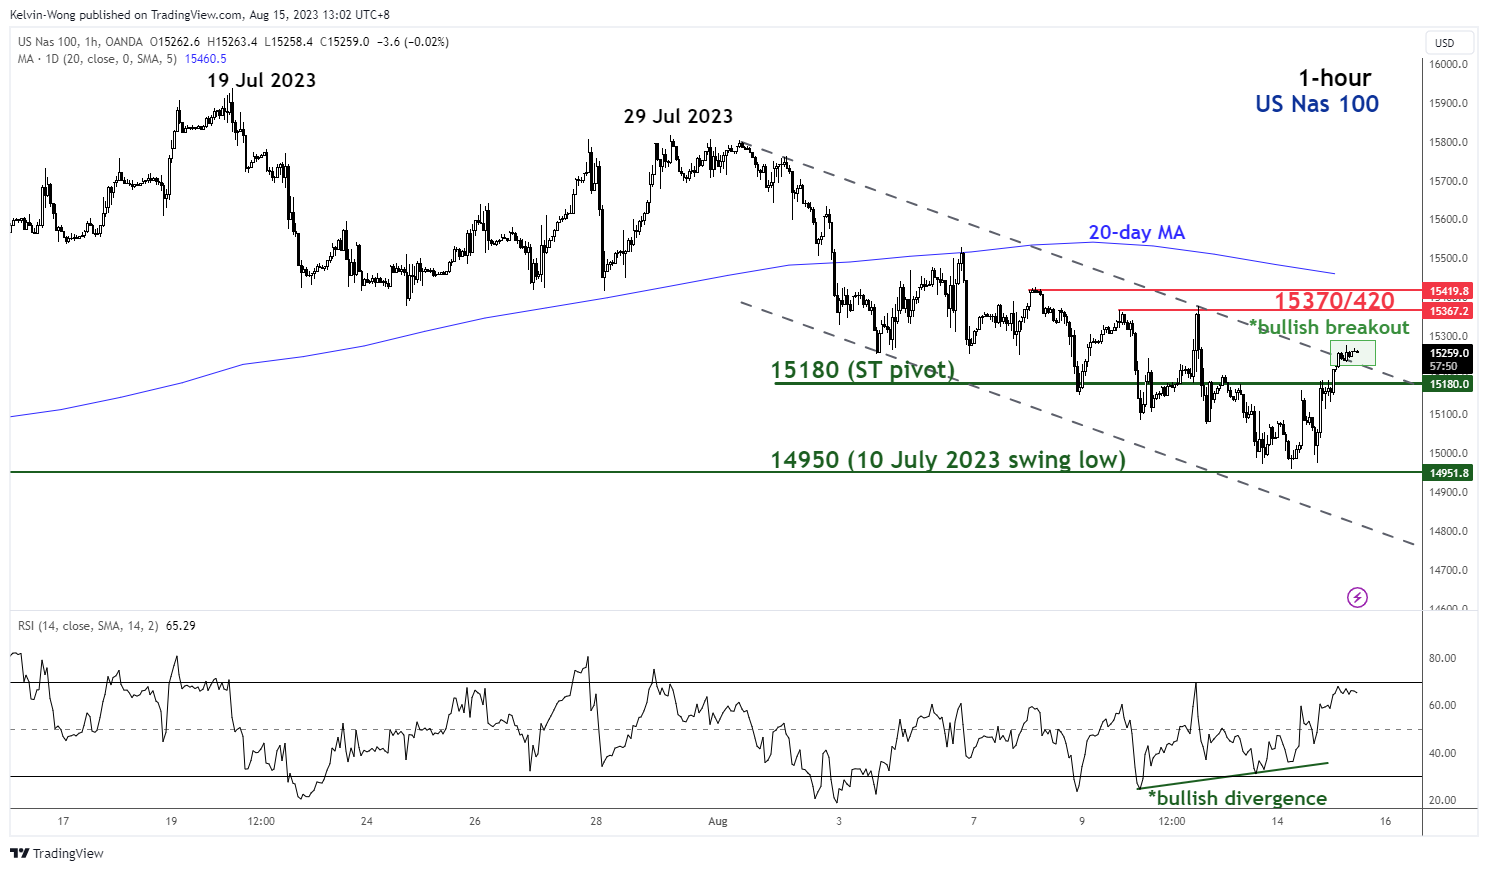
Interestingly, yesterday’s price actions of the Index have a positive following through as it staged a minor bullish breakout above the upper boundary of a minor descending channel in place since the 1 August 2023 high. Therefore, a minor countertrend rebound may be in progress at this juncture within a short to medium-term downtrend phase.
Watch the 15,180 key short-term pivotal support to maintain the minor countertrend rebound scenario to see the next intermediate resistance zone coming in at 15,370/420 (also the 20-day moving average).
However, failure to hold at the 15,180 pivotal support invalidates the bullish scenario to expose the 10 July 2023 swing low of 14,950 again in the first step.
Technical Outlook and Review
DXY:
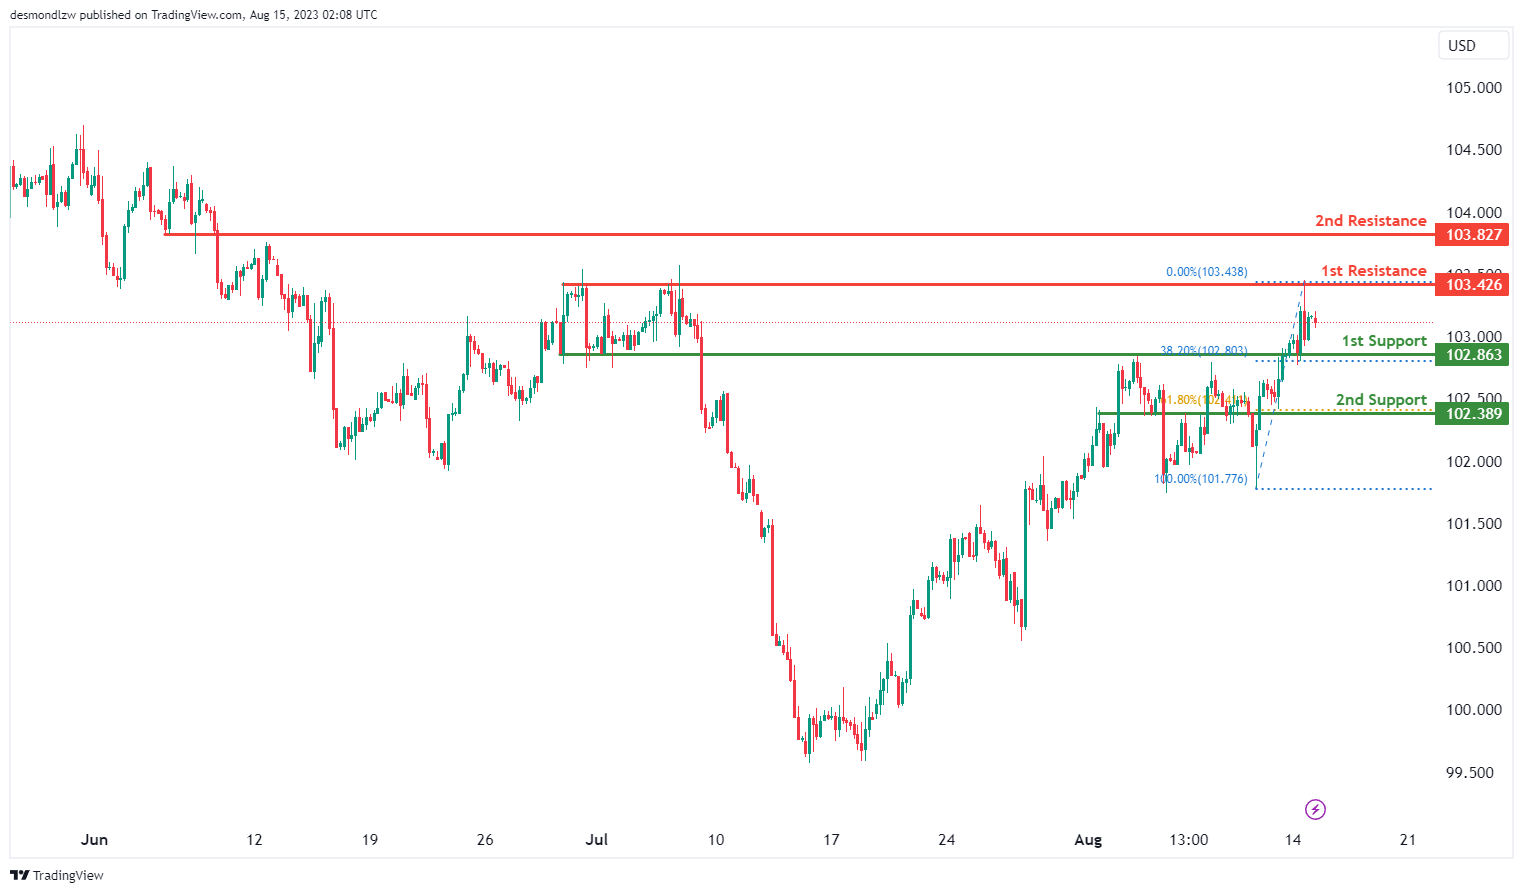
The DXY chart is currently showing a neutral momentum, suggesting a lack of clear direction. The price is expected to fluctuate between the 1st support and 1st resistance levels.
The 1st support level at 102.86 is important as it is an overlap support and also aligns with a 38.20% Fibonacci Retracement. Similarly, the 2nd support at 102.38 is significant as it is an overlap support and is also associated with a 61.80% Fibonacci Retracement.
On the upside, the 1st resistance at 103.42 is identified as a multi-swing high resistance. There is also a 2nd resistance level at 103.82, which is categorized as a pullback resistance.
EUR/USD:
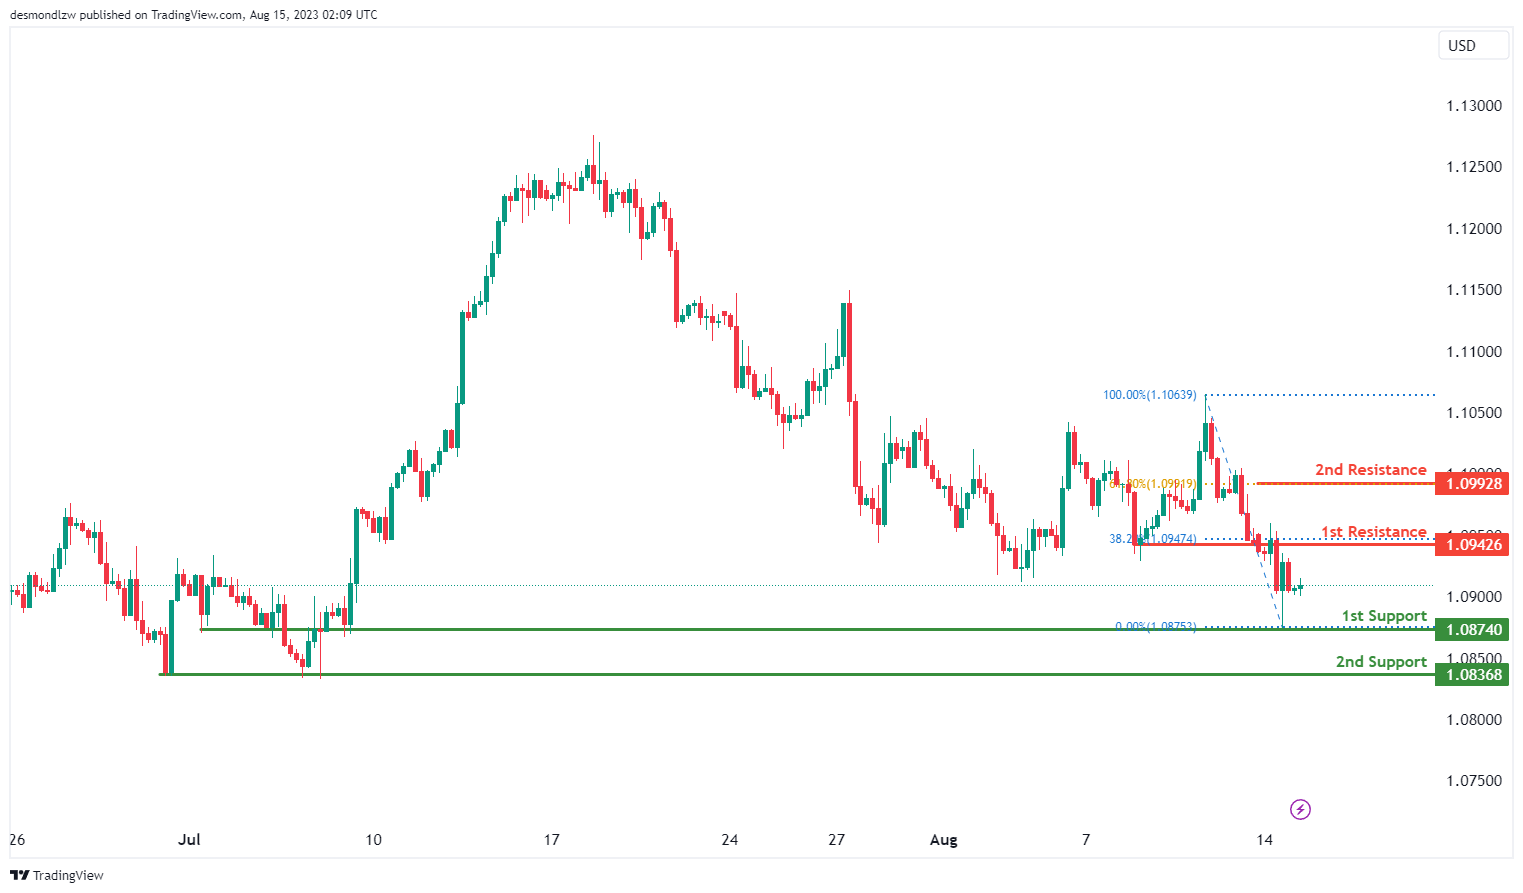
The EUR/USD chart is currently displaying a bullish momentum, indicating a prevalent upward trend. Within this context, there is potential for the price to continue its bullish movement towards the 1st resistance level.
The 1st support at 1.0874 is significant due to its alignment with a 38.20% Fibonacci retracement, reinforcing its role as a potential support level. Additionally, a 2nd support at 1.0836 is identified as a multi-swing low support.
On the other hand, the 1st resistance level at 1.0942 gains importance as it is an overlap resistance, while the 2nd resistance at 1.0992 aligns with a 61.80% Fibonacci retracement, further emphasizing its potential significance in controlling any upward movement.
EUR/JPY:
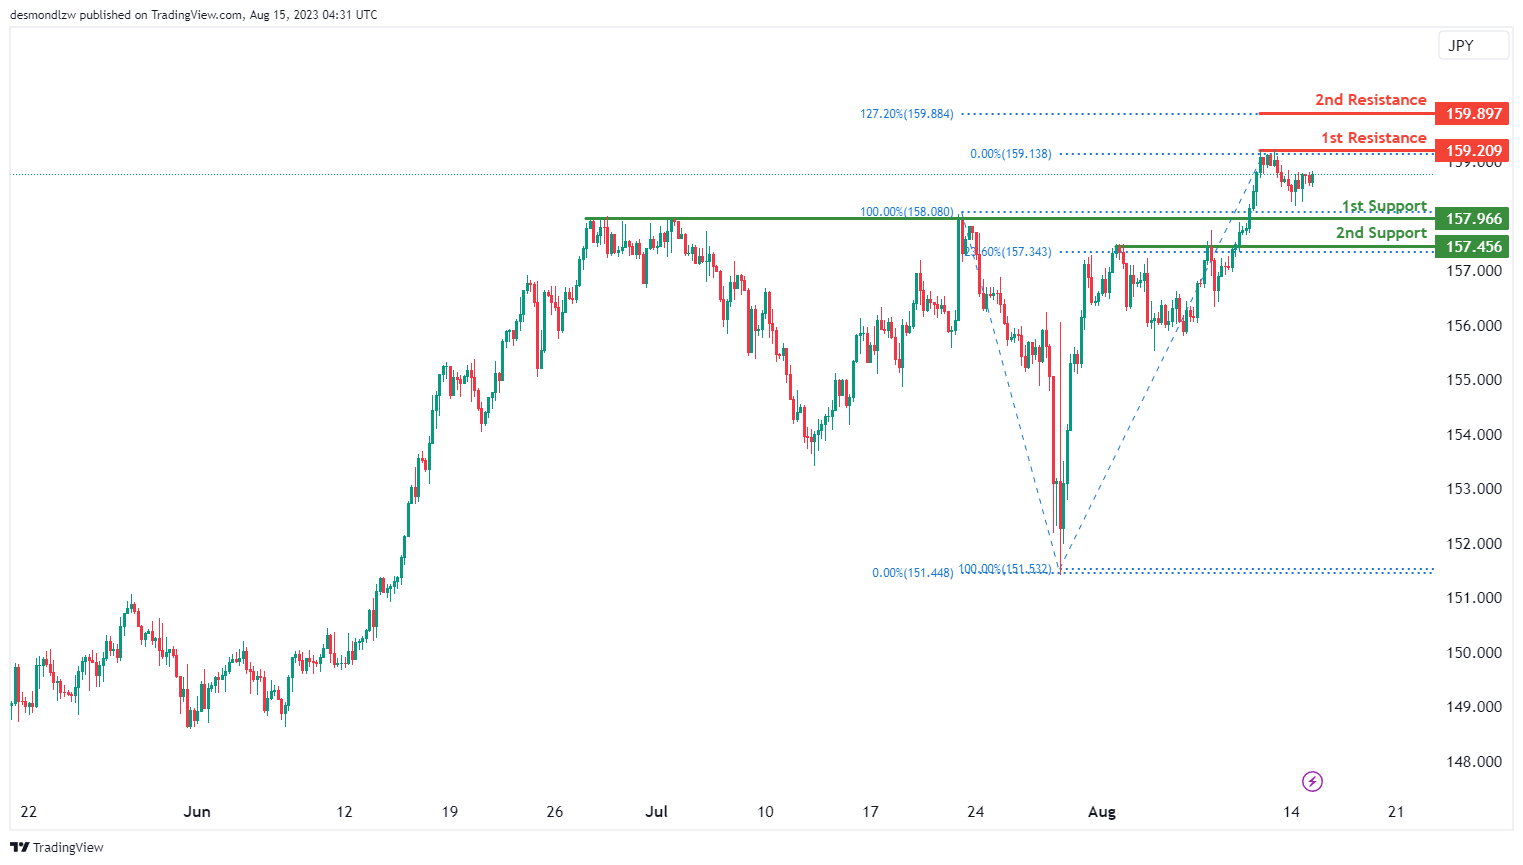
The current analysis of the EUR/JPY chart indicates a bullish momentum, suggesting a prevailing upward trend. Given this momentum, there is a possibility for the price to continue its bullish movement towards the 1st resistance level at 159.20.
The 1st support at 157.96 is significant as it serves as a pullback support. Another level of support is found at 157.32, which is further strengthened by the presence of a 23.60% Fibonacci Retracement.
Conversely, the 1st resistance level at 159.20 is considered a significant level due to its status as a swing high resistance. There is also a 2nd resistance at 159.89, which is noteworthy as it aligns with the 127.20% Fibonacci Extension level.
EUR/GBP:
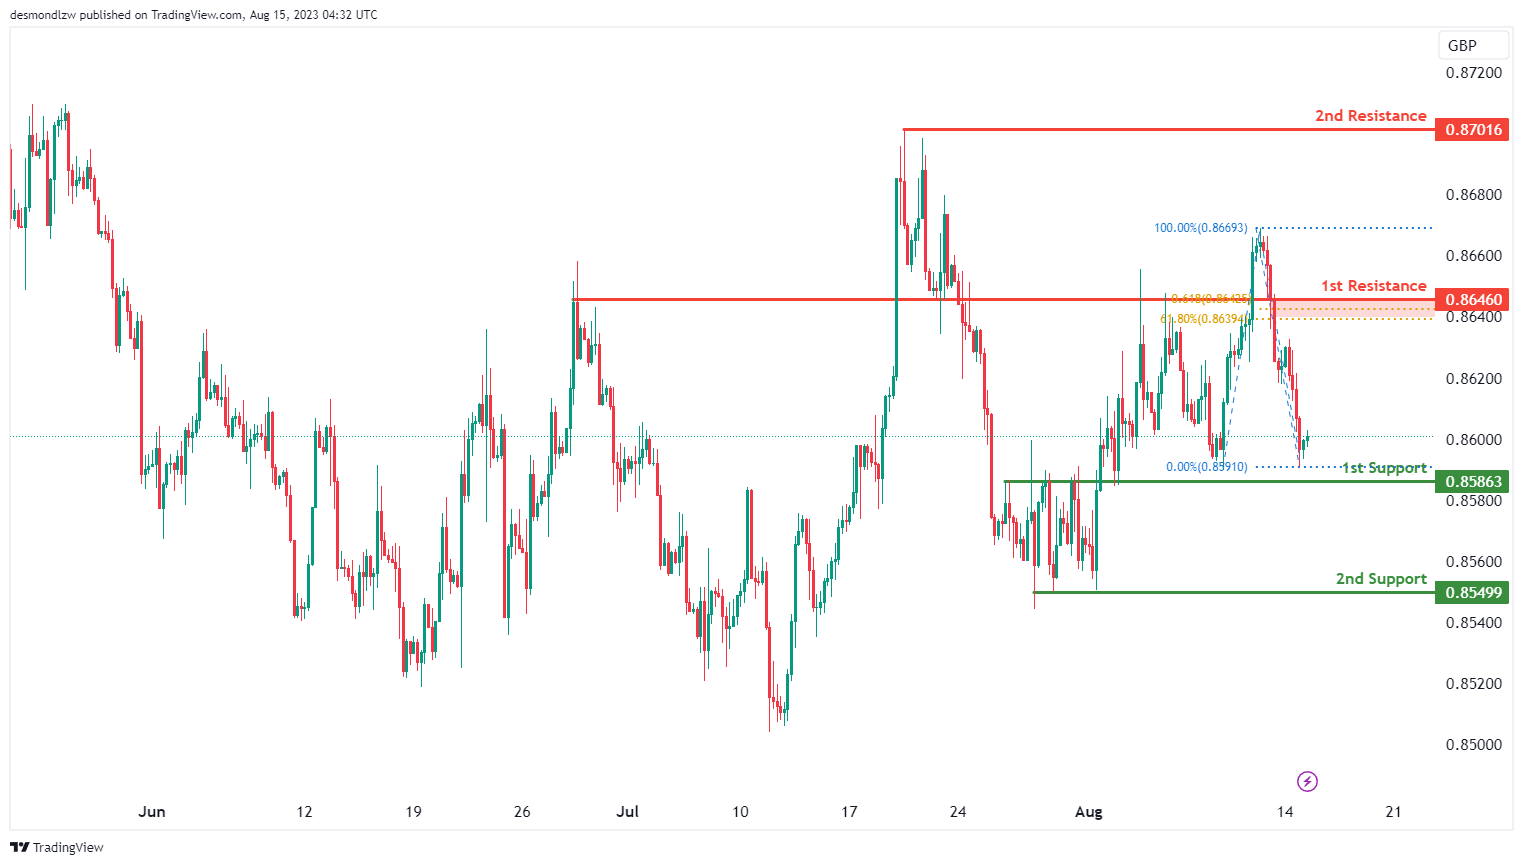
The current analysis of the EUR/GBP chart suggests a bearish momentum, indicating a downward trend. In light of this momentum, there is a potential for the price to bounce off the 1st support and move towards the 1st resistance level.
The 1st support at 0.8586 is considered a strong support level as it also acts as a pullback support. Additionally, the 2nd support at 0.8549 provides further reinforcement due to its identification as a multi-swing low support.
On the other hand, the 1st resistance level at 0.8662 holds significance as an overlap resistance, and its importance is further accentuated by the presence of a 61.80% Fibonacci Retracement and a 61.80% Fibonacci Projection, indicating a confluence of technical factors.
There is also a 2nd resistance at 0.8701, which is noted as a swing high resistance.
GBP/USD:
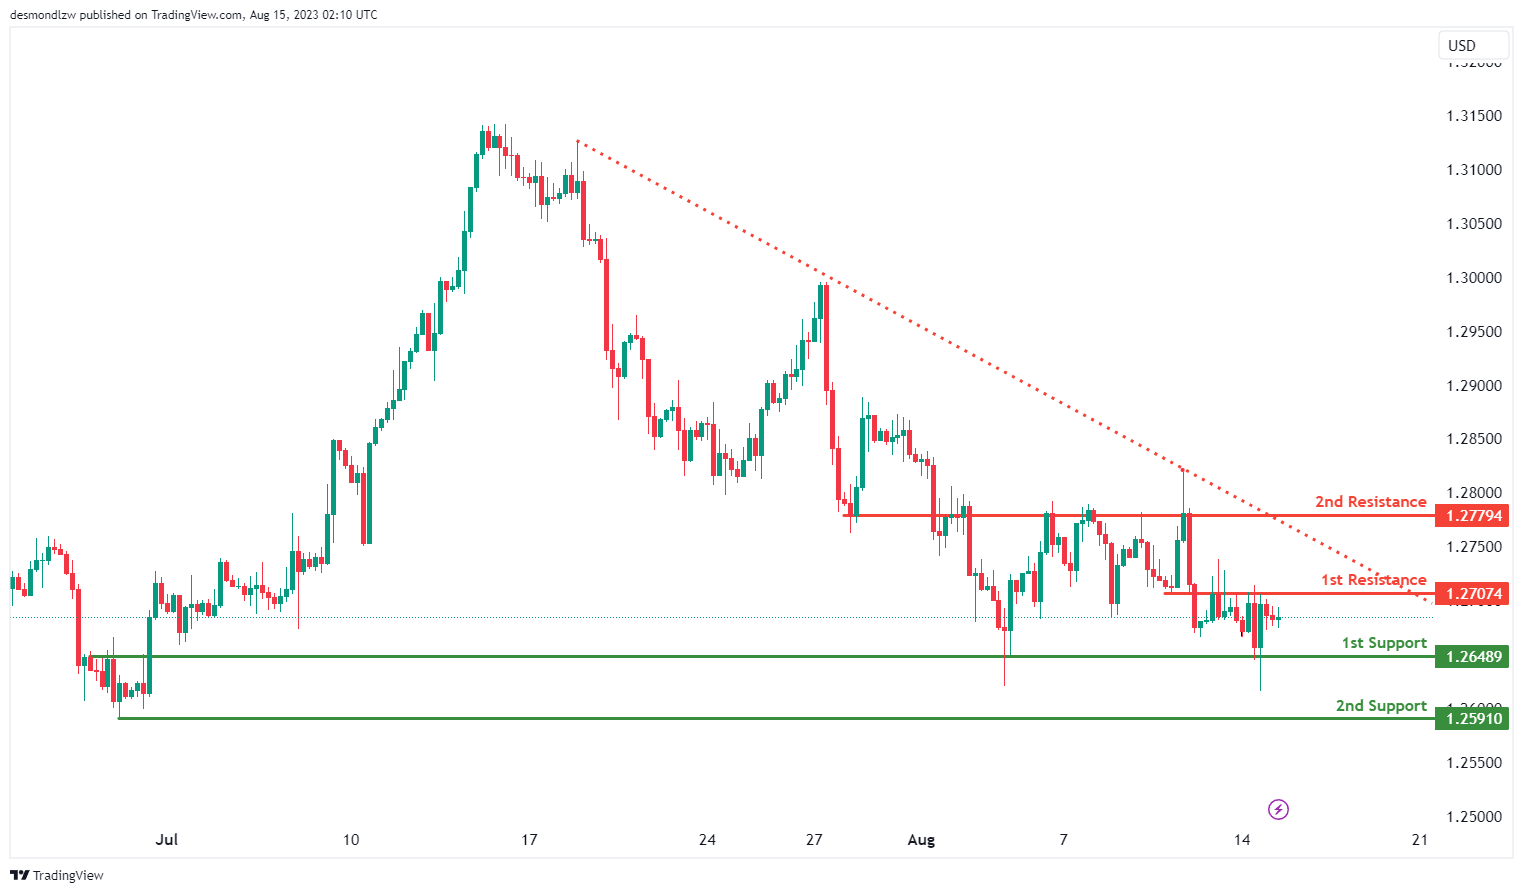
The GBP/USD chart currently indicates a neutral momentum, suggesting a lack of clear direction in the market.
In this scenario, the price may potentially move within a range between the 1st support level at 1.2648 and the 1st resistance level at 1.2707.
The significance of the 1st support at 1.2648 lies in its classification as an overlap support, while the 2nd support at 1.2591 is identified as a swing low support.
On the other hand, the 1st resistance level at 1.2707 is important as an overlap resistance, and a potential upward movement might be hindered by the 2nd resistance at 1.2779.
GBP/JPY:
The GBP/JPY chart is currently showing a bullish momentum, indicating a potential upward trend. Given this positive momentum, there is a chance that the price will continue to rise towards the 1st resistance level.
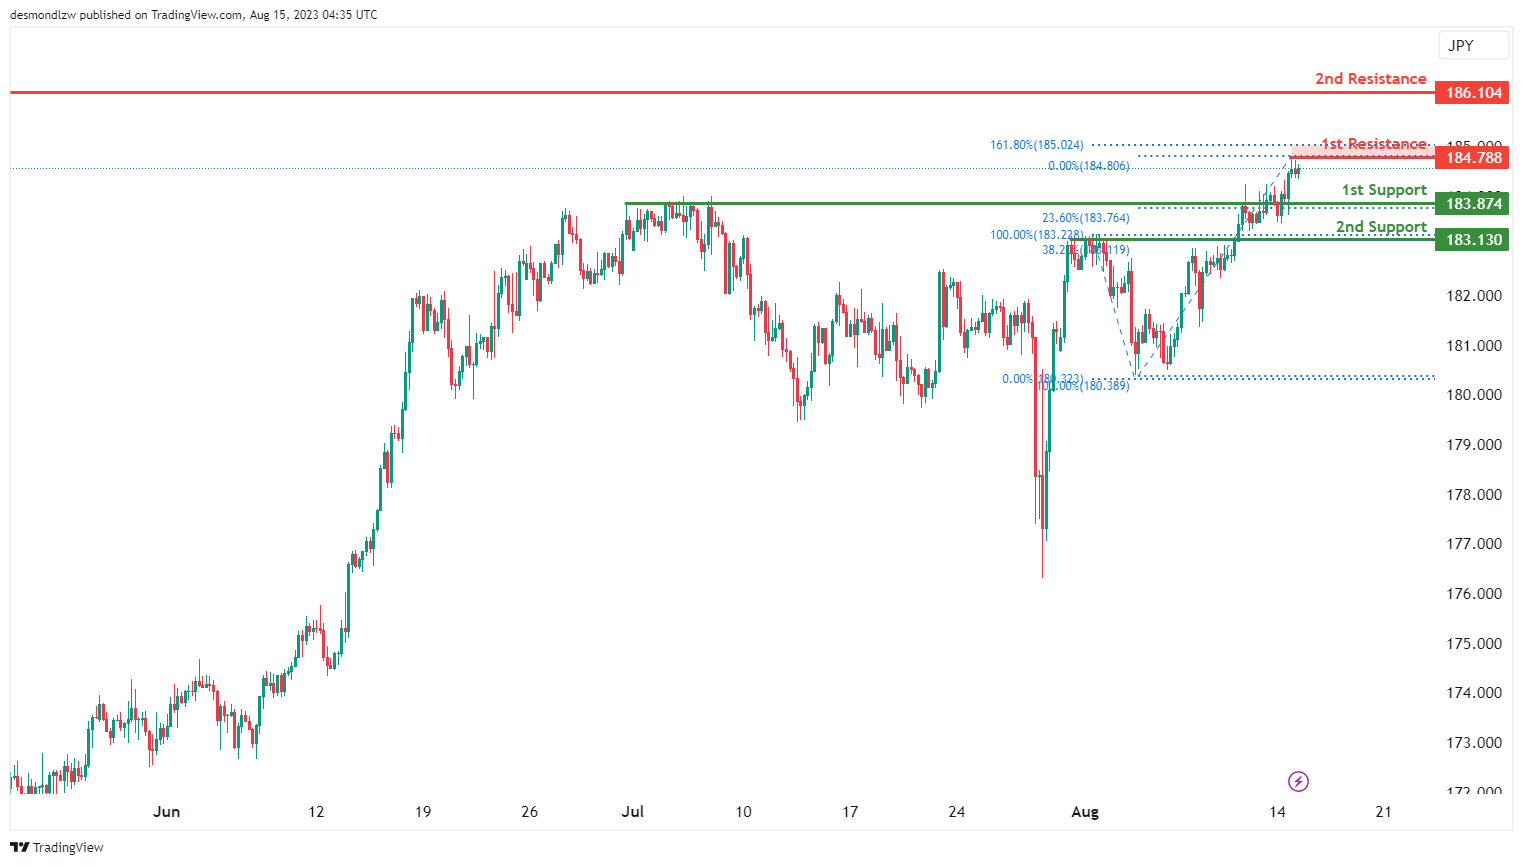
The 1st support level at 183.87 is significant as it is an overlap support and is also aligned with a 23.60% Fibonacci Retracement. Additionally, the 2nd support at 183.13 is reinforced by a 38.20% Fibonacci Retracement.
On the other hand, the 1st resistance at 184.78 is noteworthy due to its association with a swing high resistance. The 2nd resistance at 186.10 also acts as a swing high resistance, which further strengthens its potential to impede upward movement.
USD/CHF:
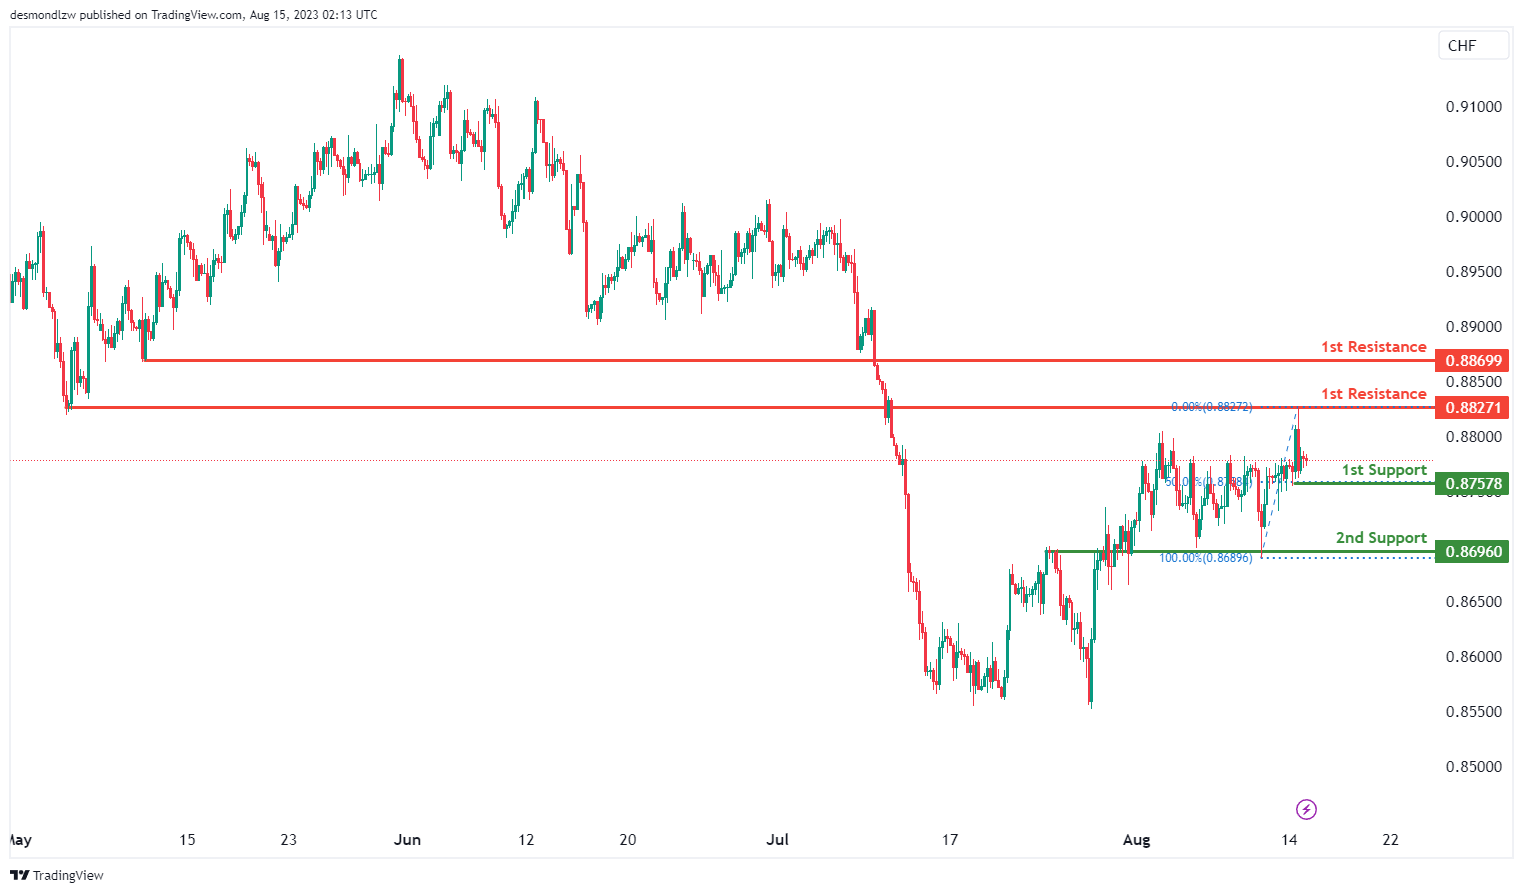
The USD/CHF chart currently shows a bearish momentum, indicating a prevailing downward trend.
Given this bearish momentum, there is a possibility that the price may continue to move lower towards the 1st support level.
The 1st support at 0.8757 is notable as it aligns with a 50% Fibonacci Retracement level. Additionally, the 2nd support at 0.8696 is identified as an overlap support.
On the flip side, the 1st resistance level at 0.8827 holds significance as an overlap resistance. Another resistance level at 0.8869 is identified as a pullback resistance, adding to its potential to prevent upward movement.
USD/JPY:
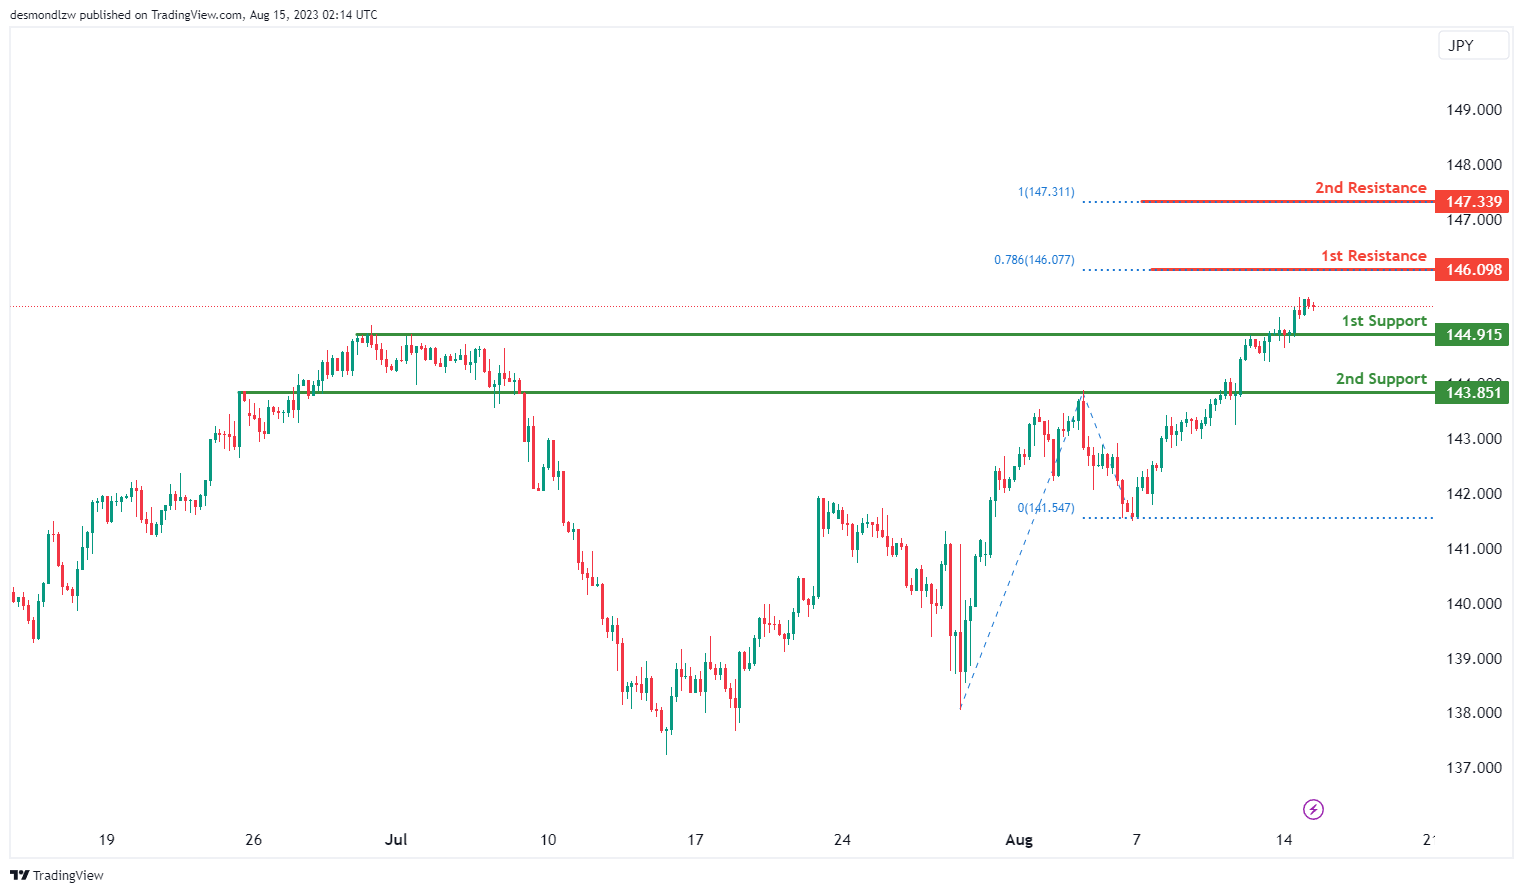
The USD/JPY chart indicates a bullish momentum, suggesting a potential upward trend.
Given this momentum, there is a possibility for the price to continue rising towards the 1st resistance level.
The 1st support at 144.91 is significant as it acts as a pullback support. Similarly, the 2nd support at 143.85 is also a pullback support.
On the other hand, the 1st resistance level at 146.09 is noteworthy as it aligns with a 78.60% Fibonacci Projection. Additionally, there is a 2nd resistance at 147.33, which is associated with a 100% Fibonacci Projection, enhancing its potential to resist upward movement.
USD/CAD:
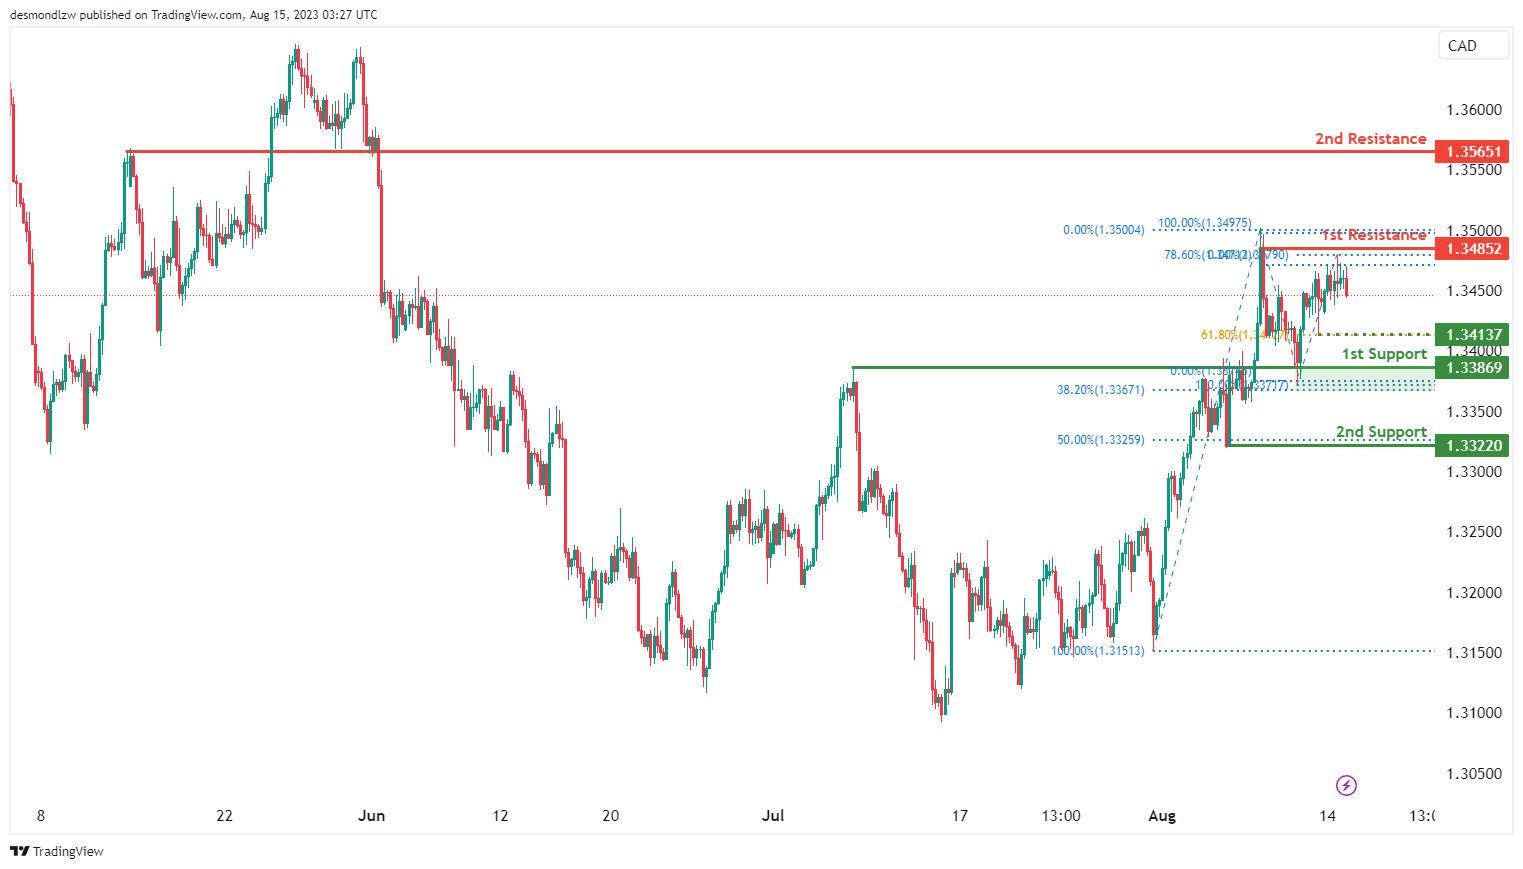
The current chart analysis of USD/CAD suggests a bearish momentum, indicating a downward trend. This trend may lead to a potential continuation towards the 1st support level should the intermediate support at 1.3414, which corresponds to the 61.80% Fibonacci retracement level, be broken.
The 1st support level at 1.3387 is supported by an overlap support that aligns close to the 38.20% Fibonacci retracement level. Additionally, the 2nd support at 1.3322 holds significance as a pullback support that is aligned with the 50.00% Fibonacci retracement level.
To the upside, the 1st resistance at 1.3485 is an important level as it coincides with a swing high resistance and the 78.60% Fibonacci retracement level. Furthermore, there is a 2nd resistance at 1.3565, which acts as an overlap resistance, that adds to the potential resistance zone.
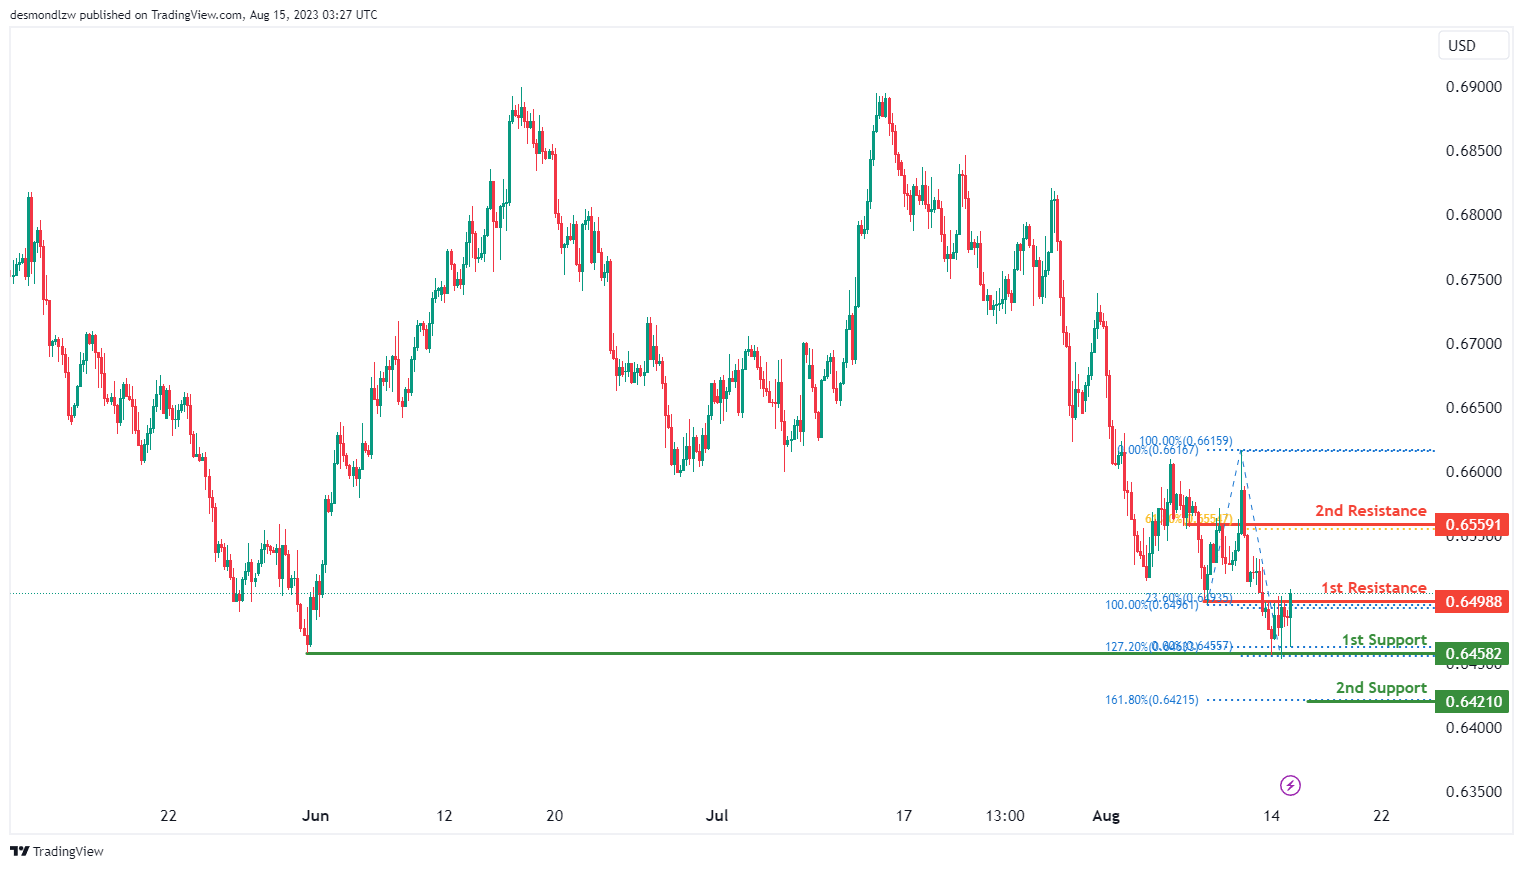
AUD/USD:
The current analysis of the AUD/USD chart indicates a bullish momentum, suggesting a potential upward trend. This momentum could lead to a bullish breakout above the 1st resistance level at 0.6499 and a potential move towards the 2nd resistance at 0.6559.
The 1st resistance at 0.6499 is significant due to its alignment with an overlap resistance and the 23.60% Fibonacci retracement level. Additionally, the 2nd resistance at 0.6559 holds importance as an overlap resistance that aligns with the 61.80% Fibonacci retracement level.
To the downside, the 1st support at 0.6458 is supported by an overlap support that aligns with the 127.20% Fibonacci extension level, while the 2nd support at 0.6421 is reinforced by a support level that aligns with the 161.80% Fibonacci extension level.
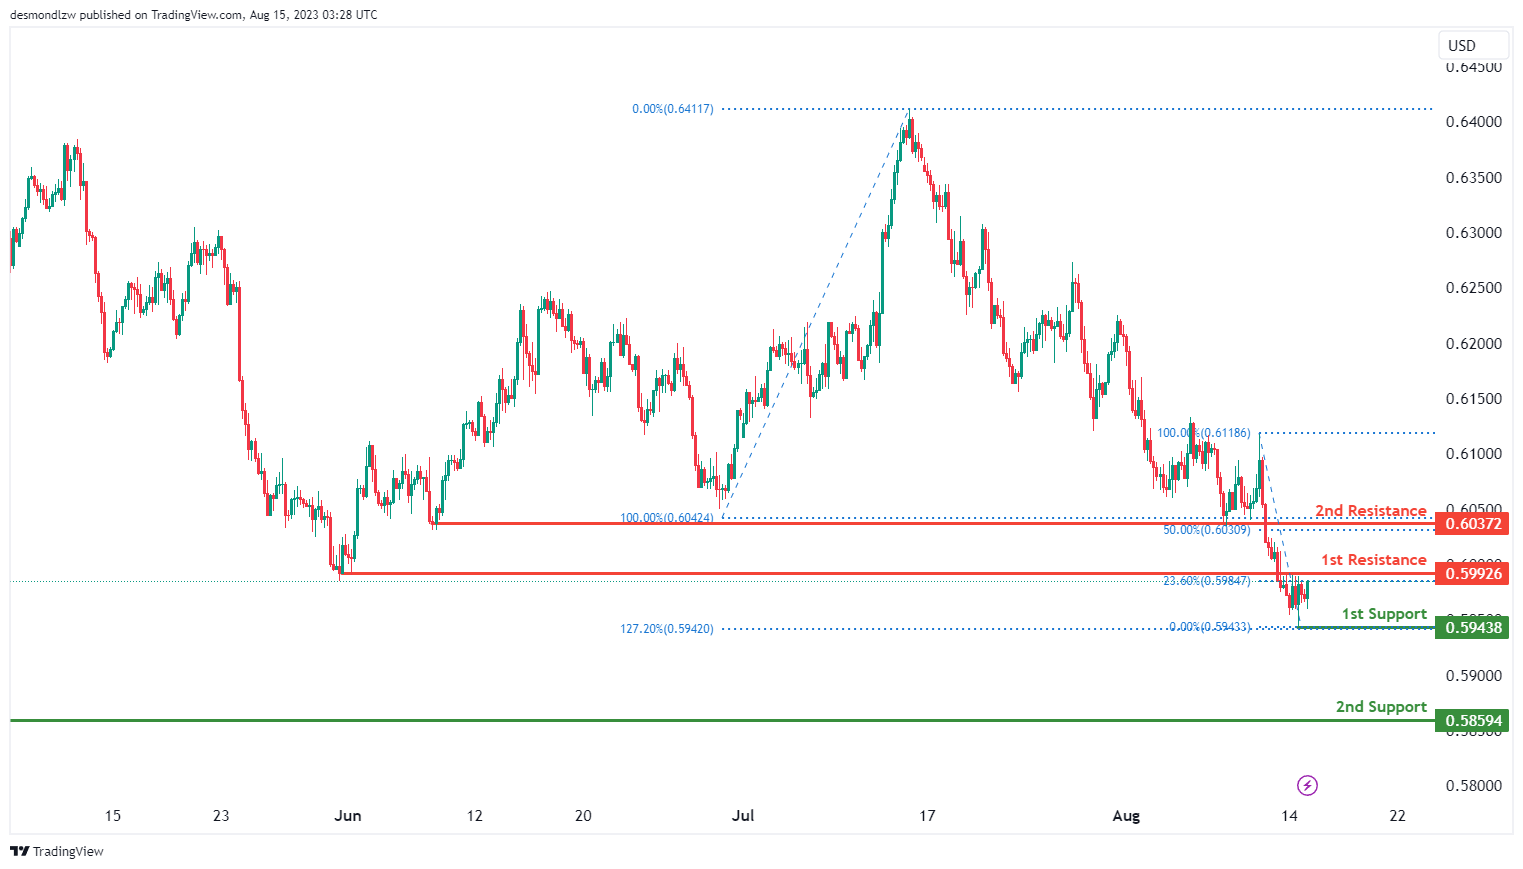
NZD/USD
The current trend on the NZD/USD chart is exhibiting a bullish momentum, suggesting the possibility of further upward movement towards the 1st resistance.
The 1st resistance level at 0.5993.is identified as an overlap resistance that aligns with the 23.60% Fibonacci retracement level. The 2nd resistance at 0.6037 is also identified as an overlap resistance that aligns with the 50.00% Fibonacci retracement level.
To the downside, the 1st support at 0.5944 is a swing-low support that aligns with the 127.20% Fibonacci extension level while the 2nd support at 0.5859 is also identified as a swing-low support.
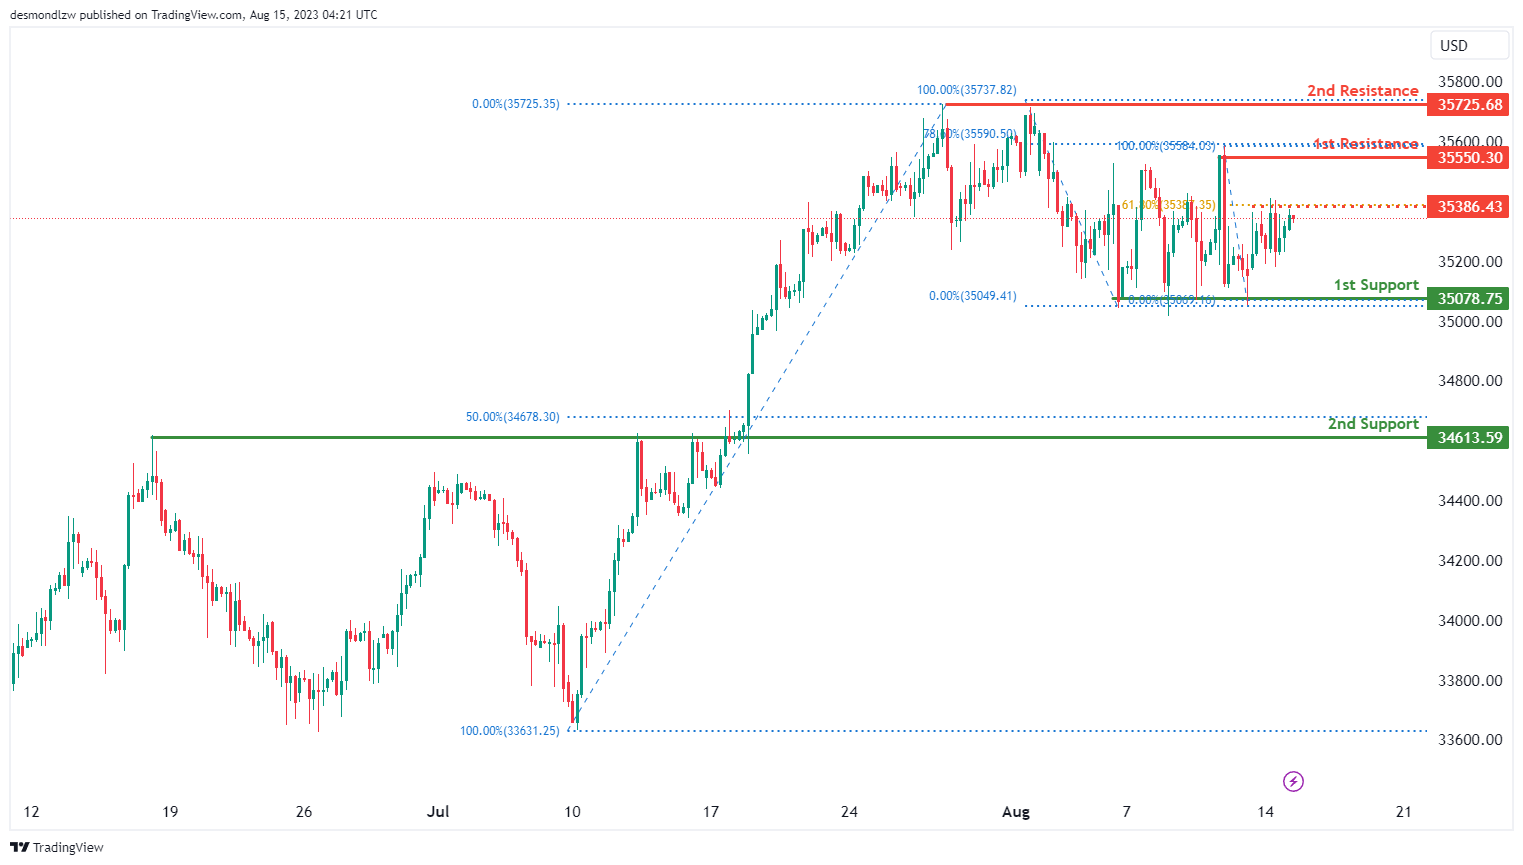
DJ30:
The current analysis of the DJ30 chart indicates a bullish momentum, reflecting an ongoing upward trend. Given this bullish outlook, there is a possibility for the price to continue its upward movement towards the 1st resistance level at 35550.30.
The 1st support level at 35078.75 is significant as it represents a multi-swing low support. Additionally, the 2nd support at 34613.59 reinforces the supportive structure.
On the contrary, the 1st resistance at 35550.30 holds significance as a swing high resistance, which could impede further upward movement.
Furthermore, the existence of a 2nd resistance at 35725.68, characterized as a multi-swing high resistance, further supports the potential for resistance against upward price movement. An intermediate resistance at 35386.43, coupled with a 61.80% Fibonacci retracement, further enhances the potential for resistance at this level.
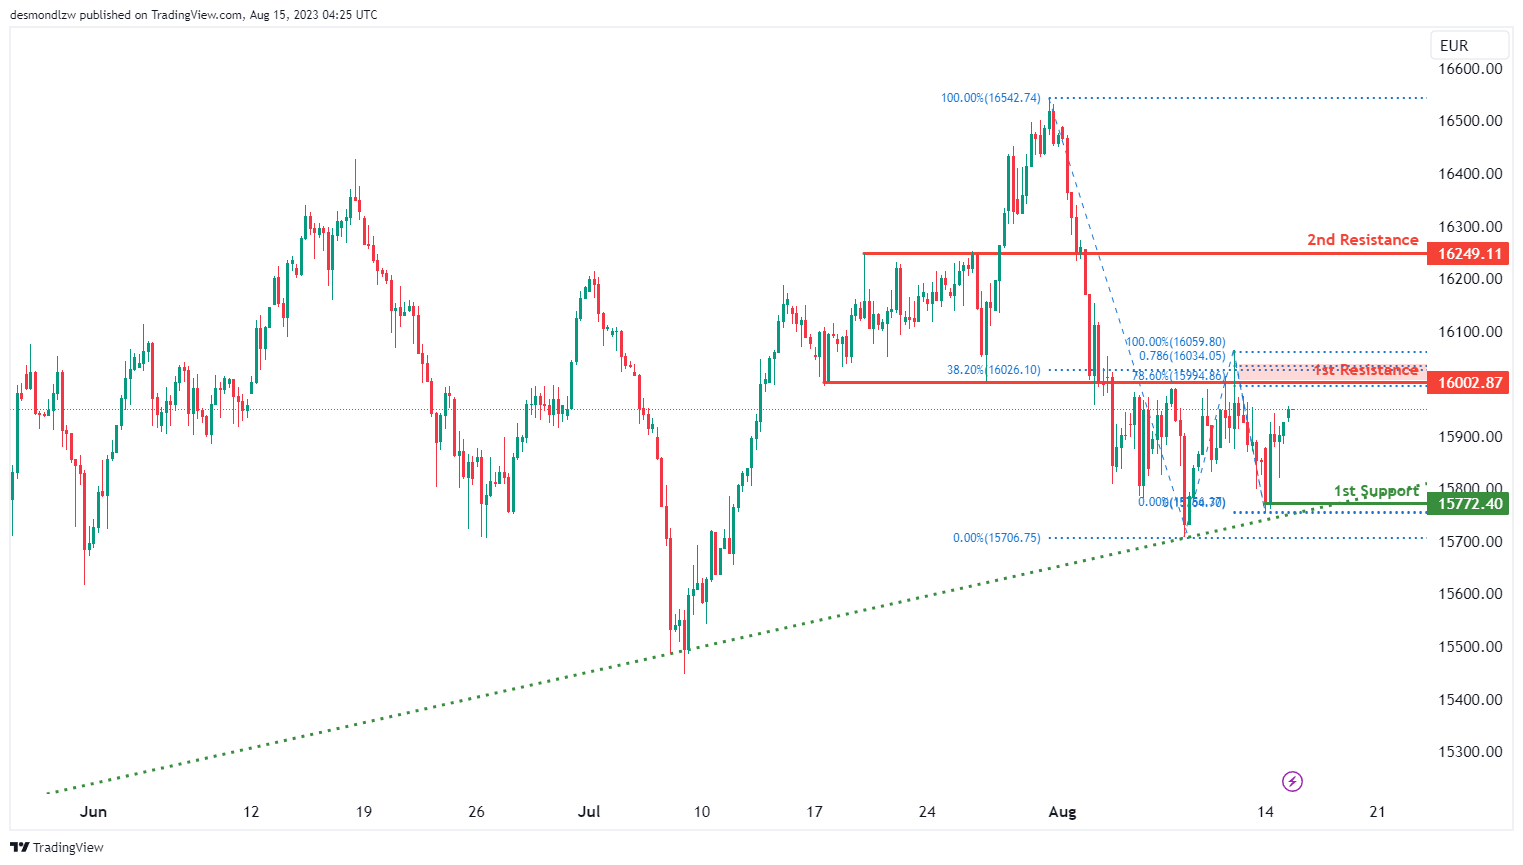
GER30:
The current chart analysis for GER30 indicates a bullish momentum, suggesting a prevailing upward trend. With this positive momentum, there is a potential for the price to continue its bullish movement towards the 1st resistance level at 16002.87.
The 1st support level at 15772.40 is significant as it is a swing low support. Additionally, the 2nd support at 15643.90 serves as a reinforcement for the support structure.
On the other hand, the 1st resistance level at 16002.87 is important as it acts as a pullback resistance and aligns with both the 38.20% and 78.60% Fibonacci retracement levels, indicating potential resistance.
Moreover, there is a 2nd resistance at 16249.11 which also serves as an overlap resistance, further emphasizing its potential impact on price movement.
US500
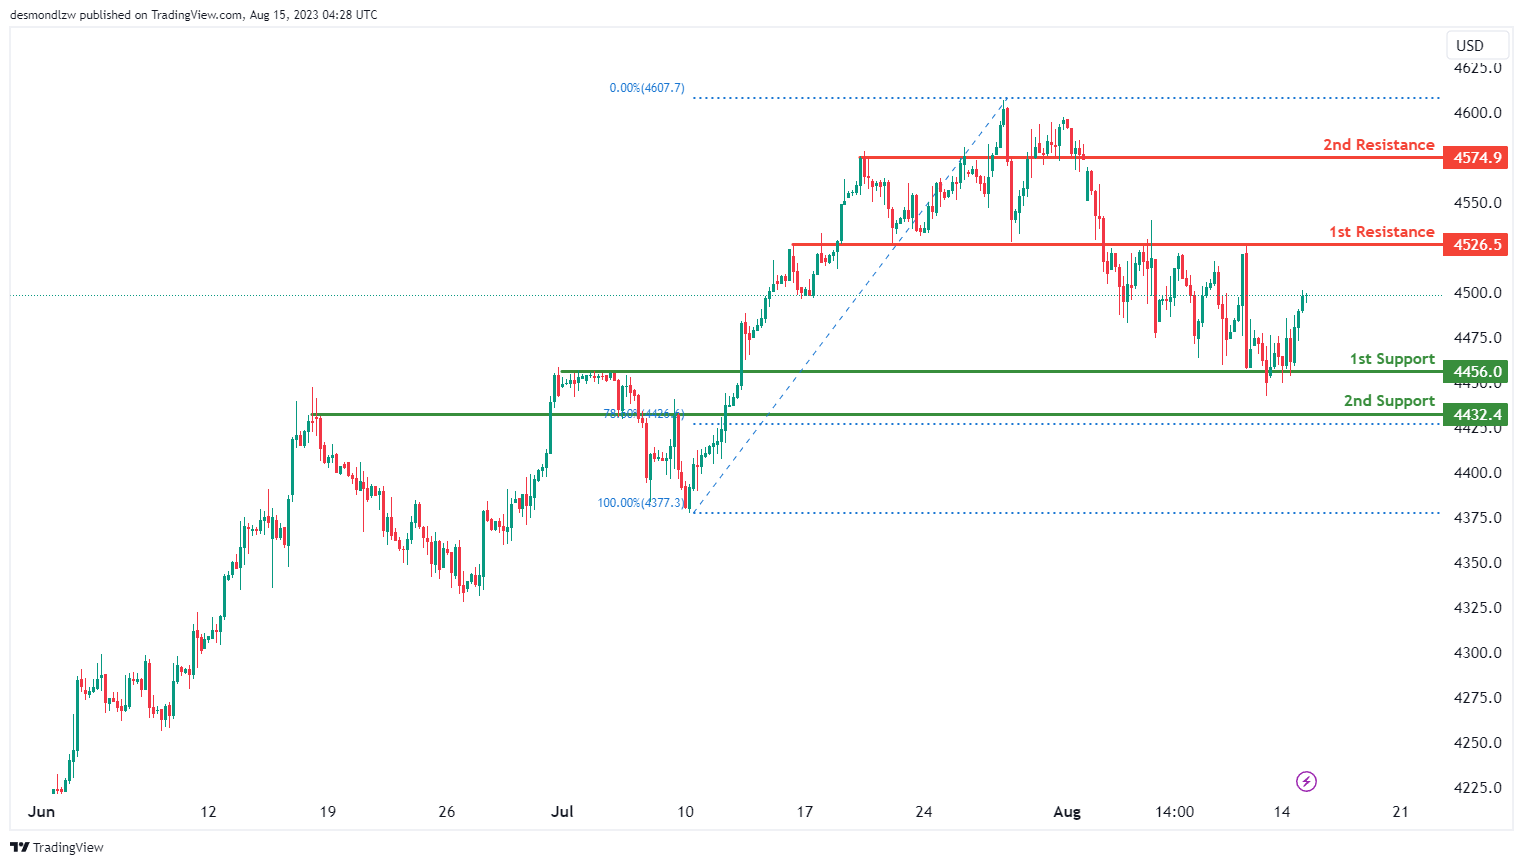
The current analysis of the US500 chart suggests a bullish momentum, indicating a prevailing upward trend. With this momentum, there is a potential for the price to continue moving upwards towards the 1st resistance level at 4526.5.
The 1st support level at 4456.0 is considered strong due to its alignment with a pullback support and a 78.60% Fibonacci retracement. Additionally, the 2nd support at 4432.4 provides further reinforcement to the support structure.
On the flip side, the 1st resistance level at 4526.5 is important as it acts as an overlap resistance. Moreover, there is a 2nd resistance at 4574.9, which is also identified as an overlap resistance, adding to its potential to resist further upward movement.
BTC/USD:
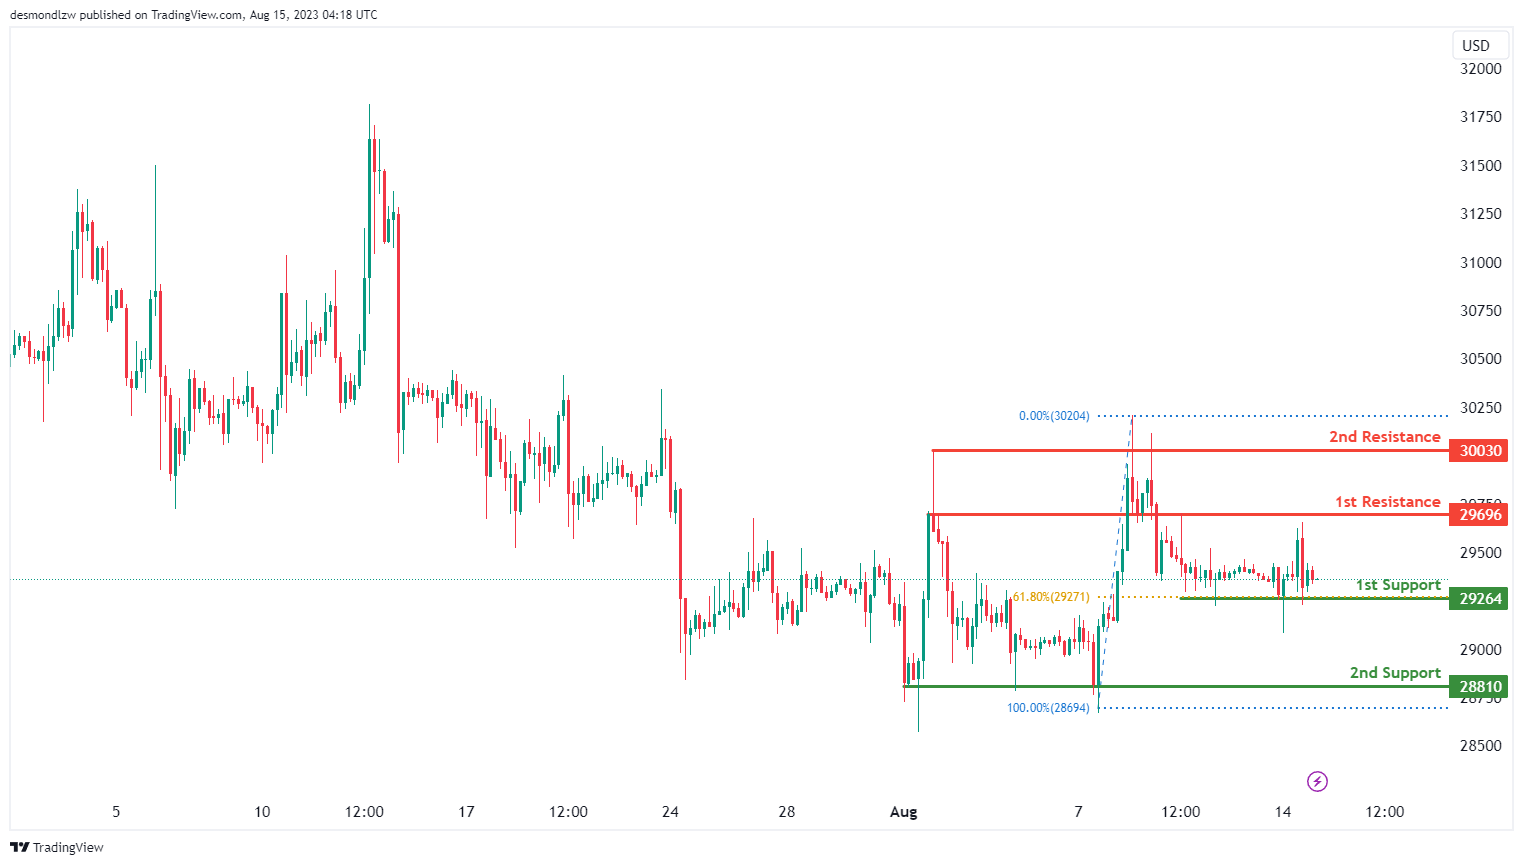
The current chart analysis of BTC/USD suggests a bullish trend, indicating an upward movement.
Given this bullish sentiment, there’s a possibility for the price to rebound from the 1st support level and continue its upward trajectory towards the 1st resistance at 29696.
The 1st support at 29264 gains significance due to its role as a pullback support, supported by a 61.80% Fibonacci Retracement. Additionally, a secondary support at 28810 enhances the support structure, identified as a multi-swing low support.
Conversely, the 1st resistance level at 29696 becomes notable as it is an overlap resistance. Furthermore, a 2nd resistance at 30030 is characterized as a multi-swing high resistance, contributing to its potential impact on the price movement.
ETH/USD:
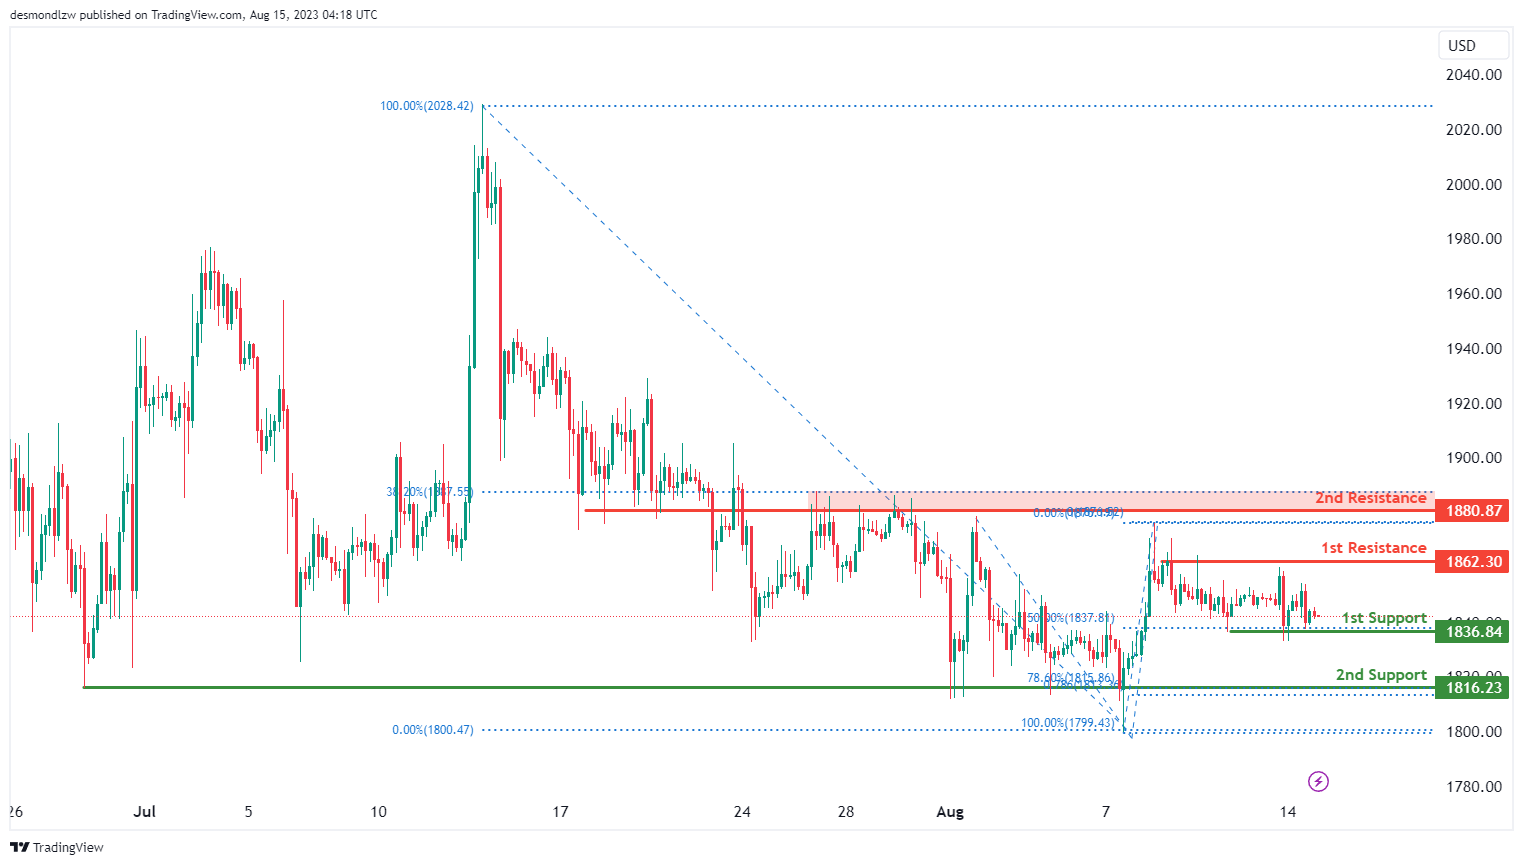
The current analysis of the ETH/USD chart shows a bullish momentum, indicating a prevailing upward trend.
Given this momentum, there is a potential scenario where the price could rebound from the 1st support level and move towards the 1st resistance at 1862.30.
The 1st support at 1836.84 gains importance as it serves as a pullback support, in addition to aligning with a 50% Fibonacci Retracement. Another layer of support is observed at 1816.23, identified as an overlap support.
On the flip side, the 1st resistance level at 1862.30 is significant due to its role as a multi-swing high resistance. Furthermore, a 2nd resistance at 1880.87 is identified as an overlap resistance, strengthening its potential to influence price movement.
WTI/USD:
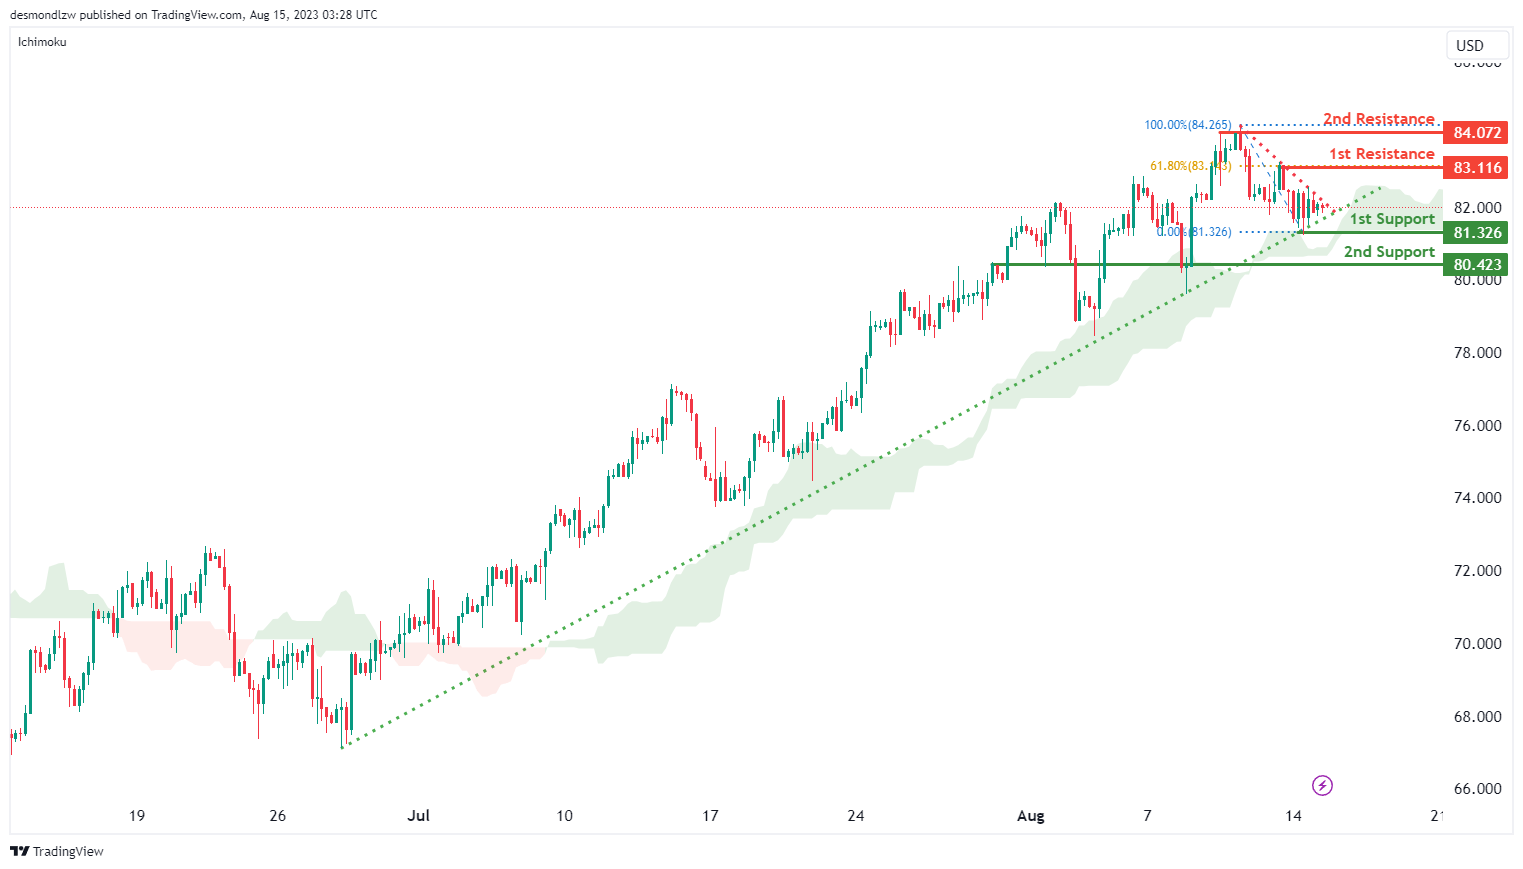
The current momentum of the WTI/USD chart is showing a weak bullish trend with low confidence. This suggests that the price is likely to continue moving higher, supported by the presence of a major ascending trend line and being above the bullish Ichimoku cloud.
There is a potential for the price to continue its bullish movement towards the 1st resistance level at 83.12 that is identified as a pullback resistance that aligns with the 61.80% Fibonacci retracement level. In addition, the 2nd resistance at 84.07 is identified as a swing-high resistance.
To the downside, the 1st support level at 81.33 is identified as a swing-low that intersects with the ascending trendline. Additionally, the 2nd support at 80.42 is identified as an overlap support level.
XAU/USD (GOLD):
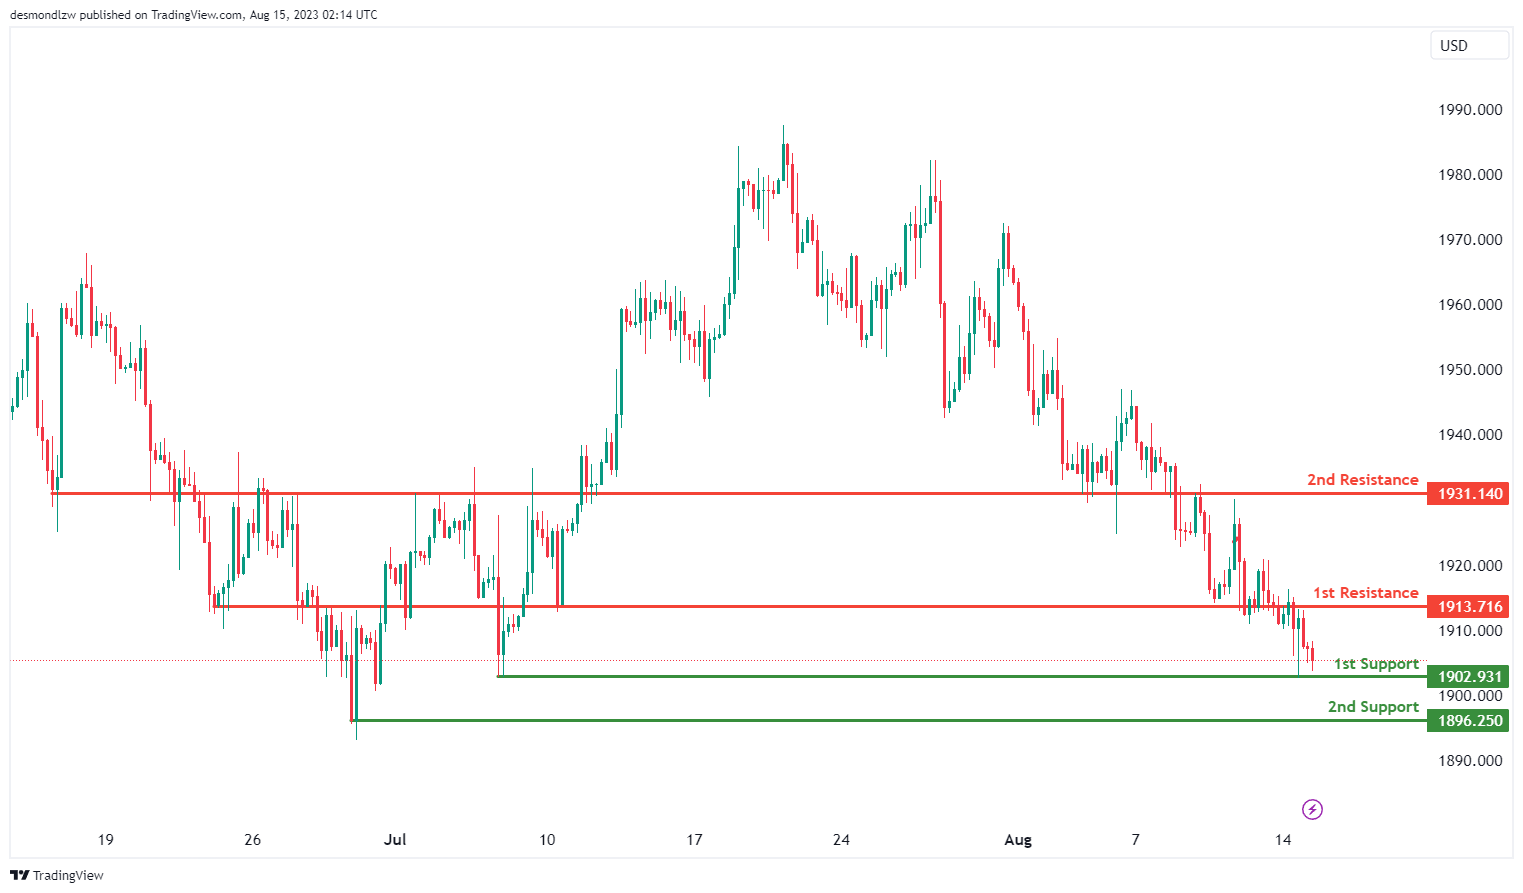
The XAU/USD chart currently exhibits a bullish momentum, indicating a potential upward trend. Given this momentum, the price may continue to rise towards the 1st resistance level at 1913.71. The 1st support at 1902.93 is significant as it is a multi-swing low support, while the 2nd support at 1896.25 serves as a pullback support. On the other hand, the 1st resistance level at 1913.71 is considered an overlap resistance, and there is a 2nd resistance at 1931.14, which further supports potential upward movement.
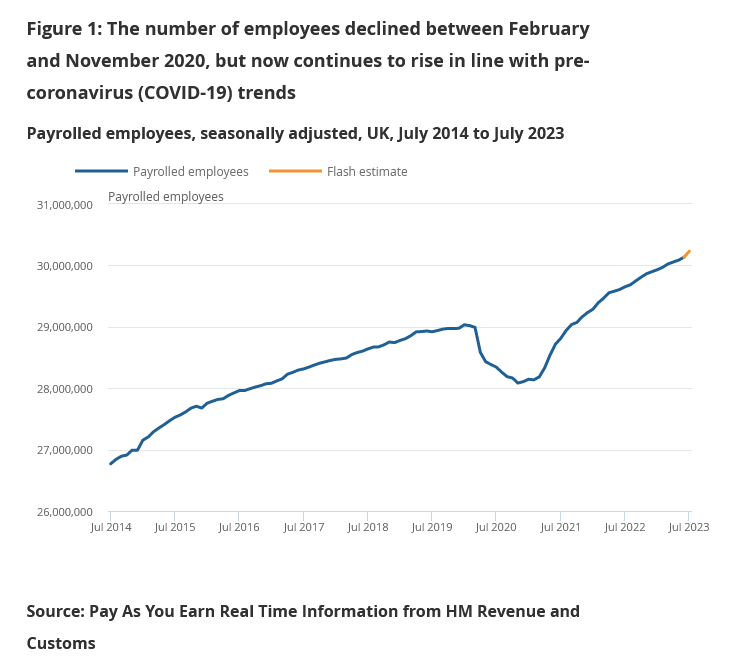
UK payrolled employment rose 97k in Jul, unemployment rate at 4.2% in Jun
UK payrolled employment grew 97k, or 0.3% mom in July. June's figure was revised from -9k decrease to 47k increase. Median monthly pay rose 7.8% yoy compare with July 2022, down from prior month's 9.7% yoy. Claimant count rose 29.0k, above expectation of 19.6k.
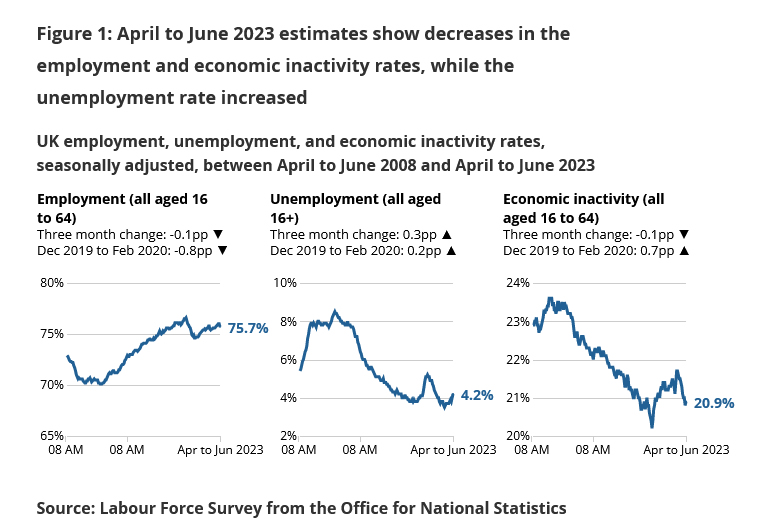
In the three months to June, unemployment rate rose to 4.2%, above expectation of 4.0%. That's 0.3% higher than previous quarter. Employment rate rose 0.1% to 75.7%. Inactivity rate fell -0.1% to 20.9%. Average earnings including bonus rose 8.2% 3moy, above expectation of 7.3%. Average earnings excluding bonus rose 7.8% 3moy, above expectation of 7.4%.