Sample Category Title
GBP/JPY Daily Outlook
Daily Pivots: (S1) 183.84; (P) 184.29; (R1) 185.12; More...
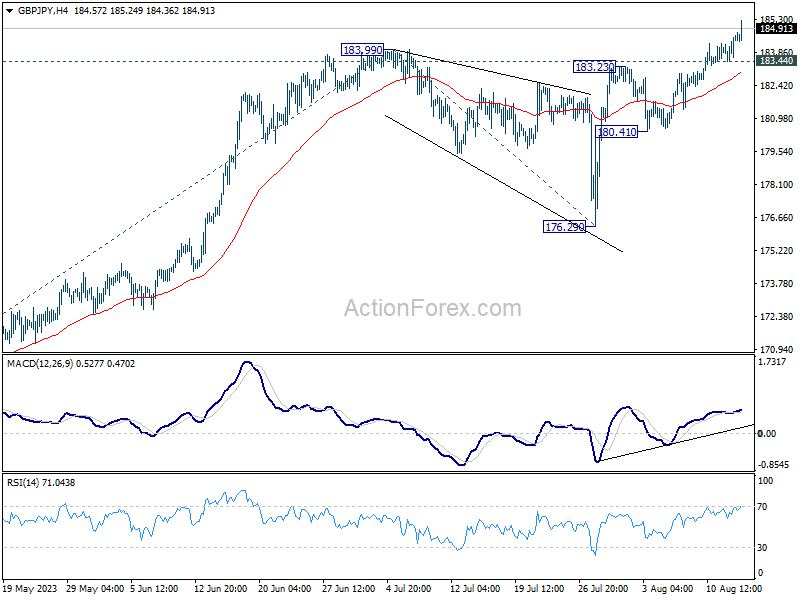
GBP/JPY's rally continues today and intraday bias stays on the upside. Current up trend should extend to 61.8% projection of 158.24 to 183.99 from 176.29 at 192.20. On the downside, below 183.44 minor support will turn intraday bias neutral and bring consolidations first, before staging another rally.
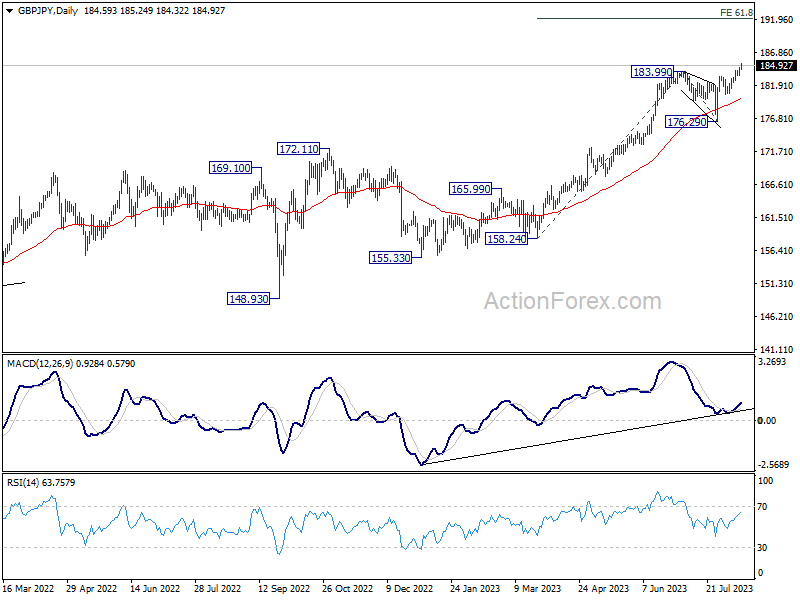
In the bigger picture, up trend from 123.94 (2020 low) is in progress. Next target is 195.86 (2015 high). This will now remain the favored case as long as 176.29 support holds, even in case of deeper pull back.
EUR/JPY Daily Outlook
Daily Pivots: (S1) 158.32; (P) 158.61; (R1) 159.03; More....
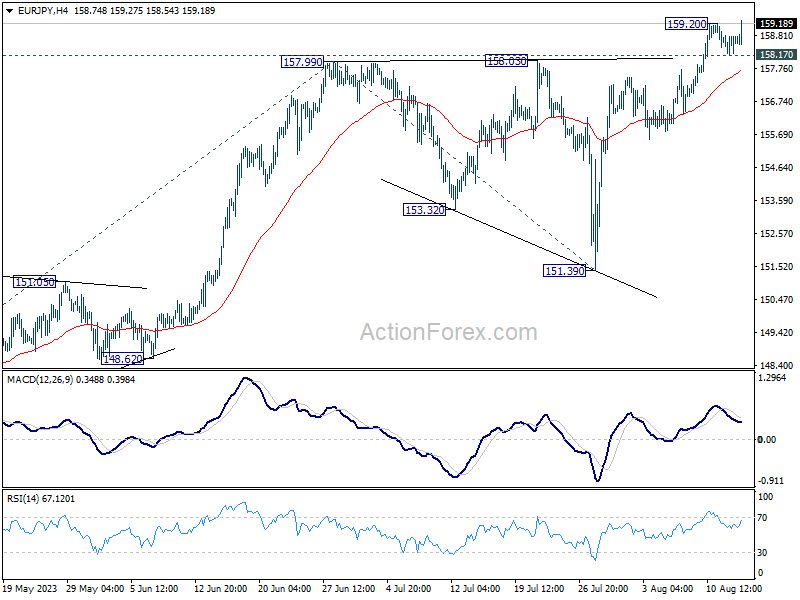
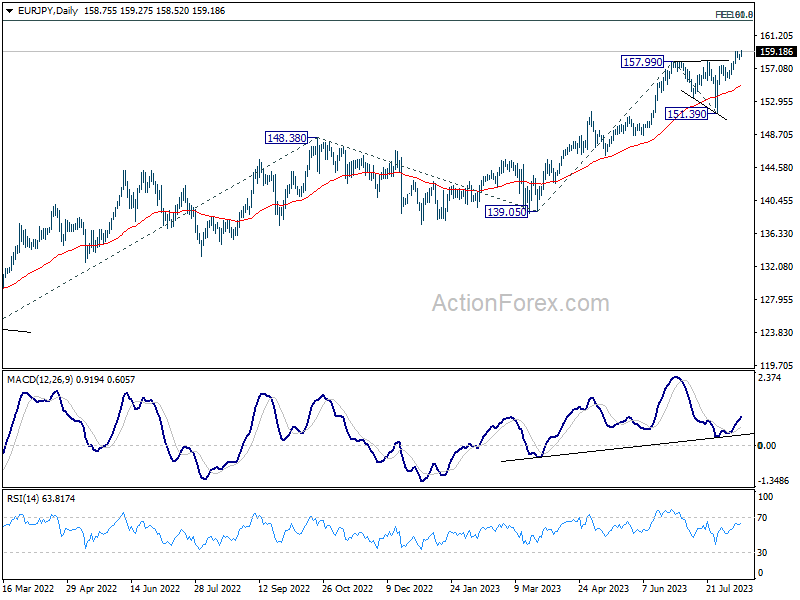
Intraday bias in EUR/JPY is back on the upside with breach of 159.20 temporary top. Current up trend should target 61.8% projection of 139.05 to 157.99 from 151.39 at 163.09 next. On the downside, below 158.17 minor support will turn bias neutral again and bring more consolidations.
In the bigger picture, rise from 114.42 (2020 low) is in progress. Next target is 100% projection of 124.37 to 148.38 from 139.05 at 163.06. Sustained break there will pave the way to retest long term resistance at 169.96. This will now remain the favored case as long as 151.39 support holds, even in case of deep pull back.
EUR/GBP Daily Outlook
Daily Pivots: (S1) 0.8582; (P) 0.8607; (R1) 0.8622; More...
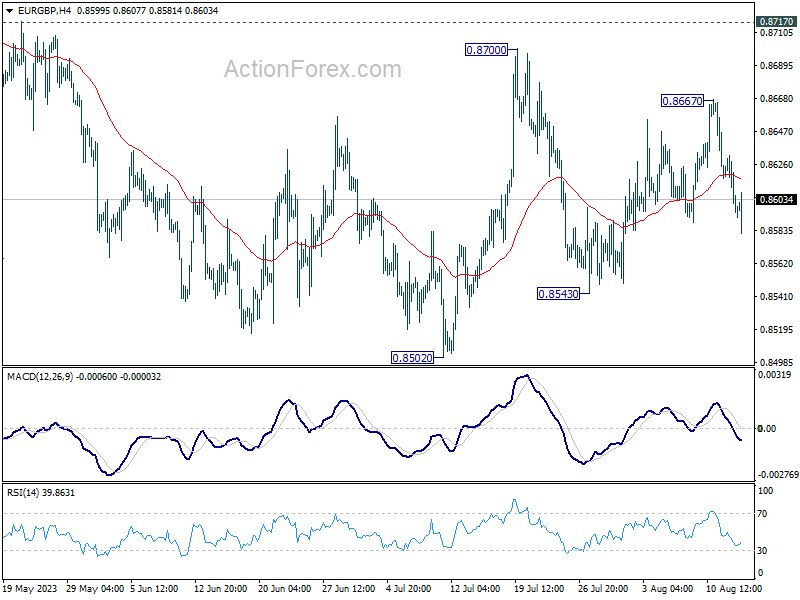
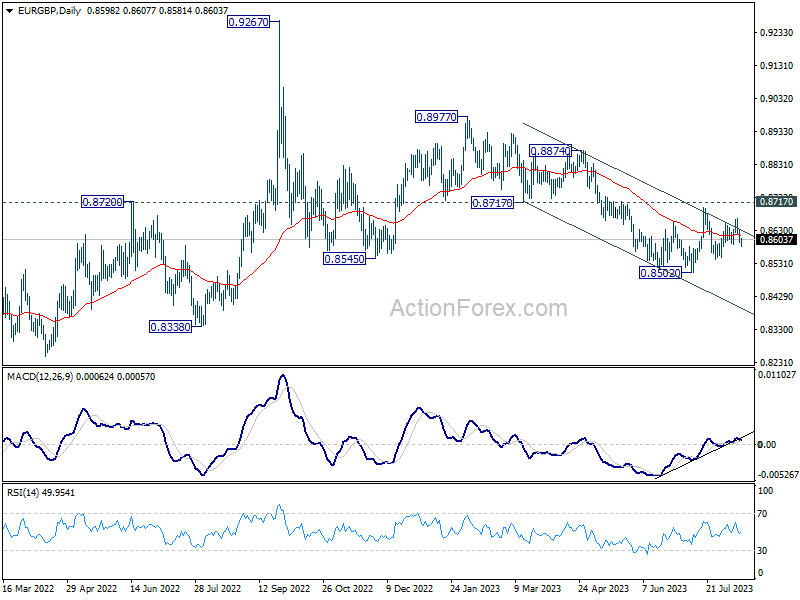
Range trading continues in EUR/GBP and intraday bias stays neutral. On the downside, below 0.8543 will target a test on 0.8502 low. Decisive break there will resume larger decline from 0.8977. On the upside firm break of 0.8717 resistance will suggest larger reversal and target 0.8874 resistance next.
In the bigger picture, the down trend from 0.9267 (2022 high) is seen as part of the long term range pattern from 0.9499 (2020 high). Firm break of 0.8717 support turned resistance will argue that it has completed with three waves down to 0.8502. Further break of 0.8977 will bring retest of 0.9267 high. Nevertheless, rejection by 0.8717, followed by break of 0.8502 will resume the decline towards 0.8201 (2022 low).
EUR/AUD Daily Outlook
Daily Pivots: (S1) 1.6762; (P) 1.6846; (R1) 1.6895; More...
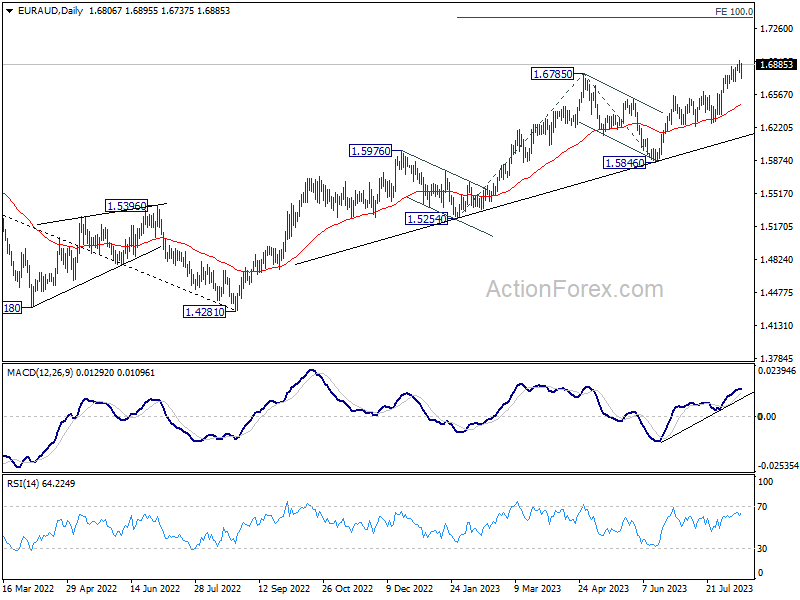
Despite retreating, further rise is expected in EUR/AUD with 1.6708 support intact. Current rally is part of the up trend from 1.4281. Next target is 1.7377 projection level next. On the downside, break 1.6708 minor support will turn bias to the downside for deeper pull back.
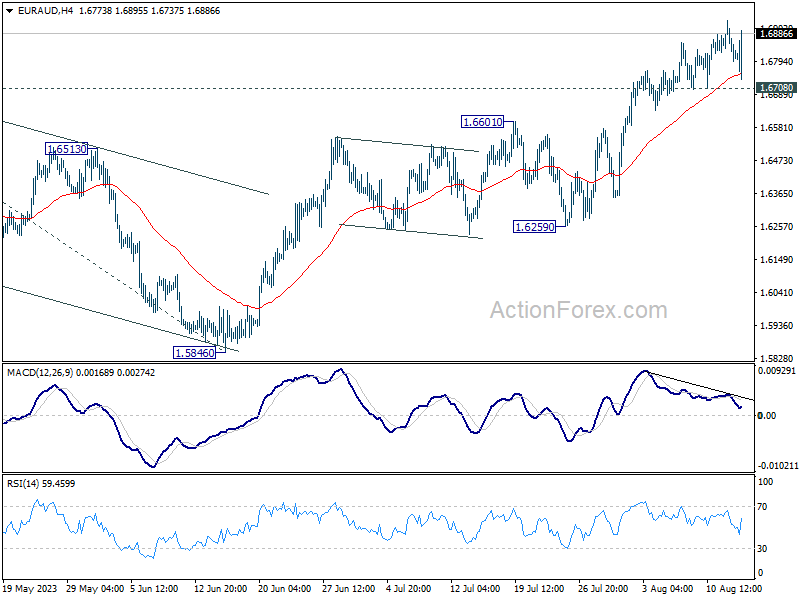
In the bigger picture, the rise from 1.4281 (2022 low) is in progress. Next target is 100% projection of 1.5254 to 1.6785 from 1.5846 at 1.7377. For now, outlook will stay bullish as long as 1.5846 support holds, even in case of another pull back.
EUR/CHF Daily Outlook
Daily Pivots: (S1) 0.9565; (P) 0.9589; (R1) 0.9602; More...
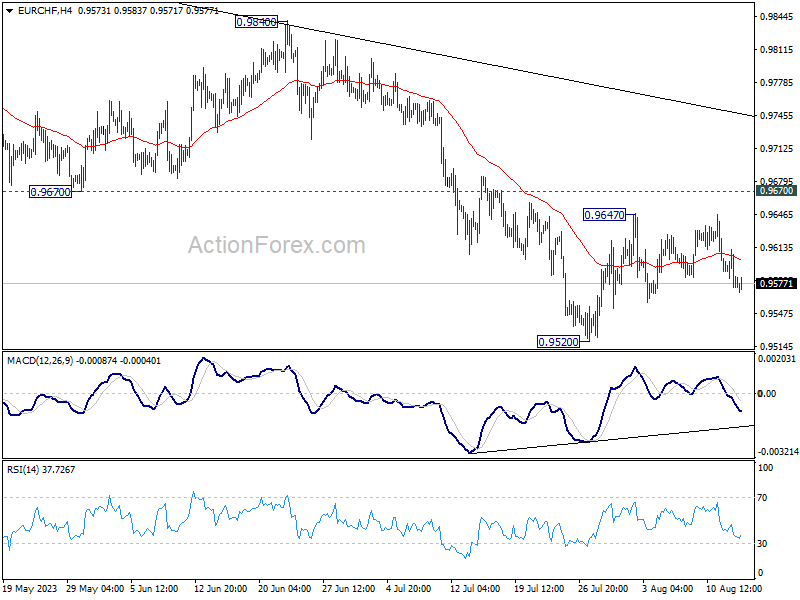
EUR/CHF is still bounded in range trading and intraday bias stays neutral. On the upside, break of 0.9647 will resume the rebound from 0.9520. Further sustained break of 0.9670 will be the first sign of bullish reversal and target 0.9840 resistance for confirmation. On the downside, break of 0.9520 will resume the whole fall from 1.0095 towards 0.9407 low.
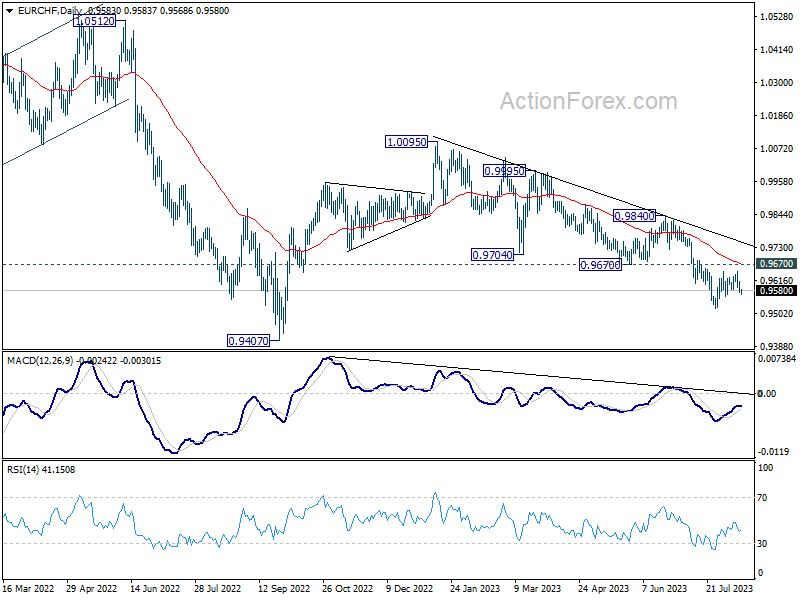
In the bigger picture, medium term outlook is staying bearish as the pair is capped well below falling 55 W EMA (now at 0.9849). Down trend from 1.2004 (2018 high) is in favor to continue. Sustained break of 0.9407 will target 61.8% projection of 1.1149 to 0.9407 from 1.0095 at 0.9018. For now, this will remain the favored case as long as 0.9840 resistance holds, in case of strong rebound.
China Surprises With Rate Cut, US Retail Sales in Focus
China’s central bank hijacked the headlines on Tuesday morning after unexpectedly reducing a key rate by the most since 2020 to shore up its weak economy. However, Asian markets displayed a mixed reaction with sentiment whacked by a barrage of disappointing China data published after the rate decision.
European futures are pointing to a positive open ahead of the German August ZEW survey. In the currency space, the yuan slipped to its weakened level since November while the British Pound received a boost after reports showed wages grew at a record pace in the second quarter of 2023. Looking at commodities, gold is wobbling above the $1900 support level while oil prices remain vulnerable as China growth fears hit the demand outlook.
USD and retail sales in focus
As we move deeper into the second half of 2023, dollar weakness could become a major theme if the Fed signals that it has truly concluded its rate hiking cycle.
Despite US inflation edging up in July after 12 straight months of decline, the core figures were encouraging and signal that the Fed’s aggressive hikes are starting to tame the inflation beast. Should price pressures continue to ease and US economic data show signs of weakness, this may eliminate the odds of another hike, especially when factoring in the Fed's current data dependence stance.
All eyes will be on the US retail sales figures later today which could add another piece to the puzzle that determines whether the Fed hikes one more time in 2023 or not. On Wednesday, the Fed minutes might also offer key clues on the central bank’s next policy move. Traders are currently pricing in only an 11% probability of a 25-basis point hike at September’s FOMC meeting, with this rising to 40% by November, according to Fed funds futures. The dollar is likely to weaken if the data is softer or the minutes strike a dovish tone. Any hint from the hawks or signals of more hikes down the road could boost the dollar.
GBPUSD Rally Loses Power, All Eyes on 1.2610
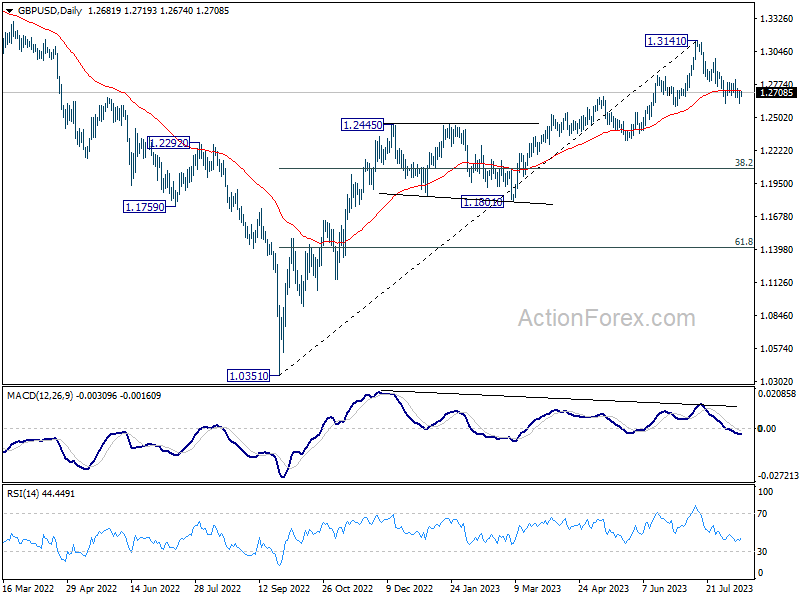
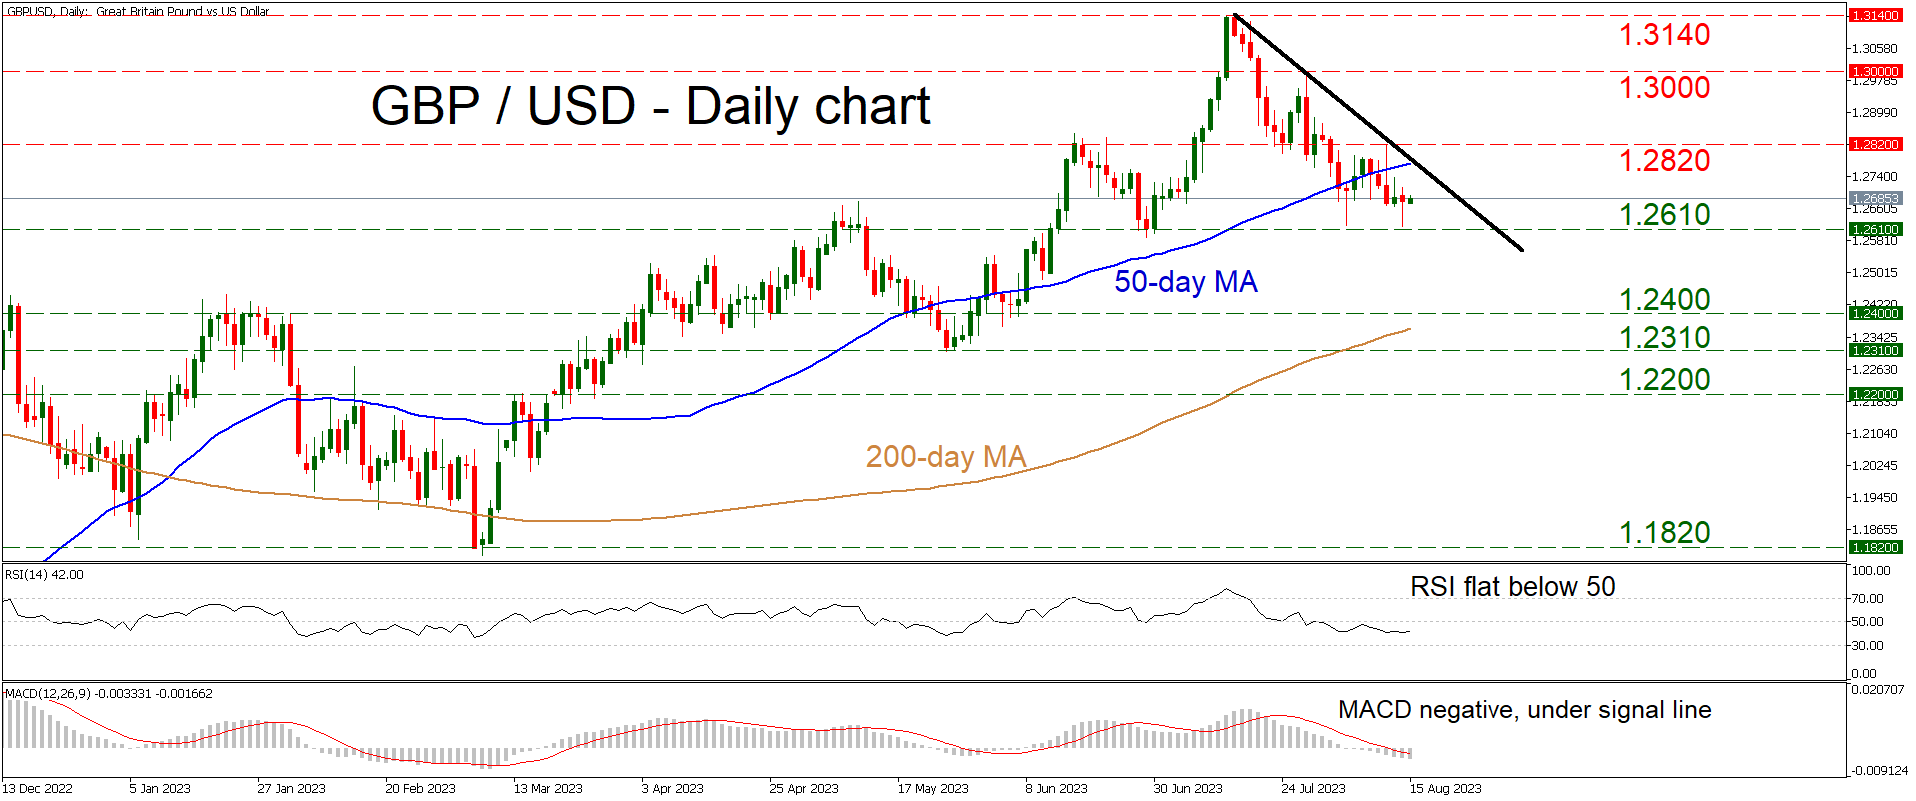
GBPUSD has been on the retreat for one month now, trading below a short-term downtrend line and its 50-day moving average (MA). But in the bigger picture, the pair is still in an uptrend that started back in September.
This misalignment puts extra emphasis on the 1.2610 region. If sellers pierce below this area, it would mark a lower low on the daily chart, sending a strong signal that the longer-term uptrend has started to break down.
Momentum oscillators like the RSI and the MACD are flashing bearish signals, but not excessively so. They are simply reflecting the latest slide in the market, providing little insight about what comes next.
If sellers remain in control and manage to slice below 1.2610, the pair could then seek support near the 1.2400 territory, which has acted both as support and resistance this year. If that’s violated too, a bigger battle might ensue near the May low at 1.2310.
Now if buyers come back into action, their first test will be getting through the busy 1.2820 area, which roughly encompasses the 50-day MA and the short-term downtrend line too. A break higher would suggest that the recent pullback was merely a correction within a broader uptrend, unlocking the door towards the 1.3000 hurdle.
In short, GBPUSD seems bearish in the short-term but bullish in longer-term timeframes. A break either below 1.2610 or above 1.2820 would reveal which side has the upper hand.
Crypto Looks Down, Prepares to Jump
Market picture
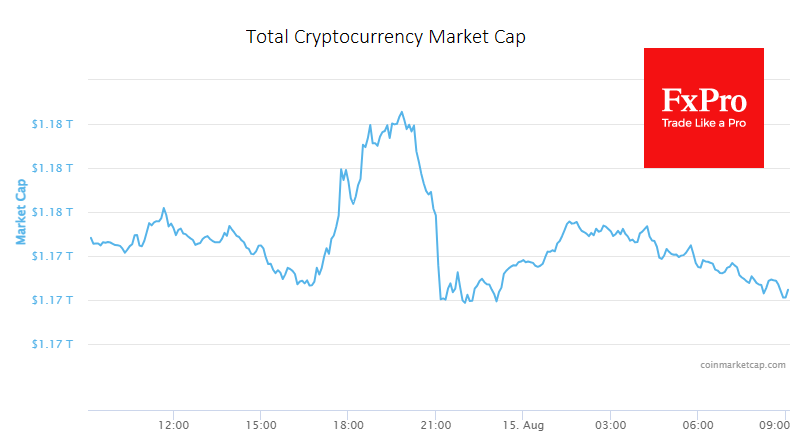
The crypto market cap has slightly declined 0.23% to $1.170 trillion in the last 24 hours. The market failed to break above the $1.18 trillion resistance level and entered a bearish phase in the early hours of Tuesday. This contrasts with the performance of the Nasdaq, which rallied on Monday and continued to rise on Tuesday.
Bitcoin followed the Nasdaq’s lead on Monday but faced strong resistance near $29.6K and fell back to $29.2K. Meanwhile, the stocks have maintained their momentum and gained more ground on Tuesday. This divergence suggests that either the cryptocurrency market is not reflecting the true demand for risk assets or that the stock market is due for a correction soon. Alternatively, it could indicate that crypto is losing its appeal as stocks benefit from investor confidence in the corporate sector.
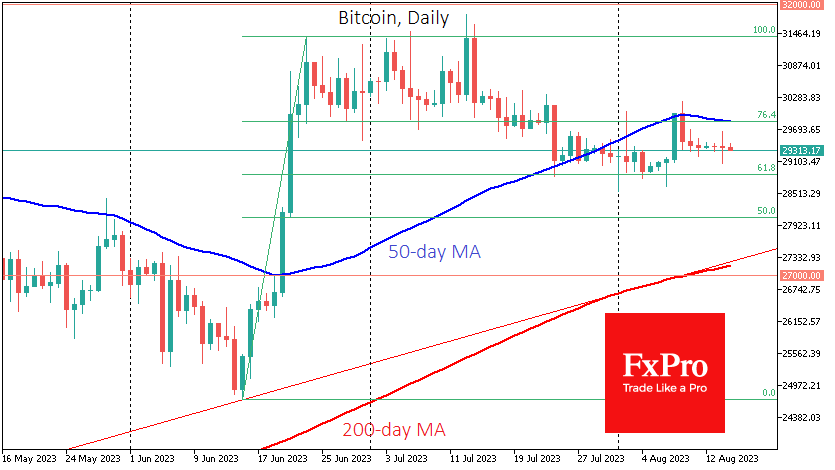
The $29.4K level remains a centre of gravity for BTCUSD for the last six days. Despite the intraday fluctuations, the daily candles close near their opening levels, indicating a lack of direction and conviction. This usually precedes a sharp move and for now, we see more downside risk, with a potential drop to $28K in the near term.
News background
CoinShares reported that crypto funds saw an inflow of $29 million last week after three weeks of outflows. Bitcoin funds attracted $27 million, Ethereum funds $2.5 million, while funds that allow shorting Bitcoin saw an outflow of $3 million.
Glassnode compared the current situation with the hangover after bear markets and predicted a lasting period of low volatility.
PayPal announced that it will offer a service for storing cryptocurrencies following its stablecoin launch. However, not all PayPal users can access this service, and the company will evaluate each user individually.
Former US President Donald Trump disclosed ownership of $250-500K in digital assets that can be linked to NFT token collections issued on his behalf on the Ethereum network.
EUR/USD Daily Outlook
Daily Pivots: (S1) 1.0867; (P) 1.0914; (R1) 1.0952; More...
Intraday bias in EUR/USD stays on the downside at this point. Fall from 1.1274 is in progress for 1.0832 support. Sustained trading below there will target 1.0609/34 cluster support. On the upside, break of 1.1064 resistance is needed to indicate completion of the fall. Otherwise, outlook will stay cautiously bearish in case of recovery.
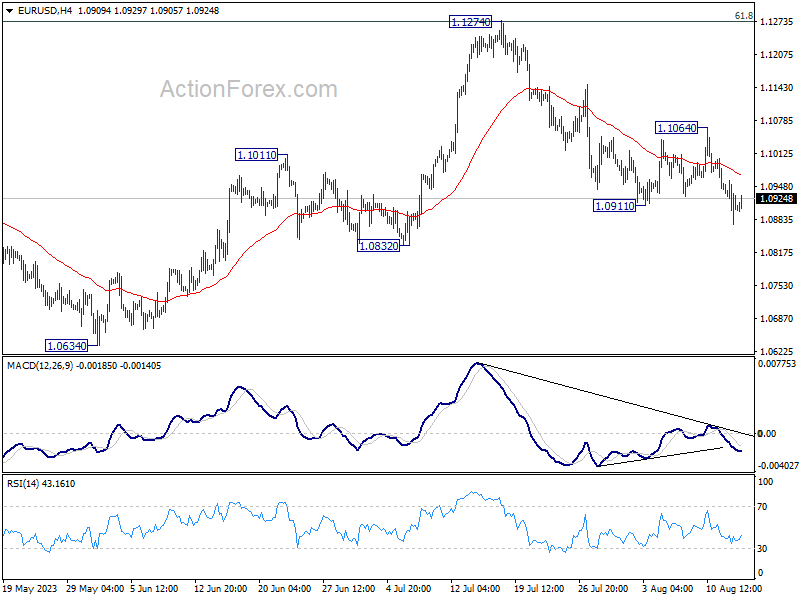
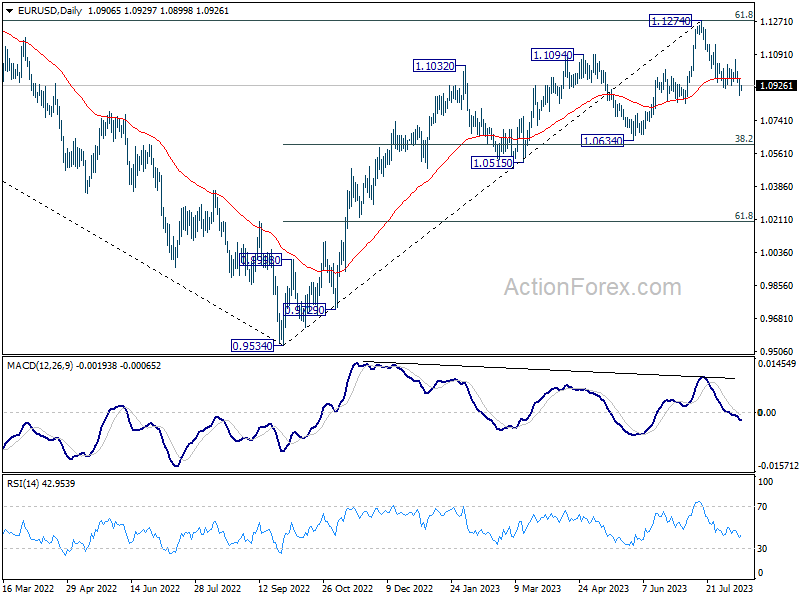
In the bigger picture, a medium term top could be formed at 1.1274, after failing to break through 61.8% retracement of 1.2348 (2021 high) to 0.9534 at 1.1273 decisively, on bearish divergence condition in D MACD. Sustained trading below 55 D EMA (now at 1.0966) will bring deeper correction to 1.0634 cluster support (38.2% retracement of 0.9534 to 1.1274 at 1.0609). Strong support could be seen there, at least on first attempt, to set the range for consolidation.
GBP/USD Daily Outlook
Daily Pivots: (S1) 1.2631; (P) 1.2673; (R1) 1.2729; More...
Intraday bias in GBP/USD stays neutral as sideway trading continues above 1.2618. On the downside, firm break of 1.2618, and sustained trading below 1.2678 resistance turned support will argue that it's already in a larger correction. Deeper decline would then be seen to 1.2306 support next. Nevertheless, break of 1.2817 minor resistance will indicate that the pull back has completed, and turn bias back to the upside for stronger rebound.
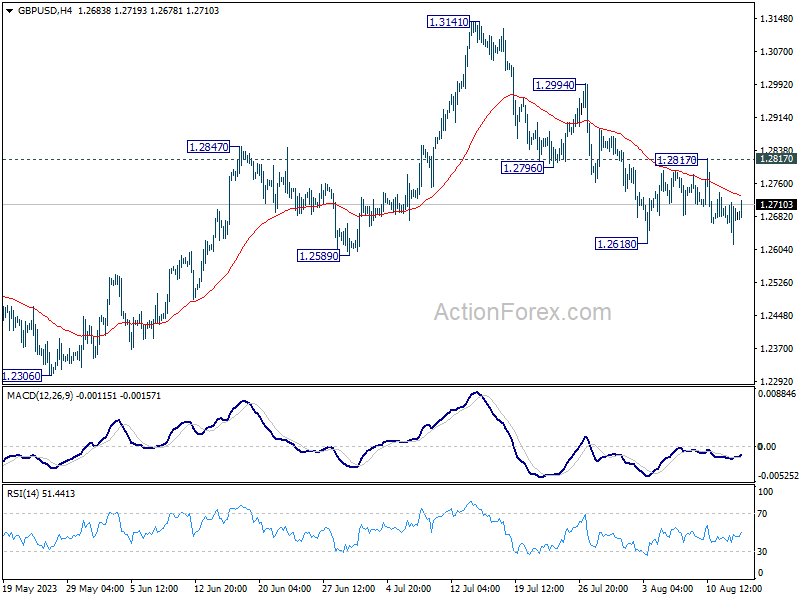
In the bigger picture, a medium term top could be in place at 1.3141 already, on bearish divergence condition in D MACD. Sustained trading below 55 D EMA (now at 1.2725) should confirm this case, and bring deeper fall to 38.2% retracement of 1.0351 to 1.3141 at 1.2075, as a correction to up trend from 1.0351 (2022 low). For now, rise will stay mildly on the downside as long as 1.3141 resistance holds, in case of strong rebound.