Sample Category Title
Summary 8/7 – 8/11
Monday, Aug 7, 2023
| GMT | Ccy | Events | Consensus | Previous |
|---|---|---|---|---|
| 23:50 | JPY | BoJ Summary of Opinions | ||
| 05:00 | JPY | Leading Economic Index Jun P | 108.9 | 109.2 |
| 06:00 | EUR | Germany Industrial Production M/M Jun | -0.40% | -0.20% |
| 07:00 | CHF | Foreign Currency Reserves (CHF) Jul | 725B | |
| 08:30 | EUR | Eurozone Sentix Investor Confidence Aug | -25 | -22.5 |
| 23:01 | GBP | BRC Like-For-Like Retail Sales Y/Y Jul | 3.00% | 4.20% |
| 23:30 | JPY | Labor Cash Earnings Y/Y Jun | 3.00% | 2.50% |
| 23:30 | JPY | Overall Household Spending Y/Y Jun | -3.50% | -4.00% |
| 23:50 | JPY | Bank Lending Y/Y Jul | 3.10% | 3.20% |
| 23:50 | JPY | Current Account (JPY) Jun | 2.24T | 1.70T |
| GMT | Ccy | Events | |
|---|---|---|---|
| 23:50 | JPY | BoJ Summary of Opinions | |
| Forecast: | Previous: | ||
| 05:00 | JPY | Leading Economic Index Jun P | |
| Forecast: 108.9 | Previous: 109.2 | ||
| 06:00 | EUR | Germany Industrial Production M/M Jun | |
| Forecast: -0.40% | Previous: -0.20% | ||
| 07:00 | CHF | Foreign Currency Reserves (CHF) Jul | |
| Forecast: | Previous: 725B | ||
| 08:30 | EUR | Eurozone Sentix Investor Confidence Aug | |
| Forecast: -25 | Previous: -22.5 | ||
| 23:01 | GBP | BRC Like-For-Like Retail Sales Y/Y Jul | |
| Forecast: 3.00% | Previous: 4.20% | ||
| 23:30 | JPY | Labor Cash Earnings Y/Y Jun | |
| Forecast: 3.00% | Previous: 2.50% | ||
| 23:30 | JPY | Overall Household Spending Y/Y Jun | |
| Forecast: -3.50% | Previous: -4.00% | ||
| 23:50 | JPY | Bank Lending Y/Y Jul | |
| Forecast: 3.10% | Previous: 3.20% | ||
| 23:50 | JPY | Current Account (JPY) Jun | |
| Forecast: 2.24T | Previous: 1.70T | ||
Tuesday, Aug 8, 2023
| GMT | Ccy | Events | Consensus | Previous |
|---|---|---|---|---|
| 00:30 | AUD | Westpac Consumer Confidence Aug | 2.70% | |
| 01:30 | AUD | NAB Business Conditions Jul | 9 | |
| 01:30 | AUD | NAB Business Confidence Jul | 0 | |
| 03:00 | CNY | Trade Balance (USD) Jul | 67.8B | 70.6B |
| 03:00 | CNY | Trade Balance (CNY) Jul | 470B | 491B |
| 05:00 | JPY | Eco Watchers Survey: Outlook Jul | 54.5 | 53.6 |
| 06:00 | EUR | Germany CPI M/M Jul F | 0.30% | 0.30% |
| 06:00 | EUR | Germany CPI Y/Y Jul F | 6.20% | 6.20% |
| 06:45 | EUR | France Trade Balance (EUR) Jun | -8.0B | -8.4B |
| 10:00 | USD | NFIB Business Optimism Index Jul | 90.6 | 91.0 |
| 12:30 | USD | Trade Balance (USD) Jun | -65.2B | -69.0B |
| 12:30 | CAD | Trade Balance (CAD) Jun | -1.7B | -3.4B |
| 14:00 | USD | Wholesale Inventories Jun F | -0.30% | -0.30% |
| GMT | Ccy | Events | |
|---|---|---|---|
| 00:30 | AUD | Westpac Consumer Confidence Aug | |
| Forecast: | Previous: 2.70% | ||
| 01:30 | AUD | NAB Business Conditions Jul | |
| Forecast: | Previous: 9 | ||
| 01:30 | AUD | NAB Business Confidence Jul | |
| Forecast: | Previous: 0 | ||
| 03:00 | CNY | Trade Balance (USD) Jul | |
| Forecast: 67.8B | Previous: 70.6B | ||
| 03:00 | CNY | Trade Balance (CNY) Jul | |
| Forecast: 470B | Previous: 491B | ||
| 05:00 | JPY | Eco Watchers Survey: Outlook Jul | |
| Forecast: 54.5 | Previous: 53.6 | ||
| 06:00 | EUR | Germany CPI M/M Jul F | |
| Forecast: 0.30% | Previous: 0.30% | ||
| 06:00 | EUR | Germany CPI Y/Y Jul F | |
| Forecast: 6.20% | Previous: 6.20% | ||
| 06:45 | EUR | France Trade Balance (EUR) Jun | |
| Forecast: -8.0B | Previous: -8.4B | ||
| 10:00 | USD | NFIB Business Optimism Index Jul | |
| Forecast: 90.6 | Previous: 91.0 | ||
| 12:30 | USD | Trade Balance (USD) Jun | |
| Forecast: -65.2B | Previous: -69.0B | ||
| 12:30 | CAD | Trade Balance (CAD) Jun | |
| Forecast: -1.7B | Previous: -3.4B | ||
| 14:00 | USD | Wholesale Inventories Jun F | |
| Forecast: -0.30% | Previous: -0.30% | ||
Wednesday, Aug 9, 2023
| GMT | Ccy | Events | Consensus | Previous |
|---|---|---|---|---|
| 01:30 | CNY | CPI Y/Y Jul | -0.40% | 0.00% |
| 01:30 | CNY | PPI Y/Y Jul | -3.80% | -5.40% |
| 03:00 | NZD | RBNZ Inflation Expectations Q/Q Q3 | 2.79% | |
| 06:00 | JPY | Machine Tool Orders Y/Y Jul P | -21.70% | |
| 12:30 | CAD | Building Permits M/M Jun | 2.30% | 10.50% |
| 14:30 | USD | Crude Oil Inventories | -17.0M | |
| 23:01 | GBP | RICS Housing Price Balance Jul | -51% | -46% |
| 23:50 | JPY | PPI Y/Y Jul | 3.50% | 4.10% |
| GMT | Ccy | Events | |
|---|---|---|---|
| 01:30 | CNY | CPI Y/Y Jul | |
| Forecast: -0.40% | Previous: 0.00% | ||
| 01:30 | CNY | PPI Y/Y Jul | |
| Forecast: -3.80% | Previous: -5.40% | ||
| 03:00 | NZD | RBNZ Inflation Expectations Q/Q Q3 | |
| Forecast: | Previous: 2.79% | ||
| 06:00 | JPY | Machine Tool Orders Y/Y Jul P | |
| Forecast: | Previous: -21.70% | ||
| 12:30 | CAD | Building Permits M/M Jun | |
| Forecast: 2.30% | Previous: 10.50% | ||
| 14:30 | USD | Crude Oil Inventories | |
| Forecast: | Previous: -17.0M | ||
| 23:01 | GBP | RICS Housing Price Balance Jul | |
| Forecast: -51% | Previous: -46% | ||
| 23:50 | JPY | PPI Y/Y Jul | |
| Forecast: 3.50% | Previous: 4.10% | ||
Thursday, Aug 10, 2023
| GMT | Ccy | Events | Consensus | Previous |
|---|---|---|---|---|
| 01:00 | AUD | Consumer Inflation Expectations Aug | 5.20% | |
| 08:00 | EUR | ECB Economic Bulletin | ||
| 12:30 | USD | Initial Jobless Claims (Aug 4) | 230K | 227K |
| 12:30 | USD | CPI M/M Jul | 0.20% | 0.20% |
| 12:30 | USD | CPI Y/Y Jul | 3.00% | |
| 12:30 | USD | CPI Core M/M Jul | 0.20% | 0.20% |
| 12:30 | USD | CPI Core Y/Y Jul | 4.70% | 4.80% |
| 14:30 | USD | Natural Gas Storage | 14B | |
| 22:30 | NZD | Business NZ PMI Jul | 47.5 |
| GMT | Ccy | Events | |
|---|---|---|---|
| 01:00 | AUD | Consumer Inflation Expectations Aug | |
| Forecast: | Previous: 5.20% | ||
| 08:00 | EUR | ECB Economic Bulletin | |
| Forecast: | Previous: | ||
| 12:30 | USD | Initial Jobless Claims (Aug 4) | |
| Forecast: 230K | Previous: 227K | ||
| 12:30 | USD | CPI M/M Jul | |
| Forecast: 0.20% | Previous: 0.20% | ||
| 12:30 | USD | CPI Y/Y Jul | |
| Forecast: | Previous: 3.00% | ||
| 12:30 | USD | CPI Core M/M Jul | |
| Forecast: 0.20% | Previous: 0.20% | ||
| 12:30 | USD | CPI Core Y/Y Jul | |
| Forecast: 4.70% | Previous: 4.80% | ||
| 14:30 | USD | Natural Gas Storage | |
| Forecast: | Previous: 14B | ||
| 22:30 | NZD | Business NZ PMI Jul | |
| Forecast: | Previous: 47.5 | ||
Friday, Aug 11, 2023
| GMT | Ccy | Events | Consensus | Previous |
|---|---|---|---|---|
| 06:00 | GBP | GDP Q/Q Q2 P | 0.00% | 0.10% |
| 06:00 | GBP | GDP M/M Jun | 0.20% | -0.10% |
| 06:00 | GBP | Industrial Production M/M Jun | -0.10% | -0.60% |
| 06:00 | GBP | Industrial Production Y/Y Jun | -2.10% | -2.30% |
| 06:00 | GBP | Manufacturing Production M/M Jun | 0.10% | -0.20% |
| 06:00 | GBP | Manufacturing Production Y/Y Jun | -1.00% | -1.20% |
| 06:00 | GBP | Goods Trade Balance (GBP) Jun | -16.2B | -18.7B |
| 08:00 | EUR | Italy Trade Balance (EUR) Jun | 4.23B | 4.71B |
| 11:00 | GBP | NIESR GDP Estimate (3M) Jul | 0.00% | |
| 12:30 | USD | PPI M/M Jul | 0.10% | 0.10% |
| 12:30 | USD | PPI Y/Y Jul | 0.10% | |
| 12:30 | USD | PPI Core M/M Jul | 0.20% | 0.10% |
| 12:30 | USD | PPI Core Y/Y Jul | 2.40% | |
| 14:00 | USD | Michigan Consumer Sentiment Index Aug P | 70.9 | 71.6 |
| GMT | Ccy | Events | |
|---|---|---|---|
| 06:00 | GBP | GDP Q/Q Q2 P | |
| Forecast: 0.00% | Previous: 0.10% | ||
| 06:00 | GBP | GDP M/M Jun | |
| Forecast: 0.20% | Previous: -0.10% | ||
| 06:00 | GBP | Industrial Production M/M Jun | |
| Forecast: -0.10% | Previous: -0.60% | ||
| 06:00 | GBP | Industrial Production Y/Y Jun | |
| Forecast: -2.10% | Previous: -2.30% | ||
| 06:00 | GBP | Manufacturing Production M/M Jun | |
| Forecast: 0.10% | Previous: -0.20% | ||
| 06:00 | GBP | Manufacturing Production Y/Y Jun | |
| Forecast: -1.00% | Previous: -1.20% | ||
| 06:00 | GBP | Goods Trade Balance (GBP) Jun | |
| Forecast: -16.2B | Previous: -18.7B | ||
| 08:00 | EUR | Italy Trade Balance (EUR) Jun | |
| Forecast: 4.23B | Previous: 4.71B | ||
| 11:00 | GBP | NIESR GDP Estimate (3M) Jul | |
| Forecast: | Previous: 0.00% | ||
| 12:30 | USD | PPI M/M Jul | |
| Forecast: 0.10% | Previous: 0.10% | ||
| 12:30 | USD | PPI Y/Y Jul | |
| Forecast: | Previous: 0.10% | ||
| 12:30 | USD | PPI Core M/M Jul | |
| Forecast: 0.20% | Previous: 0.10% | ||
| 12:30 | USD | PPI Core Y/Y Jul | |
| Forecast: | Previous: 2.40% | ||
| 14:00 | USD | Michigan Consumer Sentiment Index Aug P | |
| Forecast: 70.9 | Previous: 71.6 | ||
Forward Guidance: Core US Inflation to Tick Lower Again in July
Year-over-year growth in U.S. consumer prices likely ticked slightly higher for the first time in a year in July - gasoline prices didn’t move much this July but a larger 8% drop in July a year ago will fall out of the 12-month growth rate. Year-over-year growth in core (ex-food & energy) prices will still be high (we expect +4.7%) in July, but we expect a moderate 0.2% month-over-month increase to match the June gain. Slower growth in core CPI has come alongside a pullback in home rent inflation as earlier slowing in market asking rent growth feed through to lower rent CPI with a lag as contracts get renewed.
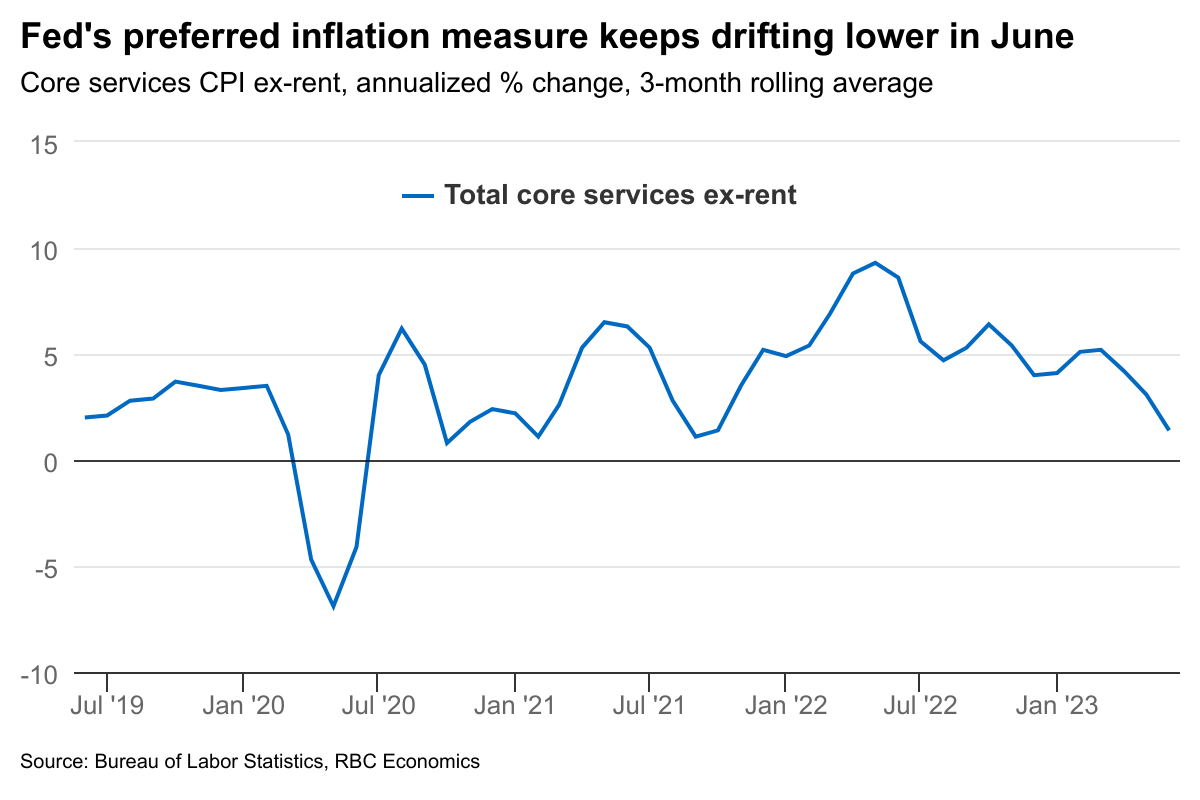
Stripping out shelter, energy, food and other goods, the Fed’s “supercore” CPI will be watched closely for signs that easing domestic inflation pressures are being sustained. The measure is designed to get a better gauge of broader inflation trends driven by domestic rather than global inflation pressures. It has slowed sharply in recent months – month-over-month increases averaged a 1.4% annualized rate in the three months to June (below the Federal Reserve’s 2% inflation objective) thanks to a month over month decline that was also the first one in two years.
Recent moderation in U.S. inflation has led to some speculation that slower consumer spending and weaker labour markets might not be needed to get inflation back under control – increasing the odds of a ’soft landing’ for the economy. Still, we continue to think that aggressive interest rates over the last year and a half will have economic consequences, even if the economy has been more resilient than expected to-date. Household liquid real assets, including cash, checking and time deposits have been dropping lower since early 2022. The share of consumer credit card and auto loans that are moving into 30-day delinquency status have also risen over recent quarters. With indicators on household finances suggesting rising number of challenges, it will be a matter of time for consumer demand to slow more significantly, bringing down GDP growth and labour demand along the way. Fed chair Powell in the July press conference stressed that hiking all the way until inflation’s back to 2% will be a “prescription of going way past target”. Absent a reacceleration in core inflation, we expect the Fed to step to and stay on the sideline and maintain the Fed Funds at 5.25% - 5% range until 2024.
Week ahead data watch
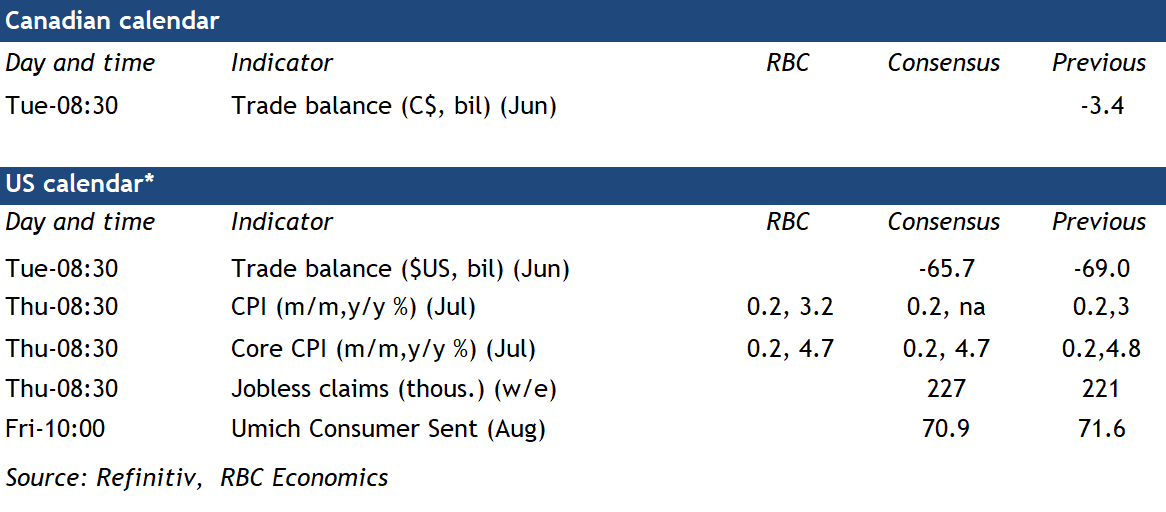
Canadian trade deficit likely narrowed from $-3.4 billion in May to $-3.2 billion in June. Exports (-1.2%) and imports (-1.6%) both declined during that month. Our expectation echoes with StatCan’s advance estimates on manufacturing sales and wholesales trade, both pointing to sizable contractions, and foreshadowing lower trade flows.
According to the advance U.S. economic indicators, the goods deficit shrank by $4 billion from the prior month in June. Exports on goods ticked up 0.2% on a month-over-month basis, supported by capital goods and other goods. Imports fell by 1.4%, slowdowns saw in several baskets, including industrial supplies (-4.4%), capital goods (-3.3%), and other goods (-4.2%).
US Inflation Report Coming Up as Dollar Storms Higher
The spike in US yields this week gave the dollar a boost, but the longevity of this recovery will be decided by the next edition of US inflation. According to the Cleveland Fed Nowcast model, there is some scope for an upside inflation surprise, which would be a blessing for the dollar. Aside from this release, there isn’t much else that can disturb the waters next week.
Dollar shines ahead of inflation test
Global markets are still reeling from the aftershocks of the US credit downgrade. Coupled with the Treasury’s announcement that it will be increasing its bond issuance in the coming months, these events propelled US yields higher this week, boosting the dollar through the interest rate channel.
The dollar attracted some safe-haven flows too, as riskier assets such as stocks suffered from the spike in yields. Moving forward, the question is whether this is the beginning of a lasting recovery in the US dollar, or simply a correction within the prevailing downtrend that started last year.
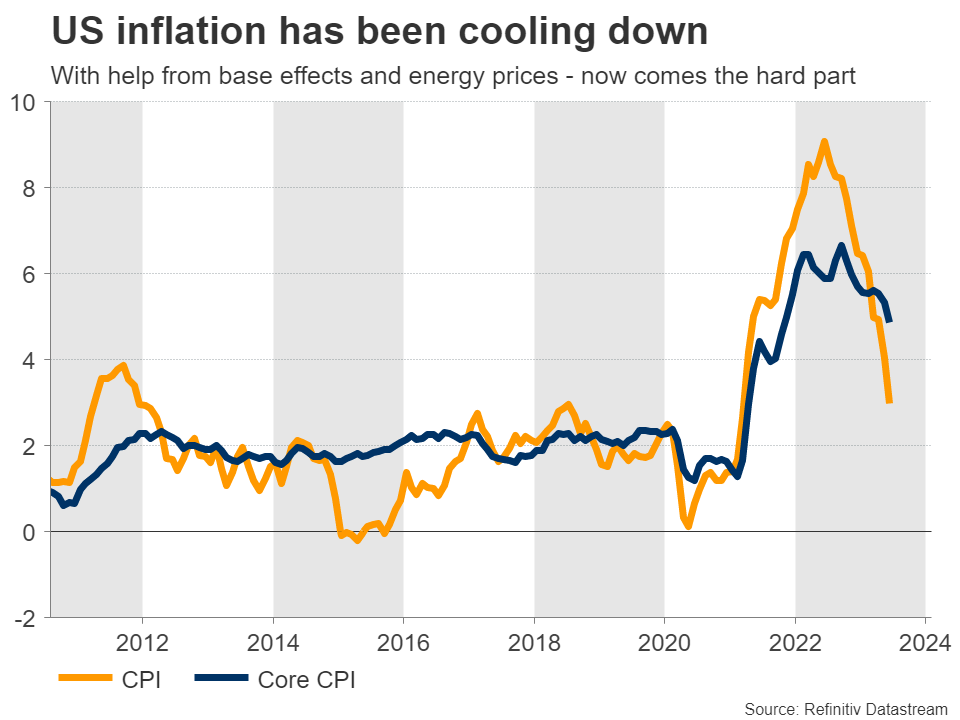
Fortunately, the outlook will become clearer on Thursday with the next round of US inflation data. Forecasts suggest that both the headline and core CPI rates rose by 0.2% in monthly terms in July, which would translate into an increase in the yearly CPI rate but a decline in the core rate. Specifically, the core rate is expected to drop to 4.7%, from 4.8% previously.
Yet, the risks surrounding these forecasts might be tilted to the upside. The Cleveland Fed has a model that attempts to forecast inflation, and it currently points to an increase of 0.4% for both the headline and core CPI rates, in monthly terms. Historically, this model tends to be quite accurate, so there is some scope for a hotter-than-anticipated CPI report.
In the FX arena, this could translate into a stronger US dollar as traders recalibrate the Fed’s interest rate path in a higher-for-longer direction, lifting US yields even higher.
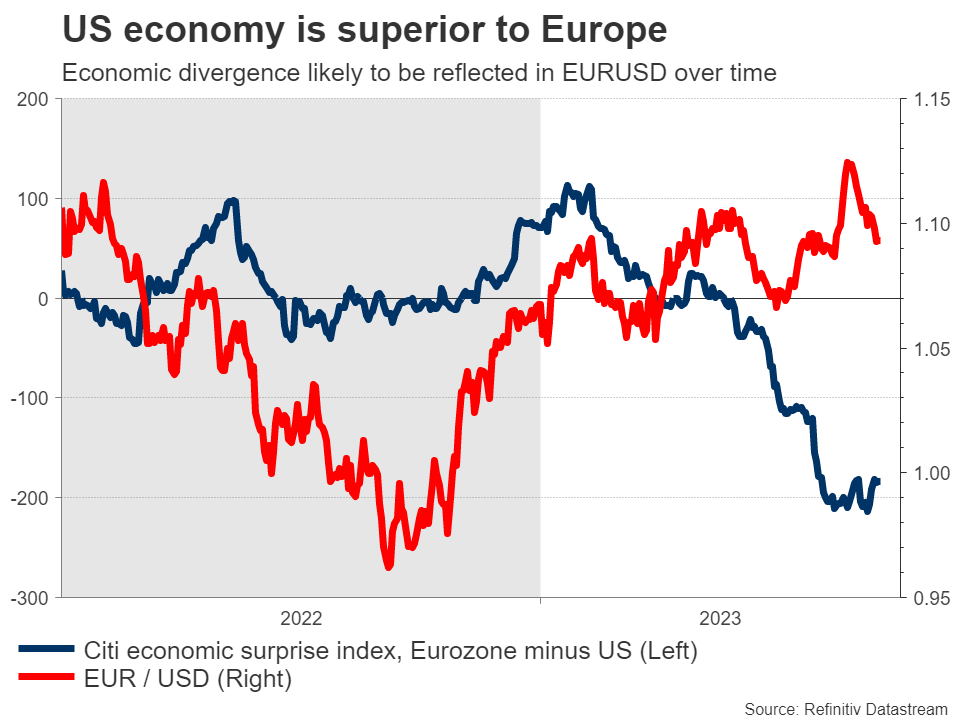
Overall, it is becoming increasingly clear that the American economy remains resilient, with economic growth running around 2%, solid consumption trends, and a labor market that is in good shape. In contrast, business surveys suggest the European economy is slowly descending into a recession, as the downturn in manufacturing has started to infect the services sector.
If this relative US outperformance continues to play out, it is likely to be reflected in the FX market eventually, putting downward pressure on euro/dollar.
British GDP eyed after BoE disappoints
In the United Kingdom, GDP stats for Q2 will hit the markets on Friday. This will be an important piece of the puzzle for the Bank of England, after the central bank raised interest rates in a cautious manner this week, dealing a blow to the British pound.
Still, the pound remains the second-best performing major currency this year, behind the Swiss franc. This powerful rally reflects two elements - expectations that the BoE will push rates higher than other central banks because the UK has a bigger inflation problem, and the cheerful tone in stock markets that tends to benefit the risk-sensitive pound.
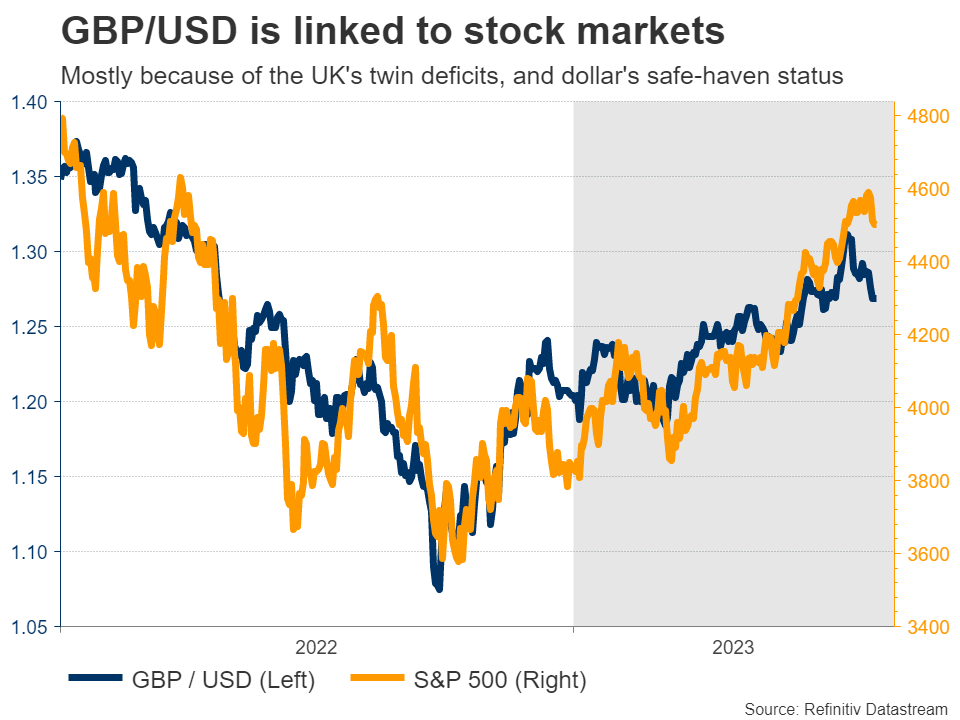
Now the question is whether these elements will remain in force moving forward. Business surveys suggest the British economy is set to “flatline at best in the coming months”, which is not exactly inspiring. Meanwhile, inflationary pressures continue to rage, painting the picture of an economy that is about to experience a period of stagflation.
Similarly, stock markets seem vulnerable to a correction after a stunning rally this year. This rally was not backed by rising earnings, so valuations simply became more expensive. Therefore, if yields keep rising, that could spark a correction in stocks that in turn inflicts collateral damage on risk-linked currencies like sterling.
Japanese and Chinese releases
Crossing into Asia, the ball will get rolling on Monday with the Bank of Japan’s summary of economic opinions for the July meeting, where the central bank raised its effective ceiling on Japanese yields.
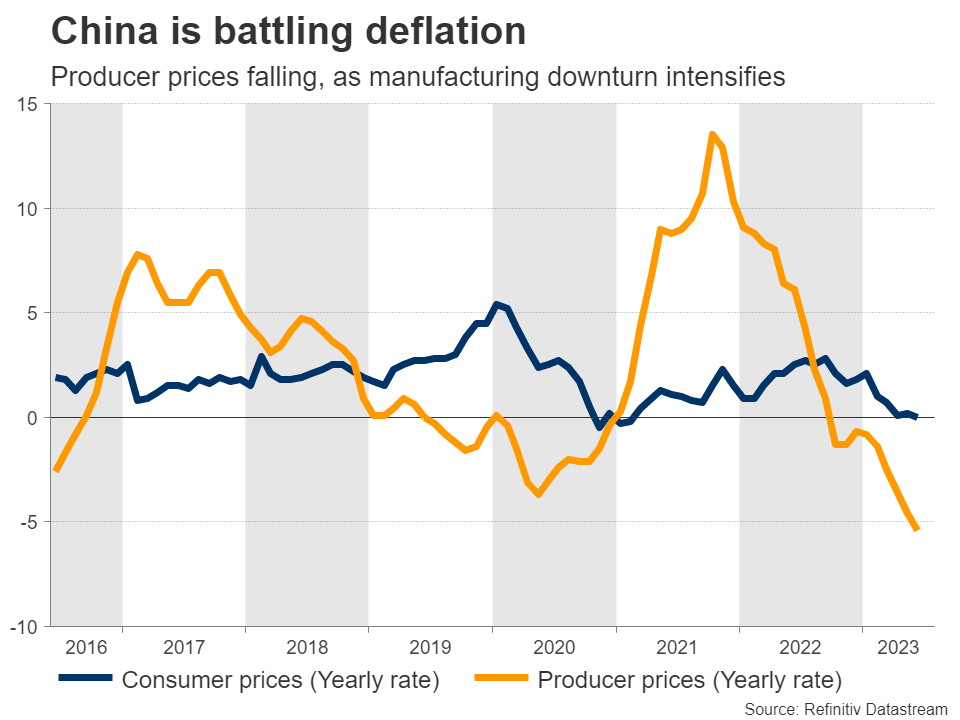
Over in China, the downturn in the manufacturing sector has taken a heavy toll on the economy and the stimulus measures announced by Beijing so far seem insufficient to turn the tide. This puts extra emphasis on the trade and inflation numbers for July, which will be released on Tuesday and Wednesday, respectively.
Another disappointing dataset could amplify concerns about the health of the world’s second-largest economy, and by extension, keep China-sensitive currencies like the Australian dollar under pressure.
Dollar Dips as Labor Market Slowdown Bolsters Case that Fed is Done Raising Rates
- USD/JPY declines on expectations BOJ will let rates rise quickly
- Fed rate cut bets fully priced in by March meeting; implied rate stands at 5.123%
- Fed’s Bostic noted US employment gains are slowing in an orderly manner, no need for tightening
NFP Day
The US economy should continue to gradually weaken as the labor market softens. This labor market report showed 187,000 jobs were added to the economy, while wage pressures heated up, and as the unemployment rate dipped to 3.5%. This NFP report should support the argument that the Fed is done raising rates. Fed speak post payrolls poured cold water over the hot bond market selloff. Fed’s Bostic said that the job gains are slowing orderly and that they have no reason to hike again. Fed’s Goolsbee added that they are getting positive numbers with inflation and that the job market is cooling a little bit. The risks for more Fed tightening are going away, but that could change with next Thursday’s inflation report.
USD/JPY
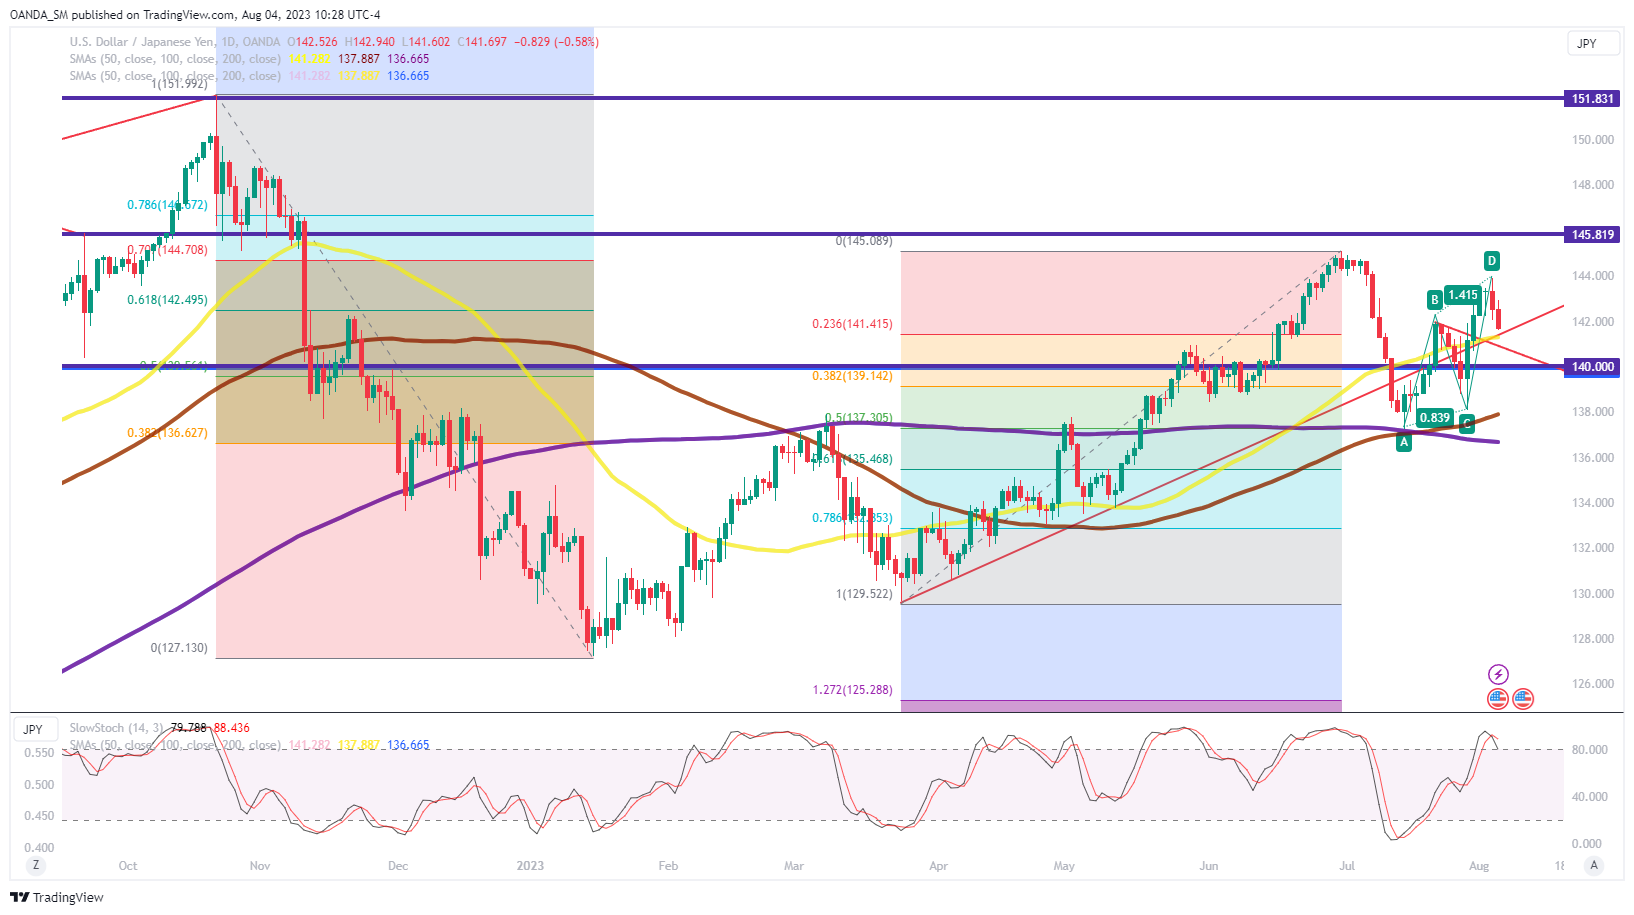
Price action on the USD/JPY daily chart show that the potential bearish ABCD pattern that formed a couple days ago is tentatively respecting trendline support at the 141.50 region. If bearish momentum remains in place downside could target the 140.00 zone. With the BOJ’s minor tweak to YCC in place and steady US data that supports the economy is weakening, the dollar-yen could see bearishness remain intact. To the upside, 144.00 remains key resistance.
Apple disappoints and Amazon Delivers
The last two major tech giant earnings delivered diverging stories. Amazon crushed it in the second quarter, while delivering financial discipline with lower spending. The outlook impressed for both ecommerce and their cloud services, while the lower headcount made this a perfect earnings report.
Apple told a different story than Amazon as their outlook devices weakened, which is prompting concerns that this might be as good as it gets over the short-term for share prices. A weakening consumer and a similar fourth quarter is not inspiring investors.
USD/JPY Turns Back to Bearish Mode from Resistance
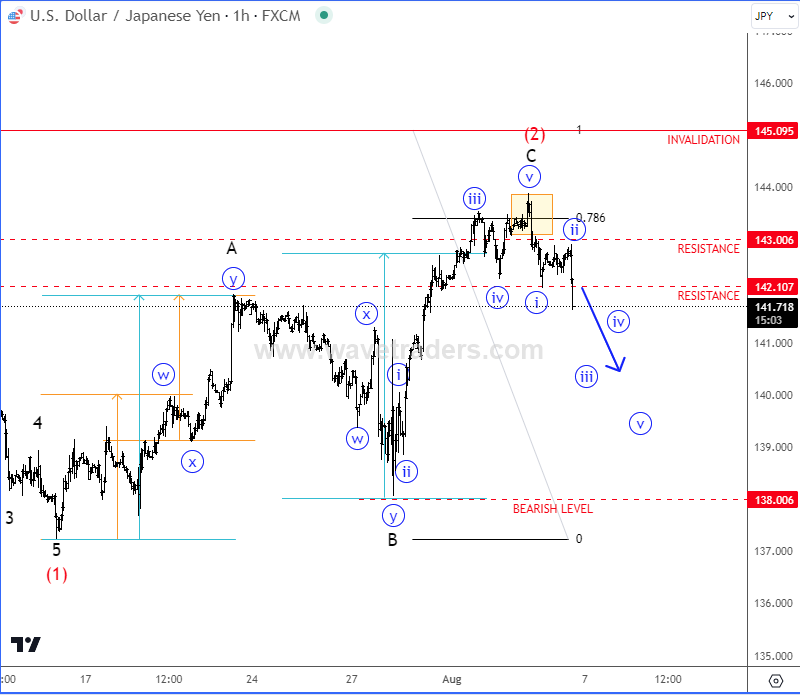
USDJPY turned sharply down from projected resistance as we warned about on July 31.
Well, A-B-C correction can be now completed and we should be aware of a sell-off after the NFP report, ideally within a new five-wave bearish impulse, just be aware of short-term pullbacks. Bearish confirmation level is still far away below 138 region.
Sunset Market Commentary
Markets
It was a stretched countdown to the US payrolls today. They offered mixed signals for the market. The headline figure missed a 200k estimate by coming in at 187k. The previous two months were also revised downwardly by a combined 49k. Sectors adding the most jobs were private education & health (100k), followed from a distance by trade and transport (18k) and finance (19k). Hours worked went down, to 34.3 hours and matching the lowest level since the spring of 2020. The unemployment rate, however, fell to 3.5% thus remaining close to the 3.4% multidecade low. It suggests tightness on the labour market isn’t going anywhere for the time being. This also lead to wage growth picking up again by 0.4 to 4.4% y/y. Both were the same as in June and defied expectations for an easing to 0.3% and 4.2% respectively. The participation rate stood at 62.6%, unchanged vs. June and in line with expectations. Today’s report is actually solid-to-strong in nature but for markets, who have been dumping US Treasuries as if there was no tomorrow all week, the headline count miss and the decline in hours worked served as an opportunity to pick up some bonds again. The looming weekend as well as important data next week (US CPI) is probably also supporting the move. US yields whipsawed but in the end erased all of their previous gains. Current moves vary between -2 (30-y) to -10 (5-y) bps. Bond yields, in particular for longer tenors, are still well up in a weekly perspective though. German yields today simply followed their US counterparts. They ease 2.3-2.7 bps across the curve.
On currency markets, the dollar’s rally went in reverse. We saw some signs of fatigue already yesterday, with the greenback unable to profit from minor risk off and USTs underperforming. Today’s data was a trigger for a profit-taking move. Risk appetite also improved after the report, offering no help to the US currency either. European stocks leave the red behind to trade 0.3% higher, Wall Street opens more than 1% higher (Nasdaq). DXY nears the 102 handle again. EUR/USD tries to recoup the 1.10 barrier ahead of the weekend. The greenback also loses out against the Japanese yen, even as the latter falls against most other G10 peers. USD/JPY slips back below 142. Sterling is still contemplating yesterday’s BoE decision only to conclude that it doesn’t make anyone much wiser. Data dependency is the name of the game at the BoE too. Chief economist Pill in explaining the decision said the MPC is focused on the “greater risk” of inflation persistence. That said, he does note that higher rates are weighing on activity and prices and warned for not doing too much. EUR/GBP ekes out a gain to trade in the 0.863 area. GBP/USD rallies to 1.277. News & Views
The Canadian labour market report disappointed. The economy shed 6.4k jobs in July, undershooting the consensus view for a 25k creation. Part-time jobs were fully responsible for the decline (-8.1k) whereas full-time jobs grew a marginal 1.7k. The unemployment rate as expected ticked up higher, to 5.5% from 5.4% and came with a slight 0.1 ppt drop in the participation rate to 65.6%. Wages shot up though, from 3.9% to 5%. That was well above the 4.1% analyst view. That’s offering some clues that the labour market, although perhaps easing, is still very tight. It also offers the Bank of Canada conflicting signals. This was the last report before they meet on September 6. The BoC hiked in June and July to 5% after a five-month break, acknowledging that they underestimated the persistence of the economy and inflation. Regarding the latter, the July inflation print (August 15) will provide additional input to the meeting. Canadian money markets currently don’t expect the BoC to hike in September, but is not ruling out a move at later meetings. USD/CAD declined after the data though that’s mostly a US dollar move. The pair is still marginally higher for the day, trading around 1.336.
US: Payrolls Continue to Slow on a Trend Basis in July, While Unemployment Rate Ticks Lower
Non-farm payroll employment rose by 187k in July, a hair below expectations calling for a gain of 200k. Revisions to the two prior months were weaker, subtracting 49k from the previously reported figures.
- Hiring over the last three-months averaged 218k jobs per-month, slightly weaker than the 228k reported in June.
Private payrolls rose by 172k – up from the 128k in June. Service-sector gains (+154k) were heavily concentrated in health care (+87k), though wholesale trade (+17.9k) financial services (+19k), leisure & hospitality (+17k) and 'other' services (+20k) also chipped in with modest gains. Goods-producing industries also added jobs on the month, though gains were almost entirely concentrated in construction (+19k). Government added 15k net new jobs.
- The breadth of hiring – as captured by the diffusion index – narrowed to 57.2%, which is only a hair above its cyclical low of 57.0% reached back in March.
In the household survey, civilian employment rose by 268k, while the labor force grew by a more modest 152k, resulting in the unemployment rate ticking 0.1%-pts lower to 3.5%. The participation rate held steady at its cyclical high of 62.6%.
Average hourly earnings rose 0.4% month-on-month (m/m) – matching June's gain – and are up 4.4% on a year-over-year basis and 4.9% (annualized) over the last three months.
Key Implications
Job growth on a trend basis continues to move in the right direction, with the six-month moving average having pushed steadily lower in each of the last nine months. While certainly a good sign, today's pace of hiring is still running well above what's consistent with trend growth in the labor force, let alone anything weaker that would result in any sustained upward pressure on the unemployment rate.
This morning's report didn't offer much in the way of encouraging news on the inflation front, but last week's release of the Q2 reading on the Employment Cost Index – which includes the Fed's preferred wage metric – did show some signs of cooling. According to the ECI, employee compensation slowed to 4.1% (annualized) – down from 4.7% in Q1 and well-off last year's cyclical high of 5.4%. Though this is still firmly above the 3.0%-3.5% consistent with 2% inflation, the fact that compensation is trending lower suggests that the labor market is (gradually) coming back into better balance. This should provide the FOMC the reassurance it needs to move to the sidelines and wait for the full effects of prior tightening to work its way through the economy. One thing is for certain, rate cuts remain a long way out.
Canada’s Labour Market Sheds Jobs in July
The Canadian labour market shed 6.4k positions in July, with full-time employment up 1.7k and part-time employment down 8.1k.
The unemployment rate rose 0.1 percentage points to 5.5% and the participation rate dropped 0.1 percentage point to 65.6%.
Employment fell in construction (-45k), public administration (-17k), and information, culture and recreation (-16k). Gains were seen in health care and social assistance (+25k), educational services (+19k), and finance, insurance, real estate, rental and leasing (+15).
Lastly, total hours worked were up 0.1% month-on-month and wages were up 5.0% year-on-year (vs 4.2% in June).
Key Implications
Canada's labour market continues to loosen. With the population/labour force booming faster than the jobs market can keep up, the unemployment rate has risen to 5.5% from 5.0% in just three months. Over 2023, the number of unemployed people has increased in 6 of 7 months, causing the total number of unemployed to rise by 123k. This loosening follows a +10% drop in the number of job vacancies.
The Bank of Canada isn't likely to change its hawkish tone just yet. While odds of another rate hike dropped following this report, the BoC will need to see more of the same before it can feel like its job is done. Today's report is in line with our expectation for a rising unemployment rate and a further slowing in economic momentum through the rest of this year.
USD/CAD Shrugs After Soft Nonfarm Payrolls
- Canada added a negligible 1700 jobs in July
- US nonfarm payrolls almost unchanged at 187,000
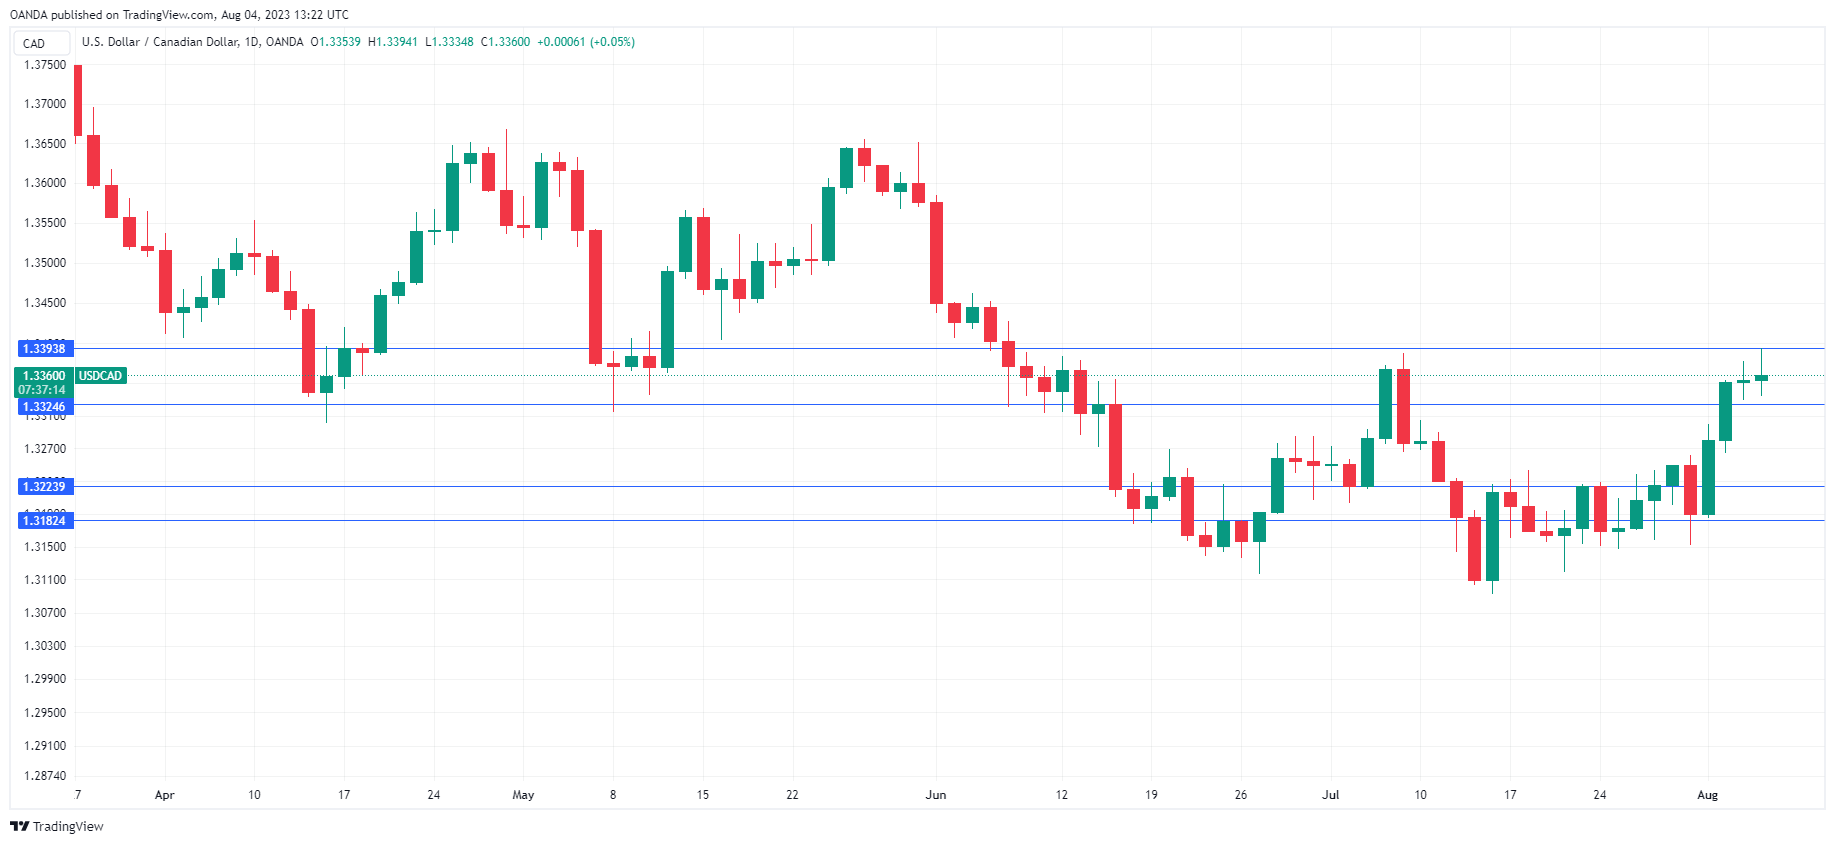
The Canadian dollar is showing limited movement on Friday. In the North American session, USD/CAD is trading at 1.3360, up 0.06%. Canadian and US job numbers were soft today, but the Canadian dollar’s reaction has been muted.
Canada’s economy sheds jobs
After a stellar job report in June, the July numbers were dreadful. Canada’s economy shed 6,400 jobs in July, compared to a 59, 900 gain in June. Full time employment added a negligible 1,700 jobs, following a massive 109,600 in June. The unemployment rate ticked up to 5.5%, up from 5.4%.
Perhaps the most interesting data was wage growth, which jumped 5% y/y in June, climbing from 3.9% in May. The rise is indicative of a tight labour market and will complicate the Bank of Canada’s fight to bring inflation down to the 2% target.
US nonfarm payrolls slips below 200K
It was deja vous all over again, as nonfarm payrolls failed to follow the ADP employment report with a massive gain. In June, a huge ADP reading fuelled speculation that nonfarm payrolls would also surge, and the same happened this week. Both times, nonfarm payrolls headed lower, a reminder that ADP is not a reliable precursor to the nonfarm payrolls report.
July nonfarm payrolls dipped to 187,000, very close to June reading of 185,000 (downwardly revised from 209,000). This marks the lowest level since December 2020. The unemployment rate ticked lower to 3.5%, down from 3.6%. Wage growth stayed steady at 4.4%, above the consensus estimate of 4.2%.
What’s interesting and perhaps frustrating for the Fed, is that the jobs report is sending contradictory signals about the strength of the labour market. Job growth is falling, but the unemployment rate has dropped and wage growth remains strong. With different metrics in the jobs report telling a different story, it will be difficult for the Fed to rely on this employment report as it determines its path for future rate decisions.
USD/CAD Technical
- There is resistance at 1.3324 and 1.3394
- 1.3223 and 1.3182 are providing support
USD/JPY Mid-Day Outlook
Daily Pivots: (S1) 142.56; (P) 143.01; (R1) 143.79; More...
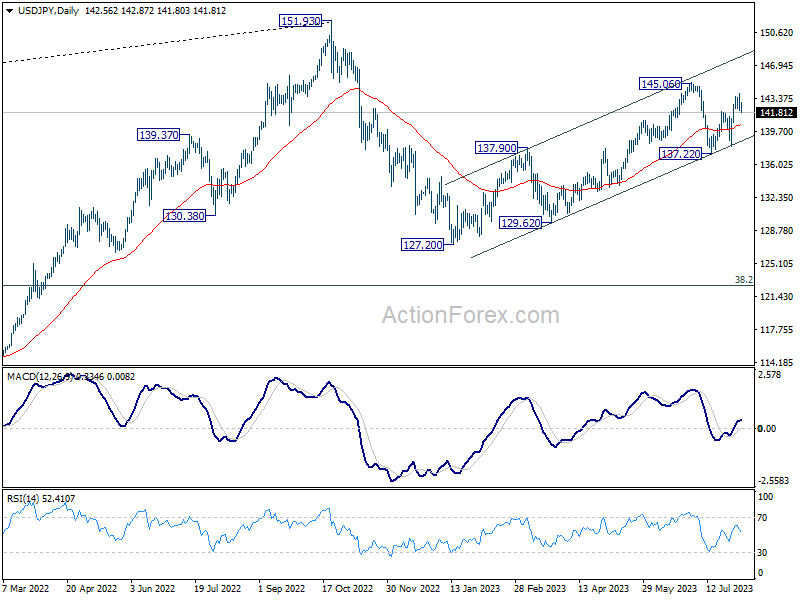
Intraday bias in USD/JPY remains neutral for the moment. On the downside, sustained trading below 55 4H EMA (now at 141.89) will argue that rebound from 137.22 has completed at 143.88. Intraday bias will be back on the downside for 137.22/138.05 support zone, as the third leg of the pattern from 145.06. Nevertheless, strong rebound from current level will bring further rise though 143.88 to retest 145.06 high.
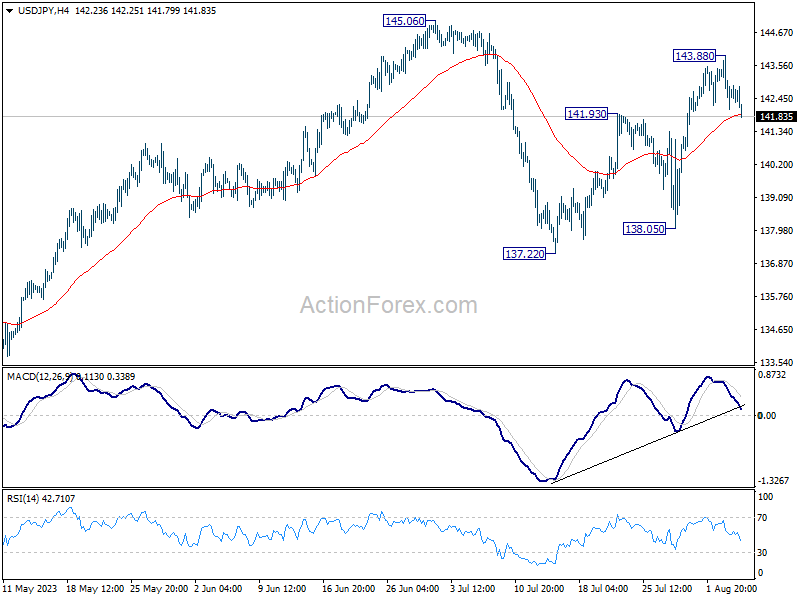
In the bigger picture, overall price actions from 151.93 (2022 high) are views as a corrective pattern. Rise from 127.20 is seen as the second leg of the pattern and could still be in progress. But even in case of extended rise, strong resistance should be seen from 151.93 to limit upside. Meanwhile, break of 137.22 support should confirm the start of the third leg to 127.20 (2023 low) and below.