Sample Category Title
Gold and Crude Oil: Long-Term Outlook
Gold price could restart a steady increase above the $1,990 resistance. Crude oil price is rising and it could climb further higher toward $85.
Important Takeaways for Gold and Oil Prices Analysis Today
- Gold price corrected lower from $2,080 and tested $1,900 against the US Dollar.
- A key bullish trend line is forming with support at $1,940 on the daily chart of gold at FXOpen.
- Crude oil prices are moving higher above the $76.75 resistance zone.
- There was a break above a key contracting triangle with resistance near $71.00 on the daily chart of XTI/USD at FXOpen.
Gold Price Technical Analysis
On the daily chart of Gold at FXOpen, the price started a downside correction from the $2,080 zone. The price traded below the $2,050 and $1,990 levels.
Finally, the bulls appeared near the $1,900 level. A low was formed near $1,900 and the price is now attempting a fresh increase. There was a move above the 23.6% Fib retracement level of the downward move from the $2,080 swing high to the $1,900 low.
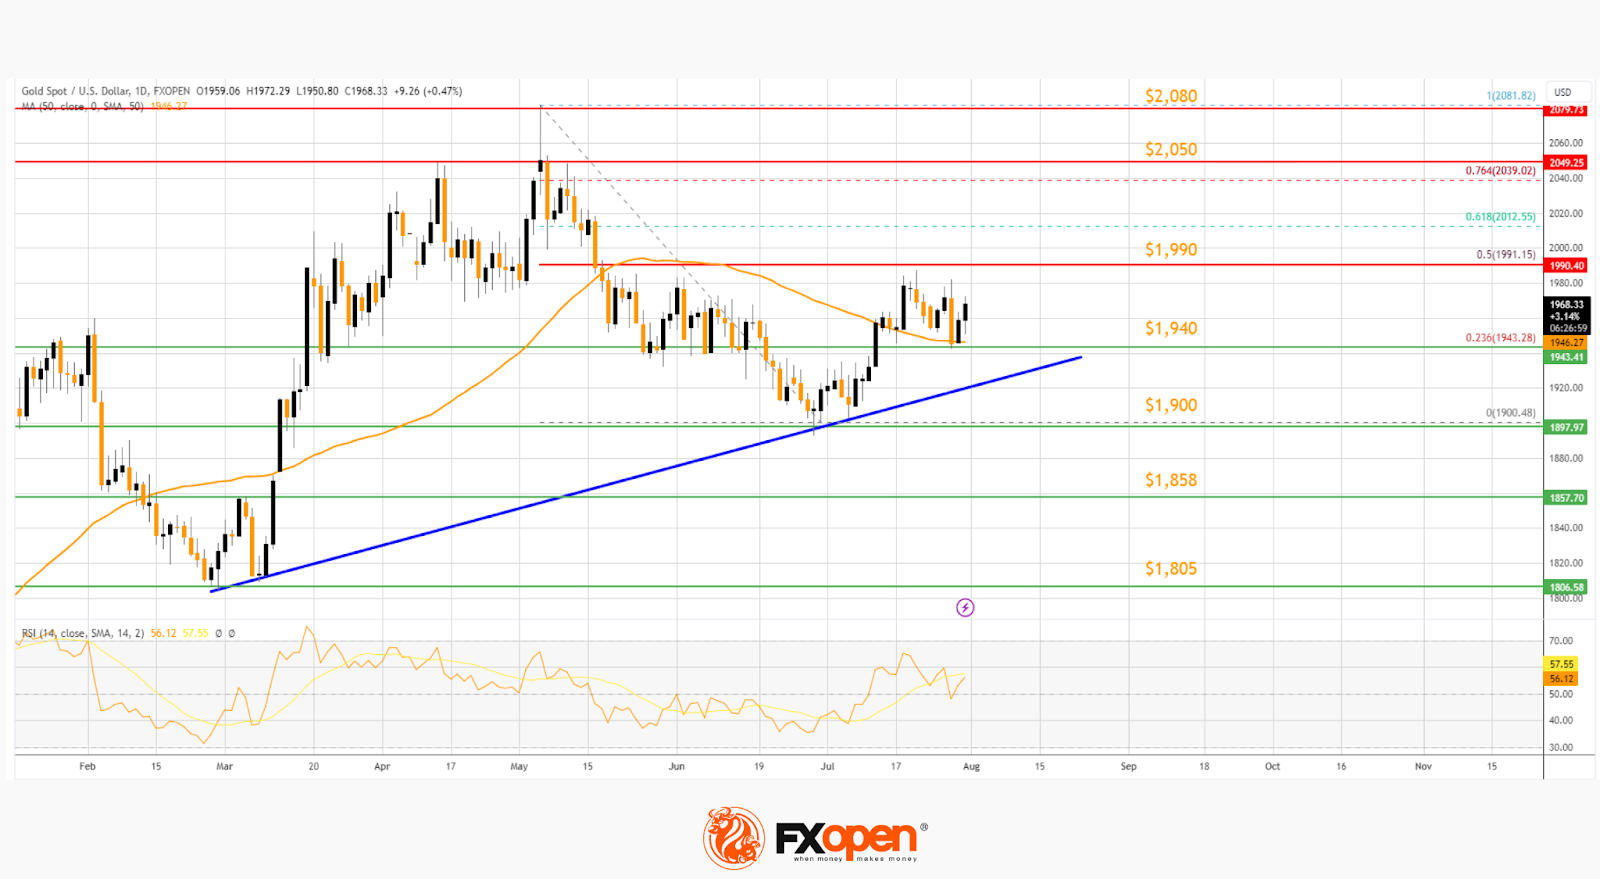
The price is now trading above the 50-day simple moving average. There is also a key bullish trend line forming with support at $1,940.
Immediate resistance is near the 50% Fib retracement level of the downward move from the $2,080 swing high to the $1,900 low at $1,990. The next major resistance is near $2,000. An upside break above $2,000 could send Gold price toward $2,050. Any more gains may perhaps set the pace for an increase toward the $2,080 level.
Initial support on the downside is near the $1,940 level. The first major support is near $1,900. If there is a downside break below $1,900, the price might decline further. In the stated case, XAU/USD might drop toward $1,805.
Oil Price Technical Analysis
On the daily chart of WTI Crude Oil at FXOpen, the price started a decent increase against the US Dollar. The price gained bullish momentum after it broke the $71.00 resistance.
Besides, there was a break above a key contracting triangle with resistance near $71.00. The price climbed above the $75.00 pivot level as mentioned in the previous analysis. Finally, the bulls pushed the price above the 61.8% Fib retracement level of the downward move from the $84.53 swing high to the $63.90 low.
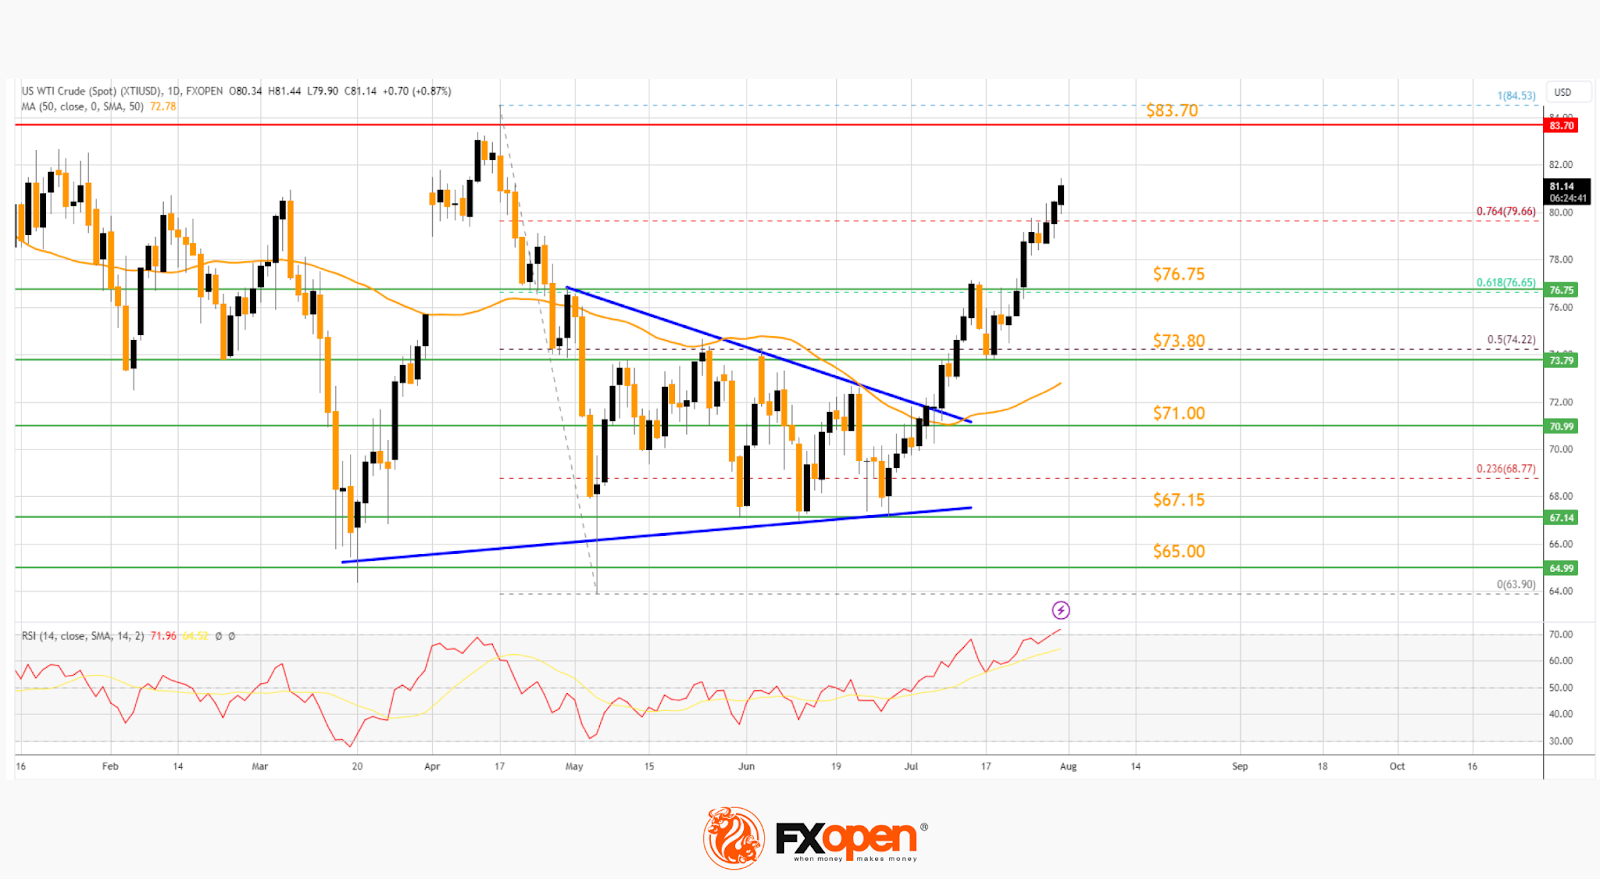
The price is now trading above the 50-day simple moving average, and the 76.4% Fib retracement level of the downward move from the $84.53 swing high to the $63.90 low.
It seems like the bulls are aiming for a test of $83.70. If the price climbs further higher, it could face resistance near $85.00. Any more gains might send the price toward the $88.00 level.
Conversely, the price might correct gains and test the $76.75 support. The first major support is near the 50-hour simple moving average or $73.80. The next major support on the WTI crude oil chart is near $71.00.
If there is a downside break, the price might decline toward $67.15. Any more losses may perhaps open the doors for a move toward the $65.00 support zone.
Start trading commodities with tight spreads. Open your trading account now or learn more about trading commodity CFDs with FXOpen.
This article represents the opinion of the Companies operating under the FXOpen brand only. It is not to be construed as an offer, solicitation, or recommendation with respect to products and services provided by the Companies operating under the FXOpen brand, nor is it to be considered financial advice.
USDCAD Rebounds Strongly, Crucial Trendline in Sight
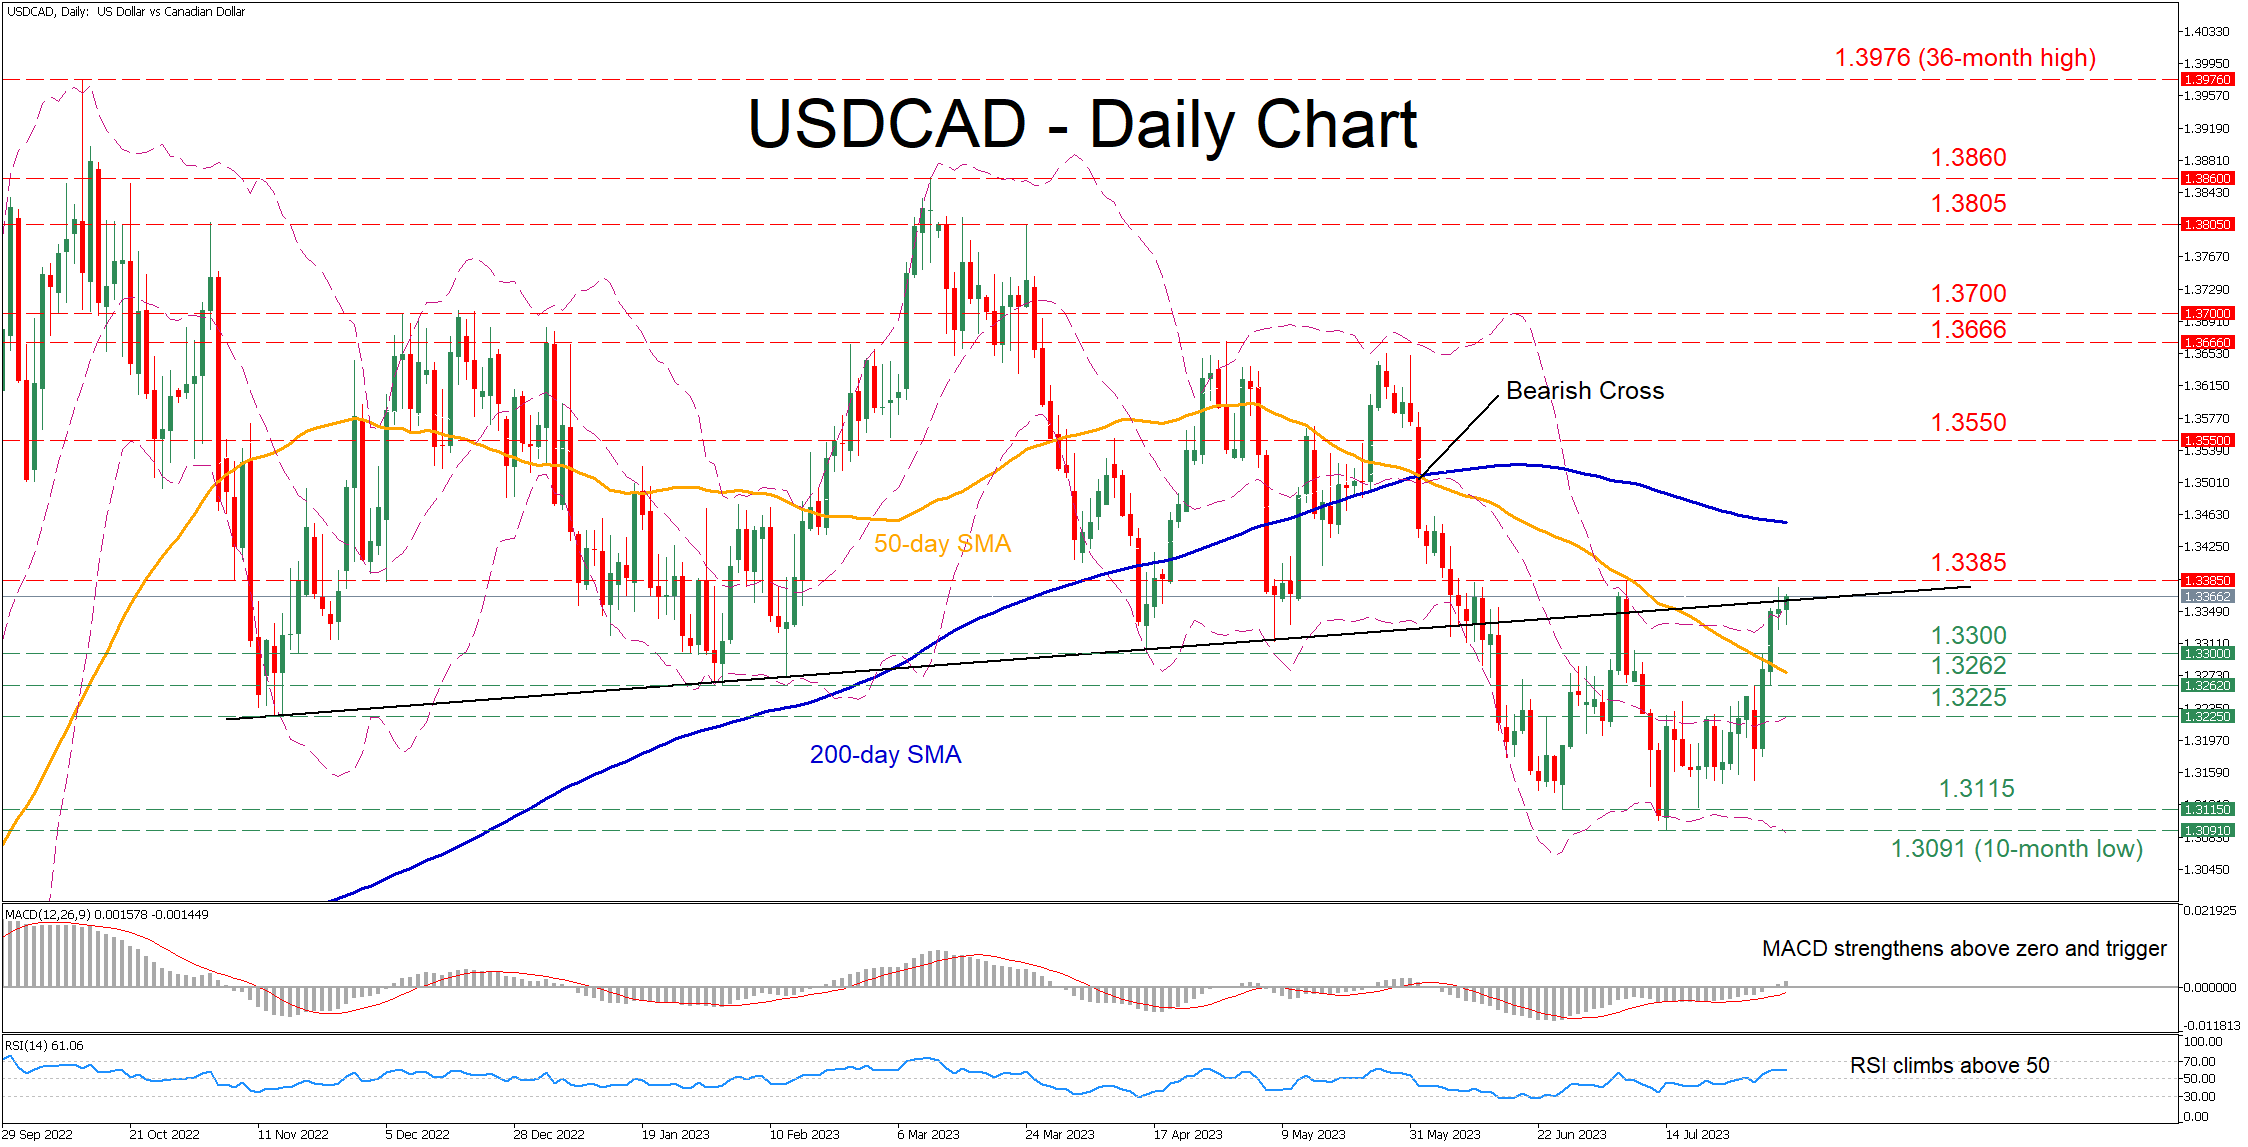
USDCAD had been in a steady downtrend since early March, generating a clear structure of lower lows. However, the pair found its feet at the 10-month bottom of 1.3091 and attempted to recoup some losses, with the price testing the ascending trendline that connects the pair's higher lows from November 2022 until early May.
The momentum indicators are endorsing this latest rebound. Specifically, the MACD is strengthening above zero and its red signal line at its highest level since June 1, while the RSI jumped above its 50-neutral threshold.
Should the price extend its advance above the upward sloping trendline, initial resistance could be found at the July peak of 1.3385. Piercing through that wall, the pair could face 1.3550 before the April peak of 1.3666 appears on the radar. If the latter fails, the spotlight could turn to the 1.3700 psychological mark, which held strong in December 2022.
Alternatively, should the recent rebound fizzle out, the price may retrace lower to test the April bottom of 1.3330 before a series of lows that constitute the ascending trendline come under examination. Thus, a drop below that region could trigger a decline towards the February low of 1.3262 ahead of the August 2022 bottom of 1.3225. Even lower, the 1.3115 hurdle could provide downside protection.
In brief, USDCAD has been staging a mild recovery after its steep decline came to a halt at a fresh 2023 low. For that rebound to continue, the price needs to decisively cross above the ascending trendline.
Nasdaq 100 Technical: Short-term Bearish Tone May Still Linger On
- Ex-post Apple and Amazon earnings results reinforced the current +1.4% rebound seen on Index from its 3 August 2023 low in today’s 4 August Asian session hours.
- The ongoing rebound is still not showing any clear signs of a reversal from its current short-term downtrend phase in place since 29 July 2023 as price actions remained below the 20-day moving average.
- Medium-term momentum has turned bearish as indicated by the bearish divergence condition seen in the daily RSI at its overbought region which may see a further extension of the current short-term downtrend phase.
- Key short-term resistance to watch will be at 15,600.
The price actions of the US Nas 100 Index (a proxy for the Nasdaq 100 futures) have shaped a decline of -3.6% from its 29 July 2023 high of 15,818 to print a recent intraday low of 15,255 on 3 August reinforced by a significant surge in longer-term US Treasury yields triggered by the aftermath of Fitch’s US sovereign debt credit rating downgrade to AA+ from AAA.
In today, 4 August early Asian session; the two US mega-cap technology firms; Apple and Amazon reported their respective earnings results for the quarter that ended June 2023. Ex-post earnings results release saw the share price of Apple tumble by -2% in the after-hours trading session due third consecutive quarter year-on-year revenue decline hampered by lacklustre demand for iPhones, Mac laptops, and iPads.
In contrast, the share price of Amazon soared by +8.7% in after-hours trading reinforced by its biggest earnings beat since Q4 2020 assisted by significant cost-cutting measures implemented in the prior two quarters.
The overall net effect is a rebound of +1.4% seen on the US Nas 100 Index from its 3 August 2023 low of 15,255 to today’s 4 August Asian session intraday high of 15,441 at this time of the writing.
Medium-term momentum has turned bearish
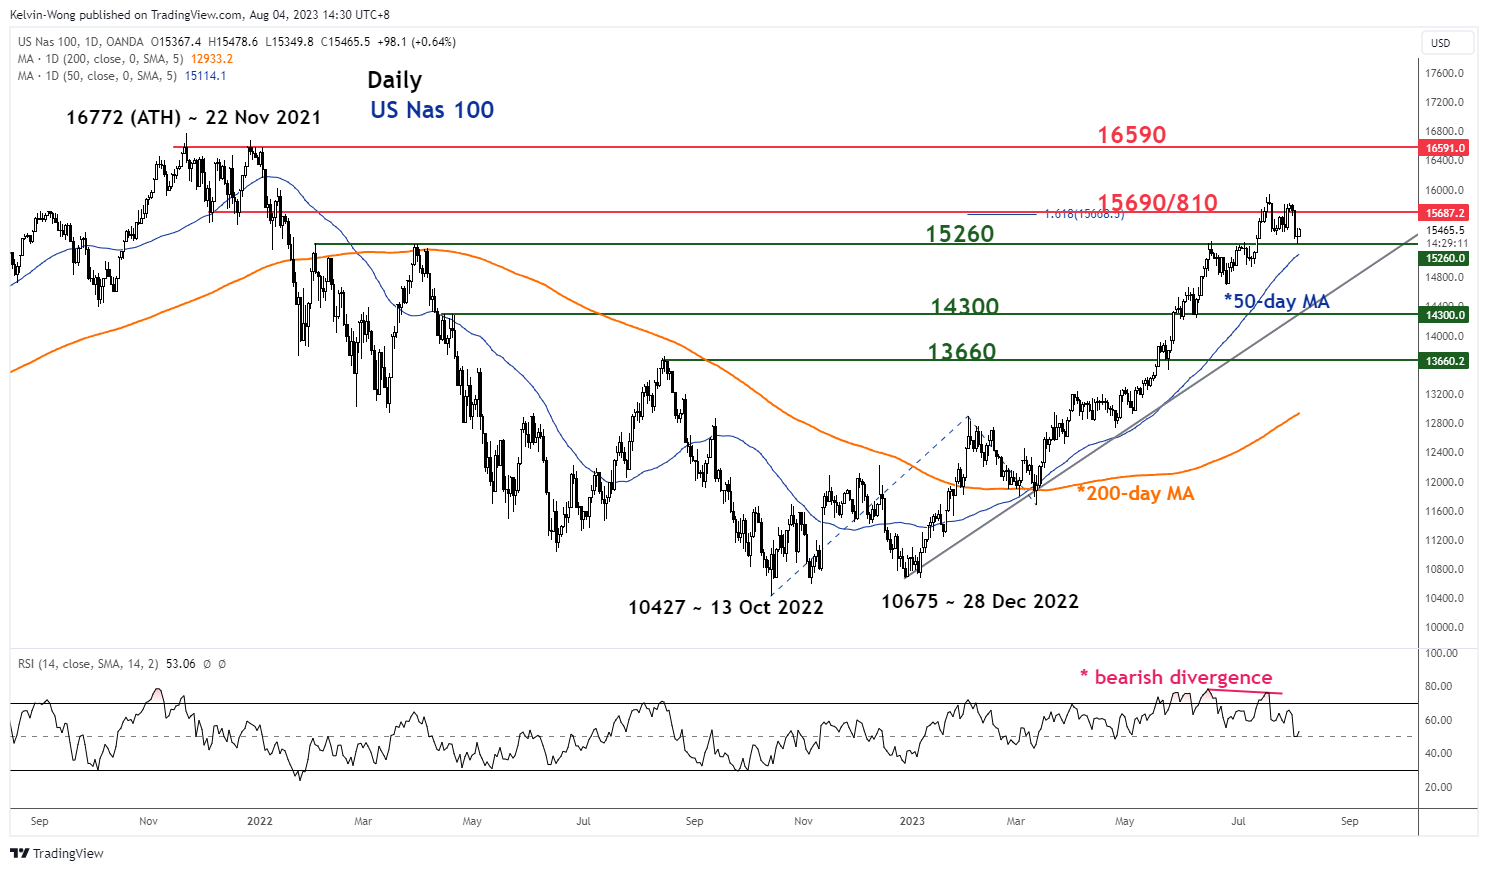
Fig 1: Nasdaq 100 medium-term trend as of 4 Aug 2023 (Source: TradingView, click to enlarge chart)
The daily RSI oscillator has flashed a bearish divergence condition (lower highs in RSI in contrast with higher highs in the corresponding price actions of the Index) at its overbought region which suggests that the medium-term uptrend phase of the Index in place since 28 December 2023 low of 10,675 may have reached a terminal point at the 15,690/15,810 key medium-term resistance.
The odds now have increased for a potential multi-week corrective decline to retrace a portion of the medium-term uptrend in the first step if 15,260 near-term support fails to hold (also the 50-day moving average).
Still below the 20-day moving average
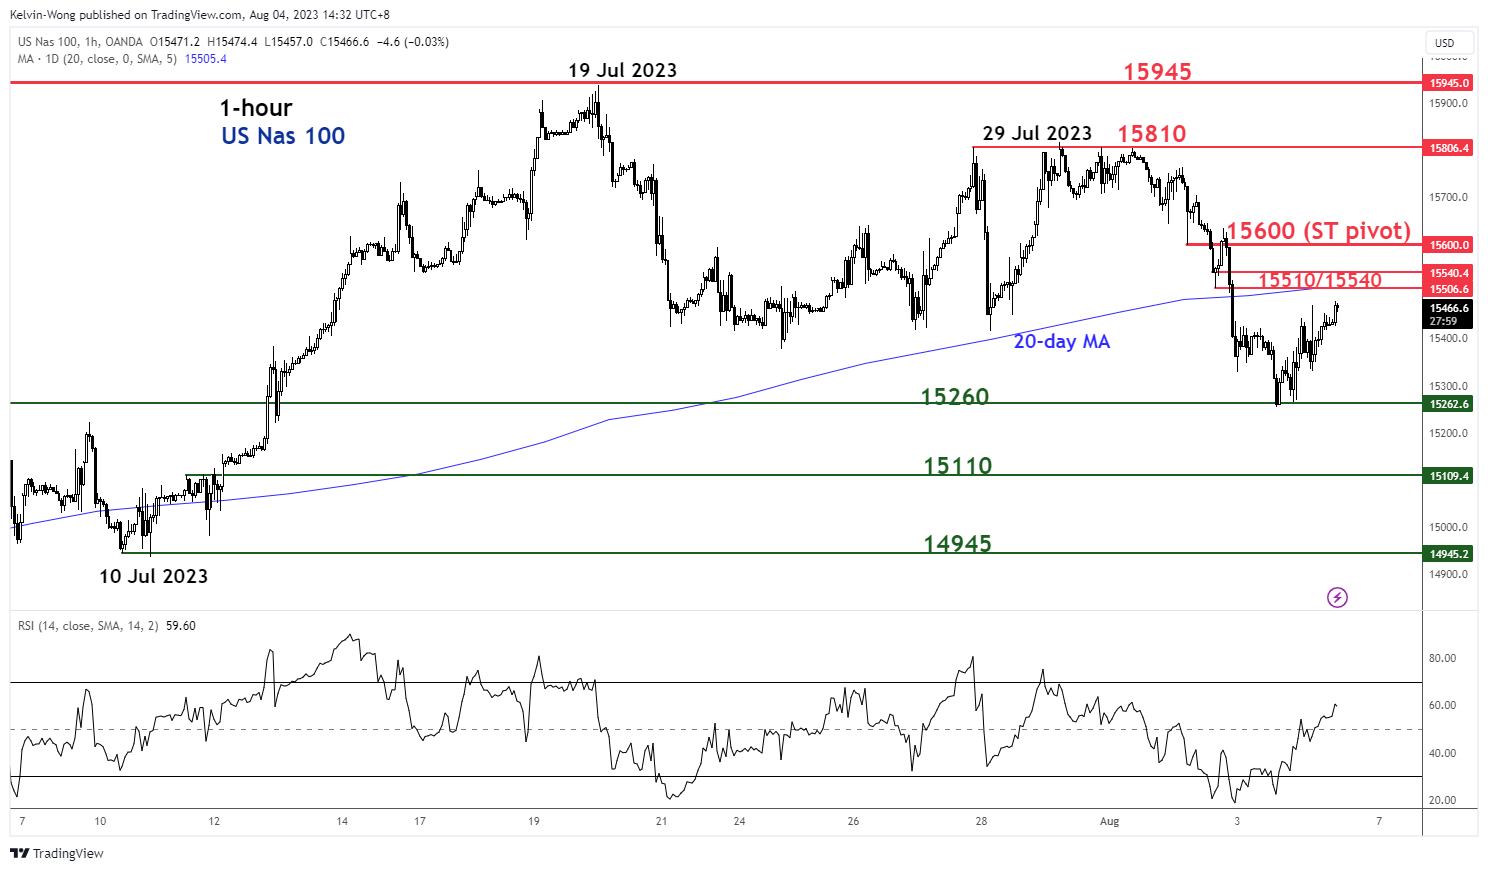
Fig 2: Nasdaq 100 minor short-term trend as of 4 Aug 2023 (Source: TradingView, click to enlarge chart)
The ongoing rebound from its 3 August 2023 low of 15,255 has not surpassed its 20-day moving average which is acting as an intermediate resistance at 15,510/15,540.
Watch the 15,600 key short-term pivotal resistance (also the 61.8% Fibonacci retracement of the decline from the 29 July 2023 high to the 3 August 2023 low) to maintain the short-term downtrend to retest 15,260 and a break below it exposes the next support at 15,110 in the first step.
On the flip side, a clearance above 15,600 invalidates the short-term bearish tone for a retest on the 15,810 key medium-term resistance.
Crypto Awaiting a Signal to Choose Its Direction
Market picture
The crypto market capitalisation has seen little change over the past 24 hours, stabilising around $1.165 trillion. The Fear and Greed Index is also little changed at 54 since the middle of last week. The market has been waiting for new signals, equally ready to return to growth or continue to fall.
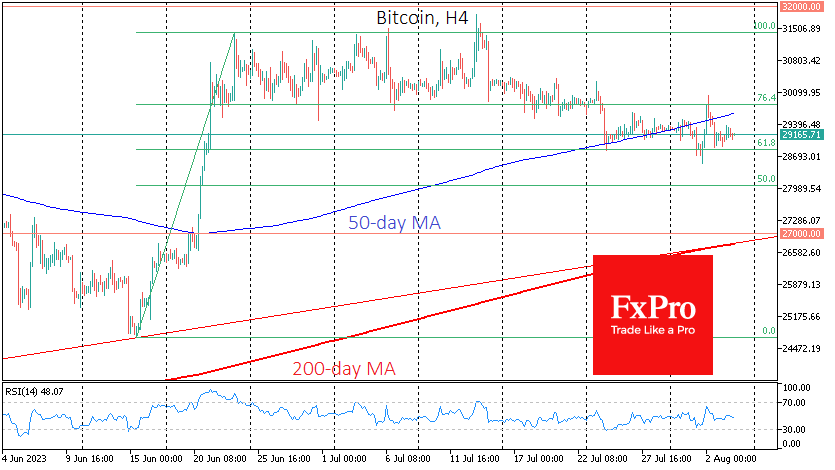
The most fluctuation in Bitcoin over the last week and a half has been around $29.2K. And this is interesting because during this time, the dollar has gone into a growth mode, and there has been significant profit-taking in the equity market. It’s unlikely that investors’ caution in Bitcoin is due to expectations of the US jobs report.
A drop below $28.8K could quickly take the market to $28K or even $27K. A rise above $29.5K would open a quick path to $30K and on to $31K.
News background
Most investors prefer to buy Bitcoin while trading below $30K, Glassnode noted. The number of addresses with a balance of at least 0.01 BTC has reached an all-time high of more than 12.22 million, while the number of wallets in deficit is 14.04 million, the highest since late June.
MicroStrategy bought 12,333 bitcoins worth $347 million in the second quarter of this year, the largest quarterly purchase since 2021.
Former CFTC lawyer Mike Selig suggested that if spot bitcoin ETFs are allowed to launch in the US, ETFs linked to Ethereum and XRP are next in line.
Hong Kong issues its first cryptocurrency retail trading licence. HashKey crypto exchange has been authorised to provide services to local retail investors.
The Australian Securities and Investments Commission (ASIC) sued the eToro platform over its line of CFDs that allow speculation on cryptocurrencies.
GBP/JPY Daily Outlook
Daily Pivots: (S1) 180.15; (P) 181.45; (R1) 182.44; More...
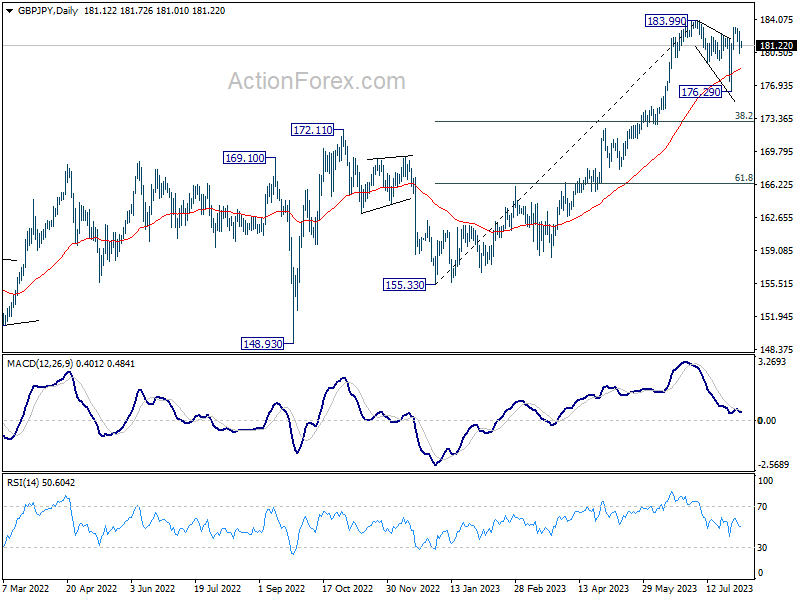
Intraday bias in GBP/JPY stays neutral first. Firm break of 180.85 will extend the corrective pattern from 183.99 with another falling leg. Intraday bias will be turned to the downside for 176.22 support. On the upside, decisive break of 183.99 will resume larger up trend.
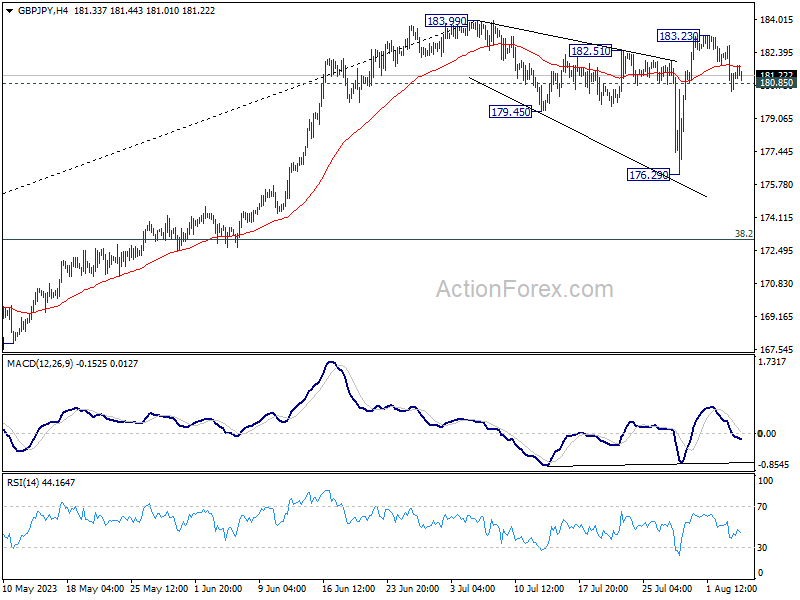
In the bigger picture, as long as 172.11 resistance turned support holds, up trend from 123.94 (2020 low) is expected to continue through 183.99 at a later stage, towards 195.86 (2015 high). Nevertheless, firm break of 172.11 will argue that larger correction is already underway.
EUR/JPY Daily Outlook
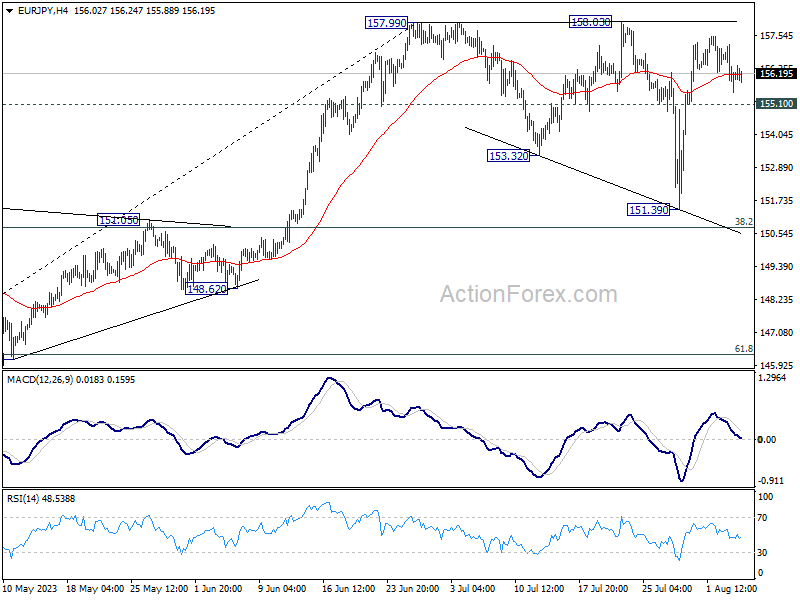
Daily Pivots: (S1) 155.31; (P) 156.28; (R1) 157.02; More....
Outlook in EUR/JPY is unchanged and intraday bias remains neutral. On the upside, decisive break of 157.99/158.03 will resume larger up trend to 162.82 projection level next. However, break of 155.10 will extend the corrective pattern from 157.99 with another falling leg instead.
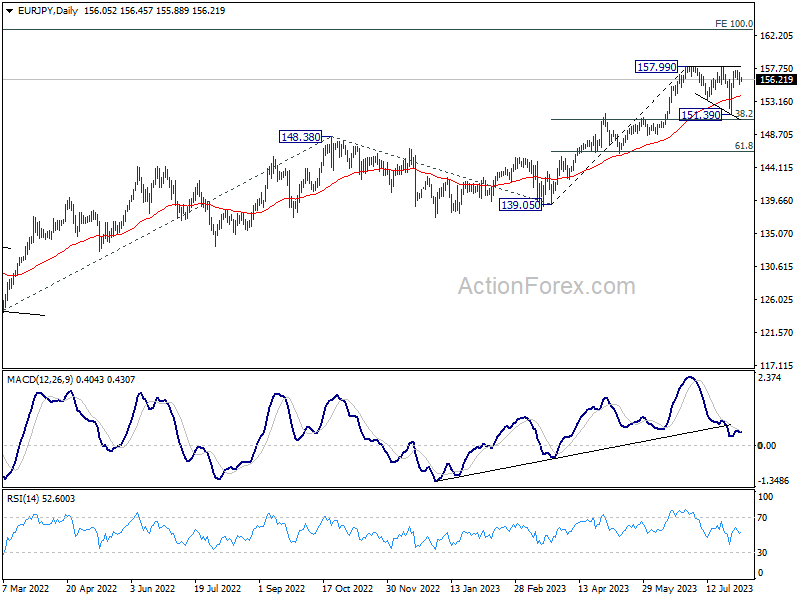
In the bigger picture, as long as 151.60 resistance turned support holds, rise from 114.42 (2020 low) is in progress. On resumption, next target is 100% projection of 124.37 to 148.38 from 138.81 at 162.82. Nevertheless, sustained break of 151.60 will argue that larger correction is already underway. Deeper decline would be seen to 55 W EMA (now at 145.56).
EUR/GBP Daily Outlook
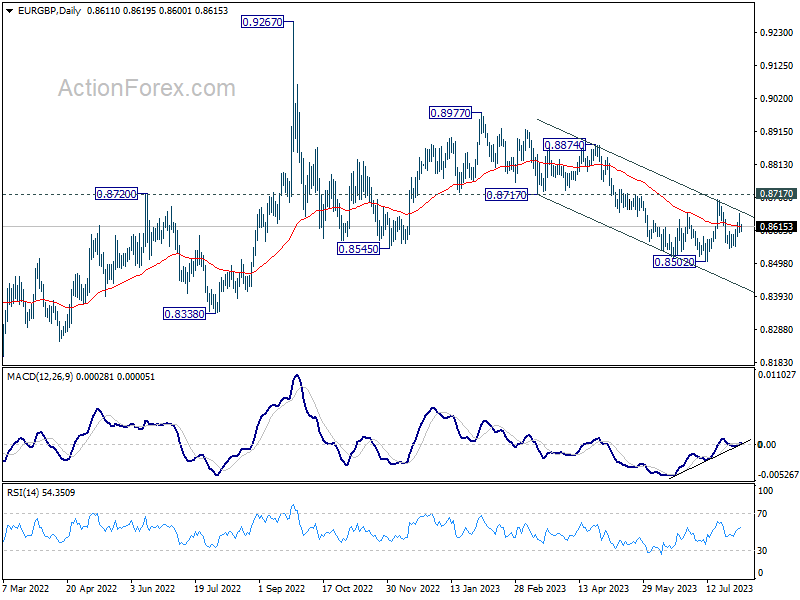
Daily Pivots: (S1) 0.8590; (P) 0.8623; (R1) 0.8648; More...
While recovery from 0.8543 continues to gyrate high, upside momentum remains unconvincing. Intraday bias stays neutral first. On the downside, below 0.8543 will target a test on 0.8502 low. Decisive break there will resume larger decline from 0.8977. On the upside firm break of 0.8717 resistance will suggest larger reversal and target 0.8874 resistance next.
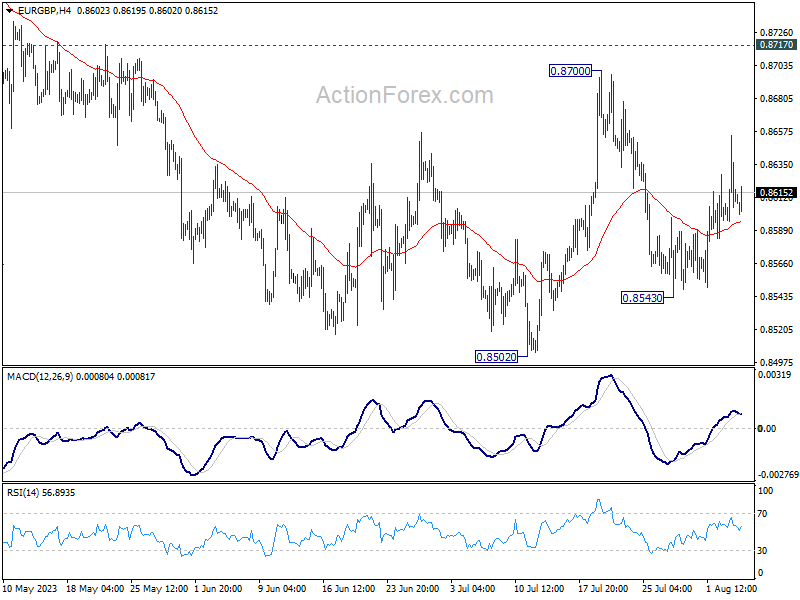
In the bigger picture, the down trend from 0.9267 (2022 high) is seen as part of the long term range pattern from 0.9499 (2020 high). Firm break of 0.8717 support turned resistance will argue that it has completed with three waves down to 0.8502. Further break of 0.8977 will bring retest of 0.9267 high. Nevertheless, rejection by 0.8717, followed by break of 0.8502 will resume the decline towards 0.8201 (2022 low).
EUR/AUD Daily Outlook
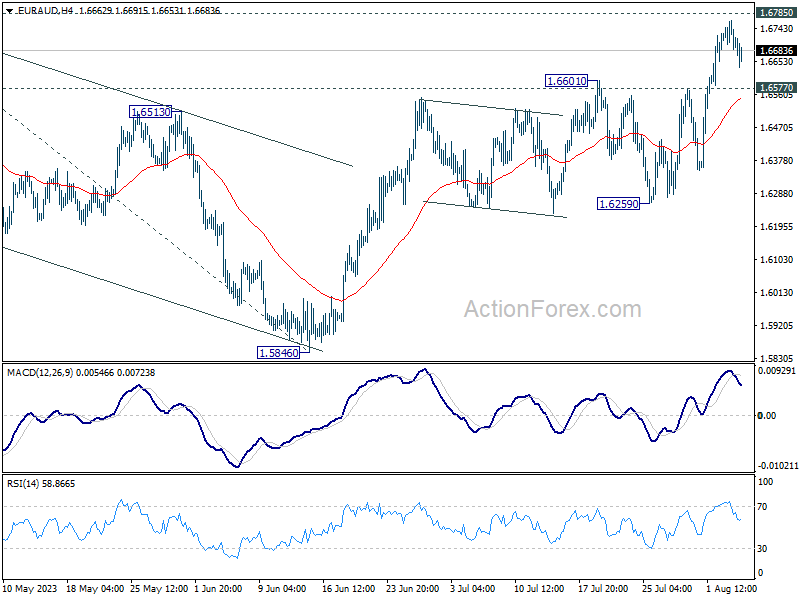
Daily Pivots: (S1) 1.6680; (P) 1.6723; (R1) 1.6760; More...
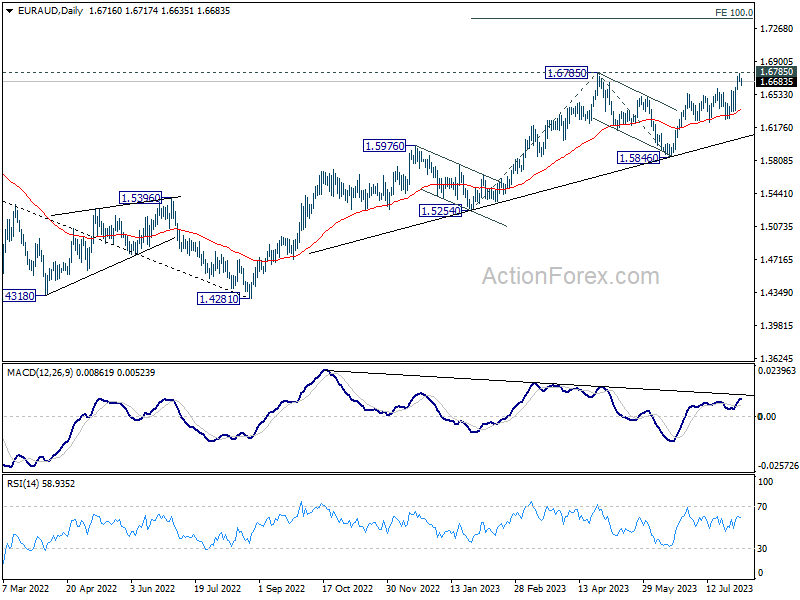
Intraday bias in EUR/AUD is turned neutral again as it retreat ahead of 1.6785 high. On the upside, decisive break of 1.6785 will resume larger up trend to 1.7377 projection level next. On the downside, break of 1.6577 resistance turned support will turn bias back to the downside for 1.6259 support, to extend the corrective pattern from 1.6785.
In the bigger picture, with 38.2% retracement of 1.4281 to 1.6785 at 1.5828 intact, rally from 1.4281 is still in progress. Firm break of 1.6785 will confirm rise resumption. Next target is 100% projection of 1.5254 to 1.6785 from 1.5846 at 1.7377. On the other hand, rejection by 1.6785 will extend the corrective pattern with another fall leg. But outlook will stay bullish as long as 1.5828 holds.
EUR/CHF Daily Outlook
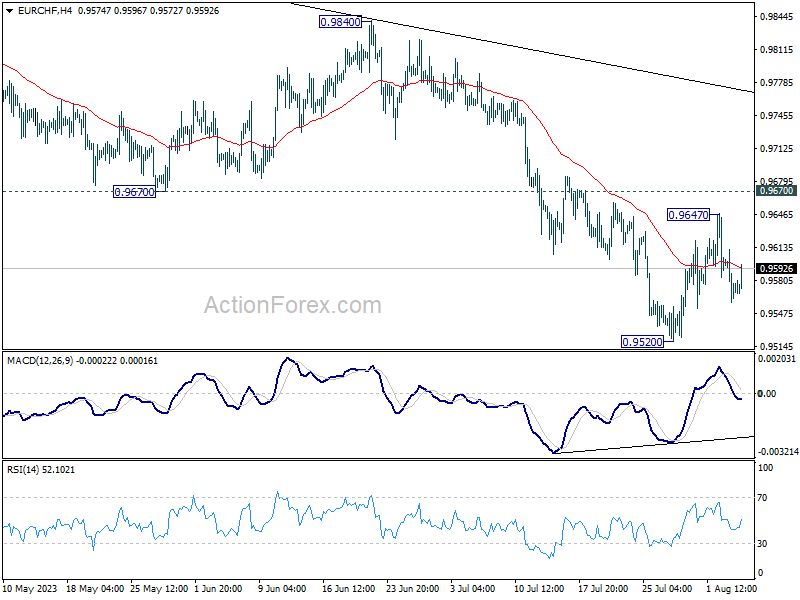
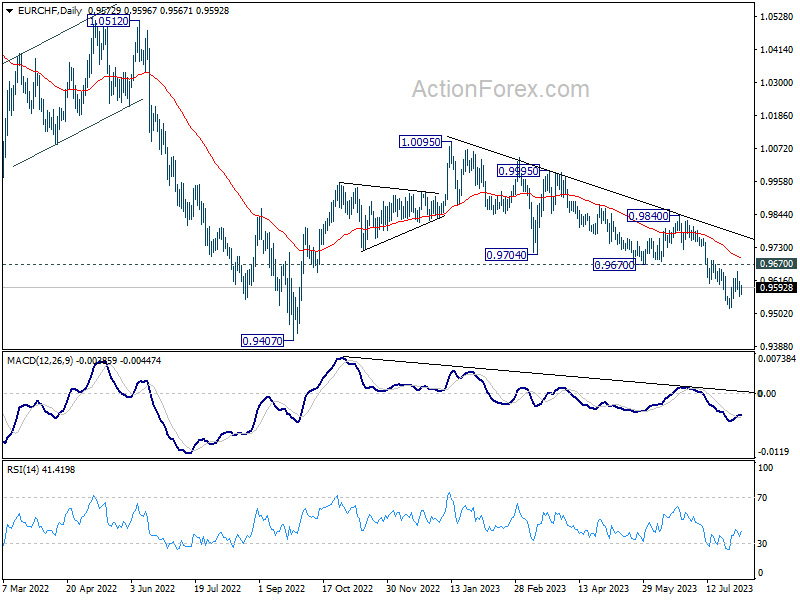
Daily Pivots: (S1) 0.9550; (P) 0.9582; (R1) 0.9602; More...
Intraday bias in EUR/CHF remains neutral and outlook stays bearish with 0.9670 support turned resistance intact. On the downside, break of 0.9520 will resume the fall from 1.0095 towards 0.9407 low. Nevertheless, sustained break of 0.9670 will be the first sign of bullish reversal and target 0.9840 resistance for confirmation.
In the bigger picture, medium term outlook is staying bearish as the pair is capped well below falling 55 W EMA (now at 0.9876). Down trend from 1.2004 (2018 high) is in favor to continue. Sustained break of 0.9407 will target 61.8% projection of 1.1149 to 0.9407 from 1.0095 at 0.9018. For now, this will remain the favored case as long as 0.9840 resistance holds, in case of strong rebound.
USD/CAD Daily Outlook
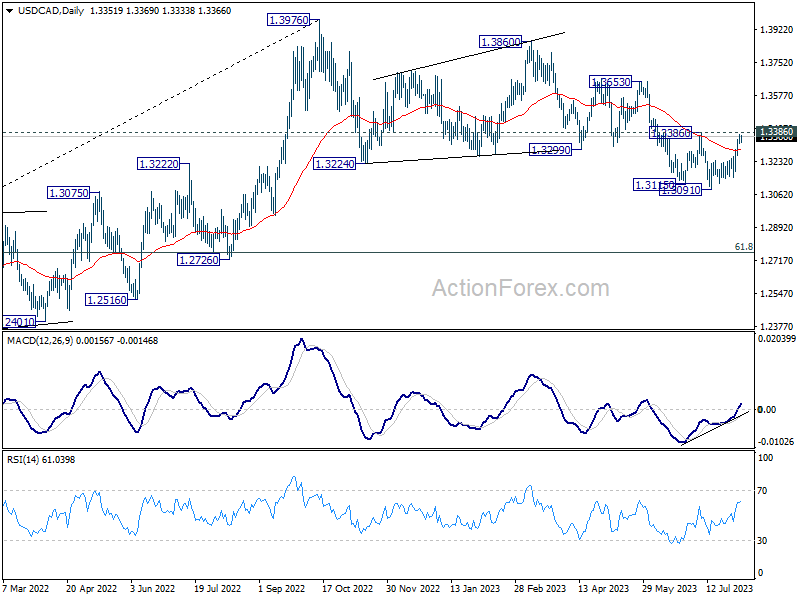
Daily Pivots: (S1) 1.3329; (P) 1.3353; (R1) 1.3378; More....
Intraday bias in USD/CAD remains neutral for the moment. Also, as long as 1.3386 resistance holds, further decline is mildly in favor. Below 1.3260 minor support should resume larger decline through 1.3091 low. Nevertheless, on the upside, firm break of 1.3386 will indicate near term reversal and turn outlook bullish for 1.3653 resistance next.
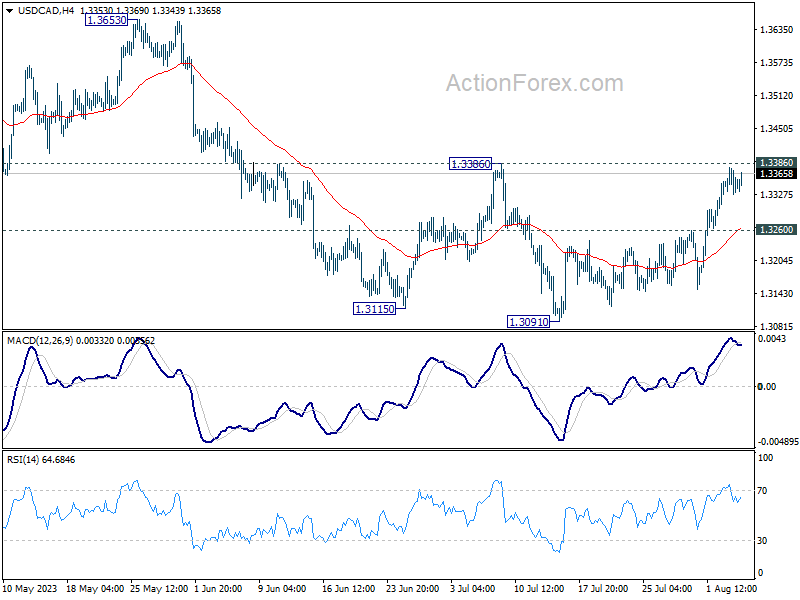
In the bigger picture, price actions from 1.3976 are viewed as a correction to up trend from 1.2005 (2021 low) only. But even so, deeper decline is expected as long as 1.3386 resistance holds. Further fall could be seen to 61.8% retracement of 1.2005 to 1.3976 at 1.2758. Meanwhile, break of 1.3386 will be a sign that the correction has completed and bring stronger rally back to retest 1.3976.