Sample Category Title
NFP: Where’s the balance between job growth and wage inflation?
The imminent NFP report poses a potential quandary for both Fed and market participants. On one hand, steady job growth aligns with Fed's intention to engineer a soft landing for the US economy. On the other, elevated wages growth due to tight labor market could compel Fed to maintain its tightening course, potentially complicating the soft landing strategy.
Expectations are set for a 200k job increase in July, while unemployment rate is predicted to hold steady at 3.6%. Average hourly earnings are projected to climb 0.3% month-on-month.
Based on recent developments, economists are gradually warming to the idea that Fed might achieve its "soft-landing" scenario for the economy. Consistent job growth around the 200,000 region per month would provide further support for this possibility.
However, uncertainties loom regarding wage growth. With an expected 0.3% mom growth, the annual rate could comfortably remain above 4% yoy - a figure significantly higher than the levels consistent with Fed's 2% inflation target. A strong report will certainly spark debates in the market about whether Fed will need to tighten its monetary policy further toward a peak of 6%, up from the current 5.25-5.50%.
Relevant employment data presents a mixed bag. ISM Services Employment index was at 50.7 in July, down -2.4 points from 53.1 in June. Meanwhile, ISM Manufacturing Employment was lower at 44.4, marking a decline of -3.7 points from 48.1 in June. In contrast, ADP reported private payrolls at 324k against forecast of 195k and prior month's stronger 455k.
RBA downgrades 2023 CPI and GDP forecasts slightly
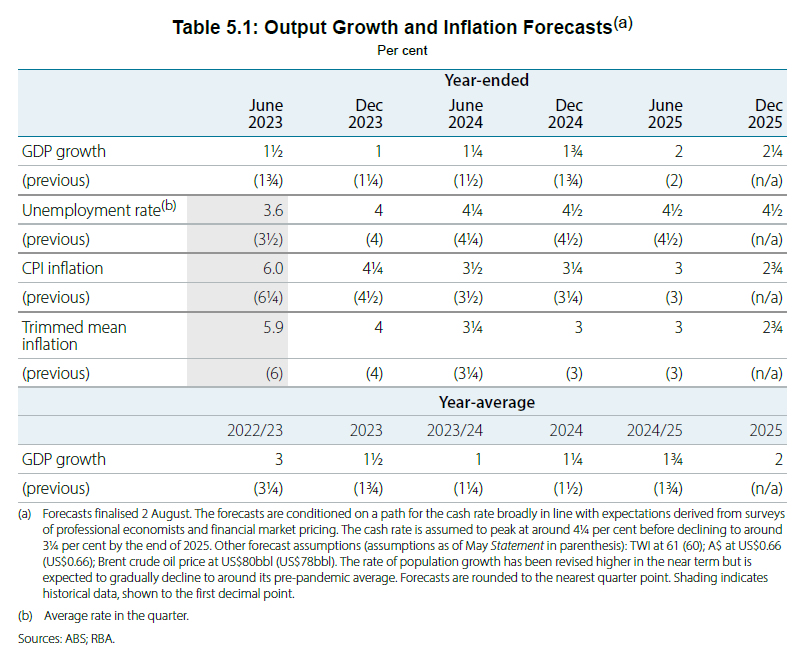
In the quarterly Statement on Monetary Policy, RBA reiterated that "some further tightening of monetary policy may be required". This decision, however, would hinge on the incoming data and the evolving assessment of risks. Economic forecasts remain largely unchanged, with a slight downgrade in 2023 CPI forecast as well as 2023 and 2024 GDP projections.
The central bank's outlook for inflation remains more or less steady as compared to three months ago. "CPI inflation is forecast to continue to decline, to be around 3¼ per cent at the end of 2024 and back within the 2–3 per cent target range in late 2025," the statement highlighted. The Board maintains that the risks around the inflation outlook are "broadly balanced".
While the labour market remains tight, conditions have seen slight relaxation. The bank notes, "In response to the tight labour market and high inflation, wage growth picked up to its highest rate in a decade."
The economic growth perspective appears somewhat muted, with the statement acknowledging that "Growth in economic activity has been subdued this year." Looking ahead, the central bank remains cautious, predicting that "Growth in the economy is expected to remain subdued over the period ahead."
New economic forecasts
CPI inflation at (vs previous forecast):
- 4.25% in Dec 2023 (down from 4.50%).
- 3.50% in June 2024 (unchanged).
- 3.25% in Dec 2024 (unchanged).
- 300% in Jun 2025 (unchanged).
- 2.75% in Dec 2025 (new).
Trimmed mean CPI inflation at:
- 4.00% in Dec 2023 (unchanged).
- 3.25% in Jun 2024 (unchanged).
- 3.00% in Dec 2024 (unchanged).
- 3.00% in Jun 2025 (unchanged).
- 2.75% in Dec 2025 (new).
Year-average GDP growth at:
- 1.50 in 2023 (down from 1.75%).
- 1.25% in 2024 (down from 1.50%).
- 2.00% in 2025 (new).
Cliff Notes: RBA & FOMC on Hold as ECB & BoE Remain on Tghtening Path
Key insights from the week that was.
This week, the RBA decided to leave policy unchanged for a second consecutive month. As was the case in July, the Board’s decision reflects a preference to ‘wait-and-assess’ the evolution of risks as the cumulative impact of policy tightening is increasingly felt. Curiously, the RBA has retained the same forecast track for inflation following a better-than-expected Q2 CPI print, with headline inflation still expected to reach 3.25% by the end of 2024. The RBA’s Statement on Monetary Policy (due for release at 11:30am) will provide a full update of the staff forecasts; and, of particular interest, more clarity over how far into the 2–3% target range the RBA expect to be by end-2025. Nevertheless, the Board has retained a clear tightening bias and likely will continue to do so over the near-term as risks are assessed.
As discussed by Chief Economist Bill Evans in a video update midweek, we believe this decision likely confirms the end of the RBA’s tightening cycle. Although the September meeting certainly remains ‘live’ – the Monthly CPI Indicator and WPI could surprise – our central case is that policy will remain on hold from now as evidence of a slowing economy, moderating inflation pressures and a gradual emergence of slack in the labour market continue to build over the coming year. In our view, these dynamics warrant an interest rate easing cycle starting from Q3 2024, with a 25bp rate cut per quarter until a broadly neutral level is reached for policy, ensuring growth sustainably returns to trend as inflation nears target.
The lower-than-expected peak in the cash rate and a firmer labour market – the unemployment rate set to rise to only 3.8% in 2023 and 4.7% in 2024 – will put less pressure on the Australian consumer over H2 2023 and 2024 than we had initially anticipated. The consumer sector will be coming off an already weak base, associated with deteriorating real incomes and spending capacity, also highlighted by the large contraction in real retail sales through H1 2023. So, while the improvement in our consumption forecast (0.8% in 2023; 0.9% in 2024) has lifted our view for GDP – from 0.6% to 1.0% in 2023 and from 1.0% to 1.4% in 2024 – these results are still characterised as very weak versus history.
Before moving offshore, a quick note on housing. This week’s data raised more questions about the sustainability of the housing market’s current momentum given the elevated level of interest rates. Indeed, while CoreLogic’s home value index posted another broad-based gain in July (0.8%), this represented a continued moderation in the pace of price gains from May (1.4%) and June (1.2%). The fall in housing finance approvals also provided a tentative signal of growing uncertainty in borrowers’ interest in the housing market, with clear weakness in loans for existing dwellings apparent. A sizeable pipeline of work is currently holding up housing construction but, abstracting for high-rise volatility, dwelling approvals' weak trend suggests housing construction activity will decline over the coming year. Housing supply is therefore likely to remain constrained to end-2024 and beyond, supporting the level of both prices and rents.
Offshore, the Bank of England raised its Bank Rate by 25bps to 5.25%. Strong momentum in wages and resilience in GDP growth justified the Committee’s decision in August and point to further hikes ahead. Despite the significant deceleration in inflation in June (7.9%yr from 8.7%yr in May) and a belief that policy is contractionary, inflation risks remain skewed to the upside and two members of the Committee felt a 50bp move would have been more appropriate in August. Despite services inflation having accelerated for four consecutive months, the Committee seem optimistic that the trend will top out, projecting it "to remain elevated at close to its current rate in the near term." Signs that the labour market is coming into better balance and a weaker forecast profile for the unemployment rate support this view.
The forecasts for inflation overall, which are predicated on a market implied rate around 6% in 2023 and 2024, point to inflation a bit above target in 2024, but back at 2%yr in Q2 2025 and below that level near end-2025. GDP growth is expected to be materially below potential through 2023-25, creating a sizeable output gap, and so the longer-run expectation for inflation based on the market-implied rate path has to be below target. While the risks regarding inflation calls for further rate hikes in the near-term, the current market-implied rate for 2025 of 5% seems improbable. Growth below trend and inflation below target in 2025 would instead argue for a neutral or accommodative stance at that time; history points to that level being a fraction of 5%.
Close by, Europe's flash HCIP showed prices grew 5.3%yr in July versus 5.5%yr in June. Core inflation remained unchanged at 5.5%yr while services inflation accelerated to 5.6%yr. While not alarming, the August report will need to show more improvement for the ECB to stay put on rates. Regardless of the August CPI outcome, it seems prudent to us for the ECB to hike once more in September and then go on hold till mid-2024 at a restrictive level to guard against inflation risks, particularly as the labour market remains strong and economic activity resilient.
Across in the US, the ISM Manufacturing PMI for July ticked up to 46.4 points, although that still marks nine consecutive months of contraction. There was an improvement in new orders and production reversed some of last month's fall, but both sub-indexes remained below 50. Meanwhile, the employment sub-index fell to a deeply negative reading of 44.4, suggesting US manufacturers are increasingly of the view that conditions will remain weak and current staffing is excessive. The services ISM PMI also subsequently disappointed in July, coming in at modestly expansionary 52.7. The softening was broad-based but most notable for employment which at 50.7 is now consistent with little-to-no growth in employment. Admittedly, both of the ISM employment indexes have been volatile over the past year, but the trend is clear: in aggregate, US businesses are increasingly of the view that they do not need additional staff and may indeed have too many workers; into year end and through 2024, the unemployment rate is likely to rise and wage growth slow back to average levels.
In China, the NBS manufacturing PMI meanwhile rose 0.3pts to 49.3, leaving it 1.2pts below the 5-year pre-COVID average. The largest improvement was in new orders and raw material inventories, though both remained below 50. The NBS non-manufacturing PMI however weakened to 51.5, with a particularly notable decline in new orders. The level of both NBS PMIs corroborate other evidence of excess capacity in China’s economy from the CPI and PPI. Yet, from the fixed asset investment data and given recent encouragement by authorities, it is clear additional capacity will come online over the next year. With developed world demand weak, this can only lead to further goods disinflation or outright deflation for some products globally. We see this trend continuing to aid the return of western inflation back towards trend, though to fully achieve this aim also requires services inflation in developed markets to ebb, a problem the West will have to resolve themselves.
As a final point, the BoJ decision last week to expand its 10-year trading range to +/-1.0% from +/-0.5% to improve the sustainability of YCC further highlights the need to continue to assess each nation’s inflation path and contributing factors carefully. Wage and capacity trends will continue to vary greatly between the US, Europe, Japan and developing countries like China; so too then will monetary policy outcomes. A full discussion of the implications for FX markets will be available in our August Market Outlook due for release on Westpac IQ today.
USD/JPY Aims Higher, US Nonfarm Payrolls Next
Key Highlights
- USD/JPY started a decent increase and climbed toward 144.00.
- It broke a key bearish trend line with resistance near 141.00 on the 4-hour chart.
- EUR/USD is struggling to start a fresh increase above the 1.1000 resistance.
- The US nonfarm payrolls could increase by 200K in July 2023, down from 209K.
USD/JPY Technical Analysis
The US Dollar started a fresh increase above the 140.50 resistance against the Japanese Yen. USD/JPY cleared the 141.20 resistance to move into a positive zone.
Looking at the 4-hour chart, the pair also broke a key bearish trend line with resistance near 141.00. There was a close above the 100 simple moving average (red, 4 hours) and the 200 simple moving average (green, 4 hours).
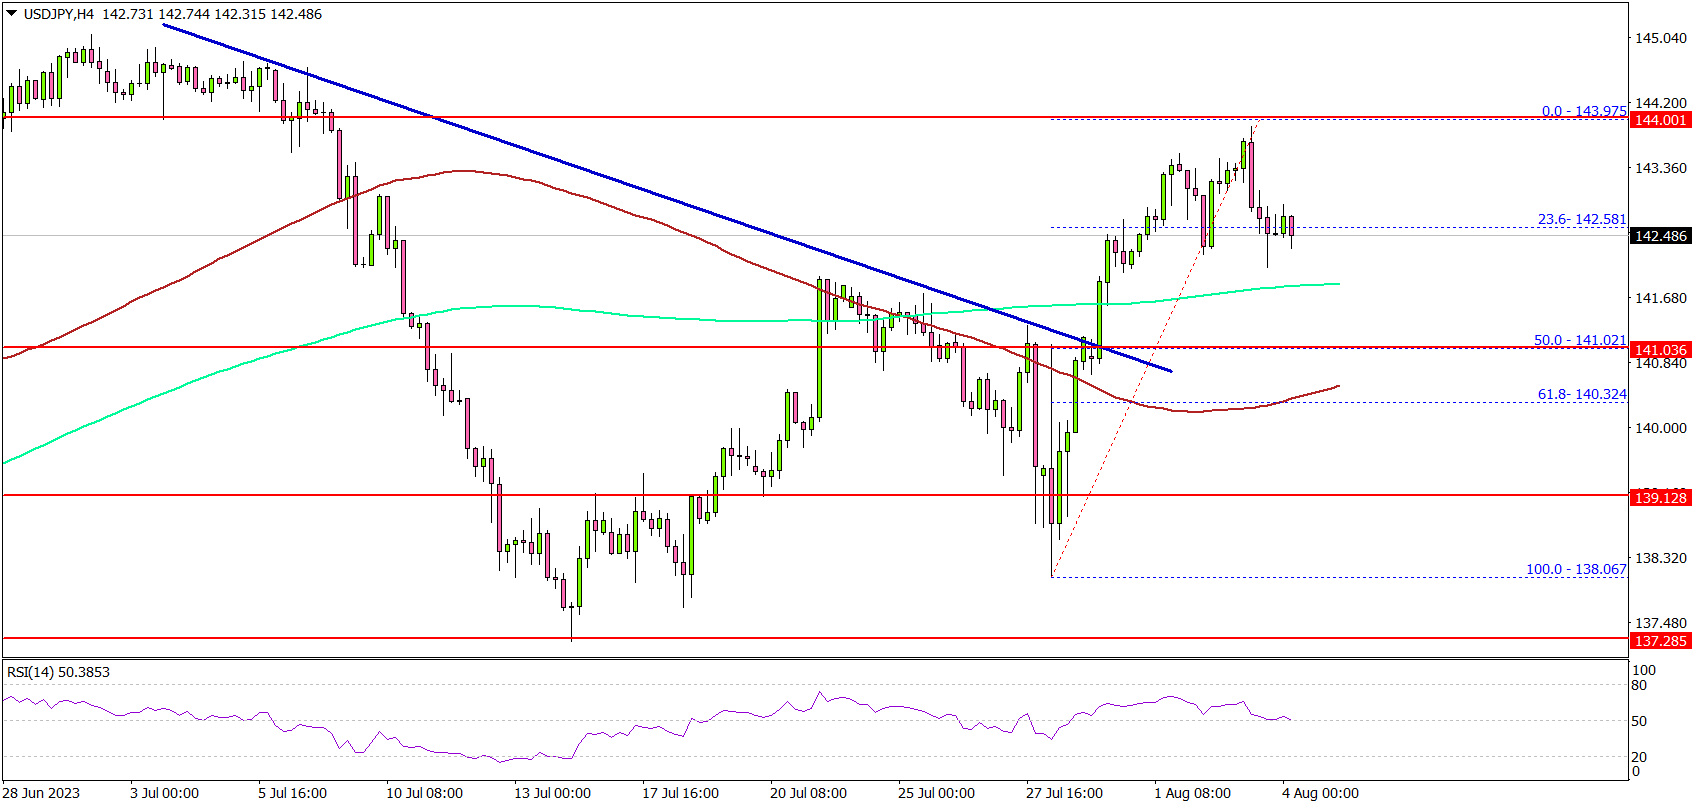
The pair even traded toward the 144.00 resistance. A high is formed near 143.97 and the pair is now consolidating gains. Initial support is near the 141.70 level and the 200 simple moving average (green, 4 hours).
The next major support is near 141.00, below which USD/JPY could gain bearish momentum. In the stated case, the pair could test the 140.00 support.
On the upside, the pair is facing resistance near the 143.80 level. The first major resistance is near 144.00. A close above the 144.00 resistance could push the pair toward 145.00. Any more gains could start a fresh increase toward the 148.00 level.
Looking at EUR/USD, the pair extended its decline below the 1.1000 level and there is a risk of more downsides.
Economic Releases
- US nonfarm payrolls for July 2023 – Forecast 200K, versus 209K previous.
- US Unemployment Rate for July 2023 - Forecast 3.6%, versus 3.6% previous.
Strong USD Sends Gold to a 3-Week Low
- Crude prices rally after Saudis signal output cuts can be extended or deepened
- Gold struggles as bond market selloff extends; 10-year Treasury rises 11.4bps to 4.191%
- Bitcoin’s tight range narrows to $28,900 to $30,100
Oil
Crude prices rallied after the Saudis did what everyone expected them to do, they extended output cuts. The Saudis are doing whatever it takes to defend oil prices and that could mean we could be seeing $90 oil soon. The only thing getting in oil’s way is a weakening global outlook as several advanced economies are starting to feel the impact of central bank tightening.
A strong dollar has been getting in oil’s way, but that might not extend much longer if sentiment improves once we get beyond mega-cap tech earnings and the NFP report. The short-term crude demand outlook should hold up as it is clear as day that the US economy is weakening, albeit at a slow pace.
Gold
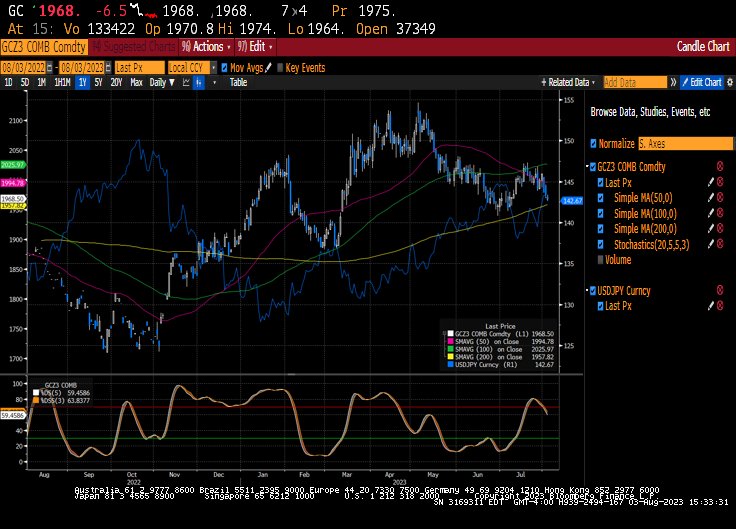
Gold should start attracting once we see the bond market selloff cool off. The US might have some debt issues over the coming years and that should keep gold supported. While the US economy has been very resilient, the Fed’s work will likely be done after one more rate hike. Gold should start to see stronger safe-haven flows as the stock market seems like it won’t be making a run towards record high territory anytime soon.
The strong dollar trade might last a little while longer, so gold’s struggles might see a test of the $1950 region before buyers emerge.
Bitcoin
Bitcoin continues to hold onto the $29,000 level as a lot of altcoins weaken as the global bond market selloff extends. Cryptos like dogecoin, Solana, Cardano, were supposed to have greater growth potential, but they are also vulnerable to surging borrowing costs. If global bond yields continue to surge, this could spell trouble for large parts of the cryptoverse, which might see altcoins get sold and those funds might flow back into Bitcoin.
Global Bond Market Selloff Extends after BOE signals more tightening ahead
- BOE rate hike odds for the September 21st meeting stand at 87.3%
- The VIX index trades above 16, to the highest levels in two months
- FX Volatility starts to pick, Canadian dollar index rises to nine-month high
Wall Street is watching a global bond market selloff get uglier as US stocks waver ahead of massive earnings from Apple and Amazon. A lot of economic data confirmed how resilient the US economy remains. Both initial jobless claims still remain low and the ISM services employment component supports the argument that the Fed might need to deliver more tightening in November.
The global bond market selloff extended and the British pound weakened against the US dollar as the BOE decided to only go with a quarter-point rate rise. FX traders thought the statement was rather dovish but sterling reversed losses after BOE Governor Bailey expressed concerns about service inflation. With only 2 MPC members voting for a half-point rate rise, the market is growing confident that the BOE might only have two quarter-point rate rises left.
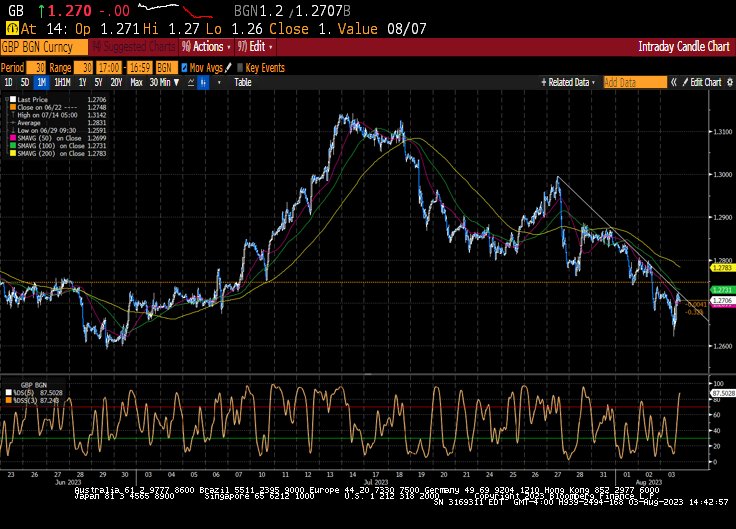
After hitting a one-month low, GBP/USD is in this awkward position as the BOE seems easily positioned to deliver more tightening than the Fed, but that could be followed by a stronger economic performance by the US economy. Now the FX market might view the risk of more tightening as bad news for a currency, as monetary policy should already be at restrictive levels.
The global bond market selloff could also rattle markets and lead to strong safe-haven flows towards the US dollar and Japanese yen. If the greenback remains bid, GBP/USD could see downside momentum target the 1.2600 region. To the upside, the 1.2825 level provides initial resistance.
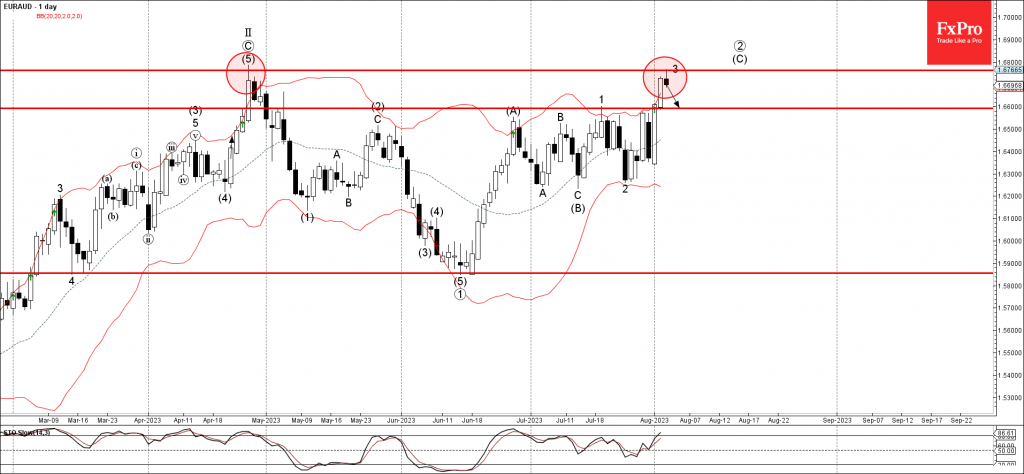
EURAUD Wave Analysis
- EURAUD reversed from resistance level 1.6765
- Likely to fall to support at 1.6600
EURAUD currency pair recently reversed down from the powerful, multi-month resistance level 1.6765, which stopped the clear daily uptrend in last April.
The resistance level 1.6765 stands above the upper daily Bollinger Band – which strengthened it.
Given the continued yen positivity seen across the FX markets today, EURAUD can be expected to fall further toward the next support at 1.6600 (former monthly high from last month).
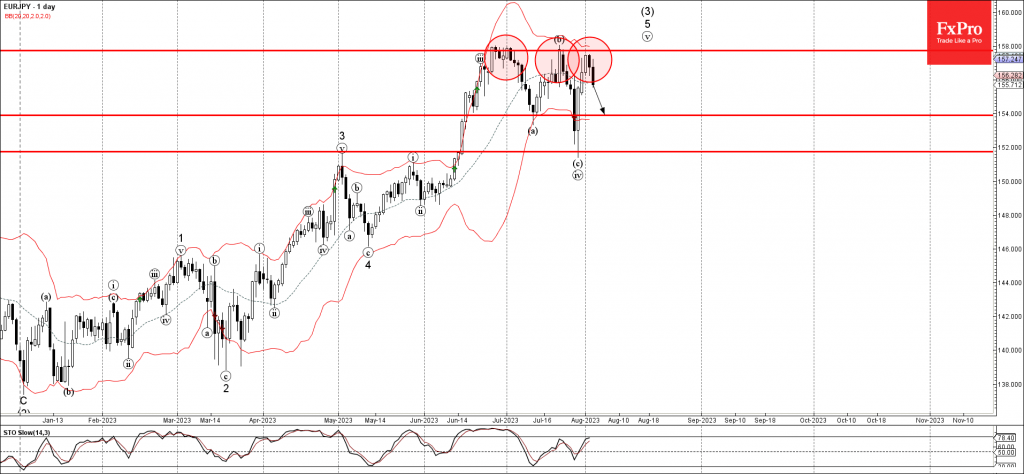
EURJPY Wave Analysis
- EURJPY reversed from key resistance level 157.75
- Likely to fall to support at 154.00
EURJPY currency pair recently reversed down with the Dark Cloud Cover from the key resistance level 157.75, which has been reversing the price from June.
The resistance level 157.75 was strengthened by the upper daily Bollinger Band.
Given the strength of the resistance level 157.75 and the strong yen gains across the FX markets, EURJPY can be expected to fall further toward the next support at 154.00.
GBPJPY Holds Near Highs Amid Weakening Bullish Bias
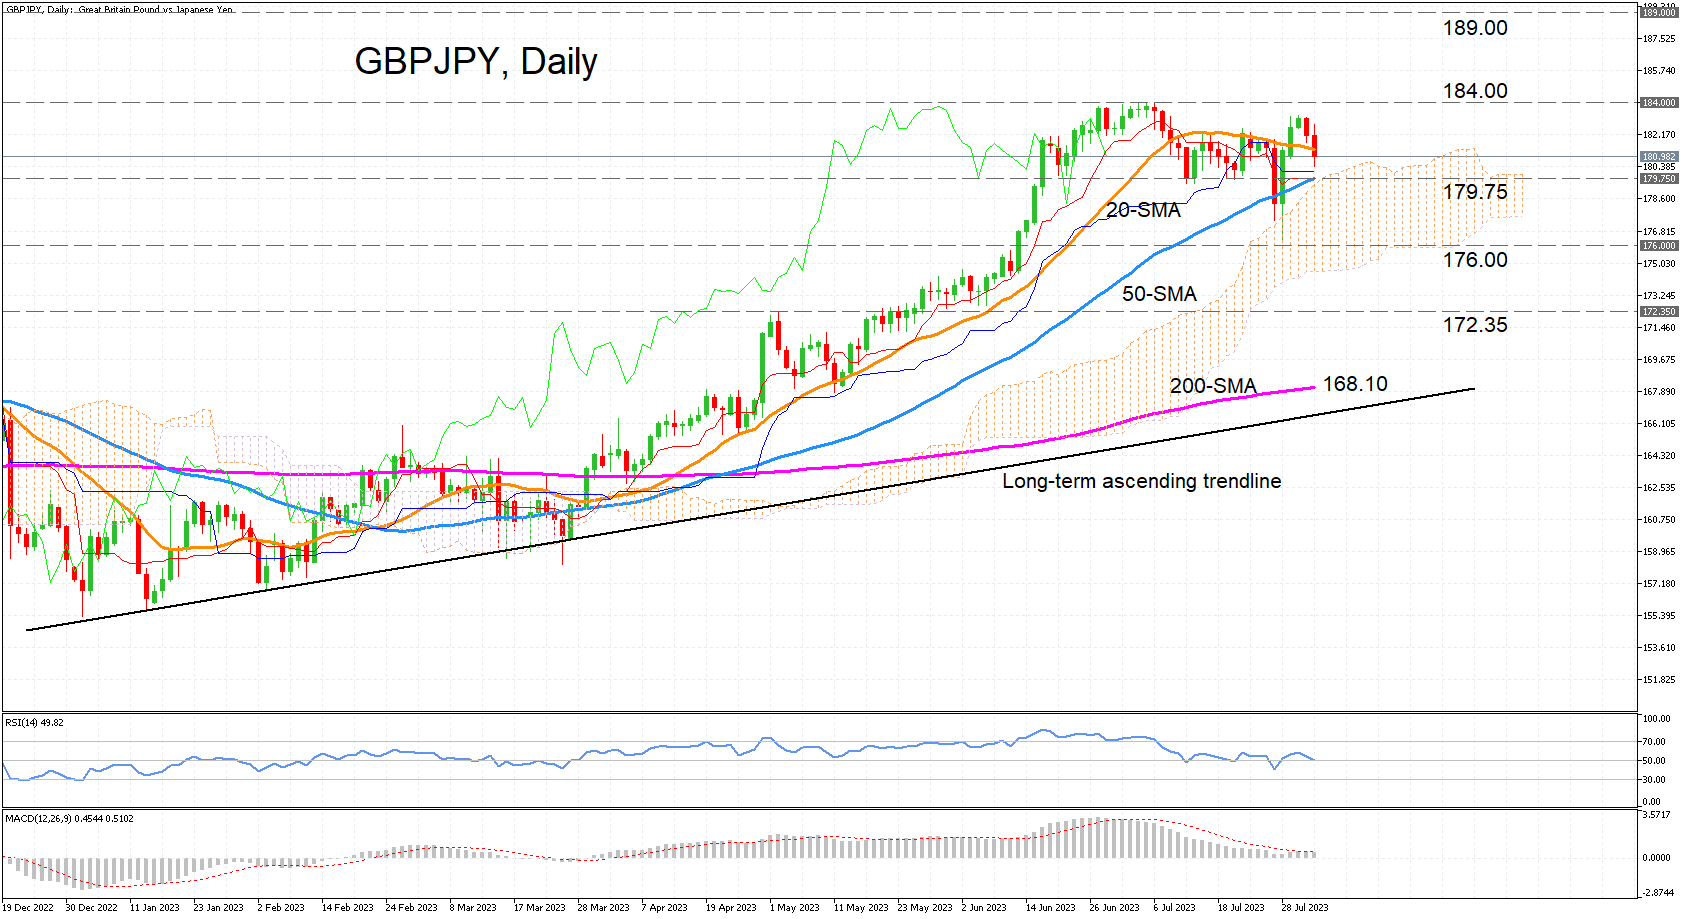
GBPJPY has been consolidating over the past month after reaching a 7½-month high of 183.99 on July 5, but the negative risks appear to be accumulating. The worsening short-term bias is supported by the momentum oscillators.
The RSI is sloping downwards, dipping slightly below the 50 neutral level, while the MACD remains below its red signal line, though above zero, having declined considerably from its June highs.
Moreover, the price has just breached the 20-day simple moving average (SMA) and is headed back towards the 50-day SMA, which only last week successfully defended the long-term uptrend when the pair briefly spiked below it. The area around the 50-day SMA is forming into a crucial support zone as the Tenkan-sen line is about to intersect it and both look set to enter the Ichimoku cloud in the 179.75 region.
If the price is able to hold above this support area, the bulls will have another chance to regain control and revisit the July top of 183.99. Higher up, the focus might turn to the 189.00 level, which acted as resistance back in 2014 and 2015.
However, if the price breaks below the 50-day SMA and plunges into the cloud, the next support might not come until the 176.00 level near the July trough. Even lower, the slide may extend until the congested region of 172.35 before sellers aim for the 200-day SMA at 168.10.
In brief, the downside risks are rising for GBPJPY and it may be up to the 50-day SMA again to decide whether the price bounces off it or breaches it. However, the longer-term uptrend should stay intact as long as the pair holds above the ascending trendline.