Sample Category Title
Australia employment grew 32.6k, but demand met by people working more hours
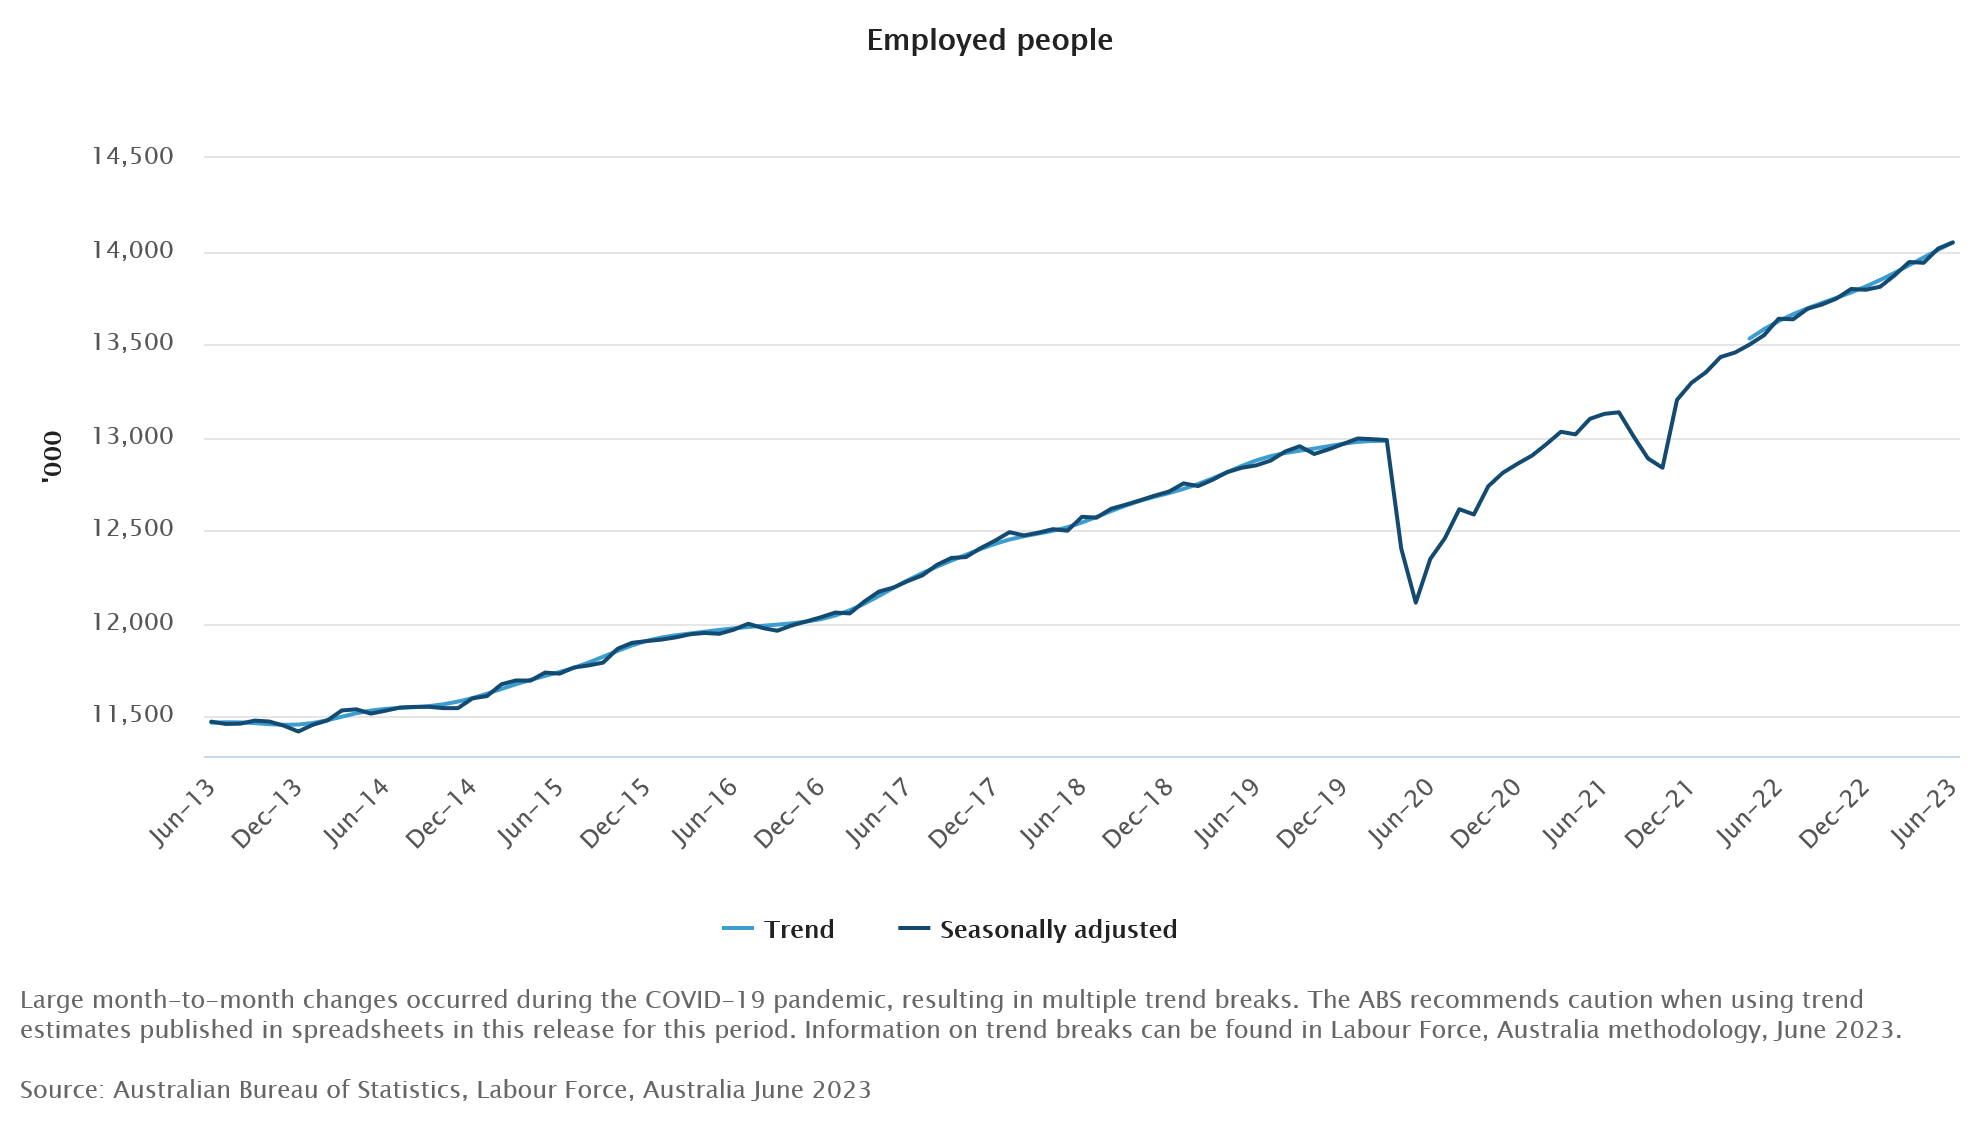
Australian's June employment data showed persistent tightness in the job markets. The 32.6k growth in employment significantly surpassed expectations of 15.0k. Employment-population ratio remained at record high. Monthly hours worked outpaced employment growth, suggesting that labor demand was met by people working more hours.
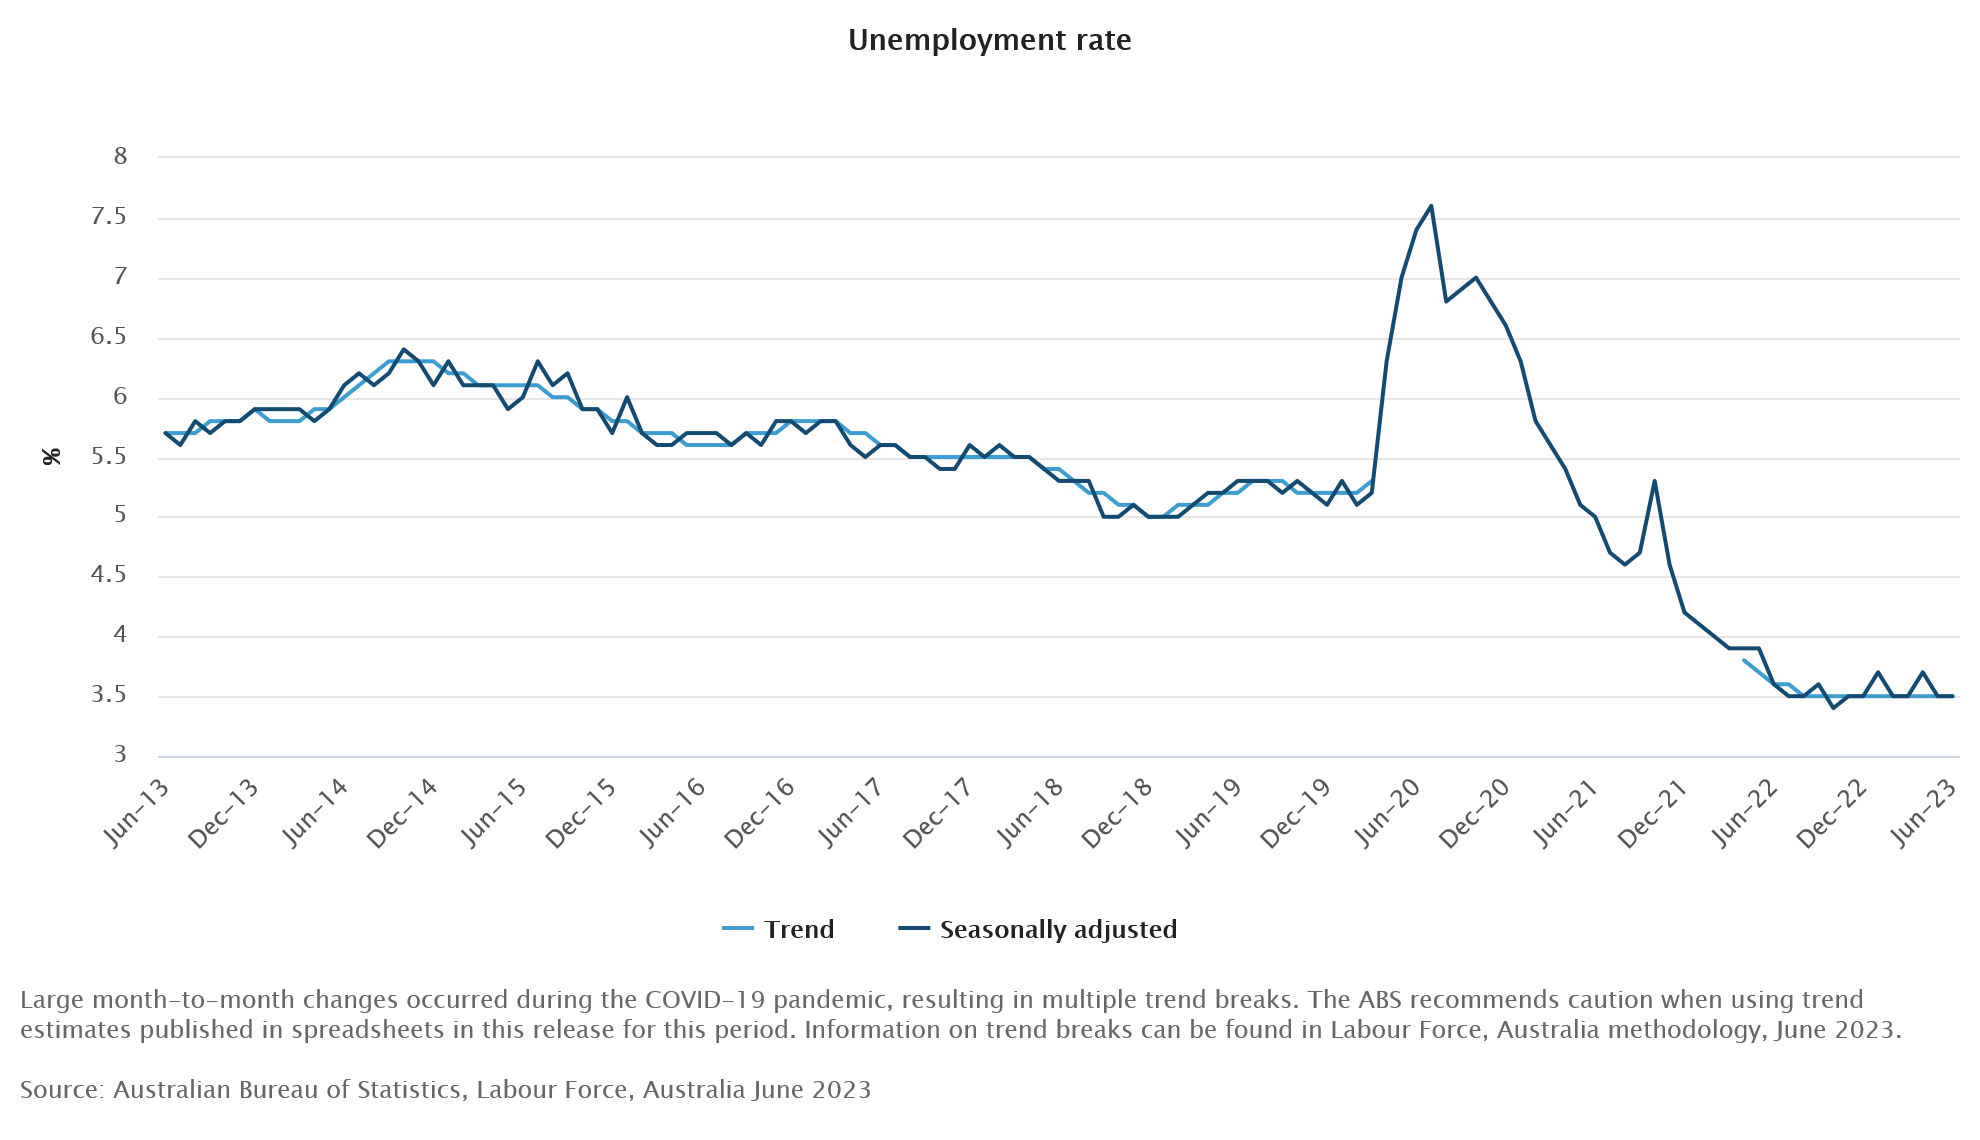
Among the 32.6k job growth, rise of 39.3k full-time employment was offset by a decrease of -6.7k in part-time roles. Unemployment rate remained steady at 3.5%, below expectation of 3.6%. Participation rate dipped slightly from 66.9% to 66.8%. Monthly hours worked rose 0.3% mom, faster than growth in employment at 0.2% mom.
Bjorn Jarvis, ABS head of labour statistics, stated: "The rise in employment in June saw the employment-to-population ratio remain at a record high 64.5 per cent, reflecting a tight labour market in which employment has recently increased in line with population growth."
He further emphasized that the current labour market is stronger than it was prior to the pandemic. Jarvis elaborated, "In addition to there being over a million more employed people than before the pandemic, a much higher share of the population is employed. In June 2023, 64.5 per cent of people 15 years or older were employed, an increase of 2.1 percentage points since March 2020."
Jarvis also highlighted the ongoing demand for labour, saying: "The strength in hours worked since late 2022, relative to employment growth, shows the demand for labour is continuing to be met, to some extent, by people working more hours."
BoE Ramsden: CPI inflation remains much too high
BoE Deputy Governor Dave Ramsden said yesterday, "CPI inflation has begun to fall significantly but remains much too high. The Monetary Policy Committee has consistently stressed that monetary policy decisions will address the risk of more persistent strength in domestic wage and price settling."
He went on to warn, "If there is evidence of more persistent pressures, then further tightening in monetary policy would be required."
Ramsden also mentioned BoE's efforts in reducing its holdings of gilts and corporate bonds, which he expects to decrease by a total of GBP 100B by October. However, he pointed out that the central bank has almost completely run off its portfolio of corporate debt, possibly paving way for it to sell more government bonds.
In light of these factors, Ramsden stated, "These factors support a carefully considered increase in the pace of reduction in the stock of gilts in the 12 months ahead." However, he also stressed caution, noting, "I emphasize careful — like the MPC, I want Quantitative Tightening (QT) to set a gradual and predictable pace for unwind and to let it operate in the background, after all."
NZD/USD Attempts Fresh Increase But Faces Hurdles
Key Highlights
- NZD/USD is moving higher from the 0.6225 zone.
- It broke a major bearish trend line with resistance near 0.6275 on the 4-hour chart.
- EUR/USD is holding gains above the 1.1150 support.
- GBP/USD corrected lower sharply from the 1.3140 zone.
NZD/USD Technical Analysis
The New Zealand Dollar found support near 0.6225 against the US Dollar. NZD/USD started a decent increase and broke the 0.6250 resistance.
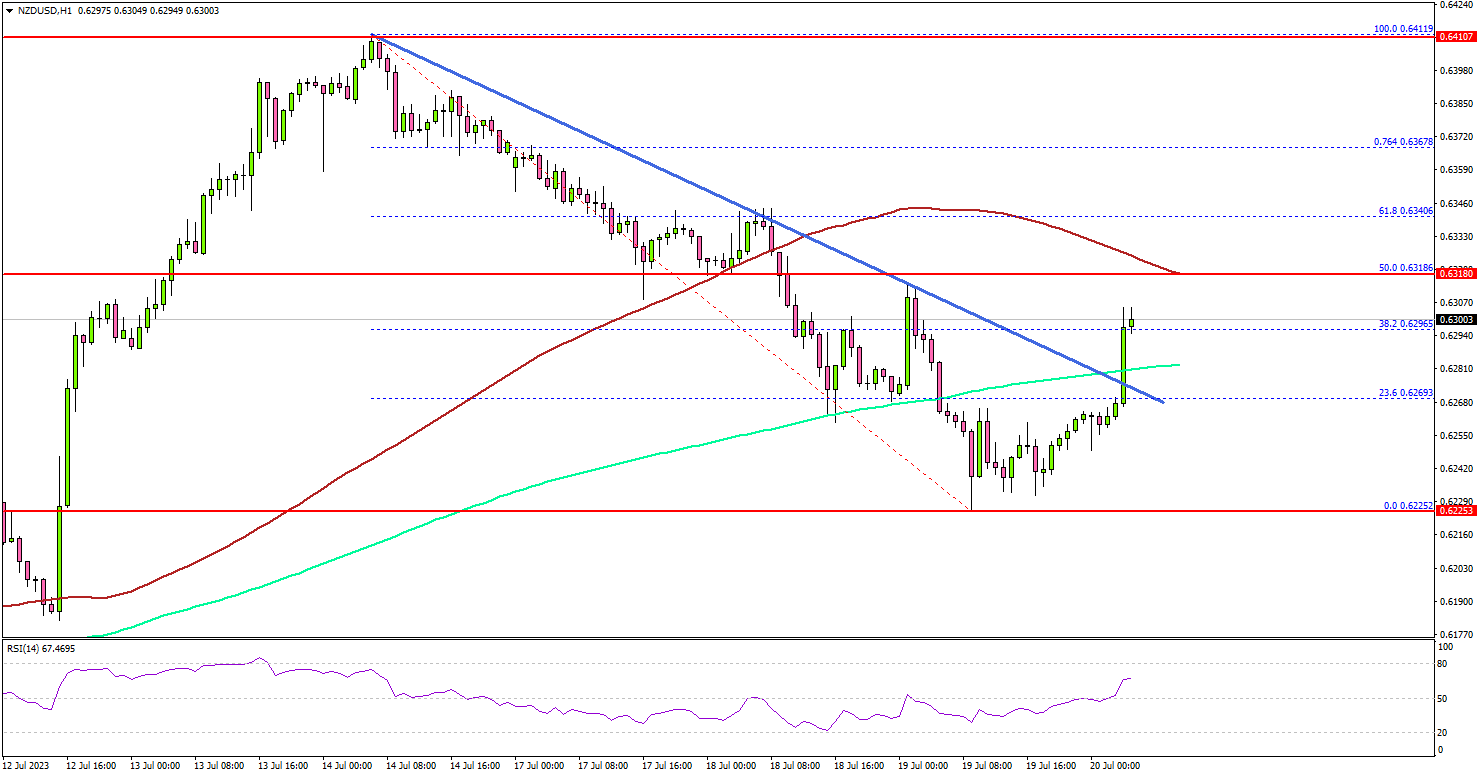
Looking at the 4-hour chart, the pair broke a major bearish trend line with resistance. There was a move above the 23.6% Fib retracement level of the downward move from the 0.6411 swing high to the 0.6225 low.
The pair is now trading above 0.6280 and the 200 simple moving average (green, 4 hours). It is facing resistance near the 0.6320 level and the 100 simple moving average (red, 4 hours).
The 50% Fib retracement level of the downward move from the 0.6411 swing high to the 0.6225 low is also near the 0.6320 zone. The next major resistance is near 0.6340. If there is a move above the 0.6340 resistance, the pair could rise toward 0.6380.
Any more gains might send the pair toward the 0.6410 resistance zone in the near term. Immediate support is near the 0.6280 level.
The next major support is seen near the 0.6225 level, below which there could be a drop to 0.6200. Any more losses might send the pair toward the 0.6150 support zone.
Looking at EUR/USD, the pair is now consolidating gains above 1.1150 and might attempt another increase in the near term.
Economic Releases
- US Existing Home Sales for June 2023 (MoM) - Forecast -0.1%, versus +0.2% previous.
- US Initial Jobless Claims - Forecast 242K, versus 237K previous.
Gold – Eyeing Another Move Above $2,000 as Inflation Outlook Improves?
- Progress on inflation driving gold’s gains
- UK becomes the latest to make significant improvements
- $2,000 a major psychological level
Gold broke higher again on Tuesday after briefly paring gains late last week and early this.
Lower yields and a weaker dollar are continuing to boost its appeal on the back of some more promising inflation data and lower interest rate expectations.
That inflation data has been both widespread, from the US to the eurozone and now the UK, and at both the headline and core levels, which is what’s offering so much hope.
Will lower inflation help gold to recapture $2,000?
The yellow metal broke above $1,960 yesterday before running into some resistance around $1,980.
XAUUSD Daily
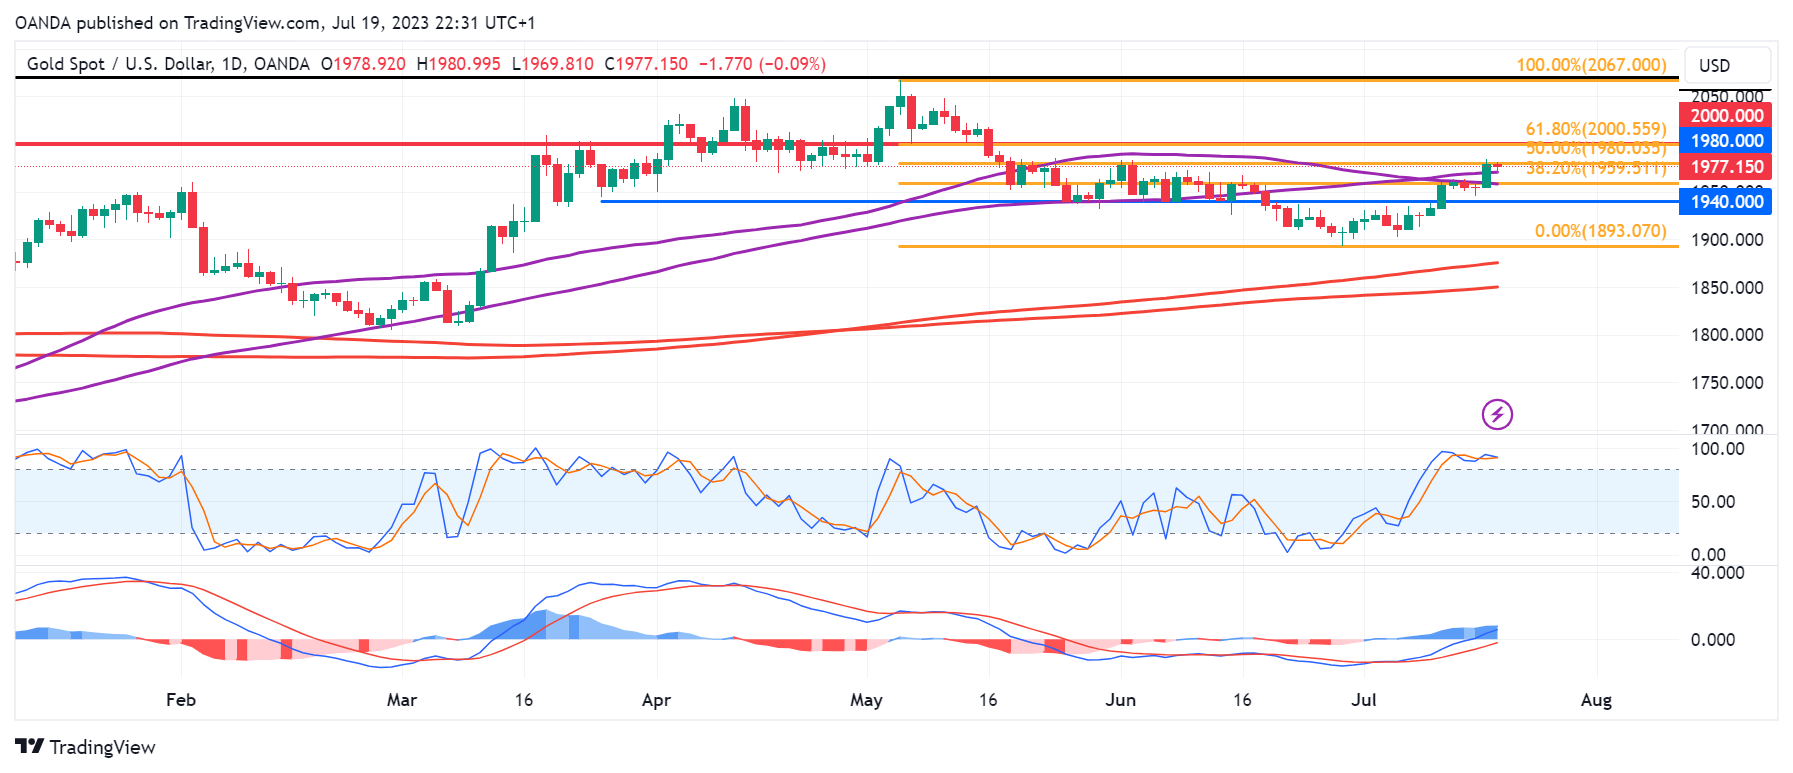
Source – OANDA on Trading View
A break above here could see it close in on $2,000 which is the next major barrier to the upside. A break of this may indicate traders have turned bullish on gold after two months of declines as up until now, it may have simply been experiencing a correction of recent declines.
Below, $1,940 still looks key, being a level that’s triggered so much support and resistance over the last four months. A break below could be perceived to be bearish and a sign that the move in July was in fact a correction and nothing more.
At this point, $1,900 could be key, with the 200/233-day simple moving average band below that a potential area of interest.
Nasdaq (NQ) Pullback Should Continue to Find Support
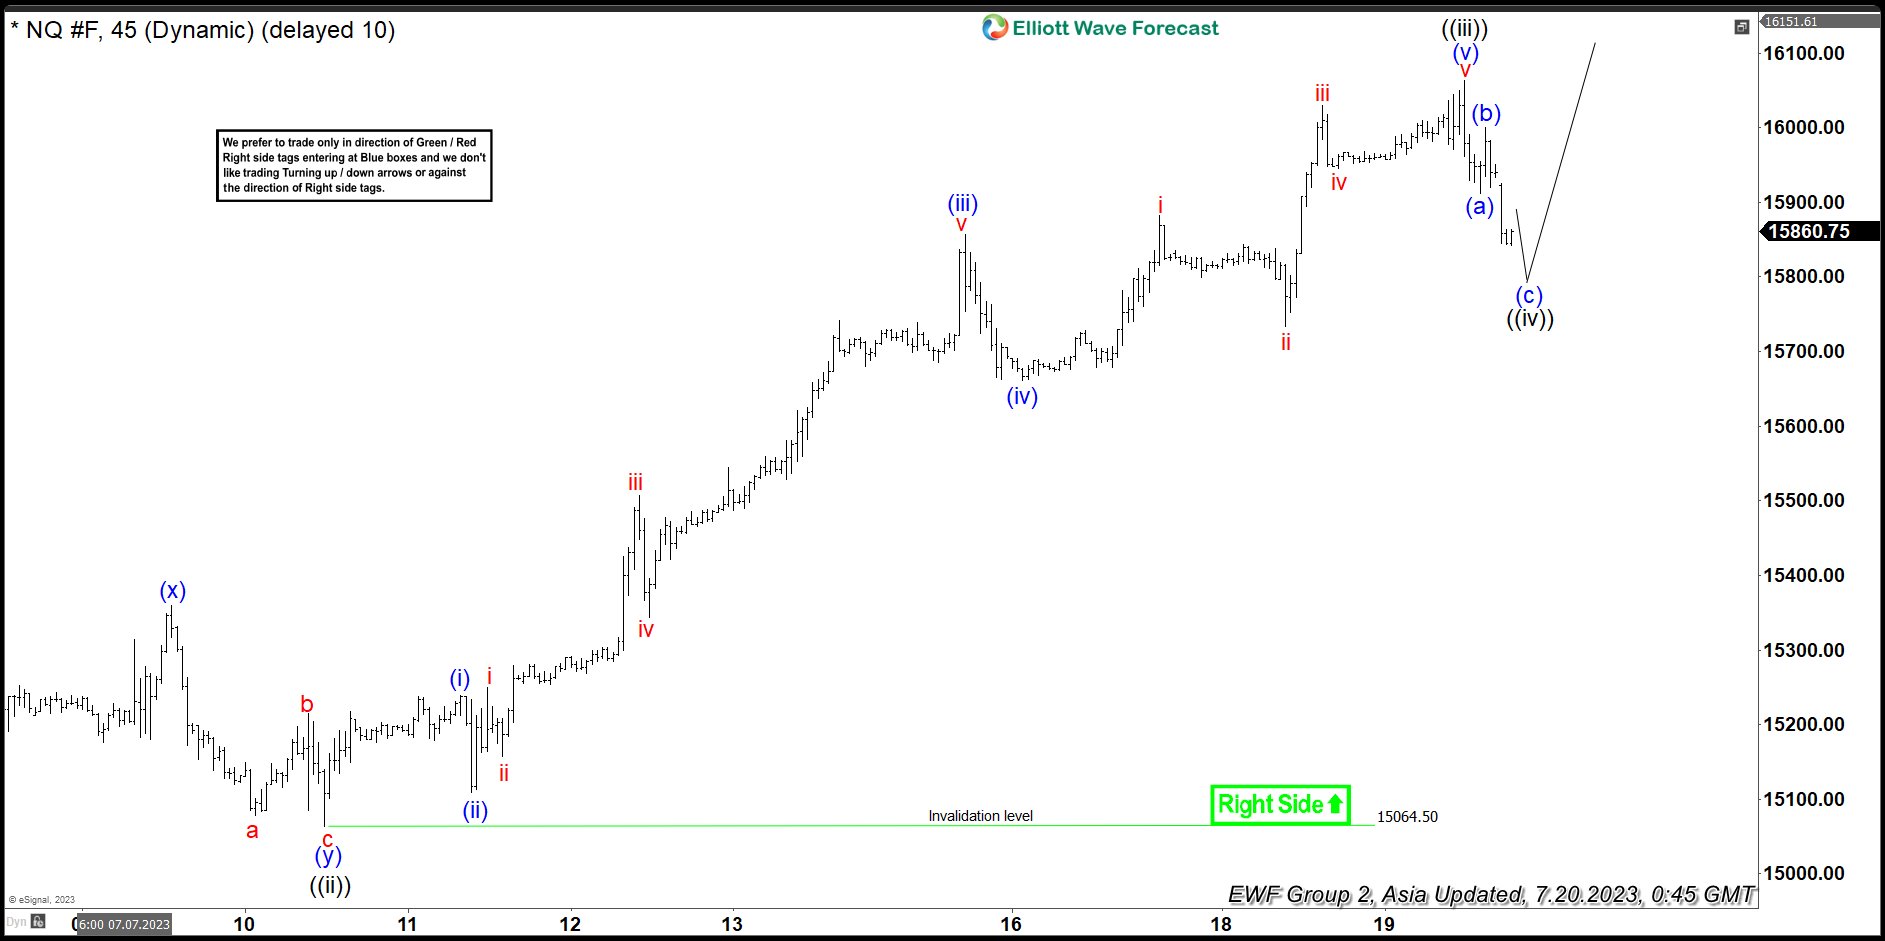
Short Term Elliott Wave View in Nasdaq (NQ) suggests the rally from 6.27.2023 low is in progress as a 5 waves impulse Elliott Wave structure. Up from 6.27.2023 low, wave ((i)) ended at 15432 and wave ((ii)) pullback ended at 15064.5. Internal subdivision of wave ((ii)) unfolded as a double three structure. Down from wave ((i)), wave (w) ended at 15111.5, wave (x) ended at 15359.75 and wave (y) lower ended at 15064.5. This completed wave ((ii)) in higher degree. The Index has resumed higher in wave ((iii)).
Up from wave ((ii)), wave (i) ended at 15239.75 and pullback in wave (ii) ended at 15109.50. The Index resumes higher in wave (iii) towards 15857.25 and dips in wave (iv) ended at 15661.50. Final leg higher wave (v) ended at 16062.75 which completed wave ((iii)). Pullback in wave ((iv)) is in progress as a zigzag structure. Down from wave ((iii)), wave (a) ended at 15911.25 and wave (b) ended at 16000. Expect wave (c) of ((iv)) to end soon. The Index should then resume higher in wave ((v)) to complete cycle from 6.7.2023 low. Near term, as far as pivot at 15064.5 low stays intact, expect pullback to find support in 3, 7, or 11 swing for further upside.
Nasdaq (NQ) 45 Minutes Elliott Wave Chart
NQ Elliott Wave Video
https://www.youtube.com/watch?v=dmXvUwtn7_o
USDJPY Wave Analysis
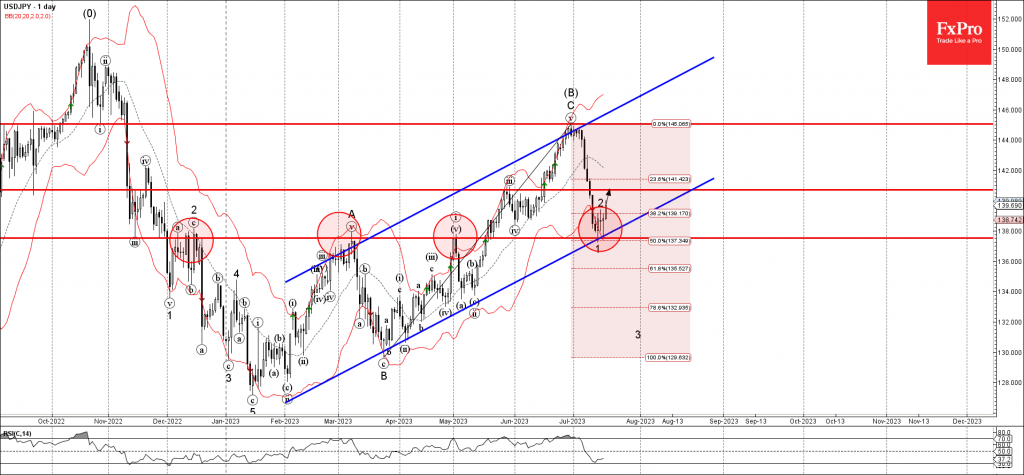
- USDJPY reversed from support level 137.50
- Likely to rise to resistance level 140.70
USDJPY currency pair previously reversed up from the key support level 137.50, former monthly high from March and May, strengthened by the lower daily Bollinger Band and by the support trendline of the daily up channel from February.
The upward reversal from the support level 137.50 started the active short-term correction 2.
Given the active mid-term uptrend, USDJPY currency pair can be expected to rise further toward the next resistance level 140.70.
GBPNZD Wave Analysis
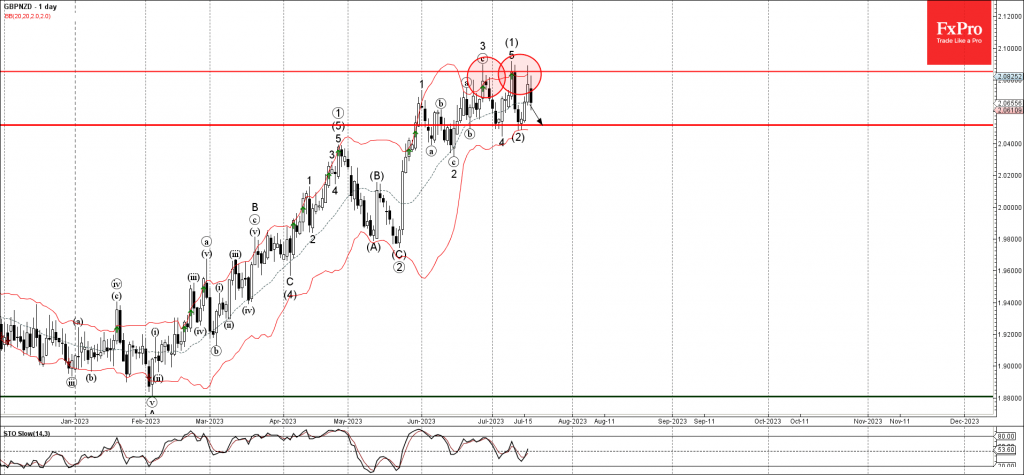
- GBPNZD reversed from key resistance level 2.0855
- Likely to fall to support level 2.0500
GBPNZD currency pair recently reversed down from the key resistance level 2.0855, intersecting with the upper daily Bollinger Band.
The downward reversal from the resistance level 2.0855 stopped the intermediate impulse wave (3) from the middle of this month.
Given the strength of the resistance level 2.0855, GBPNZD currency pair can be expected to fall further toward the next support level 2.0500 (low of the previous corrections 4 and (2)).
AUD/USD Extends Slide, Aussie Employment Report Next
- AUD/USD continues to slide
- Australian employment change expected to slow on Thursday
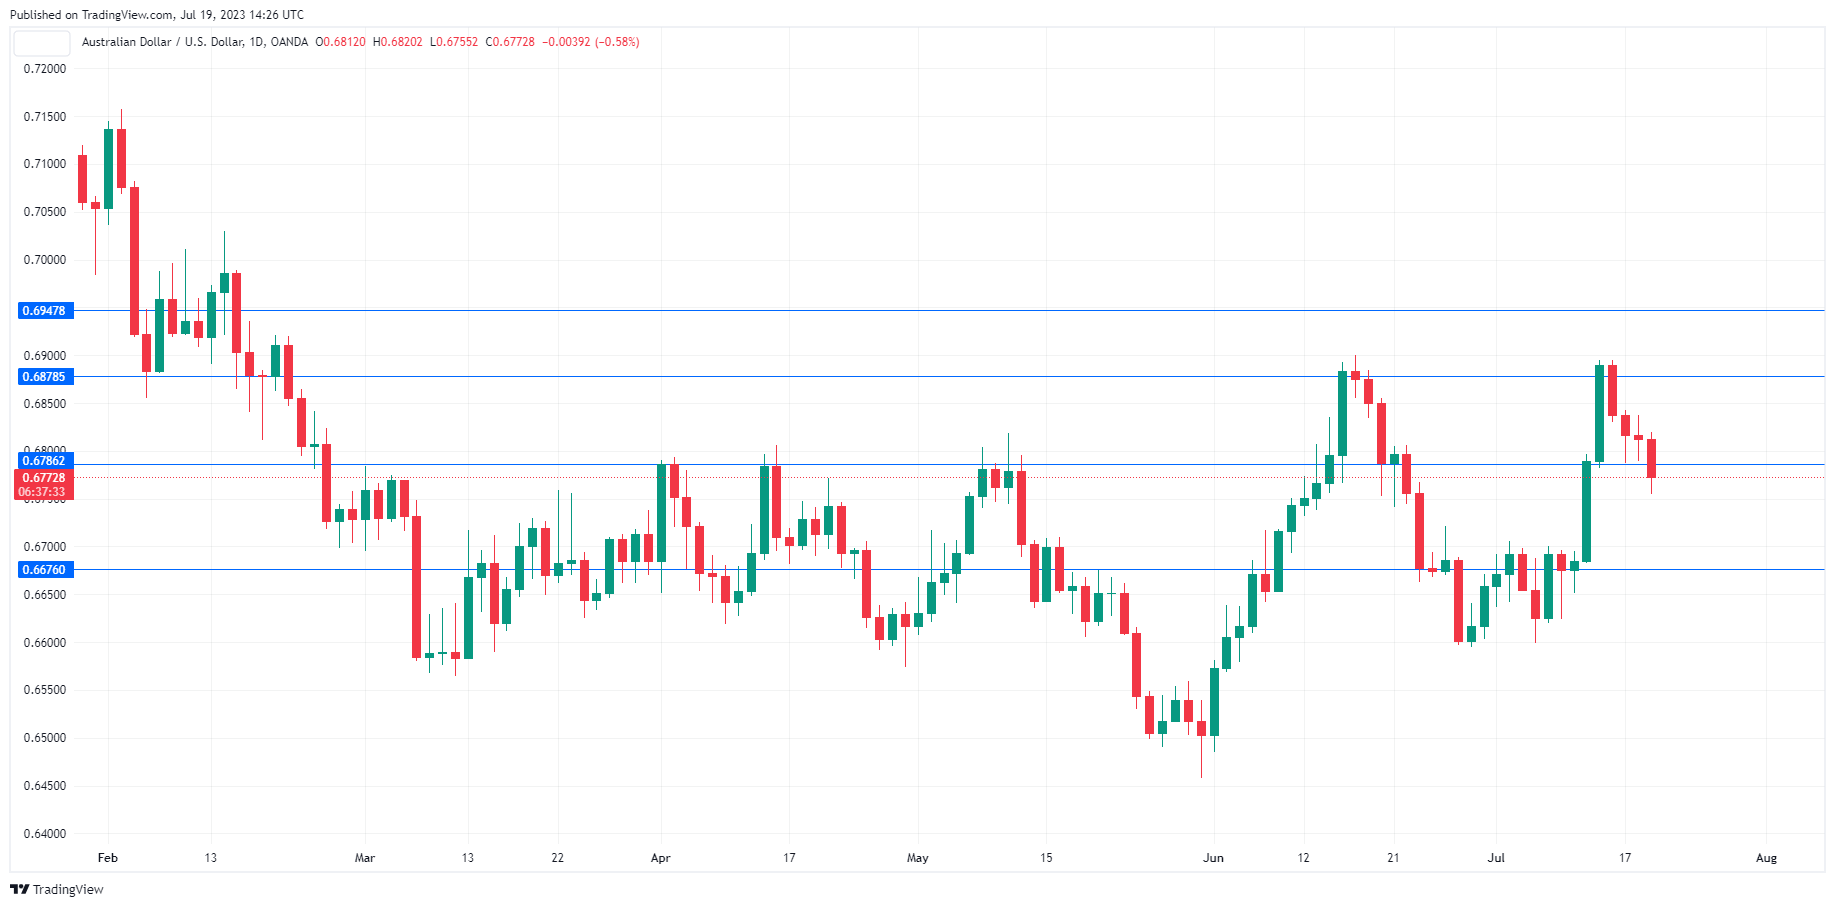
The Australian dollar is down sharply on Wednesday. In the North American session, AUD/USD is trading at 0.6774, down 0.55%.
For anyone who enjoys strong volatility, look no further than the Australian dollar. Last week, AUD/USD climbed 2.18%, as the US dollar sagged badly after the June inflation report surprised on the downside. The Australian dollar hasn’t been able to consolidate and has pared about half of those gains this week.
RBA will be keeping a close eye on the employment report
Australia releases the June employment report on Thursday. After a banner reading in May, when the economy added 75,900 jobs, the consensus stands at a modest 15,000. The unemployment rate is expected to remain at 3.6%.
The Reserve Bank of Australia would prefer weaker job numbers as it tries to beat down inflation. The labour market has been surprisingly resilient in the face of the central bank’s aggressive tightening, complicating the battle to curb inflation. The RBA has said that its decisions will be data-dependent, and inflation and employment numbers are critical to the RBA’s rate path in the coming months.
The central bank left rates alone at the meeting earlier this month and would like to extend the pause at the August 1st meeting. That, however, will require evidence that the economy is cooling and Thursday’s employment numbers will be a key factor in the RBA’s rate decision.
The next meeting is on August 1st, with the money markets pricing a rate hike at just 25%, according to the ASX RBA rate tracker. The RBA has abandoned forward guidance in favor of making rate decisions based on economic data, which could make next week’s employment report a game-changer as to whether the RBA pauses or hikes at the next meeting.
AUD/USD Technical
- AUD/USD is testing support at 0.6786. Below, there is support at 0.6676
- 0.6878 and 0.6947 are the next resistance lines
EUR/USD: Fresh Reversal Signal Still Needs Confirmation
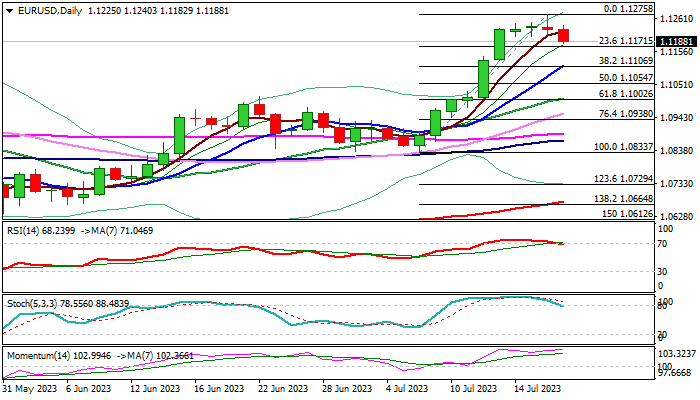
Bears started to gain control on Wednesday after larger uptrend ran out of steam, leaving triple-Doji (Fri/Mon/Tue).
Fresh weakness cracked initial support at 1.1200 (round-figure / the floor of three-day congestion, with sustained break lower seen as minimum requirement for initial reversal signal.
Fresh bears eye Fibo support at 1.1171 (23.6% retracement of 1.0833/1.1275 upleg), violation of which would weaken near-term structure and expose key support at 1.1106 (Fibo 38.2% / rising 10DMA).
Near-term technical picture is still lacking clear direction signal as daily indicators are conflicting (strong positive momentum and MA’s in bullish configuration vs south-heading RSI and stochastic, emerging from overbought territory.
We look for break below 1.1171 Fibo level to boost fresh bears or return and close above 1.1200, which will ease downside pressure and signal prolonged sideways mode.
Res: 1.1240; 1.1275; 1.1325; 1.1380
Sup: 1.1171; 1.1106; 1.1095; 1.1054