

Sample Category Title
Sunset Market Commentary
Markets
In the absence of any EMU data with market moving potential, the UK enjoyed the prerogative to set the tone at the start of trading this morning. After four consecutive (mostly substantial) upward surprises, UK June CPI inflation finally came out slightly softer than expected. Headline inflation slowed from 0.7% M/M and 8.7% Y/Y in May to 0.1% M/M and 7.9% Y/Y (8.2% expected). Core CPI also decelerated from a three-decade top of 7.1% Y/Y to 6.9%. Goods prices declined 0.2% M/M causing the Y/Y measure to ease to 8.5% (from 9.7%). Services inflation ‘slowed’ from 0.8% M/M to 0.5% M/M. However at 7.2%, the Y/Y measure is still holding near last months’ cycle top (7.4%). So, there is still work to do for the Bank of England to bring (underlying) inflation sustainably to the 2.0% target. However, in line with recent dovish markets’ reaction function, UK bonds show a clear sign of relief, if not euphoria. UK yields decline between 18 bps (2-y) and 15 bps (30-y). Early this morning the UK 2-y yield at some point almost ceded 25 bps. Money markets scaled back expectations on an August 50 bps BoE rate hike and now see a 50/50 chance between a 25 or 50 bps step. After multiple upside surprises and a clear credibility issue for Bailey and co, we would find it very strange for the Bank of England to forgo the chance to again become a bit ahead of the curve (or should we say be less behind the curve). Markets now see the BoE policy peak rate near 5.75%, down from 6.0%+ levels yesterday and near 6.50% about two weeks ago. In FX markets, sterling traders clearly feel the risk of the BoE ‘prematurely’ slowing its anti-inflation campaign. Sterling tumbled both against the euro and the dollar. EUR/GBP cleared the 0.8658 end June top to currently trade near 0.8685. Cable tumbled a full 1 big figure from the 1.3030 area before the CPI release to 1.2910 currently.
The UK bond rally also supported a bid for core European bonds after yesterday jump higher post (perceived) soft comments from ECB’s Knot. German yields initially declined up to 5.0 bps for maturities less than 10 y but bond gains gradually evaporated. The 2-y German yield currently declines 2 bps (2-y). The 30-y adds 1.0 bp. With markets now discounting a below 4.0% ECB peak cycle rate, there is not that much room to push for an even softer positioning going into next week’s ECB policy meeting. ECB Chair Lagarde for sure will keep the option open for further steps in September (and/or beyond). US Treasuries slightly outperform Bunds ceding between 4.0 bps (2-y) and 2 bps (30-y). The move was supported by softer than expected US housing starts/building permits. UK stocks trade with nice gains (FTSE 100 + 1.5%). European and US equities trade marginally higher. In FX, sterling sell-off briefly pushed EUR/USD for a test of the 1.12 area, but the pair soon returned into a 1.1200/1.124 ST consolidation pattern. After an impressive rally earlier this month, fortunes again changed for the yen. Comments from BoJ’s Ueda that the bank will keep an easy policy unless the view on the price goal changes, eased speculation on policy change next week. USD/JPY rebounded back to just below the 140 big figure (currently 139.50).
News & Views
South African inflation came in at 0.2% m/m in June, allowing the yearly figure to slow from 6.3% to 5.4%. Transport prices fell 0.9% m/m while food price inflation seems to have lost the sharpest edges (0.5% m/m). Core inflation excluding food, non-alcoholic drinks, fuel and electricity rose 0.4% m/m to be 5% higher compared to the same month last year. The decline here is less outspoken though, easing a mere 0.2 ppts from the May reading. Housing was an important factor keeping core inflation elevated (0.8% m/m). That said, both price gauges are now within the central bank’s 3-6% target range for the first time in 14 months. Today’s numbers also missed expectations by the tiniest margin, prompting markets to doubt whether the South African central bank will deliver another 25 bps hike to 8.5% at its policy meeting tomorrow. The SARB’s governor and deputy governor earlier this month said tightening won’t stop until the MPC is confident inflation will return to the midpoint of the target range. South African swap yields lose a few bps at the front end of the curve. USD/ZAR rises a tad to 17.93.
USD/JPY: Recovery Regains Traction But Needs Break Through Key Barriers to Signal Continuation
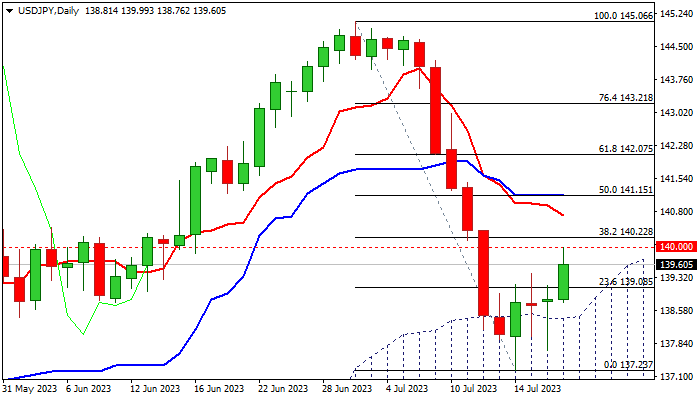
USDJPY accelerated higher on Wednesday and dented psychological 140 barrier (reinforced by falling 10DMA), the lower boundary of pivotal resistance zone at 140.00/22 (140.22 is Fibo 38.2% of 145.06/137.23 bear-leg).
Fresh strength adds to reversal signals after recovery started last Friday, forming bullish engulfing pattern, but paused on Mon /Tue (double-Doji), though kept bullish bias as the price action remained above the top of ascending daily Ichimoku cloud.
Near-term structure improved, but technical studies on daily chart are still mixed (14-d momentum is deeply in negative territory, while RSI and stochastic are trending up and MA’s are in mixed configuration.
Firm break through 140.00/22 zone is needed to strengthen bulls and spark further recovery, with the action being underpinned by rising daily cloud.
However, headwinds at key resistances are strong and may obstruct recovery, with failure to break 140.00/22 pivots, to keep the downside vulnerable, but with limited risk while daily cloud contains dips.
Res: 140.00; 140.22; 140.71; 141.15.
Sup: 139.40; 138.43; 137.68; 137.23.
USD/JPY Mid-Day Outlook
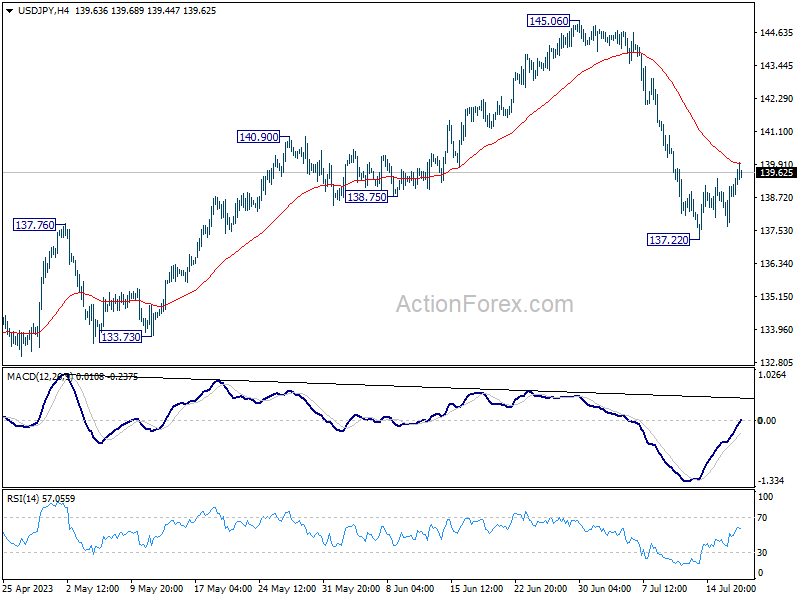
Daily Pivots: (S1) 137.99; (P) 138.57; (R1) 139.41; More...
Strong resistance is expected from 55 4H EMA (now at 139.94) to complete the recovery from 137.22. Break of 137.22 and sustained trading below 137.90 resistance turned support will confirm the larger bearish case, and target 127.20 and below. Nevertheless, sustained trading above 55 4H EMA will turn bias back to the upside for stronger rebound.
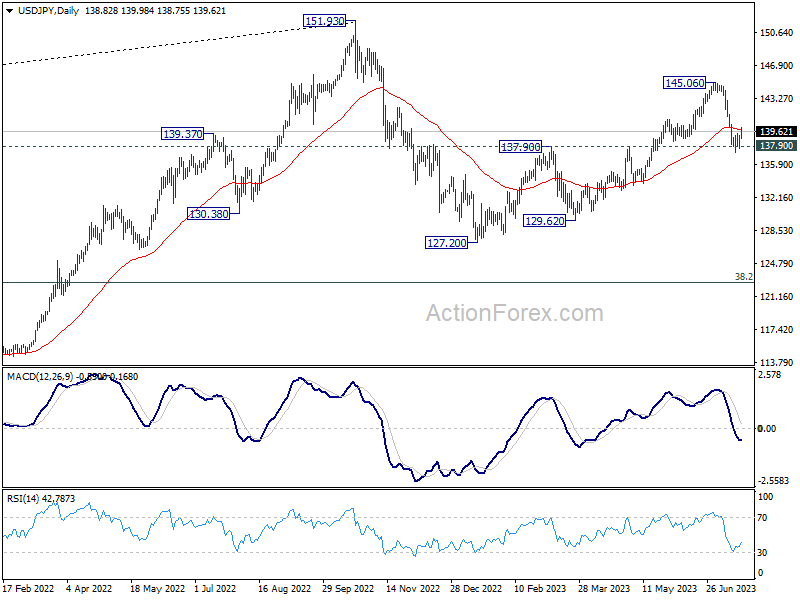
In the bigger picture, fall from 145.06 is seen as the third leg of the corrective pattern from 151.93 (2022 high). Sustained break of 137.90 resistance turned support should confirm this case and target 127.20 (2023 low) and below. For now, this will remain the favored case as long as 145.06 resistance holds, even in case of strong rebound.
USD/CHF Mid-Day Outlook
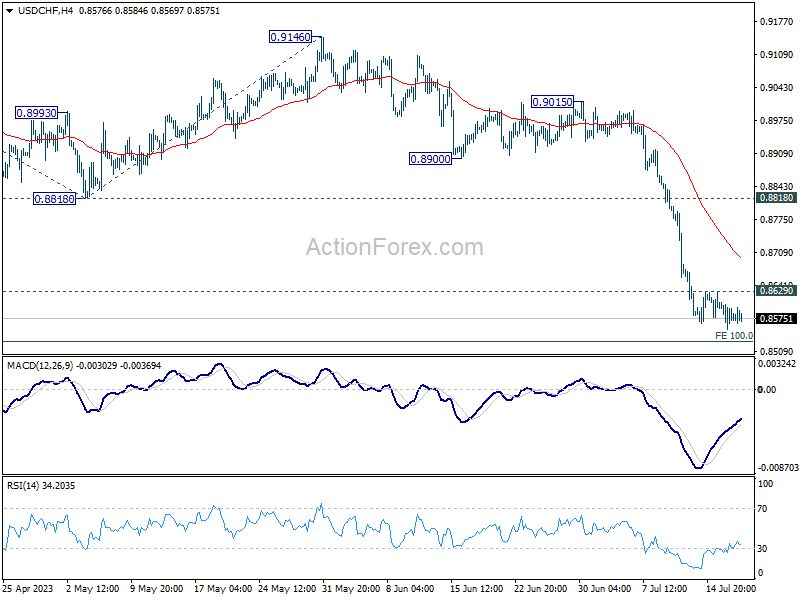
Daily Pivots: (S1) 0.8552; (P) 0.8580; (R1) 0.8604; More...
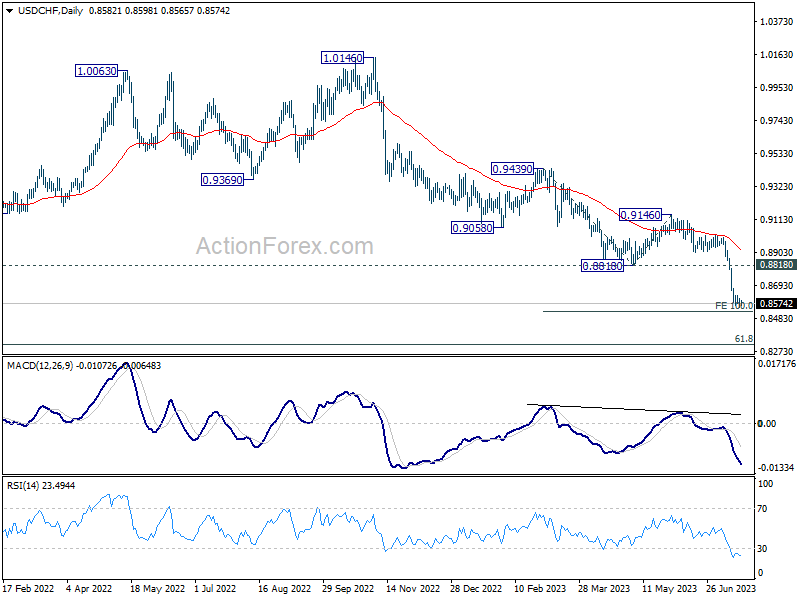
No change in USD/CHF's outlook. While further decline cannot be ruled out, based on loss of downside momentum as seen in 4H MACD, some support could be seen from 100% projection of 0.9439 to 0.8818 from 0.9146 at 0.8525 to bring rebound. Break of 0.8629 minor resistance will turn bias to the downside for 55 4H EMA (now at 0.8695) and above.
In the bigger picture, the break of 0.8756 (2021 low) indicates break out from the long term range pattern. For now, medium term outlook will stay bearish as long as 0.9146 resistance holds. Further fall would be seen to 61.8% retracement of 0.7065 (2011 low) to 1.0342 (2016 high) at 0.8317 next.
EUR/USD Mid-Day Outlook
Daily Pivots: (S1) 1.1199; (P) 1.1238; (R1) 1.1266; More...
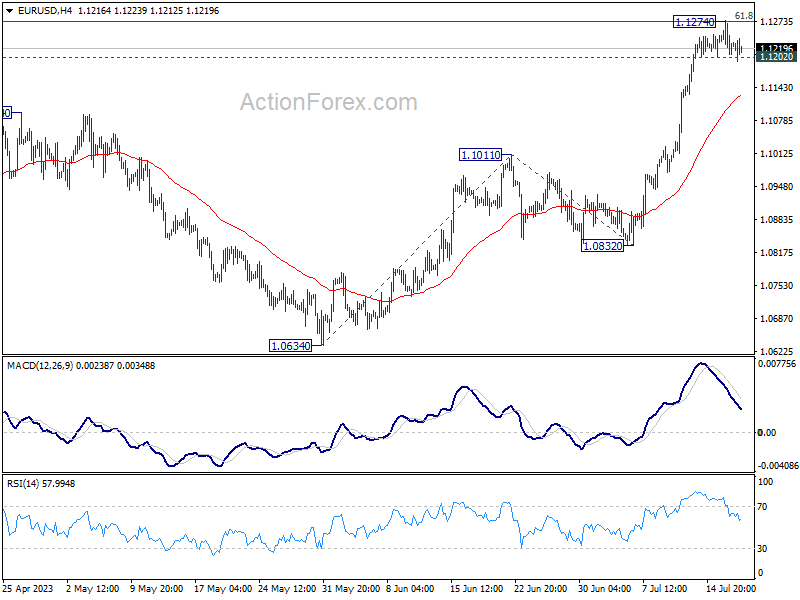
Intraday bias in EUR/USD remains neutral for the moment. On the downside, break of 1.1202 minor support will indicate rejection by 1.1273 fibonacci level. Intraday bias will be back on the downside for deeper pull back to 55 4H EMA (now at 1.1129) and possibly below. Nevertheless, sustained break of 1.1273 will extend larger up trend to 161.8% projection of 1.0634 to 1.1011 from 1.0832 at 1.1442 next.
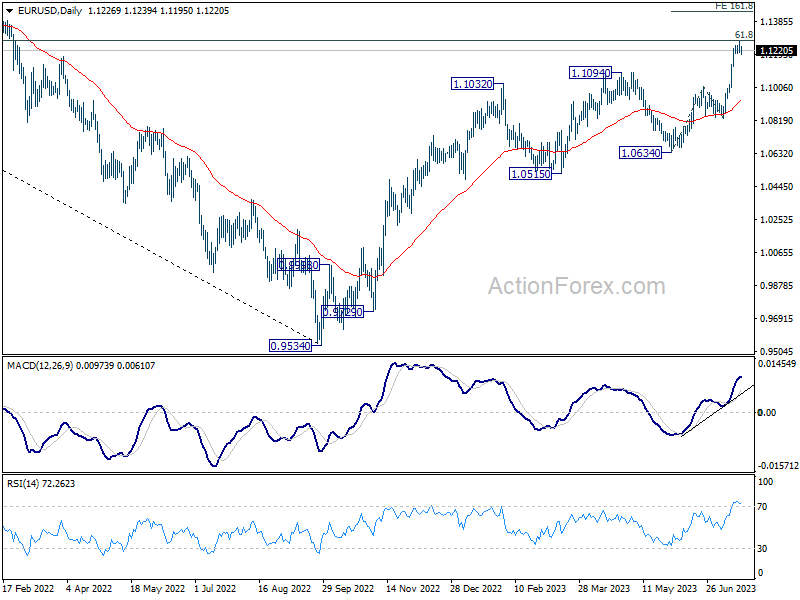
In the bigger picture, as rise from 0.9534 extends, focus is now on 61.8% retracement of 1.2348 (2021 high) to 0.9534 at 1.1273. Sustained break there will solidify the case of bullish trend reversal and target 1.2348 resistance next. Meanwhile, outlook will continue to stay bullish as long as 1.0832 support holds, even in case of deep pull back.
GBP/USD Mid-Day Outlook
Daily Pivots: (S1) 1.3000; (P) 1.3063; (R1) 1.3098; More...
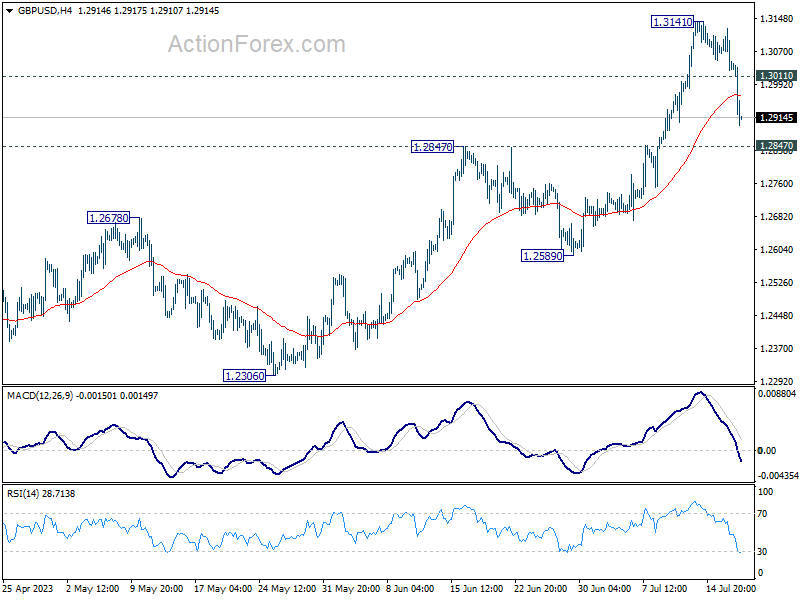
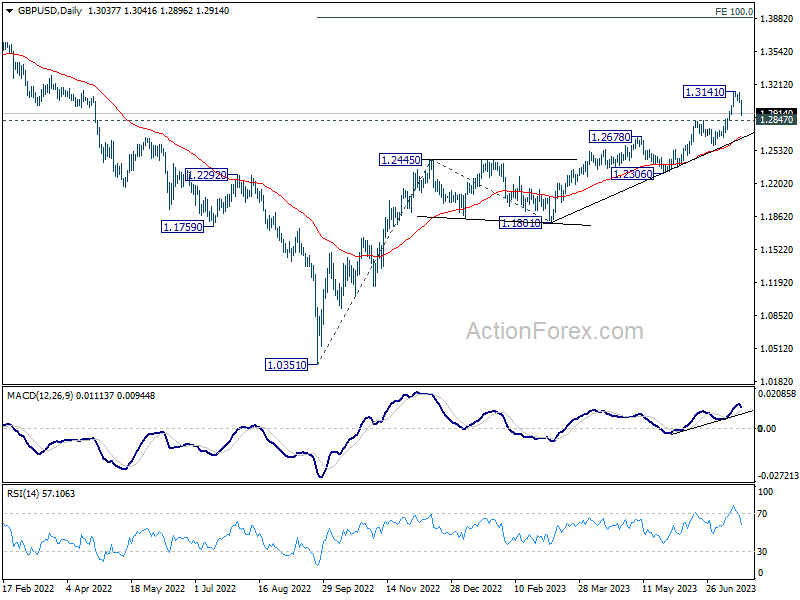
GBP/USD's correction from 1.3141 is still in progress and deeper decline could be seen. But near term outlook will stay bullish as long as 1.2847 resistance turned support holds. On the upside, above 1.3011 minor resistance will turn bias back to the upside for retesting 1.3141 high. Nevertheless, decisive break of 1.2847 will argue that larger correction is underway and target 1.2589 support next.
In the bigger picture, rise from 1.0351 medium term bottom (2022 low) is in progress. Next target is 100% projection of 1.0351 to 1.2445 from 1.1801 at 1.3895. Break there will target 1.4248 key long term resistance (2021 high) next. This will now remain the favored case as long as 1.2678 resistance turned support holds.
Sterling Selloff Continues Amid Dwindling Expectations of Aggressive BoE Hike, Dollar Might Recover Further
Sterling continues its descent, which was spurred on by the fallout from UK CPI data, in early US session. The odds of a 50 bps rate hike from BoE in August are being reassessed, now standing at a mere 50% probability. Furthermore, expectations of a peak rate have also dipped, falling below the 6% threshold.
Australian Dollar is taking a hit as well, assuming the position of the second weakest currency for the day. This downturn is occurring concurrently with the Chinese Yuan and Copper prices. Yen, while the third weakest, is likely to face limited selling, at least until release of Japan's inflation data on Friday.
Conversely, Dollar, along with Swiss Franc and Euro, is showing signs of strength. The greenback's decline started slowing earlier in the week and there is prospect of a stronger recovery. However, the momentum of Dollar is more likely to be influenced by developments in other major currencies rather than its own intrinsic factors.
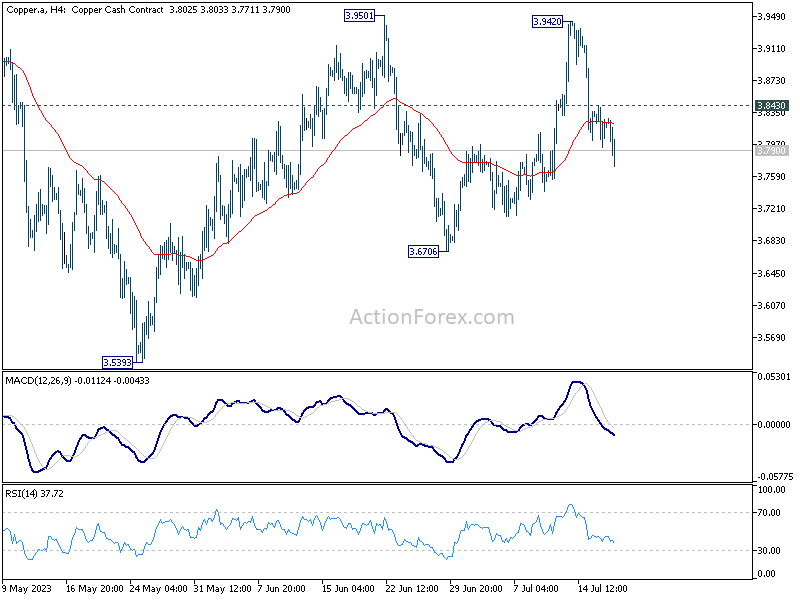
Technically, Copper's fall from 3.942 is currently seen as the third leg of the pattern from 3.9501 only. While deeper decline cannot be ruled out, downside should be contained above 3.6706 support. Indeed, break above 3.843 minor resistance will bring stronger rebound back to retest 3.9420/9501 resistance zone. In case of a rebound, AUD/USD would likely follow higher, even if there is slight downside surprises in Australia employment data tomorrow.
In Europe, at the time of writing, FTSE is up 1.68%. DAX is down -0.16%. CAC is up 0.12%. Germany 10-year yield is down -0.0054 at 2.383. Earlier in Asia, Nikkei rose 1.24%. Hong Kong HSI dropped -0.33%. China Shanghai SSE rose 0.03%. Singapore Strait Times rose 0.64%. Japan 10-year JGB yield dropped -0.0195 to 0.467.
Eurozone CPI finalized at 5.5% in Jun, core CPI at 5.5%
Eurozone CPI was finalized at 5.5% yoy in June, down from May's 6.1% yoy. Core CPI (excluding energy, food, alcohol & tobacco) was finalized at 5.5% yoy, up from May's 5.3% yoy.
The highest contribution to annual Eurozone inflation rate came from food, alcohol & tobacco (+2.35%), followed by services (+2.31%), non-energy industrial goods (+1.42%) and energy (-0.57%).
EU CPI was finalized at 6.4% yoy, down from May's 7.1% yoy. The lowest annual rates were registered in Luxembourg (1.0%), Belgium and Spain (both 1.6%). The highest annual rates were recorded in Hungary (19.9%), Slovakia (11.3%) and Czechia (11.2%). Compared with May, annual inflation fell in twenty-five Member States, remained stable in one and rose in one.
UK CPI eased to 7.9% in Jun, core CPI down to 6.9%, both below expectations
UK CPI slowed from 8.7% yoy to 7.9% yoy in June, below expectation of 8.2% yoy. Core CPI (excluding energy, food, alcohol and tobacco) slowed from 7.1% yoy to 6.9% yoy, below expectation of staying unchanged at 7.1% yoy.
CPI goods slowed from 9.7% yoy to 8.5% yoy. CPI services also eased from 7.4% yoy to 7.2% yoy.
On a monthly basis, CPI rose just 0.1% mom, down from May's 0.7% mom. Falling prices for motor fuel led to the largest downward contribution to the monthly change.
Also released, RPI came in at 0.3% mom, 10.7% yoy, versus expectation of 0.3% mom, 10.9% yoy. PPI input was at -1.3% mom, 2.7% yoy. PPI output was at -0.3% mom, 0.1% yoy. PPI core output was at -0.20% mom, 3.00% yoy.
New Zealand's Q2 CPI beats expectations despite slowdown
New Zealand's CPI experienced a slightly slowed but stronger-than-expected rise in Q2, registering 1.1% qoq increase compared to Q1's 1.2% qoq. This exceeded the anticipated 0.9% qoq rise for the quarter. Year-on-year inflation also surpassed expectations, with 6.0% yoy rise as opposed to expected 5.9% yoy, despite slowdown from 6.7% yoy in the previous quarter.
StatsNZ, New Zealand's pointed out that food prices, which rose 2.2% qoq and 12.3% yoy, were the primary drivers of Q2 annual inflation rate. Rising prices for vegetables, ready-to-eat food, and dairy products like milk, cheese, and eggs played a significant role. Housing and household utilities, another crucial sector, experienced quarterly increase of 1.2% qoq and 6.0% yoy increase annually.
On analyzing the CPI data further, it was found that excluding food, inflation increased by 4.6% yoy. Excluding housing and household utilities, it increased by 6.1% yoy. When excluding alcoholic beverages and tobacco, the annual increase stood at 5.9% yoy. CPI increased by 6.1% yoy when food, household energy, and vehicle fuels were excluded.
Australia leading index records 11th consecutive negative month
Australia's Westpac Leading Index rose to -0.51% in June from -1.01% in May, marking the eleventh consecutive negative print. This trend indicates that the Australian economy is likely to operate below its potential trend over the six to nine months outlook.
In light of these results, Westpac maintains a modest forecast for Australian economic growth. It expects modest expansion of 0.3% over the year to June 2024, with contraction in consumer spending of -0.2%.
Commenting on the upcoming RBA meeting on August 1, Westpac anticipates a 25 bps hike in interest rate. It noted, "By the August meeting we expect that the Board will be dealing with an inflation read still above 6%; an unemployment rate registering nearly 1ppt below the Board's current estimate of full employment; and the recent report from the national accounts showing unit labour costs growing at 7.9% over the year."
GBP/USD Mid-Day Outlook
Daily Pivots: (S1) 1.3000; (P) 1.3063; (R1) 1.3098; More...
GBP/USD's correction from 1.3141 is still in progress and deeper decline could be seen. But near term outlook will stay bullish as long as 1.2847 resistance turned support holds. On the upside, above 1.3011 minor resistance will turn bias back to the upside for retesting 1.3141 high. Nevertheless, decisive break of 1.2847 will argue that larger correction is underway and target 1.2589 support next.
In the bigger picture, rise from 1.0351 medium term bottom (2022 low) is in progress. Next target is 100% projection of 1.0351 to 1.2445 from 1.1801 at 1.3895. Break there will target 1.4248 key long term resistance (2021 high) next. This will now remain the favored case as long as 1.2678 resistance turned support holds.
Economic Indicators Update
| GMT | Ccy | Events | Actual | Forecast | Previous | Revised |
|---|---|---|---|---|---|---|
| 22:45 | NZD | CPI Q/Q Q2 | 1.10% | 0.90% | 1.20% | |
| 22:45 | NZD | CPI Y/Y Q2 | 6.00% | 5.90% | 6.70% | |
| 00:30 | AUD | Westpac Leading Index M/M Jun | 0.10% | -0.30% | ||
| 06:00 | GBP | CPI M/M Jun | 0.10% | 0.40% | 0.70% | |
| 06:00 | GBP | CPI Y/Y Jun | 7.90% | 8.20% | 8.70% | |
| 06:00 | GBP | Core CPI Y/Y Jun | 6.90% | 7.10% | 7.10% | |
| 06:00 | GBP | RPI M/M Jun | 0.30% | 0.30% | 0.70% | |
| 06:00 | GBP | RPI Y/Y Jun | 10.70% | 10.90% | 11.30% | |
| 06:00 | GBP | PPI Input M/M Jun | -1.30% | -0.20% | -1.50% | -1.20% |
| 06:00 | GBP | PPI Input Y/Y Jun | -2.70% | -3.30% | 0.50% | |
| 06:00 | GBP | PPI Output M/M Jun | -0.30% | -0.30% | -0.50% | |
| 06:00 | GBP | PPI Output Y/Y Jun | 0.10% | 1.60% | 2.90% | 2.70% |
| 06:00 | GBP | PPI Core Output M/M Jun | -0.20% | -0.20% | -0.30% | -0.50% |
| 06:00 | GBP | PPI Core Output Y/Y Jun | 3.00% | 2.80% | 4.10% | 3.90% |
| 09:00 | EUR | Eurozone CPI Y/Y Jun F | 5.50% | 5.50% | 5.50% | |
| 09:00 | EUR | Eurozone CPI Core Y/Y Jun F | 5.50% | 5.40% | 5.40% | |
| 12:30 | USD | Building Permits Jun | 1.44M | 1.48M | 1.49M | |
| 12:30 | USD | Housing Starts Jun | 1.43M | 1.47M | 1.63M | |
| 14:30 | USD | Crude Oil Inventories | -2.0M | 5.9M |
Sterling Takes a Tumble as Inflation Falls
- UK inflation eases more than expected
- British pound tumbles close to 1%
Pound slides as UK inflation lower than expected
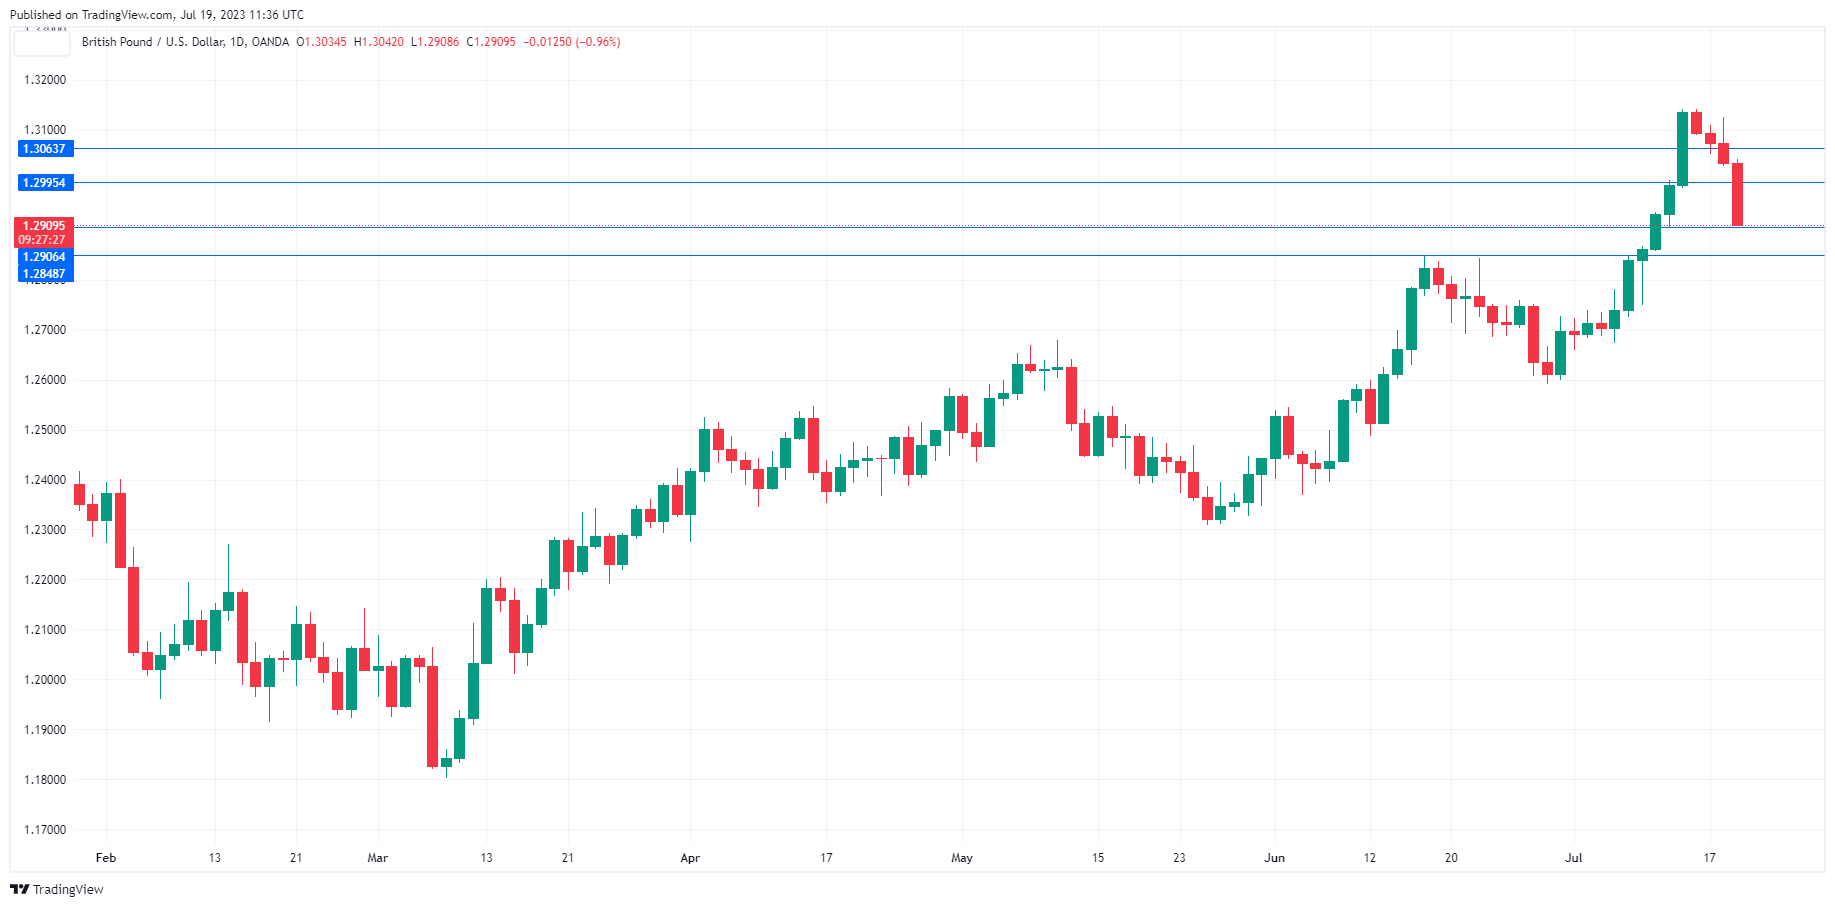
The British pound is sharply lower on Wednesday. In the European session, GBP/USD is trading at 1.2916, down 0.92%. The pound’s fall was driven by Wednesday’s UK inflation report, which showed that CPI fell to 7.9% in June, down from 8.7% in May. This marked the lowest inflation level since February 2022. The decline was driven by lower prices for food and motor fuel. Core CPI declined slightly, from 7.1% to 6.9%.
Investors gave the positive inflation two thumbs up, with the markets now expecting the cash rate to peak around 6%, compared to 6.5% earlier in July. The markets have revised lower expectations for a 0.50% hike from the BoE in August to about one in two – prior to the inflation report, a 0.50% increase was almost fully priced in. As well, the yield on two-year gilts fell more than 20 basis points to 4.86% after the inflation report.
The Bank of England has a rough time with inflation, which remains high despite the BoE’s aggressive tightening cycle. The BoE desperately needed a positive inflation report and will also be encouraged by services inflation, a key gauge of domestic inflation, which fell to 7.2% in June, down from 7.4% in May.
Inflation is moving in the right direction, albeit slowly. The BoE’s target of 2% remains far away and core inflation has been persistently high. The BoE will likely need to continue raising rates in the coming months in order to bring inflation closer to target. The UK boasts the record for the highest inflation rate in the G-7 and the government has set its sights on pushing inflation lower to 5%.
GBP/USD Technical
- GBP/USD has support at 1.2995 and 1.2906
- There is resistance at 1.3077 and 1.3116
Eurozone CPI finalized at 5.5% in Jun, core CPI at 5.5%
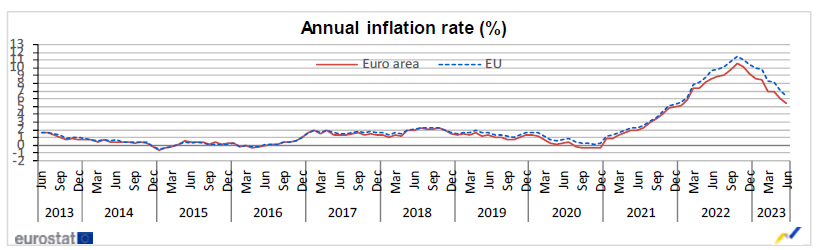
Eurozone CPI was finalized at 5.5% yoy in June, down from May's 6.1% yoy. Core CPI (excluding energy, food, alcohol & tobacco) was finalized at 5.5% yoy, up from May's 5.3% yoy.
The highest contribution to annual Eurozone inflation rate came from food, alcohol & tobacco (+2.35%), followed by services (+2.31%), non-energy industrial goods (+1.42%) and energy (-0.57%).
EU CPI was finalized at 6.4% yoy, down from May's 7.1% yoy. The lowest annual rates were registered in Luxembourg (1.0%), Belgium and Spain (both 1.6%). The highest annual rates were recorded in Hungary (19.9%), Slovakia (11.3%) and Czechia (11.2%). Compared with May, annual inflation fell in twenty-five Member States, remained stable in one and rose in one.
EUR/USD Aims More Upsides, USD/CHF Turns Red
EUR/USD started a strong increase above the 1.1150 resistance. USD/CHF is showing bearish signs below the 0.8650 resistance zone.
Important Takeaways for EUR/USD and USD/CHF Analysis Today
- The Euro gained pace against the US Dollar after it broke the 1.1150 resistance.
- There is a major bullish trend line forming with support near 1.1225 on the hourly chart of EUR/USD at FXOpen.
- USD/CHF is consolidating losses below the 0.8650 resistance.
- There is a key bearish trend line forming with resistance near 0.8590 on the hourly chart at FXOpen.
EUR/USD Technical Analysis
On the hourly chart of EUR/USD at FXOpen, the pair started a strong increase and was able to settle above the 1.1150 resistance zone. The Euro even broke above 1.1200 to move into a bullish zone against the US Dollar.
Finally, it tested the 1.1275 zone. A high is formed near 1.1275 and the pair is now correcting gains. There was a move below the 23.6% Fib retracement level of the upward wave from the 1.1130 swing low to the 1.1275 high.
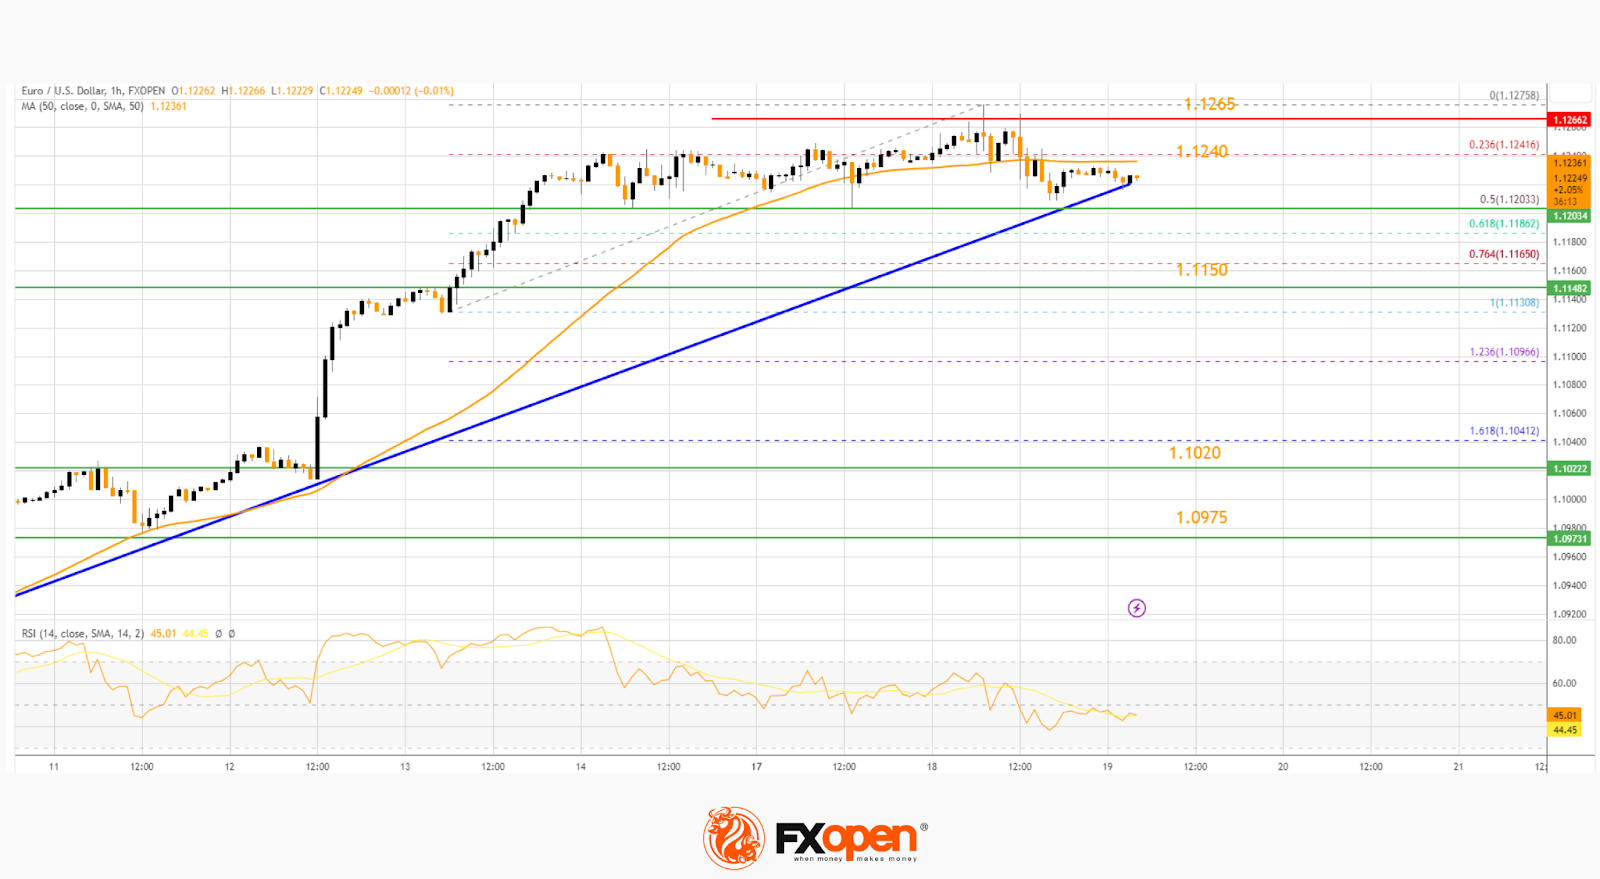
The pair is now trading below the 50-hour simple moving average. However, there is a major bullish trend line forming with support near 1.1225.
The next major support is near the 50% Fib retracement level of the upward wave from the 1.1130 swing low to the 1.1275 high, at 1.2000. A break below the 1.1200 support could send the pair toward the 1.1150 level.
Immediate resistance on the EUR/USD chart is near the 50-hour simple moving average at 1.1240. The first major resistance is near the 1.1265 level.
An upside break above 1.1265 might send the pair toward the 1.1320 level. The next major resistance is near the 1.1365 level. Any more gains might open the doors for a move toward 1.1440.
USD/CHF Technical Analysis
On the hourly chart of USD/CHF at FXOpen, the pair started a major decline from well above 0.8800. The US Dollar gained bearish momentum after it broke the 0.8600 level against the Swiss Franc.
The pair even declined below 0.8650 and tested 0.8570. A low is formed near 0.8569 and the pair is now consolidating losses. On the upside, USD/CHF is now facing resistance near a key bearish trend line at 0.8590.
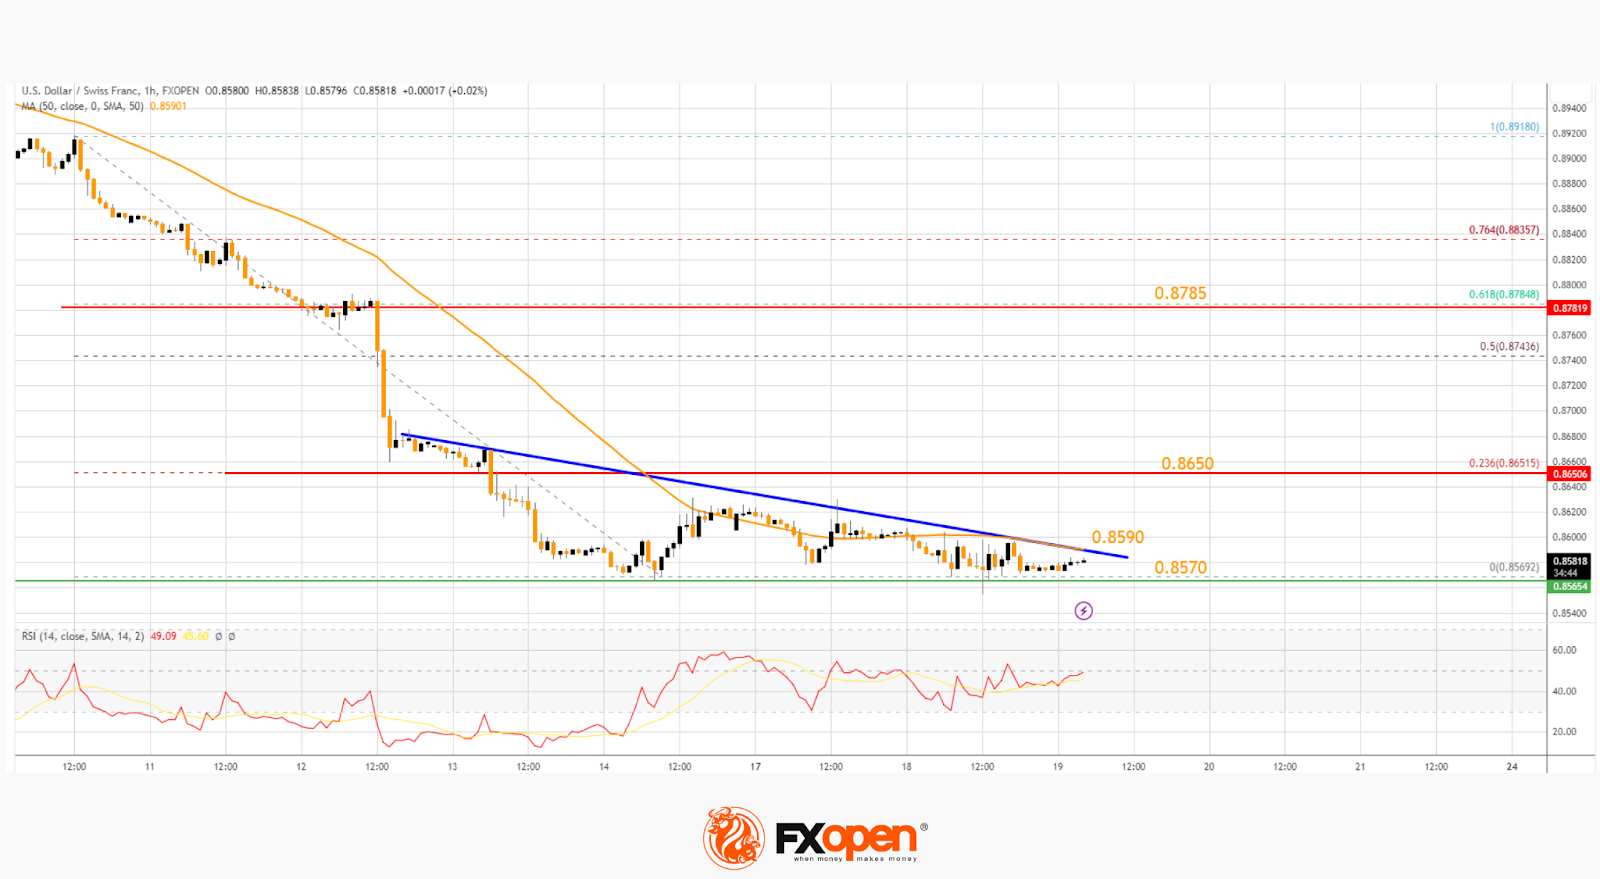
The trend line is near the 50-hour simple moving average. A break above it could send the pair toward the 23.6% Fib retracement level of the downward move from the 0.8918 swing high to the 0.8569 low, at 0.8650.
The next major resistance is near the 0.8785 level. If there is a clear break above the 0.8785 resistance zone, the pair could start another increase. In the stated case, it could even surpass 0.8880.
On the downside, immediate support on the USD/CHF chart is near 0.8570. The first major support is near the 0.8550 level. The next major support is near the 0.8510 level. Any more losses may possibly open the doors for a move toward the 0.8440 level in the coming days.