Sample Category Title
XAGUSD Analysis: Silver Price Up Over 7% in 2 Days
On Friday morning the price of silver was USD 24.8. The sharp rise was triggered by the weakening of the dollar on Wednesday, which was influenced by inflation data in the US.
When looking for reasons why silver is stronger than other commodity markets (for example, gold has risen in price by no more than 1.5% over the same period), you may not find satisfying explanations, but pay attention to information on twitter by Robert Kiyosaki (author of the books in the Rich Dad series). In his opinion, on August 22 in South Africa, at the BRICS forum, the creation of a currency backed by gold will be announced. Therefore, Robert predicts problems for the US dollar and suggests considering buying gold, silver, and bitcoin.
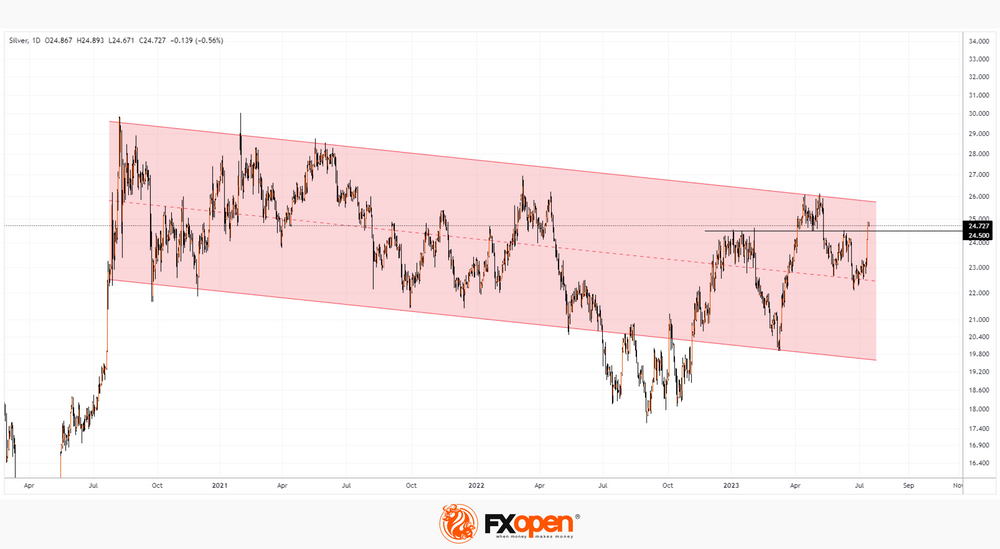
In the meantime, the XAG/USD chart shows that the price of silver has approached the upper boundary of the long-term descending channel (shown in red). If the bulls try to reach the upper border of the channel, then perhaps before that we will see a test of the level of 24.5, which previously served as both support and resistance.
Dollar Index: Price Can Consolidate Around 100, Before It Drops Further
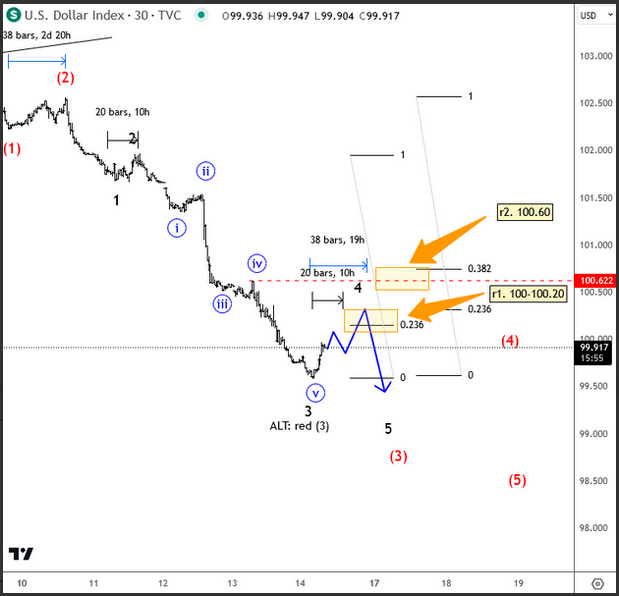
The USD is trading sharply lower this week after US CPI data comes out at 3.0%, so speculators sold USD as they believe that FED is closer to end its hawkish policy. We see stocks in an uptrend with crude oil, while finally, metals are also showing some signs of life after US yields come down and the Chinese yuan recovers. Looking at the DXY, it's a very nice ongoing weakness that can resume even lower, but maybe next week as price can see some back-and-forth moves here around 100 levle. First resistance for wave four is at 100/100.20, then 100.60. When this downtrend is ready to resume,t hats when other assets will see more gains.
EUR/GBP Daily Outlook
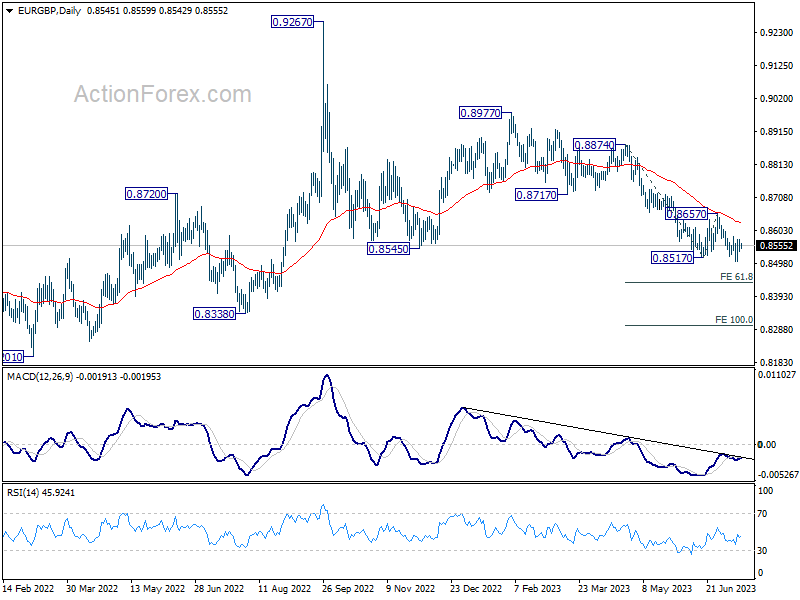
Daily Pivots: (S1) 0.8529; (P) 0.8552; (R1) 0.8569; More...
No change in EUR/GBP's outlook and intraday bias stays neutral. Near term outlook will stay bearish as long as 0.8657 resistance holds. Break of 0.8502 will resume larger decline from 0.8977 to 61.8% projection of 0.8874 to 0.8517 from 0.8650 at 0.8436. However, firm break of 0.8583 will bring stronger rebound back to 0.8657 resistance.
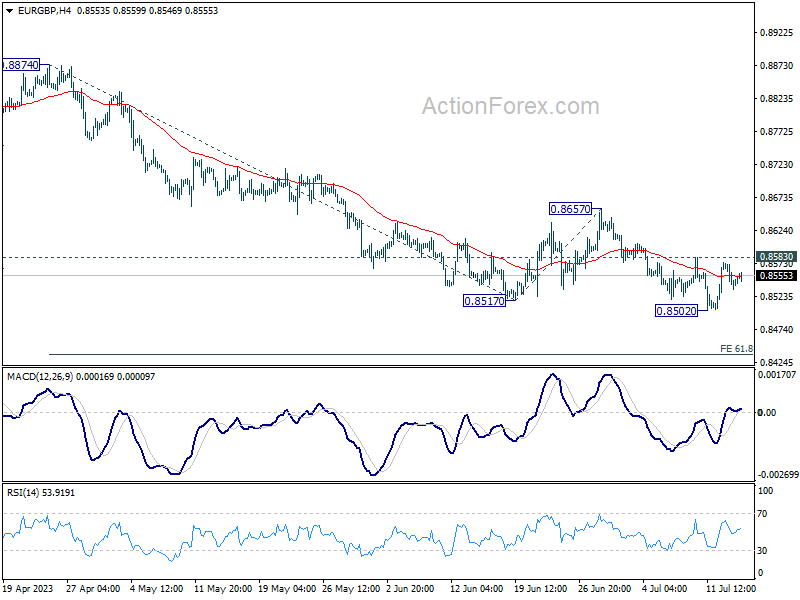
In the bigger picture, the down trend from 0.9267 (2022 high) is still in progress. It's seen as part of the long term range pattern from 0.9499 (2020 high). Deeper fall could be seen towards 0.8201 (2022 low). But strong support should be seen from there to bring reversal. This will now remain the favored case as long as 0.8657 resistance holds.
EUR/AUD Daily Outlook
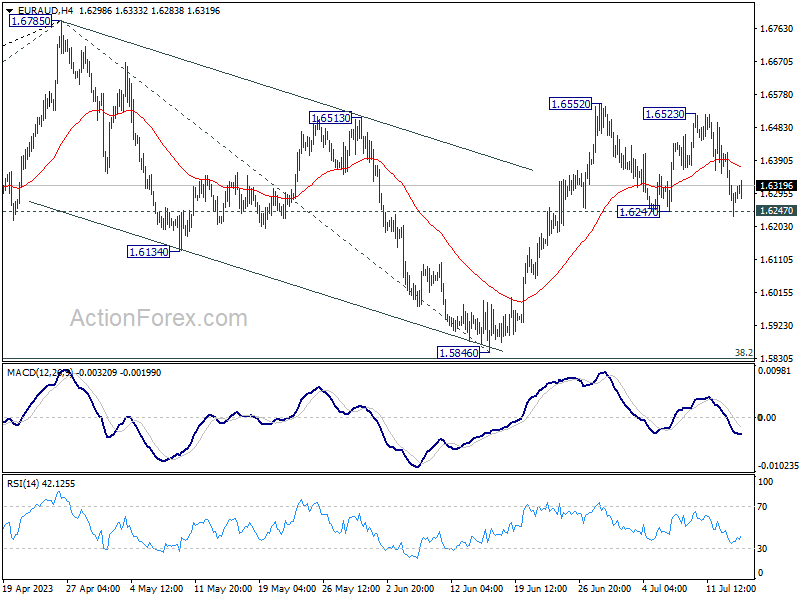
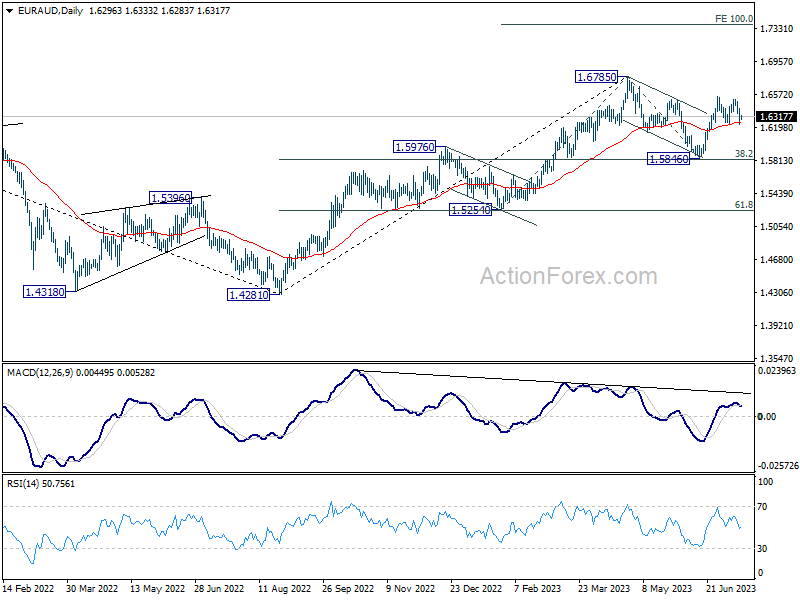
Daily Pivots: (S1) 1.6216; (P) 1.6315; (R1) 1.6396; More...
Intraday bias in EUR/AUD stays neutral for the moment as range trading continues. With 1.6247 support intact, further rally is expected. As noted before, correction from 1.6785 should have completed with three waves down to 1.5846. Above 1.6552 will target a retest on 1.6785 high next. Nevertheless, on the downside, firm break of 1.6247 will dampen this view and turn bias to the downside for 1.5846 support.
In the bigger picture, with 38.2% retracement of 1.4281 to 1.6785 at 1.5828 intact, rally from 1.4281 is still in progress. Firm break of 1.6785 will confirm rise resumption. Next target is 100% projection of 1.5254 to 1.6785 from 1.5846 at 1.7377. On the other hand, rejection by 1.6785 will extend the corrective pattern with another fall leg. But outlook will stay bullish as long as 1.5828 holds.
GBP/JPY Daily Outlook
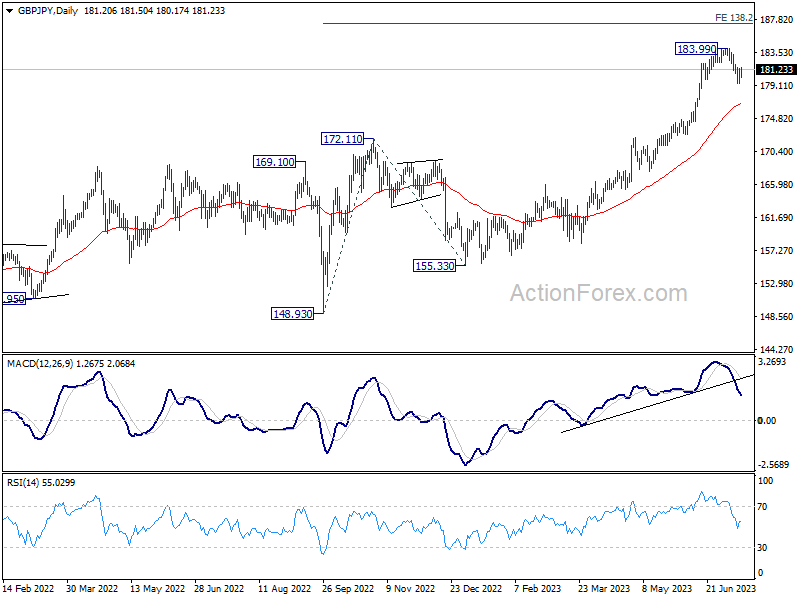
Daily Pivots: (S1) 180.07; (P) 180.77; (R1) 182.04; More...
Intraday bias in GBP/JPY remains neutral at this point. Further fall remains in favor, and break of 179.45 will target 55 D EMA (now at 176.65). On the upside, above 182.00 minor resistance will turn bias to the upside for retesting 183.99 high instead.
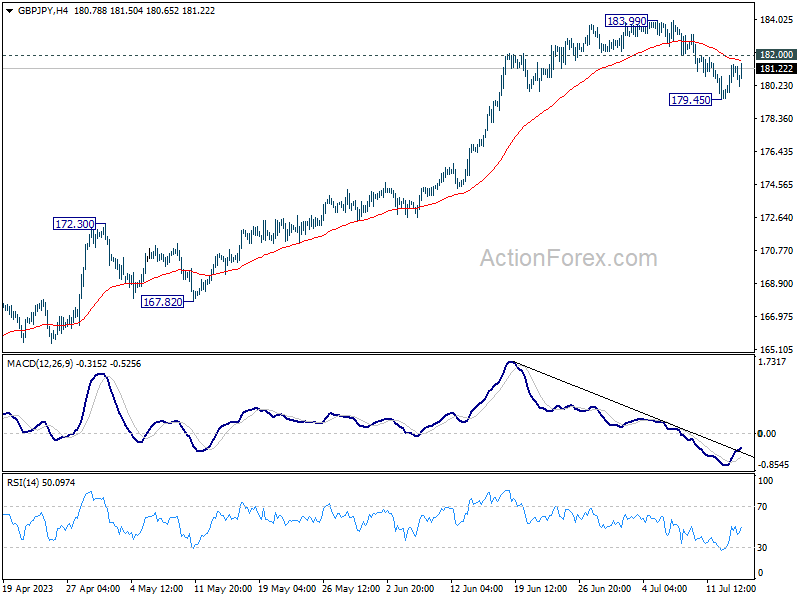
In the bigger picture, as long as 172.11 resistance turned support holds, uptrend from 123.94 (2020 low) is expected to continue. On resumption, next target is 195.86 (2015 high). Nevertheless, firm break of 172.11 will argue that larger correction is already underway.
EUR/JPY Daily Outlook
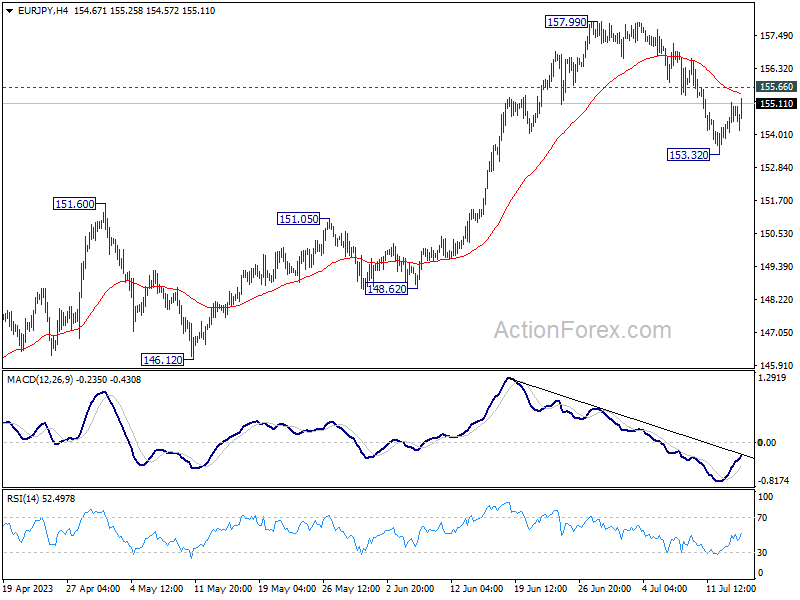
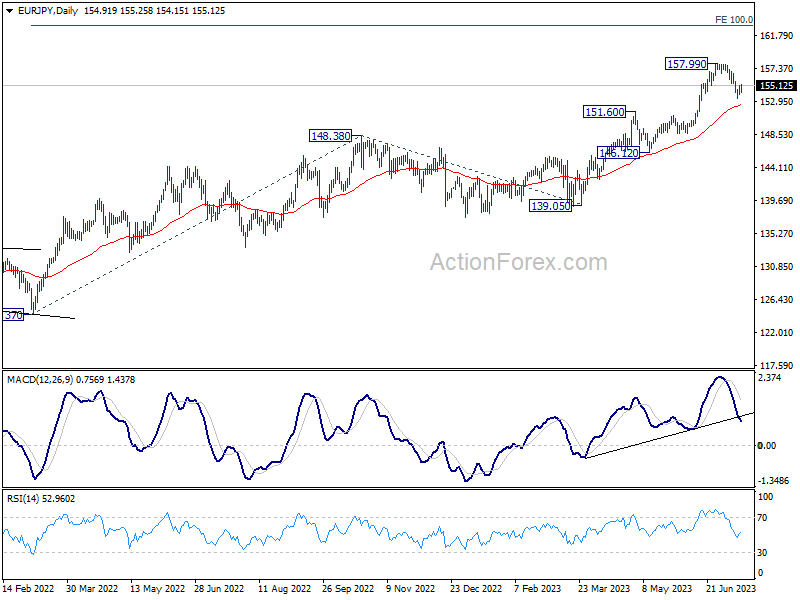
Daily Pivots: (S1) 154.21; (P) 154.67; (R1) 155.45; More....
Intraday bias in EUR/JPY remains neutral for the moment. Further decline is in favor as long as 155.66 minor resistance holds. Below 153.32 will target 55 D EMA (now at 152.36) and below. Nevertheless, above 155.66 will turn bias back to the upside for retesting 157.99 high instead.
In the bigger picture, as long as 151.60 resistance turned support holds, rise from 114.42 (2020 low) is in progress. On resumption, next target is 100% projection of 124.37 to 148.38 from 138.81 at 162.82. Nevertheless, sustained break of 151.60 will argue that larger correction is already underway.
EUR/CHF Daily Outlook
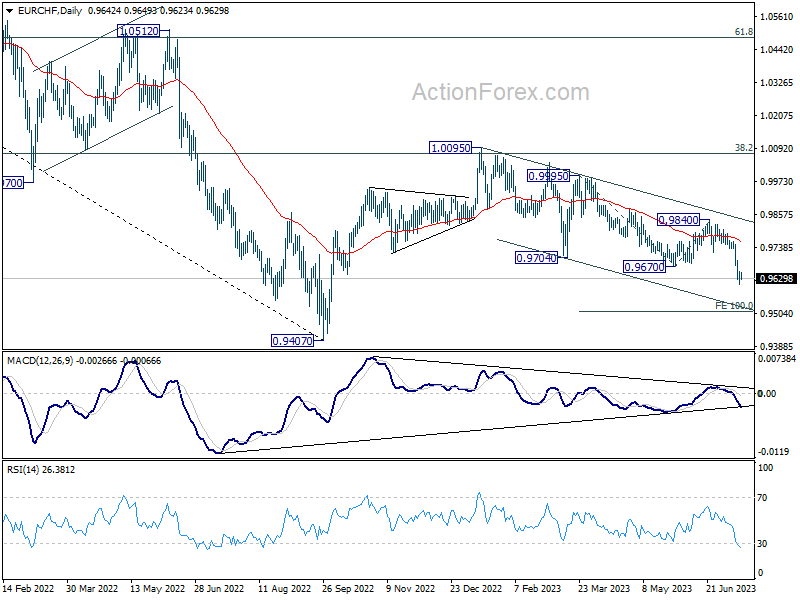
Daily Pivots: (S1) 0.9614; (P) 0.9636; (R1) 0.9663; More...
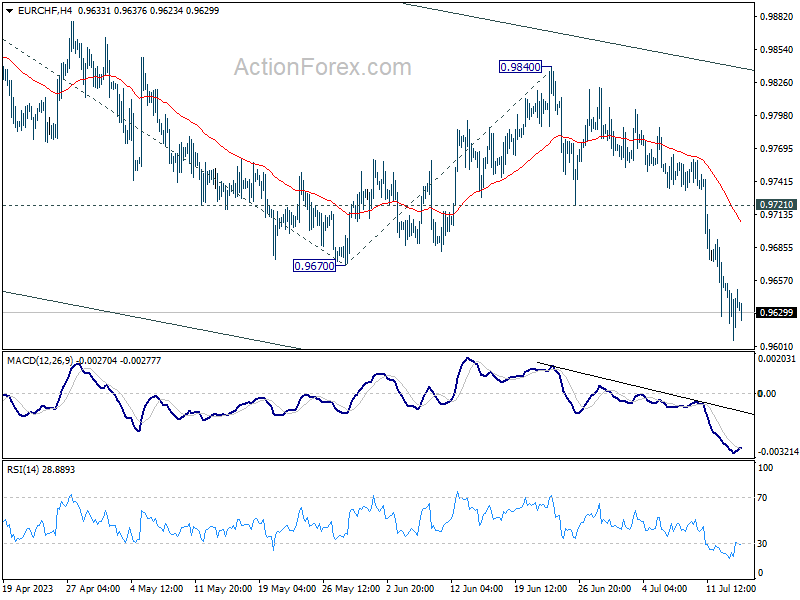
In the bigger picture, medium term outlook is staying bearish as the pair is capped below falling 55 W EMA (now at 0.9913). Down trend form 1.2004 (2018 high) is in favor to extend through 0.9407 at a later stage. Nevertheless, decisive break of 38.2% retracement of 1.1149 to 0.9407 will raise the chance of bullish trend reversal.
GBPJPY Correction Underway But Will It Last?
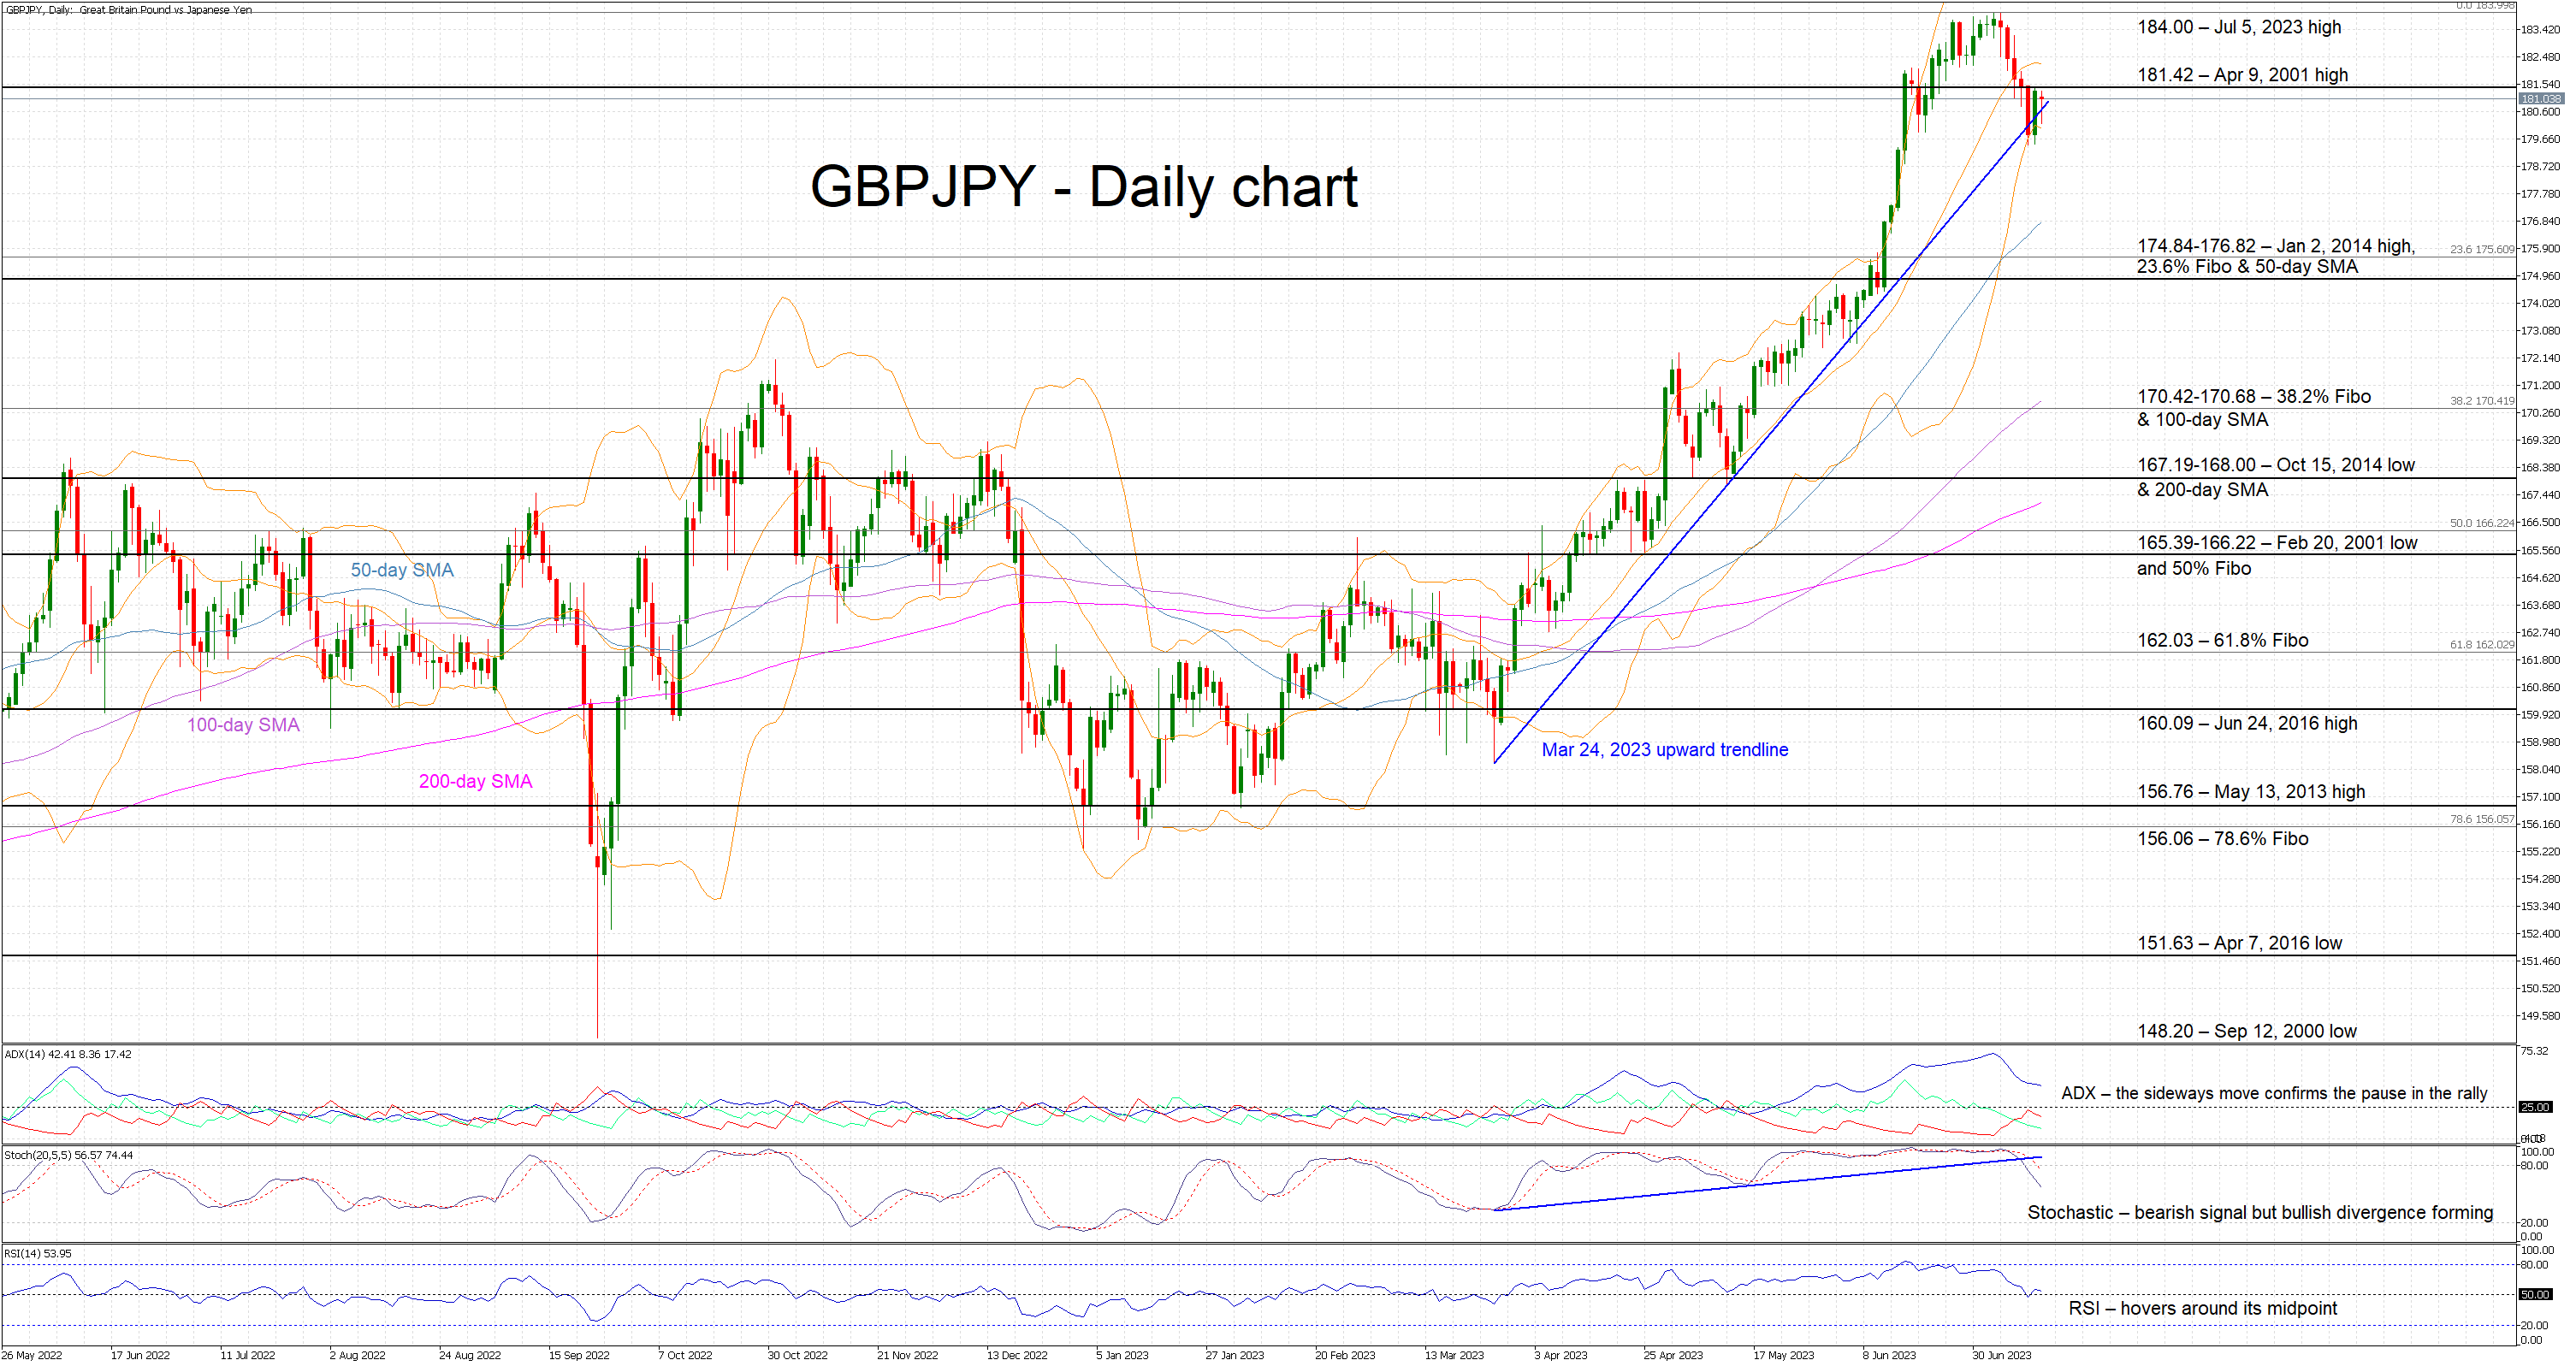
GBPJPY is trading sideways today as the first correction since the March 2023 lows is underway. The current drop has halted at the important March 23, 2023 upward sloping trendline with the pair now hovering a tad below the April 9, 2001 high of 181.42.
The overall technical picture is more mixed at this juncture as most indicators seem to have reset after significant advances. The Average Directional Movement Index (ADX) is moving sideways, following an aggressive drop from its recent highs, and thus confirming the current GBPJPY correction. Similarly, the RSI is again trading around its 50-midpoint.
More importantly, the stochastic oscillator is dropping lower in a vertical fashion, after spending two months in its overbought area. While this move confirms the bearish pressure in the market, it also points to a developing bullish divergence as the lower low in this indicator has been met by higher low in GBPJPY.
Should the bulls decide that the recent correction has run its course, they would first try to clear the 181.42 level. They would then have the chance to record another 2023 high, above the July 5, 2023 high of 184.00, and to push GBPJPY towards the 190 area, which is key from a long-term perspective.
On the other hand, the bears are probably feeling a bit optimistic on the back of the current correction. They are clearly keen for another pullback towards the busier 174.84-176.82 range that is populated by the January 2, 2014 high, the 23.6% Fibonacci retracement of the July 20, 2021 – July 5, 2023 uptrend and the 50-day simple moving average (SMA) respectively. Breaking this area could be extremely important from a short-term sentiment perspective and it will open the door for a move towards the 170.42-170.68 region.
To sum up, GBPJPY bears might finally have a reason to smile but the mixed messages from the momentum indicators could mean that the recent upleg might have not ended.
USD/CAD Daily Outlook
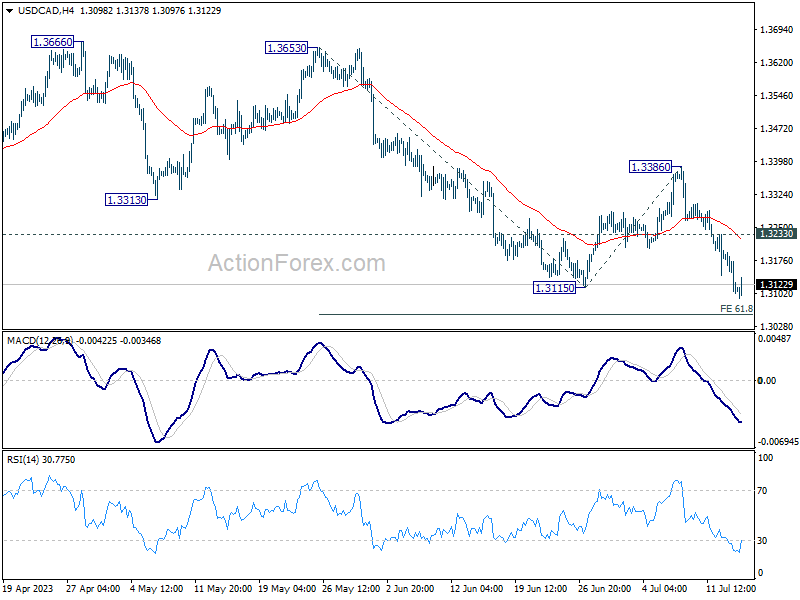
Daily Pivots: (S1) 1.3078; (P) 1.3136; (R1) 1.3169; More....
USD/CAD's fall is still in progress and intraday bias stays on the downside. Break of 1.3115 indicates resumption of larger down trend. Next targets are 61.8% projection of 1.3653 to 1.3115 from 1.3386 at 1.3054, and then 100% projection at 1.2848. On the upside, above 1.3233 minor resistance will turn intraday bias neutral first. But outlook will remain bearish as long as 1.3386 resistance holds, in case of recovery.
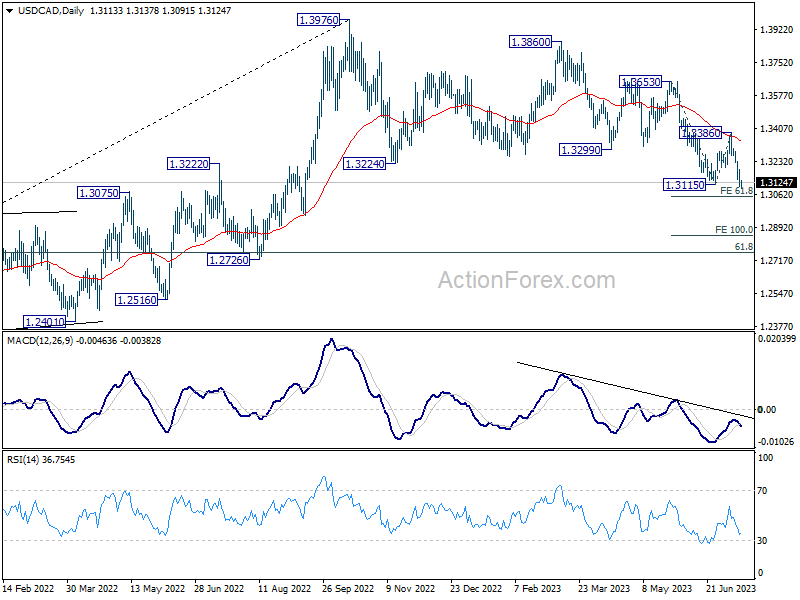
In the bigger picture, price actions from 1.3976 are viewed as a correction to up trend from 1.2005 (2021 low) only. Hence, the up trend is in favor to resume through 1.3976 at a later stage. Nevertheless, another fall below 1.3115 will extending the decline from 1.3976 to 61.8% retracement of 1.2005 to 1.3976 at 1.2758, and raise the chance of bearish trend reversal.
AUD/USD Daily Report
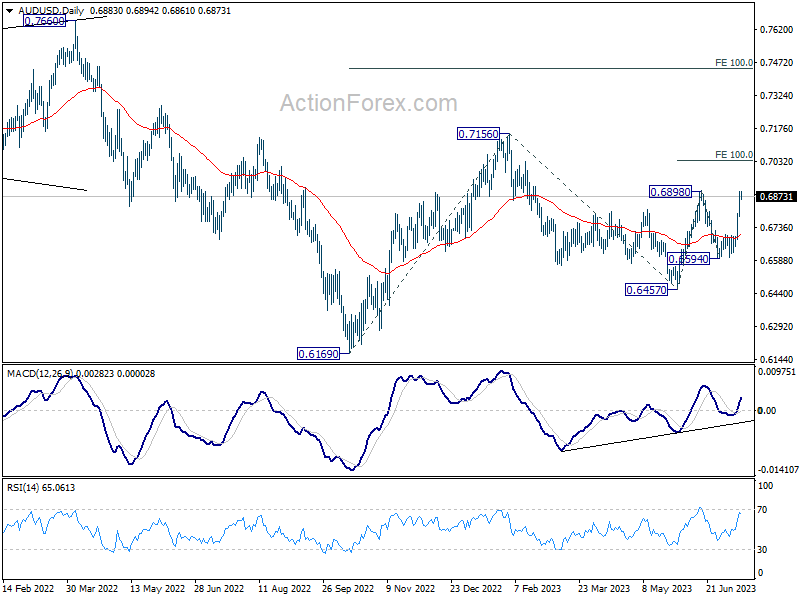
Daily Pivots: (S1) 0.6817; (P) 0.6856; (R1) 0.6928; More...
Intraday bias in AUD/USD remains on the upside with focus on 0.6898 resistance. Decisive break there will will firstly confirm resumption of rise from 0.6457. Secondly, that should also confirm completion of the fall from 0.7156 at 0.6457. Next target will be 100% projection of 0.6457 to 0.6898 from 0.6594 at 0.7035, and then 0.7156 resistance. On the downside, however, below 0.6840 minor support will turn intraday bias neutral first.
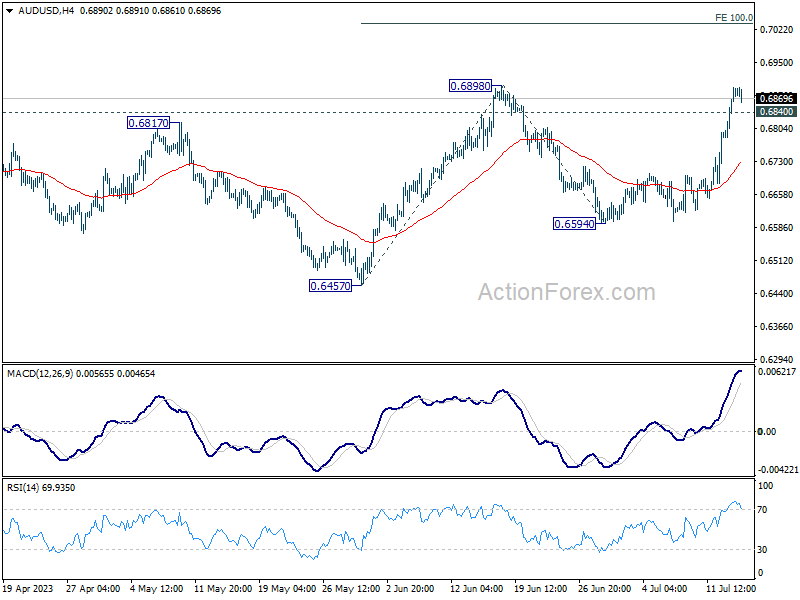
In the bigger picture, price actions from 0.7156 are seen as a correction to the rebound from 0.6169 (2022 low). Break of 0.6898 resistance will argue that rise from 0.6169 is ready to resume through 0.7156. Next target will be 100% projection of 0.6169 to 0.7156 from 0.6457 at 0.7444. For now, this will be the favored case as long as 55 D EMA (now at 0.6697) holds.