

Sample Category Title
EURUSD Extends Bullish Race; Resistance Nearby
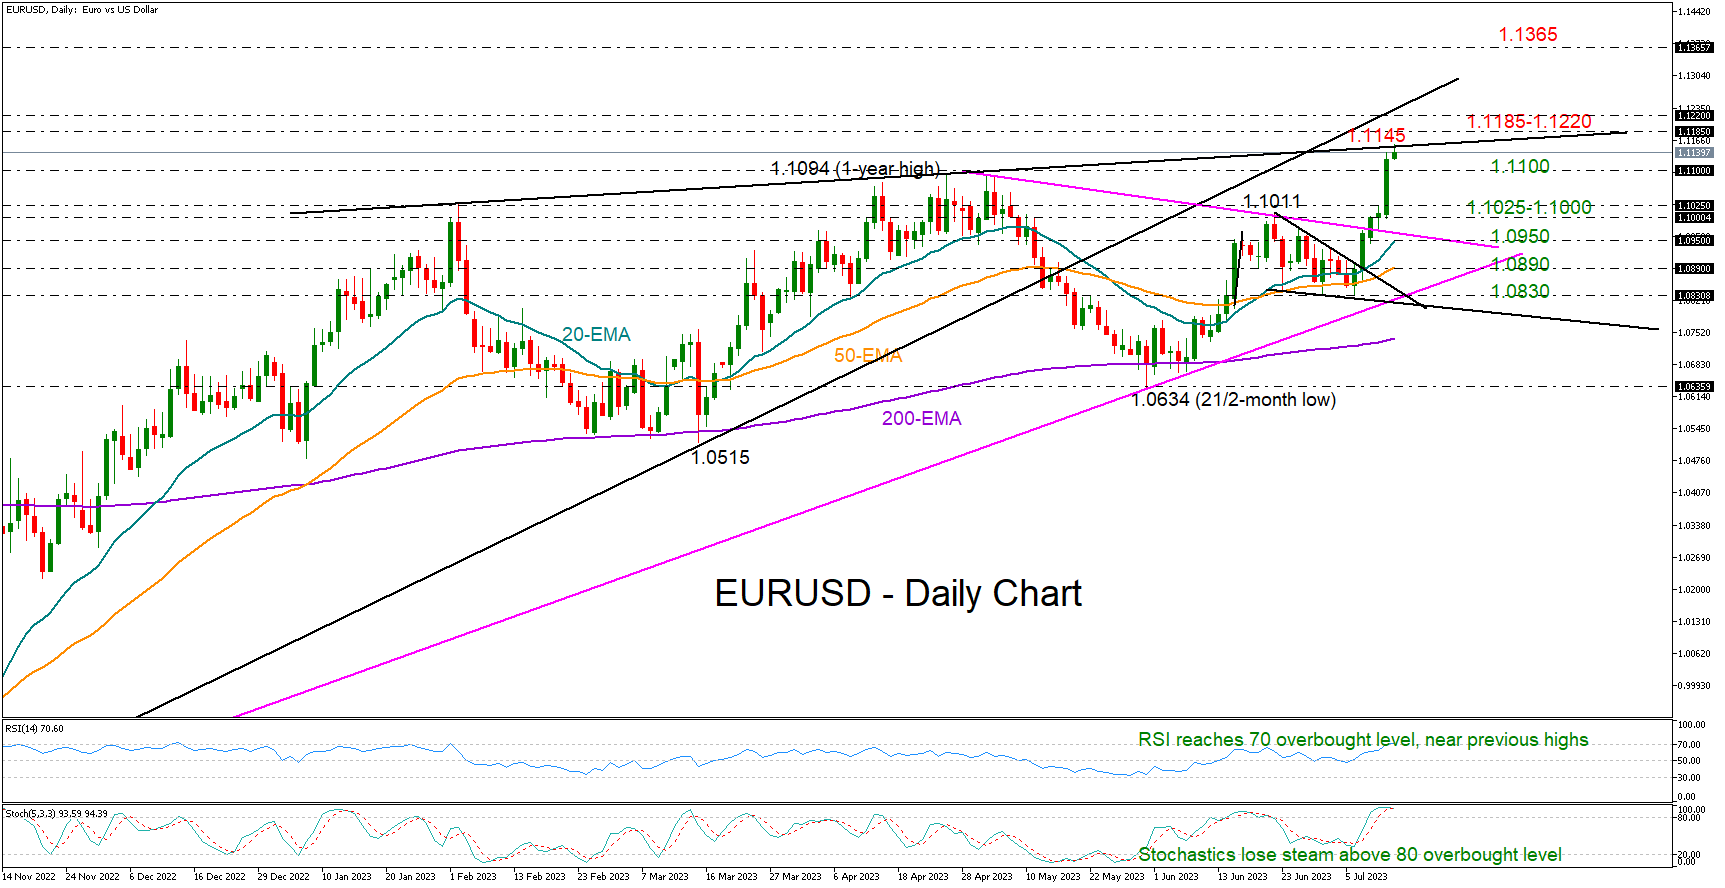
EURUSD skyrocketed to sixteen-month highs in the wake of the US CPI data on Wednesday, experiencing one of its best daily performances this year.
The pair inched up to a new high of 1.1147 early on Thursday, raising speculation that the bullish wave might have more room for improvement. That said, some caution might be necessary as the price is trading around the tentative resistance line from February at 1.1145 and slightly below the 1.1185-1.1220 constraining zone, which had been limiting both upside and downside movements during November 2021-March 2022. Note that the RSI and the stochastic oscillator have entered the overbought territory and are testing former resistance levels.
In the event the bulls pierce through the 1.1185-1.1220 wall, the next obstacle could develop around the 1.1365 barrier taken from the November 2021-February 2022 trading range. Another victory there could see an extension towards the January-February 2022 highs registered around 1.1480.
Should sellers press the price back below the 1.1100 psychological mark, the focus will turn to the 1.1025-1.1000 area. A step lower could then find immediate support around the 20-day exponential moving average (EMA), which is approaching the 1.0970 barrier. If downside forces further strengthen from there, the door will open for the 50-day EMA at 1.0890.
Summing up, EURUSD resumed a bullish outlook in the big picture following Wednesday’s exciting rally. The next challenge could occur within the 1.1145-1.1220 region.
AUD/USD Daily Report
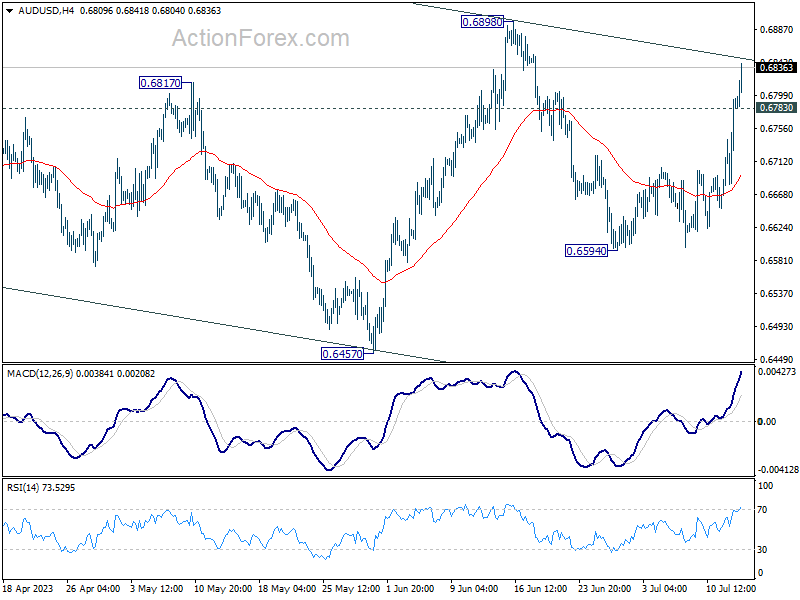
Daily Pivots: (S1) 0.6714; (P) 0.6755; (R1) 0.6829; More...
AUD/USD's rebound from 0.6594 resumed after brief retreat. Intraday bias is back on the upside for 0.6898 resistance next. Firm break there will firstly confirm resumption of rise from 0.6457. Secondly, that should also confirm completion of the fall from 0.7156 at 0.6457. Further rally should then be seen to 0.7156 next. On the downside, however, below 0.6783 minor support will turn intraday bias neutral again.
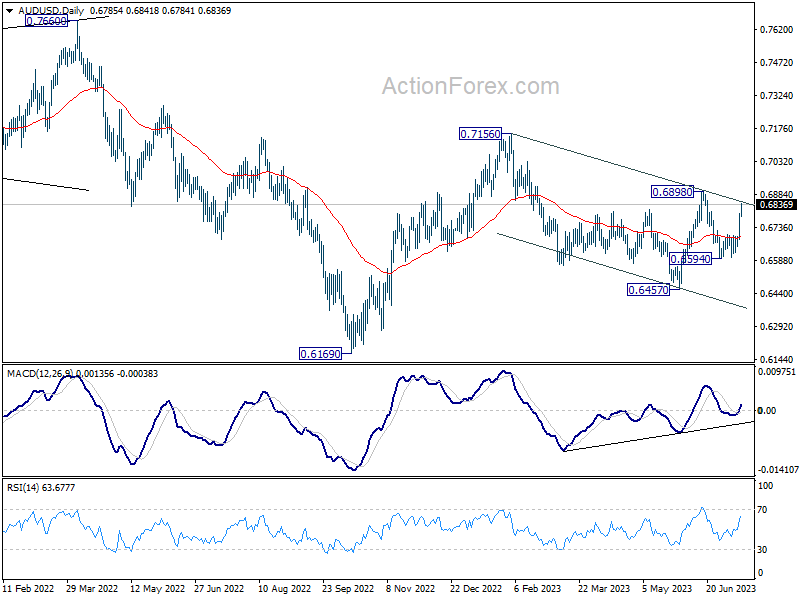
In the bigger picture, price actions from 0.7156 are seen as a correction to the rebound from 0.6169 only, rather than part of larger down trend from 0.8006 (2021 high). Break of 0.6457 could cannot be ruled out but downside should be contained above 0.6169. Meanwhile, break of 0.6898 resistance will argue that rise from 0.6169 is ready to resume through 0.7156.
USD/CAD Daily Outlook
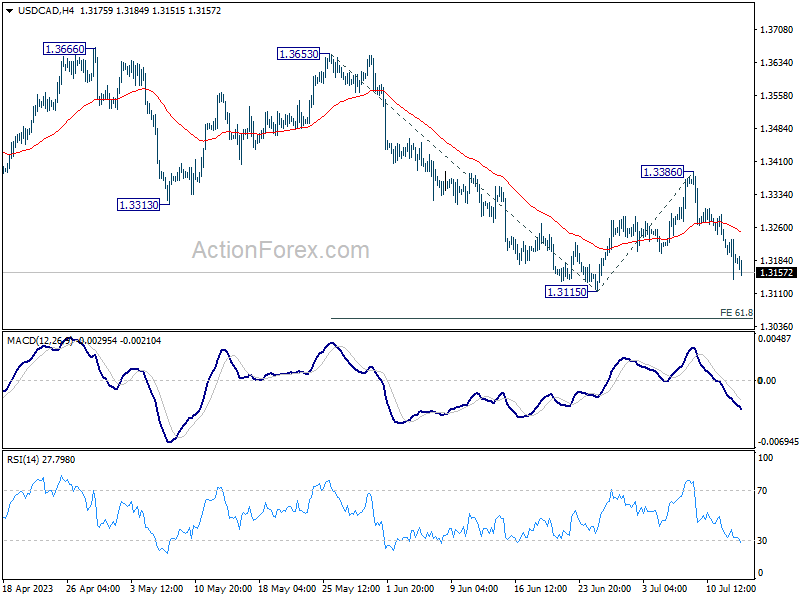
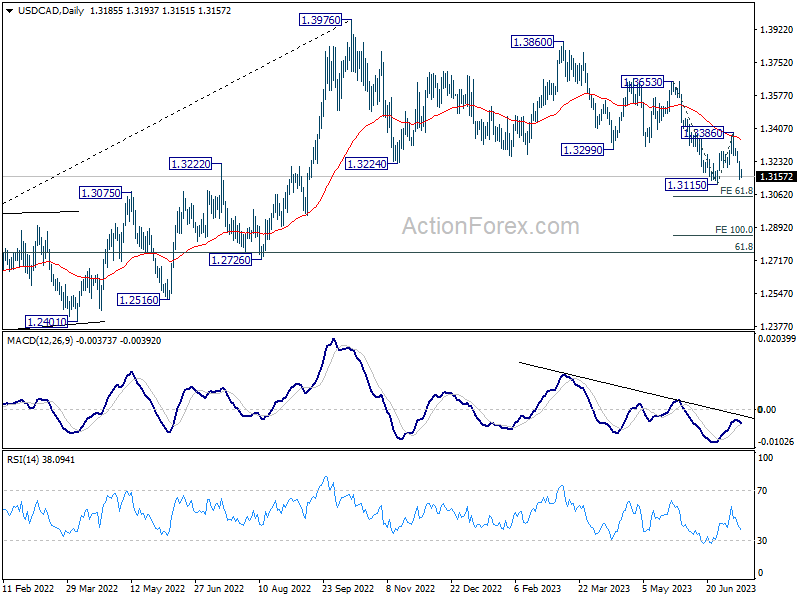
Daily Pivots: (S1) 1.3141; (P) 1.3190; (R1) 1.3237; More....
Intraday bias in USD/CAD remains on the downside for retesting 1.3115 low. Firm break there will resume larger down trend, and target 61.8% projection of 1.3653 to 1.3115 from 1.3386 at 1.3054, and then 100% projection at 1.2848. For now, outlook will remain bearish as long as 1.3386 resistance holds, in case of recovery.
In the bigger picture, price actions from 1.3976 are viewed as a correction to up trend from 1.2005 (2021 low) only. Hence, the up trend is in favor to resume through 1.3976 at a later stage. Nevertheless, another fall below 1.3115 will extending the decline from 1.3976 to 61.8% retracement of 1.2005 to 1.3976 at 1.2758, and raise the chance of bearish trend reversal.
EUR/USD Daily Outlook
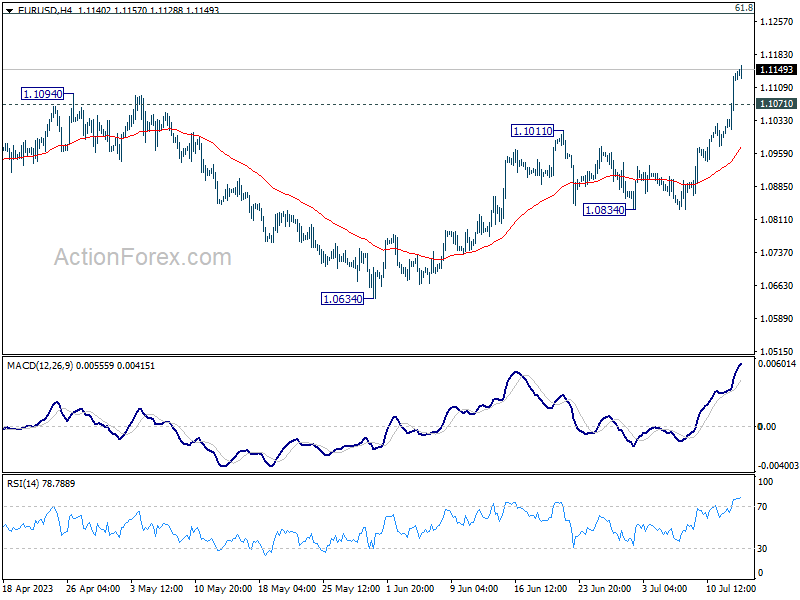
Daily Pivots: (S1) 1.1044; (P) 1.1092; (R1) 1.1180; More...
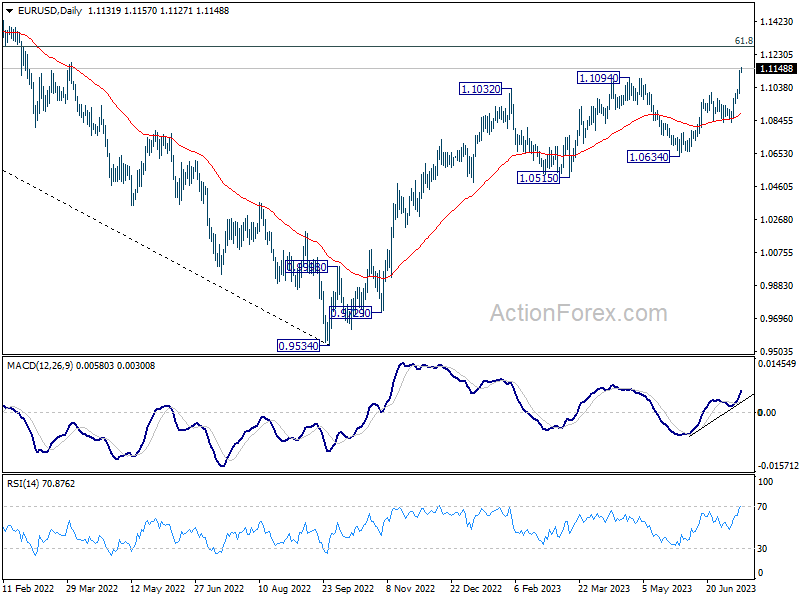
EUR/USD's rally continues today and intraday bias stays on the upside at this point. Current up trend should target 1.1273 fibonacci level next. On the downside, below 1.1012 minor support will turn intraday bias neutral and bring consolidations first, before staging another rise.
In the bigger picture, as long as 1.0515 support holds, rise from 0.9534 (2022 low) would still extend higher. Sustained break of 61.8% retracement of 1.2348 (2021 high) to 0.9534 at 1.1273 will solidify the case of bullish trend reversal and target 1.2348 resistance next (2021 high).
GBP/USD Daily Outlook
Daily Pivots: (S1) 1.2928; (P) 1.2964; (R1) 1.3024; More...
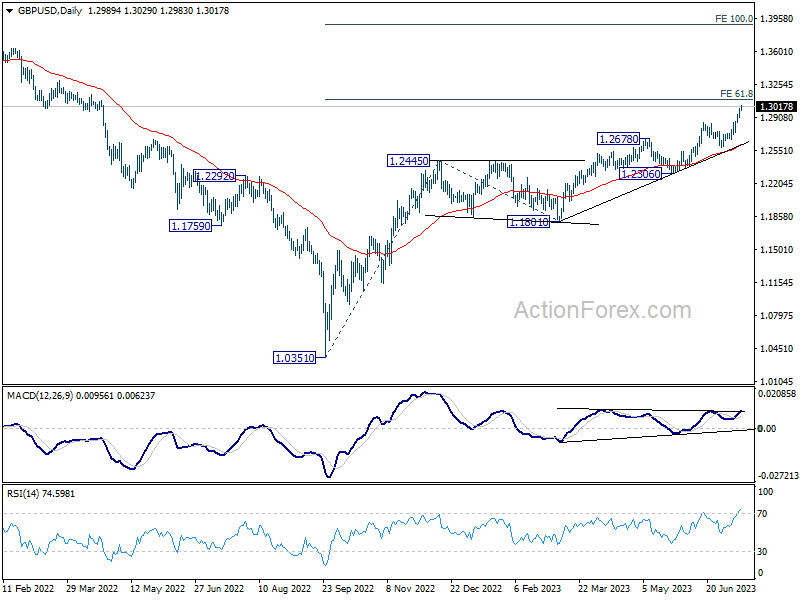
GBP/USD's rally continues today and intraday bias stays on the upside. Next target is 61.8% projection of 1.0351 to 1.2445 from 1.1801 at 1.3095. On the downside, below 1.2902 minor support will turn intraday bias neutral and bring consolidations first, before staging another rally.
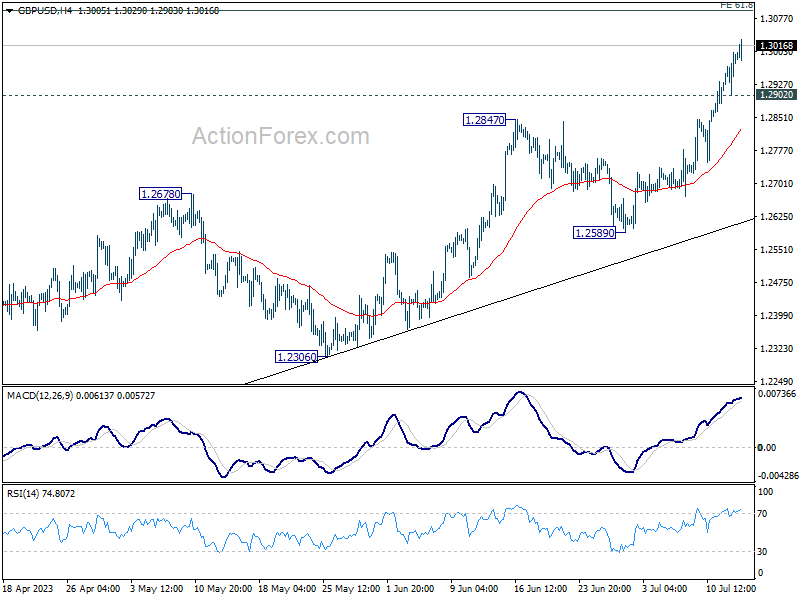
In the bigger picture, the strong support from 55 W EMA (now at 1.2341) is a medium term bullish sign. Outlook will stay bullish as long as 1.2306 support holds. Rise from 1.0351 medium term bottom (2022 low) is expected to extend further to retest 1.4248 key resistance (2021 high).
USD/JPY Daily Outlook
Daily Pivots: (S1) 139.86; (P) 140.66; (R1) 141.16; More...
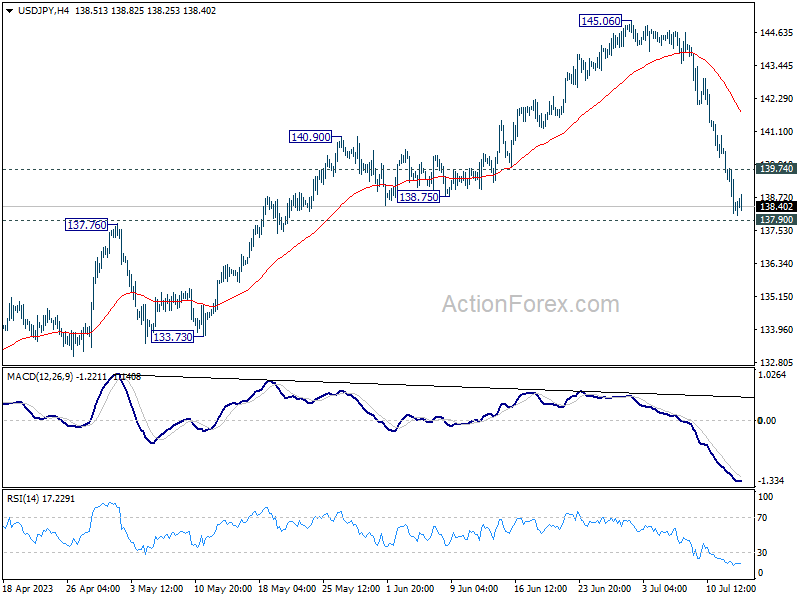
Intraday bias in USD/JPY remains on the downside for the moment as fall from 145.06 is in progress. Decisive break of 137.90 resistance turned support will confirm the larger bearish case, and target 127.20 and below. On the upside, above 139.74 minor resistance will turn intraday bias neutral and bring consolidations first, before staging another fall.
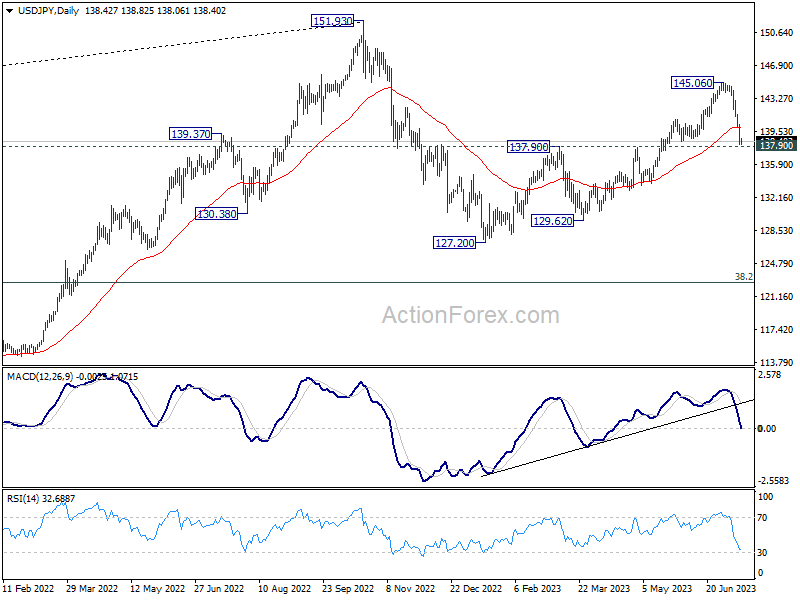
In the bigger picture, current downside acceleration, as seen in daily MACD, argues that fall from 145.06 is already the third leg of the corrective pattern from 151.93 (2022 high). Sustained break of 137.90 resistance turned support should confirm this case and target 127.20 (2023 low) and below. For now, this will remain the favored case as long as 145.06 resistance holds.
UK Economy Continues to Show Resilience, Chinese Trade Data Disappoints
The UK economy posted only a small contraction in May which was much better than forecast as the country continues to show strong resilience in the face of significant pressures.
That resilience has helped to sustain inflation at much higher levels than the Bank of England was hoping for which has in turn led to more rate hikes and markets pricing in many more to come.
The economy has basically stagnated now for the last year which is still much better than what many feared 12 months ago. We could see a little more growth going forward as lower energy and food bills free up some disposable income but with rates now very high and rising, costs for many are about to rise substantially, possibly more than offsetting any of those benefits.
Higher rates may also weigh on growth going forward if they impact household spending decisions, by encouraging more saving in anticipation of higher interest costs or encouraging them to pay down debt, etc. Time will tell to what extent that is the case as spending has been more resilient than expected until now.
Another disappointing batch of Chines trade data
Chinese imports and exports slumped at a faster pace than expected in June in another sign of weakening global trade. We've seen this trend all year and clearly, conditions are not improving, quite the opposite. This will maintain pressure on the economy with domestic demand also disappointing, as seen by the weaker import numbers. Targeted stimulus may be needed sooner rather than later or the country's once seemingly modest 5% growth target may be at risk of being missed.
Oil rally stalling around $80
Oil prices are a little higher again in early trade, seemingly still buoyed by yesterday's US inflation report, and are continuing to push for a convincing break above $80 in Brent crude. It is trading a little above $80 this morning and did at times yesterday, but rather than generating fresh momentum, it seems to instead be running on fumes.
That would be understandable. After all, it's rallied around 12% in two weeks, primarily on the back of the extension to the Saudi one million barrel cut to the end of August, alongside Russia's 500,000 barrel export reduction. Some profit-taking at these levels wouldn't be hugely surprising and may have come sooner if not for the US CPI data.
Gold holding gains but a few big tests lie above
Gold is also trading marginally higher today and struggling around a notable resistance level, $1,960. It broke through $1,940 yesterday on the back of the inflation numbers and has now entered retracement territory where a few key levels will be put to the test.
From a technical standpoint, those are the 38.2%, 50%, and 61.8% Fibonacci retracement levels - May highs to June lows - which happen to fall around £$1,960, $1,980, and $2,000, respectively. A break of these may indicate that gold is back in bullish territory, although the price may face some resistance in the interim.
No change for Bitcoin after the US inflation report
Bitcoin was very choppy around the inflation release yesterday but ultimately it's had little sustainable impact on the price. It's settled a little lower after some big fluctuations but is still well within the $30,000-$31,000 range it has broadly traded in for the last few weeks. That consolidation will probably come more as comfort to crypto bulls but at this stage, it isn't particularly clear in which direction it will break next. That may depend on the news flow in the coming weeks, with some positive news on the ETF front potentially giving the crypto space another boost.
AUDUSD Breaks Rectangle; Fifth Time Lucky for the Bulls?
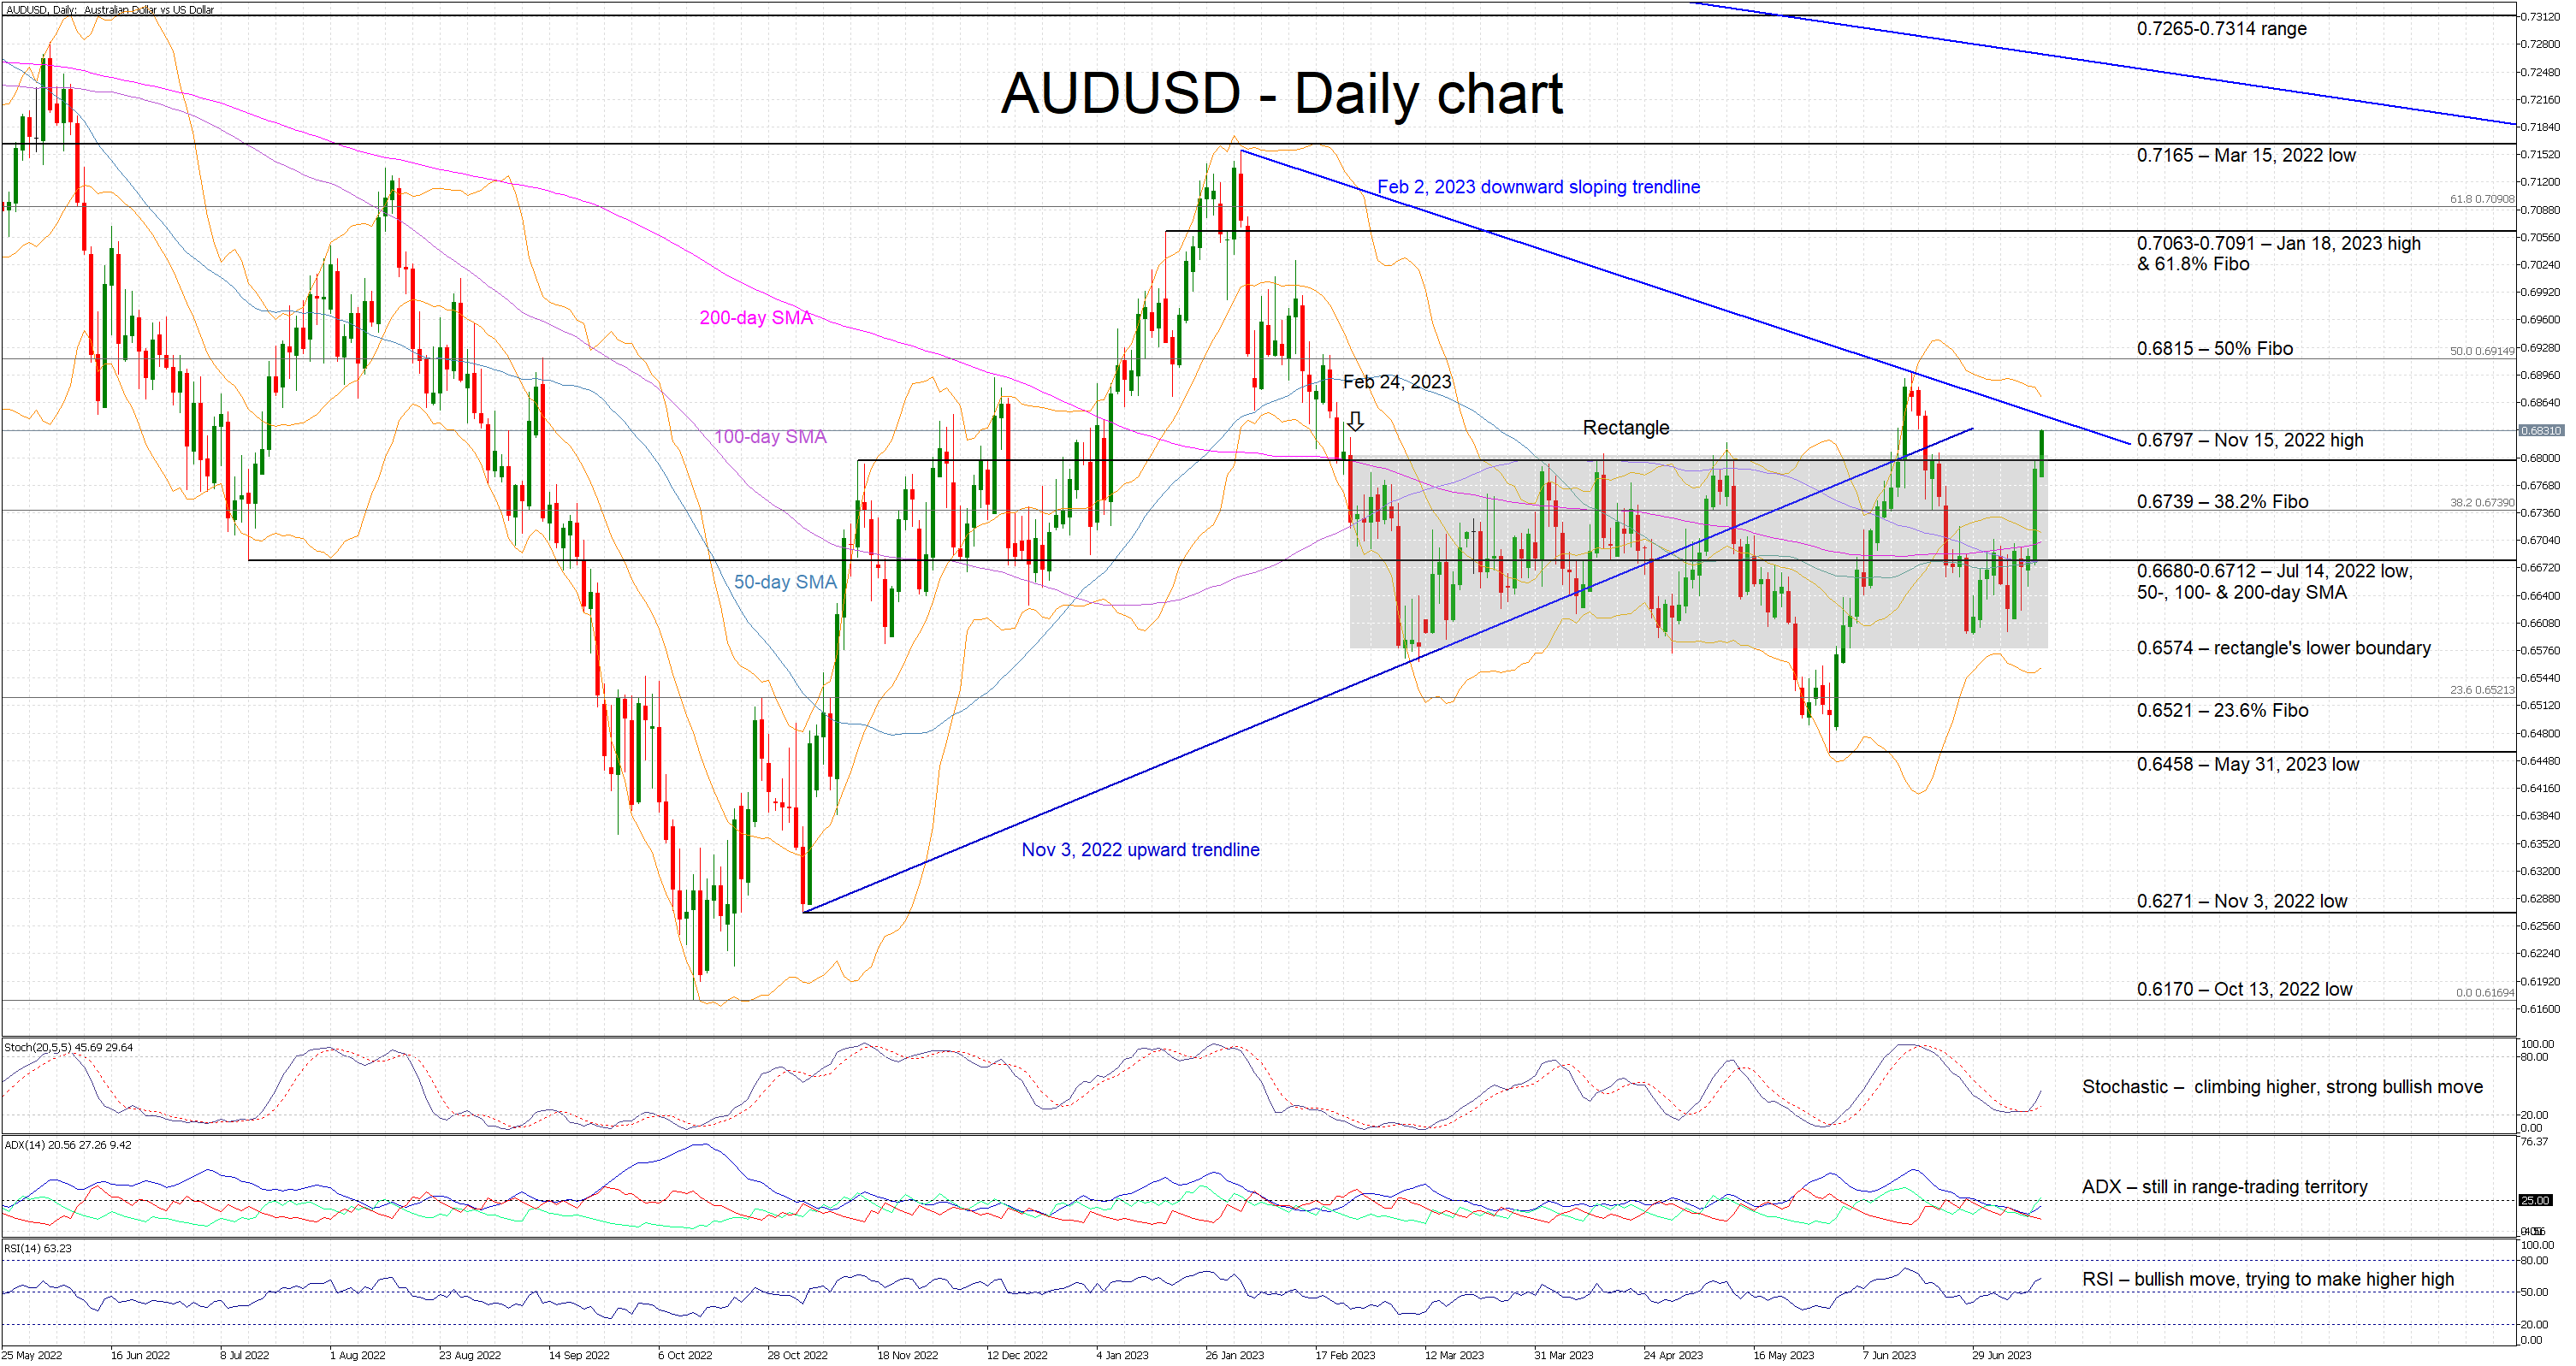
AUDUSD bulls are staging their fifth breakout, hoping to be more successful this time around and to finally break the rectangle that has been dominating the price action since February 24, 2023.
The overall technical picture is positive for the bulls. The RSI has jumped above its 50-midpoint, and it is now trying to make a higher high. More importantly, the stochastic oscillator has broken above its moving average and it is now moving higher in a vertical fashion. If we add to this mix the rare simple moving averages’ (SMAs) convergence, then the bulls might be inspired to record a decisive upleg.
The first resistance stands at the November 15, 2022 high at 0.6797, which is unlikely to trouble the bulls much. The February 2, 2023 downward sloping trendline would then come next and its importance should not be understated as the mid-June advance halted at this trendline. Even higher, the 50% Fibonacci retracement level of the April 5, 2022 – October 13, 2022 downtrend at 0.6815 could be important for a sentiment-perspective.
On the other hand, the bears are anxiously trying to limit the current move but only the Average Directional Movement Index (ADX) is on their side as it continues to signal a range-trading market. They are keen on pushing AUDUSD back inside the aforementioned rectangle and then try to stage a sell-off towards the 38.2% Fibonacci retracement at 0.6739. Even lower, the bears would then come up against the busier 0.6680-0.6712 range, defined by the various SMAs employed here.
To sum up, another bullish AUDUSD breakout is taking place with the bulls feeling very confident. However, key levels have to be broken to avoid talk of another false breakout.
DAX Index Rallies after Ending 3 Waves Corrective Pullback
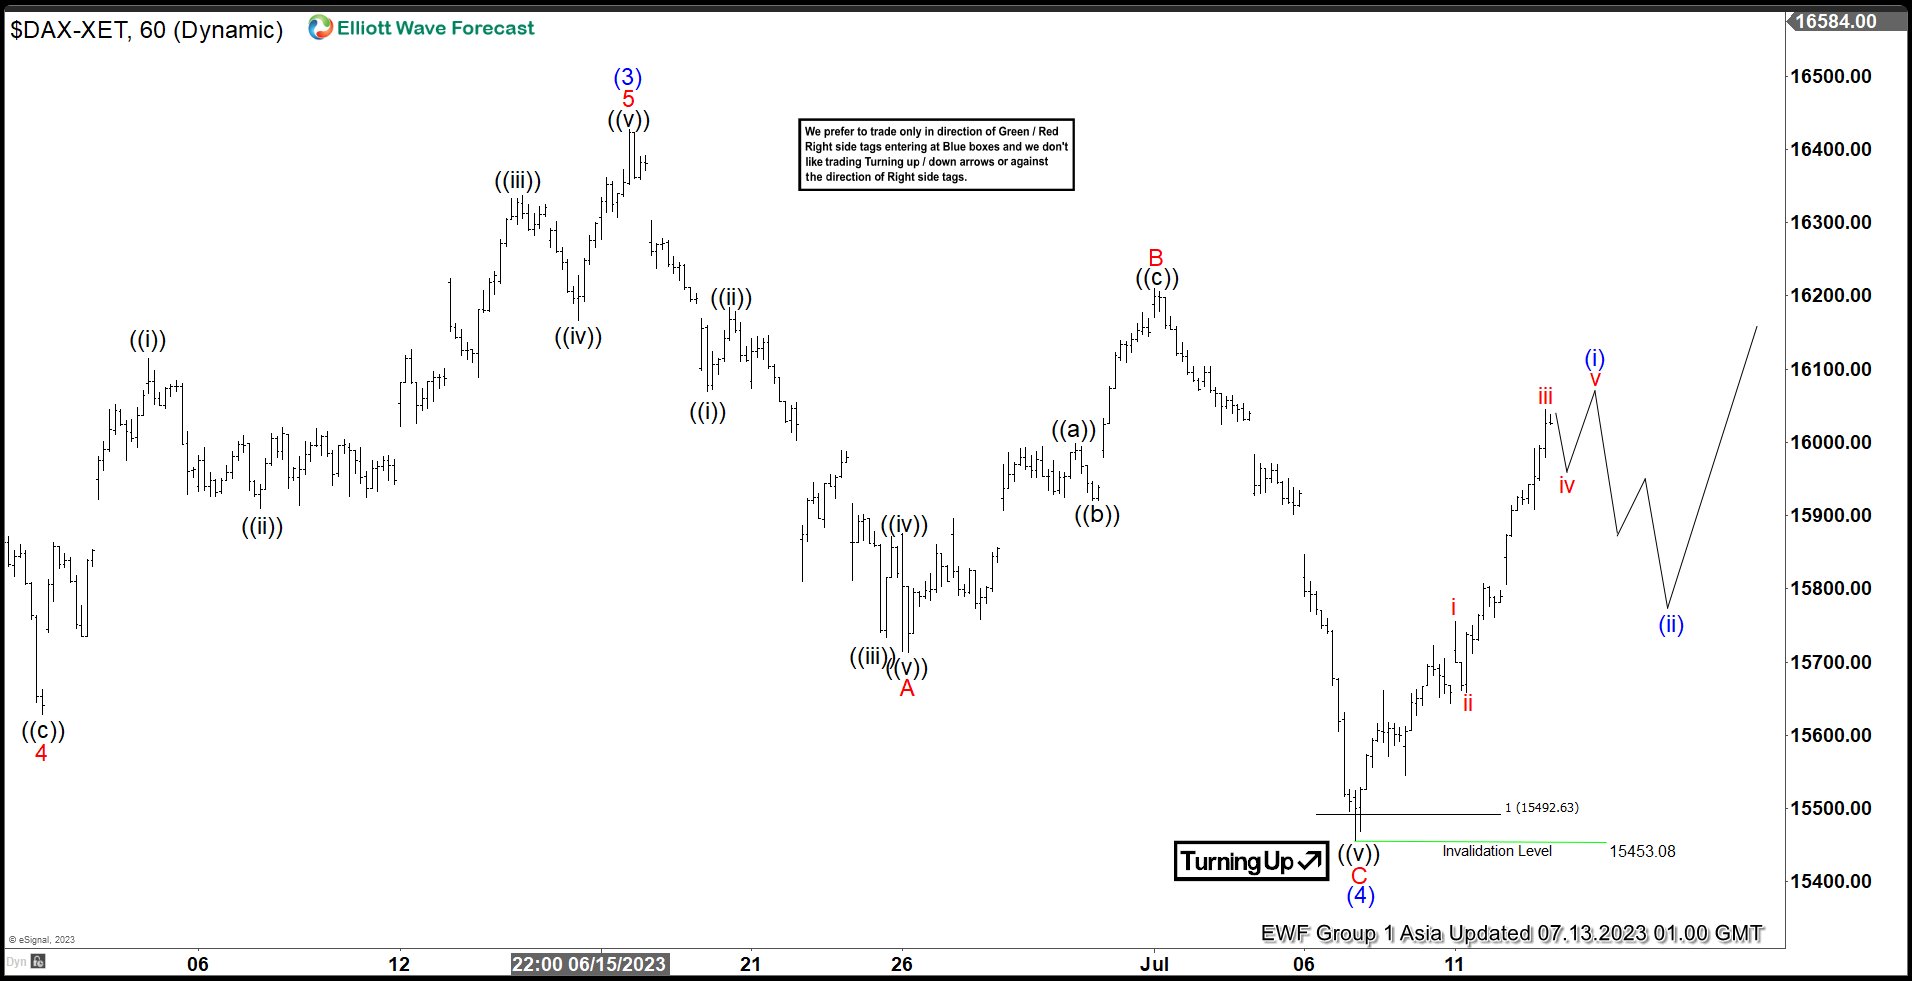
Short term Elliott Wave view in DAX suggests the Index ended wave (3) at 16427.42. Wave (4) pullback unfolded as a zigzag Elliott Wave structure. Down from wave (3), wave ((i)) ended at 16069.1 and wave ((ii)) ended at 16184.30. Wave ((iii)) lower ended at 15733.12 and wave ((iv)) ended at 15874.90. Final leg wave ((v)) ended at 15713.70 which completed wave A.
Rally in wave B ended at 16209.29 with internal subdivision as a zigzag structure. Up from wave A, wave ((a)) ended at 15998.67, pullback in wave ((b)) ended at 15920.33 and final leg wave ((c)) ended at 16209.29 which completed wave B. The Index then extended lower in wave C towards 15453.08 which completed wave (4) in higher degree. The Index then turns higher in what looks to be impulsive structure. Up from wave (4), wave i ended at 15755.44 and dips in wave ii ended at 15659.10. Expect the Index to soon end the 5 waves rally from 7.7.2023 as wave (i), then it should pullback in wave (ii) to correct that cycle before it resumes rally. Near term, as far as pivot at 15453.08 low stays intact, expect dips to find support in 3, 7, or 11 swing for further upside.
DAX 60 Minutes Elliott Wave Chart
DAX Elliott Wave Video
https://www.youtube.com/watch?v=OsRzxzi67P0
Technical Picture for EUR/USD Improved
Markets
Post-payrolls price action already suggested investors were ready to take up additional US Treasuries exposure in case of a mild US June CPI and this is exactly what happened. Both headline and core CPI rose 0.2% M/M versus 0.3% M/M expected. The headline Y/Y reading due to a positive base effected to declined from 4% to 3%. Core inflation also eased slightly more than expected from 5.3% to 4.8%. Yesterday’s report won’t prevent a Fed rate hike at the July 26 policy meeting, especially not given decent US activity data published recently, but it reopened the debate whether additional rate hikes will be needed post-July. US yields tumbled between 15.5 bps (5-y) and 6 bps (30-y). The 10-y real yield nosedived 15.5 bps, too. The 2-y yield further left the 5%+ levels touched last week and at 4.71% almost fully reversed the up-leg since end June. The picture for the US 10-y yield remains more constructive as it still holds above the previous resistance near 3.85%. German yields followed the US at a distance losing between 11.6 bps (5-y) and 7 bps (30-y). The prospect/hope of the Fed potentially nearing the top of its hiking cycle propelled stock markets with US indices gaining between 0.25% (Dow) and 1.15% (Nasdaq). Europe outperformed (Eurostoxx 50 +1.72%). Brent oil surpassed the $80/b mark, but it still is no big issue for other markets. The sharp decline in US yields and an outright risk-on only intensified the USD sell-off. DXY closed at a new YTD low (100.5). EUR/USD jumped beyond the 1.1095 2023 top to close at 1.1129. Interest rate differentials rather than risk sentiment dominated USD/JPY trading with the pair closing at 138.50, the lowest level since end May. Sterling gained against the dollar (cable close 1.2988), but recorded a significant loss against the euro (EUR/GBP close 0.857). In the broader bond rally, UK yields even declined more than US ones (2-y minus 19.7 bps). Markets apparently concluded that the Fed potentially nearing the end of its hiking cycle would remove some pressure from the BoE as well.
Asian equities join yesterday’s risk-rally with regional indices mostly gaining between 1% and 2.5%. The dollar holds recent losses (DXY 100.49, EUR/USD 1.114). Later today, the US calendar contains the weekly jobless claims (expected stable near 250k) and US producer prices. The latter seldom is a market mover, but in current momentum, softer figures still could cause some follow-through price action. Also keep an eye at the accounts of the ECB June meeting . The technical picture for EUR/USD improved after yesterday’s break of 1.1095. 1.1274 is 62% retracement from the early 2021 top to the 0.9536 cycle low. This morning UK production/monthly GDP data printed mixed to slightly better than expected EUR/GBP in a first reaction shows no clear directional reaction.
News and views
The Bank of Canada as expected raised the policy rate by 25 bps to 5%. It’s the second hike straight after a pause since March ended in June. Further tightening is possible depending on the dynamics and outlook of (core) inflation. The BoC said recent data suggests more persistent excess demand while the housing market has seen some pickup as well. Labour conditions remain tight. GDP growth for this year has been lifted from 1.4% estimated in April to 1.8% before slowing to 1.2% (-0.1 ppt) in 2024. 2025 growth should reaccelerate again to 2.4% (-0.1 ppt). Inflation (3.4% in May) has eased though the downward momentum mainly came from energy prices. With large price increases of last year out of the annual data, there will be less downward momentum near-term, the BoC reckons. Three-month rates of core inflation are running around 3.5-4% since September, suggesting more persistent pressure than anticipated. CPI is expected to hover around 3% for the next year before gradually declining to 2% in the middle of 2025. The Canadian dollar hit an intraday high against an overall weak USD after the decision around USD/CAD 1.3144 before closing at 1.3187. Canadian swap yields dropped more than 13 bps at the front though the bulk of the move occurred before the BoC in response to the post US CPI global bond market.
The central bank of South Korea kept rates steady for the fourth time at 3.5%. The decision was unanimous and all six members were open to lift rates further to 3.75% if needed. The BoK retains a hawkish stance by pledging that it will keep policy restrictive for a “considerable time with an emphasis on ensuring price stability.” Inflation in South Korea eased from 6.3%, the highest since 1998, to 2.7% in June. Core inflation proves much sticker, having slowed from 5% in January to a still too high 4.1%. The won gapped higher against the USD this morning in a catch-up move with yesterday’s post CPI USD weakness and eked out some minor additional gains afterwards. USD/KRW is trading around 1274.9 with KRW resistance nearing at 1268.9.