

Sample Category Title
The Fever is Breaking
US inflation eased to 3%. It’s still not the 2% targeted by the Federal Reserve (Fed), but it’s approaching. Core inflation on the other hand eased more than expected to 4.8%. That’s still more than twice the Fed’s 2% policy target, but again, the US inflation numbers are clearly on the right path, the services inflation including shelter costs is easing, and all this is good news for breaking the Fed hawks back amid mounting tension over the past few weeks.
There hasn’t been much change in the expectation of another 25bp hike at the Fed’s next policy meeting, which is now given a more than 90% chance, but the expectation for a September hike fell, the US 2-year dropped to 4.70% after the CPI data, while the 10-year yield fell to 3.85%.
One big question is: if inflation is easing at a – let’s say - pleasing speed, why would the Fed bother raising the interest rates more? Wouldn’t it be better to just wait and see where inflation is headed?
Well yes, but the Fed officials certainly continue thinking that 4.8% is still too hot, and that the risk of a U-turn in inflation expectations, and inflation is still to be carefully managed. Because the favourable base effect due to energy prices will gently start fading away in the coming months and the result on inflation will be less appetizing. Then the rising energy prices today could fuel price dynamics again in the coming months, and if China manages to fuel growth thanks to ample monetary and fiscal stimulus, the impact on global inflation could be felt. And if you listen to Richmond Fed’s Thomas Barkin, that’s exactly what comes out: ‘if you back off too soon, inflation comes back stronger’. But the possibility of two more rate hikes following the most aggressive hiking cycle from the Fed starts looking a bit stretched with the actual data. Due to release today, the US producer price inflation is expected to have fallen to the lowest levels since the pandemic, we could even see some deflation.
And a potential Chinese boost to inflation looks much less threatening today compared to a couple of months ago. Chinese exports plunged 12.4% in June, worse than a 7.5% drop printed in May and worse than the market forecasts of a 9.5% decline. The June decline in Chinese exports marked the steepest fall in sales since February 2020. Deteriorating foreign demand on the back of high inflation and rising interest rates continued taking a toll on Chinese trade numbers. In the meantime, imports fell 6.8%, the fourth straight month of decrease due to persistently weak domestic demand.
China will likely recover at some point, but we will unlikely see the Chinese growth put a severe pressure on commodity markets. That’s one good news for inflation watchers. The other one is that the US student loan repayments will resume from October, and that should act as a restrictive fiscal action, and help the Fed tame inflation. Therefore, even though there could be an uptick in inflation figures in the coming months, we will unlikely see inflation spike back above 4-5% again. But we will also unlikely to see it fall to 2% easily.
US Dollar plunges
The selloff in the US dollar accelerates post-CPI, with the dollar index approaching the 100 level with big and steady steps. This is good news for inflation in the rest of the world, because the softer the US dollar, the softer the energy and raw material prices negotiated in terms of US dollars. In the same way the dollar appreciation fueled inflation globally, its depreciation could help ease it as well.
The EURUSD spiked to 1.1150, Cable advanced past the 1.30 level, while the dollar-yen extended losses below the 140 psychological mark. In precious metals, gold is thriving on the back of softer yields and the softer dollar. The price of an ounce rallied past $1960 and consolidates near $1955 at the time of writing.
In energy, oil bulls target the 200-DMA, that stands near the $77pb level, yet the $77/80 range will be hard to drill as the higher the energy the prices, the higher the inflation expectations, and the higher the inflation expectations, the tighter the Fed policy. The tighter the Fed policy, the stronger the odds of recession, and the stronger the odds of recession, the softer the global energy demand, and the softer the energy prices.
In equities, soft US inflation and decline in US yields pushed the S&P500 to a fresh high since April 2022. The index flirted with the 4500 level on expectation that the Fed will hike one more time and stop, and that the actual tightening cycle could very well end with a soft landing. Nasdaq 100, on the other hand, rallied to the highest levels since the beginning of last year. Meta for example jumped 3.70% on the back of inflation optimism and the news that its Threads platform is growing while dampening traffic on rival Twitter.
On a side note, because Nasdaq 100 is now over-concentrated in Mega Cap stocks, there will be a rebalancing in the weightings of the index. Nasdaq has a rule stating that the aggregate total of individual weights above 4.5% in the index shouldn’t exceed 48% of the total weighting. And today, the Magnificent Seven is worth around 55% of Nasdaq 100. So, the changing weights could weigh on Nasdaq, as the best performing stocks will see their weight drawn down.
Technical Outlook and Review
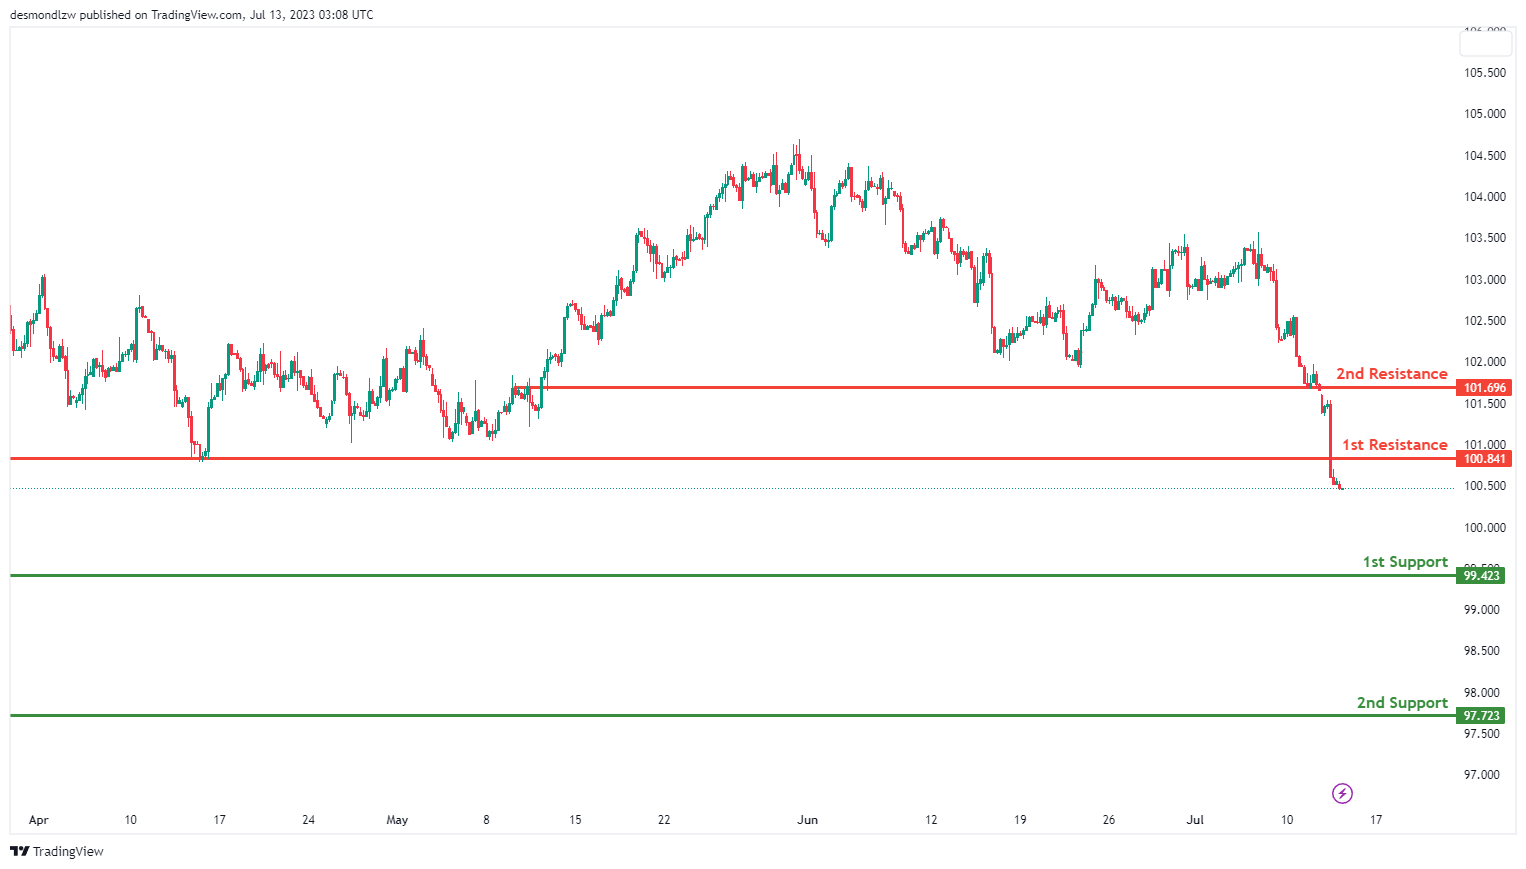
DXY:
The DXY instrument is currently showcasing a bearish trend, suggesting a potential continuation of this bearish momentum towards the 1st support level.
The 1st support is found at 99.42 and is classified as an overlap support, which could offer considerable stability for the price. The 2nd support level is positioned at 97.72, another overlap support that could provide a safety net in the event of a further price drop.
On the other hand, the 1st resistance level is situated at 100.84, acting as a pullback resistance that could potentially halt upward price movements.
Furthermore, the 2nd resistance level at 101.69, another pullback resistance, could pose a substantial barrier to any bullish price movements.
EUR/USD:
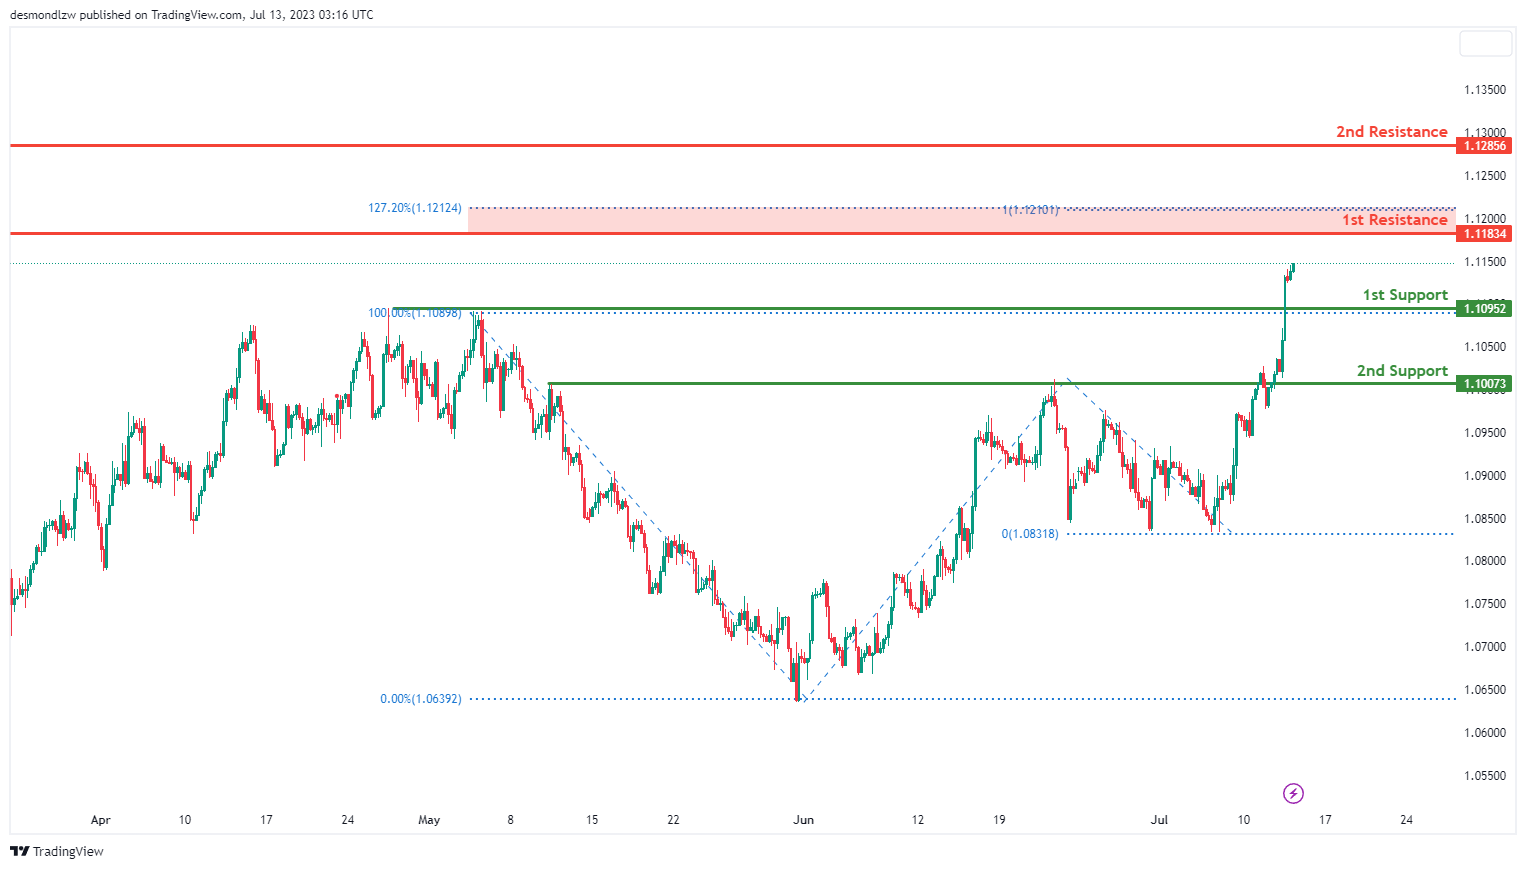
The EUR/USD pair is currently showcasing a bullish trajectory, hinting at the possibility of this bullish trend continuing towards the 1st resistance level.
The 1st support is established at 1.1095 and serves as a pullback support, likely offering considerable stability for the price. In the event of a further decrease, the 2nd support level, placed at 1.1007, acts as an overlap support and could provide a safety cushion.
On the flip side, the 1st resistance level is found at 1.1183 and is identified as a swing high resistance. It coincides with a 100% Fibonacci projection and a 127.20% Fibonacci extension, implying a Fibonacci confluence that could notably reinforce this resistance level.
If the price manages to break through this level, it could potentially target the 2nd resistance level at 1.1285. This level, labelled as an overlap resistance, might pose a significant obstacle to further price hikes.
EUR/JPY:
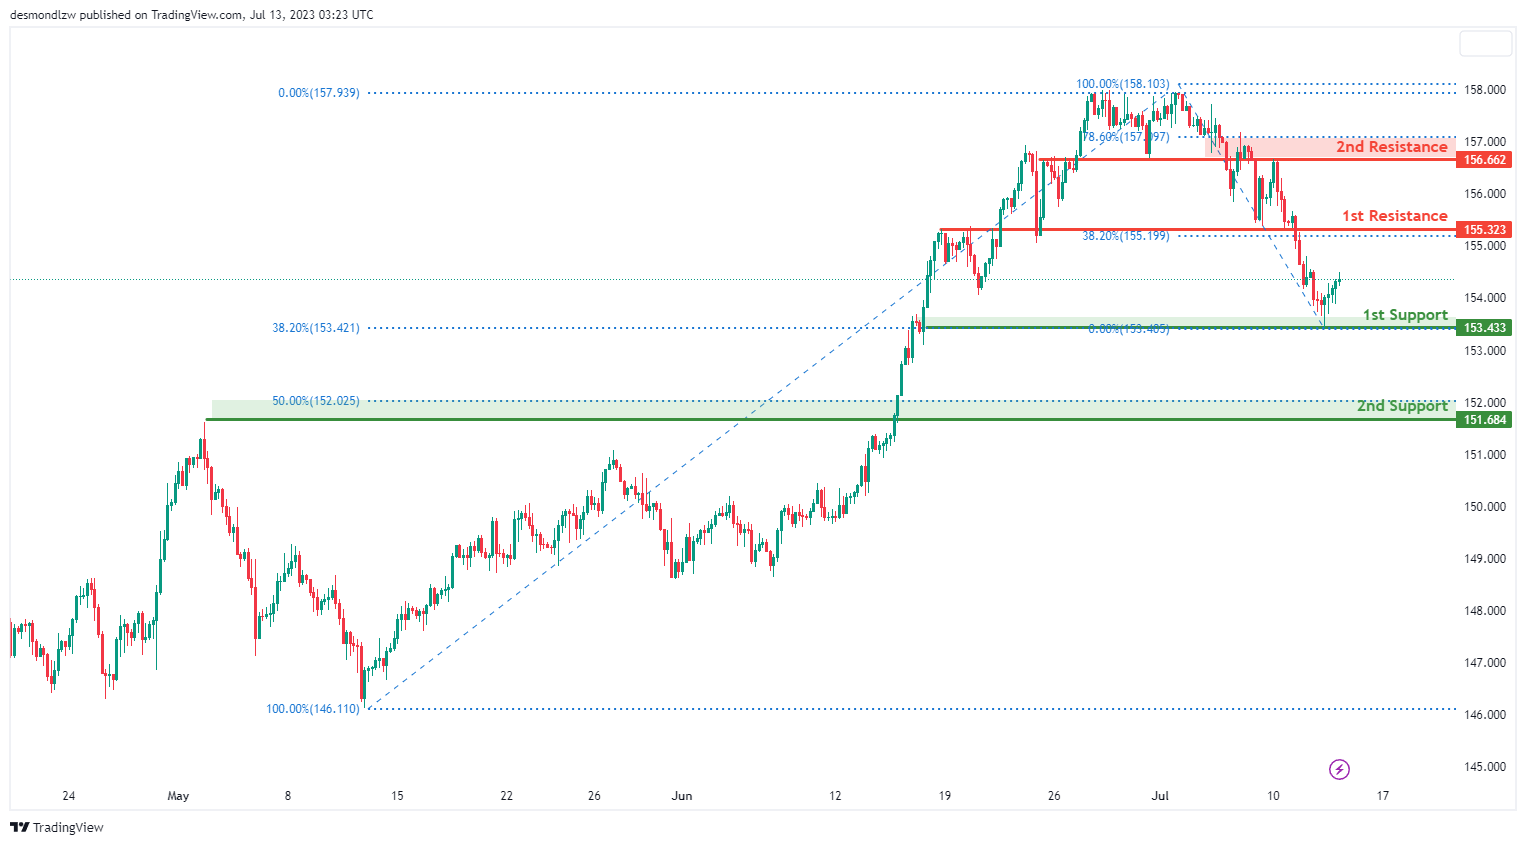
The EUR/JPY instrument currently demonstrates a bullish momentum. There is potential for the price to make a bullish bounce off the 1st support and head towards the 1st resistance.
The 1st support level is located at 153.43 and is considered significant as it represents a swing low support and aligns with the 38.20% Fibonacci retracement. The 2nd support level is positioned at 151.68 and is recognized as a strong support level. It represents an overlap support and aligns with the 50% Fibonacci retracement.
Moving on to the resistance levels, the 1st resistance is found at 155.32 and is deemed significant. It represents an overlap resistance and aligns with the 38.20% Fibonacci retracement. The 2nd resistance level is situated at 156.66 and is considered noteworthy as it represents another overlap resistance, along with the 78.60% Fibonacci retracement.
EUR/GBP:
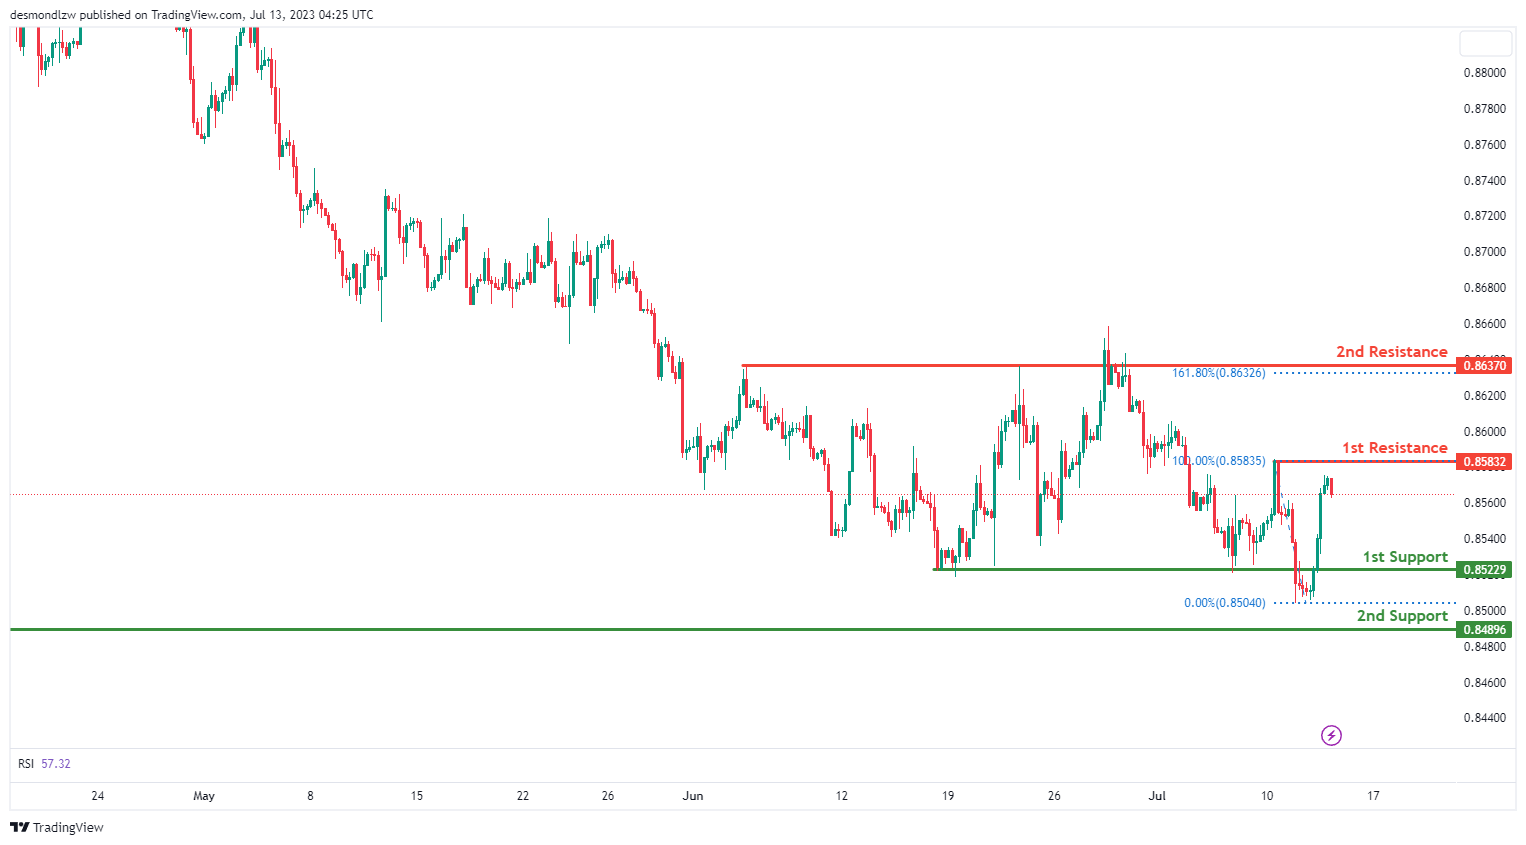
The EUR/GBP instrument currently exhibits a bullish momentum. There is potential for the price to make a bullish continuation towards the 1st resistance.
The 1st support level is located at 0.8522 and is considered significant as it represents an overlap support. The 2nd support level is positioned at 0.8489 and is recognized as a strong support level. It represents another overlap support.
Moving on to the resistance levels, the 1st resistance is found at 0.8583 and is deemed significant as it represents a swing high resistance. The 2nd resistance level is situated at 0.8637 and is considered noteworthy. It represents an overlap resistance, along with a 161.80% Fibonacci extension.
GBP/USD:
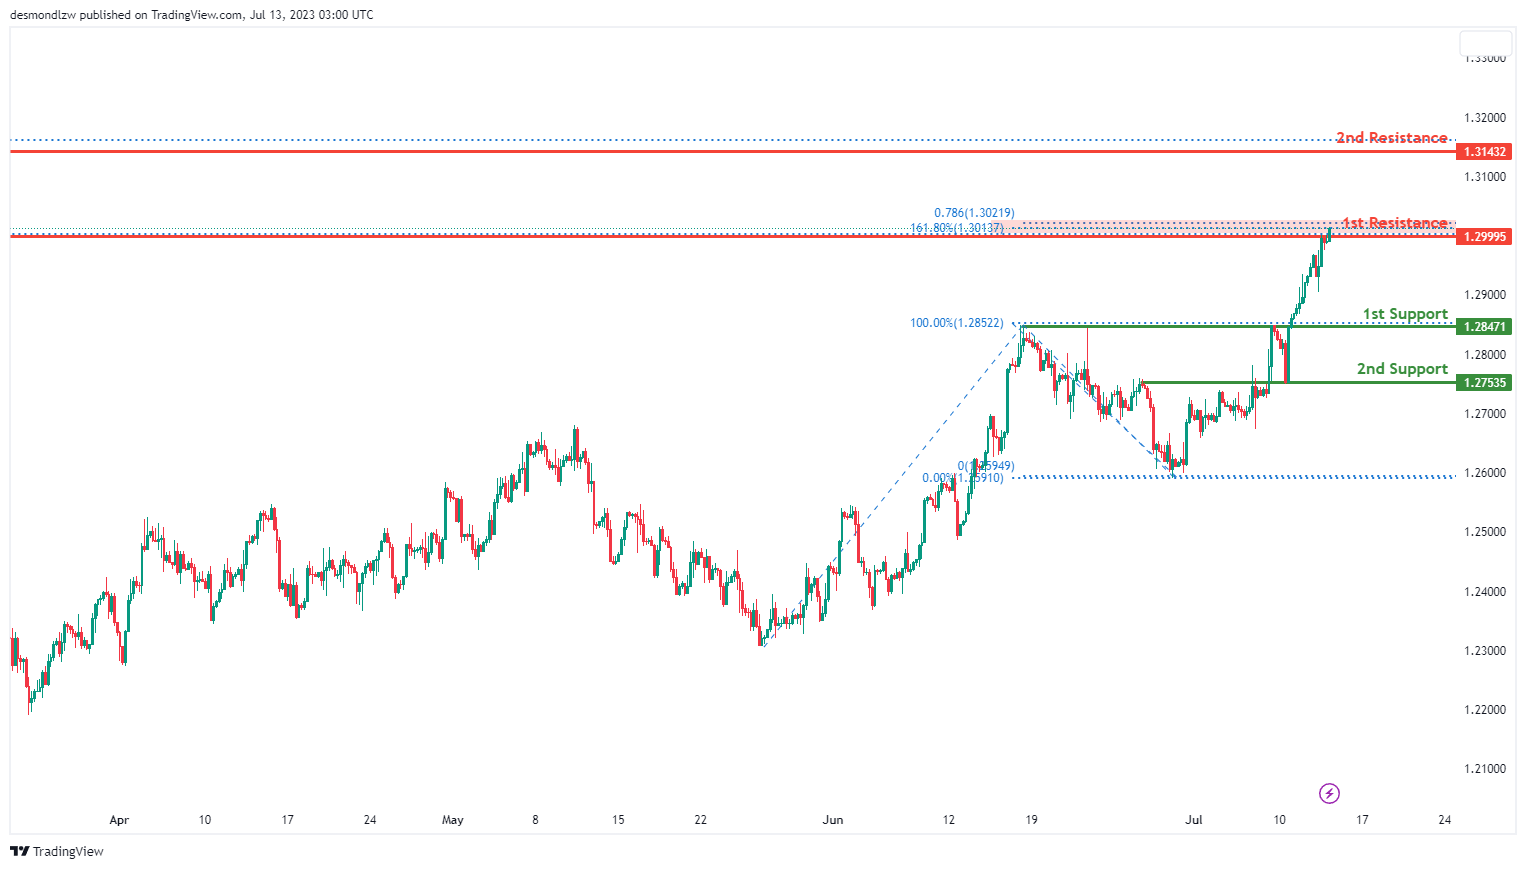
The GBP/USD pair is presently exhibiting a bullish momentum, with the potential for a bearish reaction off the 1st resistance leading to a drop towards the 1st support level.
The 1st support level is located at 1.2847 and acts as a pullback support, providing a possible level of price stability. A further drop could be cushioned by the 2nd support level at 1.2753, identified as an overlap support.
However, if the price bounces upwards, it might face the 1st resistance level at 1.2999. This pullback resistance coincides with a 78.60% Fibonacci projection and a 161.80% Fibonacci extension, indicating a Fibonacci confluence that strengthens this resistance level.
If the price overcomes this level, it could aim for the 2nd resistance level at 1.3143, characterized as a swing high resistance, which could pose a significant barrier to further price increases.
GBP/JPY:
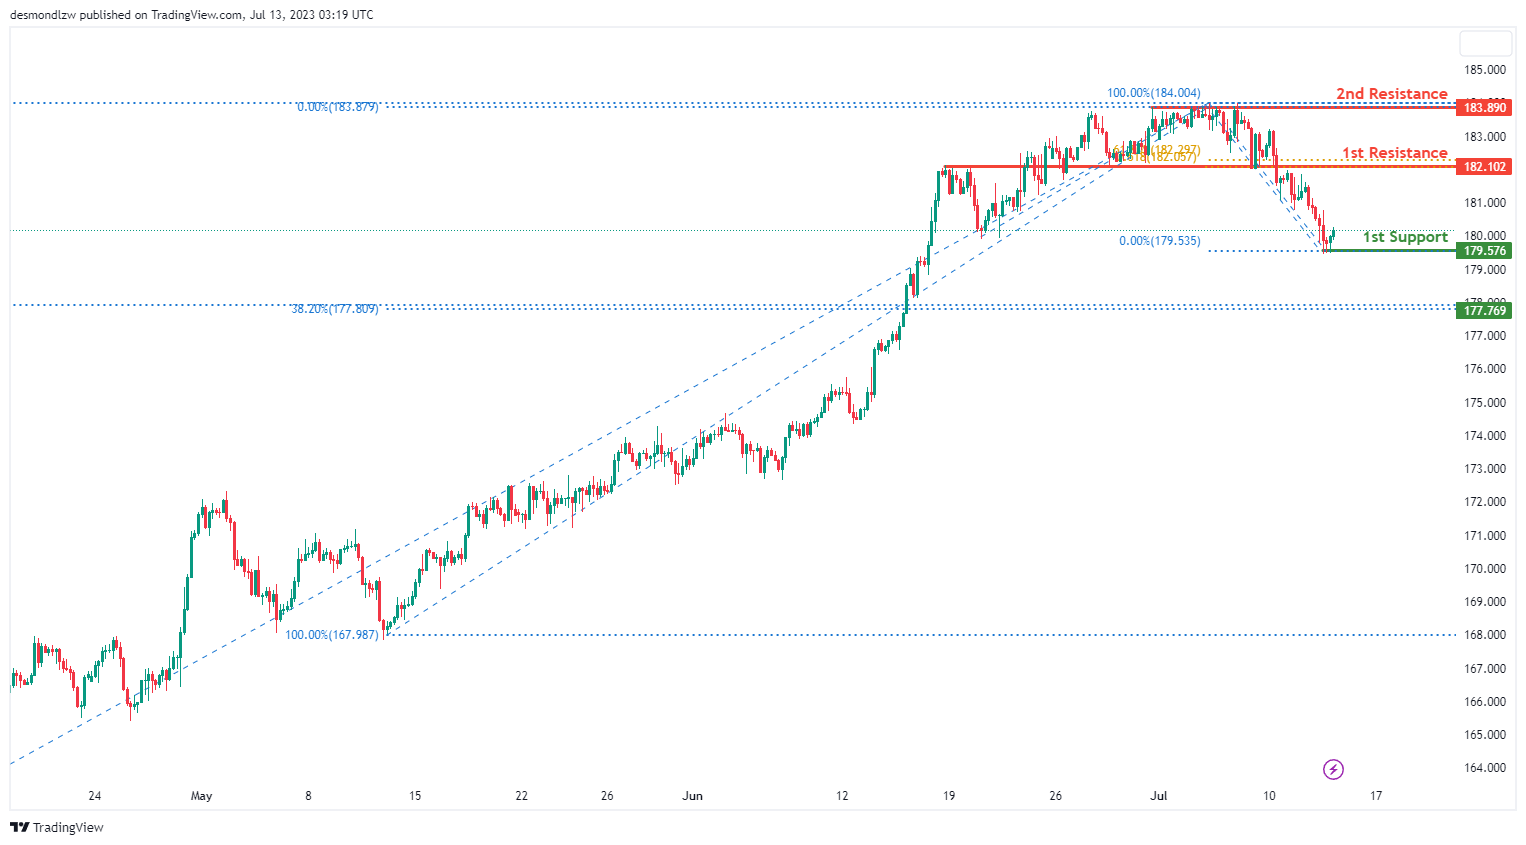
The GBP/JPY instrument currently exhibits a bullish momentum. There is potential for the price to make a bullish bounce off the 1st support and head towards the 1st resistance.
The 1st support level is located at 179.57 and is considered significant as it represents a swing low support. The 2nd support level is positioned at 177.76 and is recognized as a strong support level. It represents a swing low support and aligns with the 23.60% and 38.20% Fibonacci retracement levels, indicating a Fibonacci confluence.
Moving on to the resistance levels, the 1st resistance is found at 182.10 and is deemed significant. It represents an overlap resistance and aligns with the 61.80% Fibonacci retracement and the 61.80% Fibonacci projection, indicating a Fibonacci confluence. The 2nd resistance level is situated at 183.89 and is considered noteworthy as it represents a multi-swing high resistance.
USD/CHF:
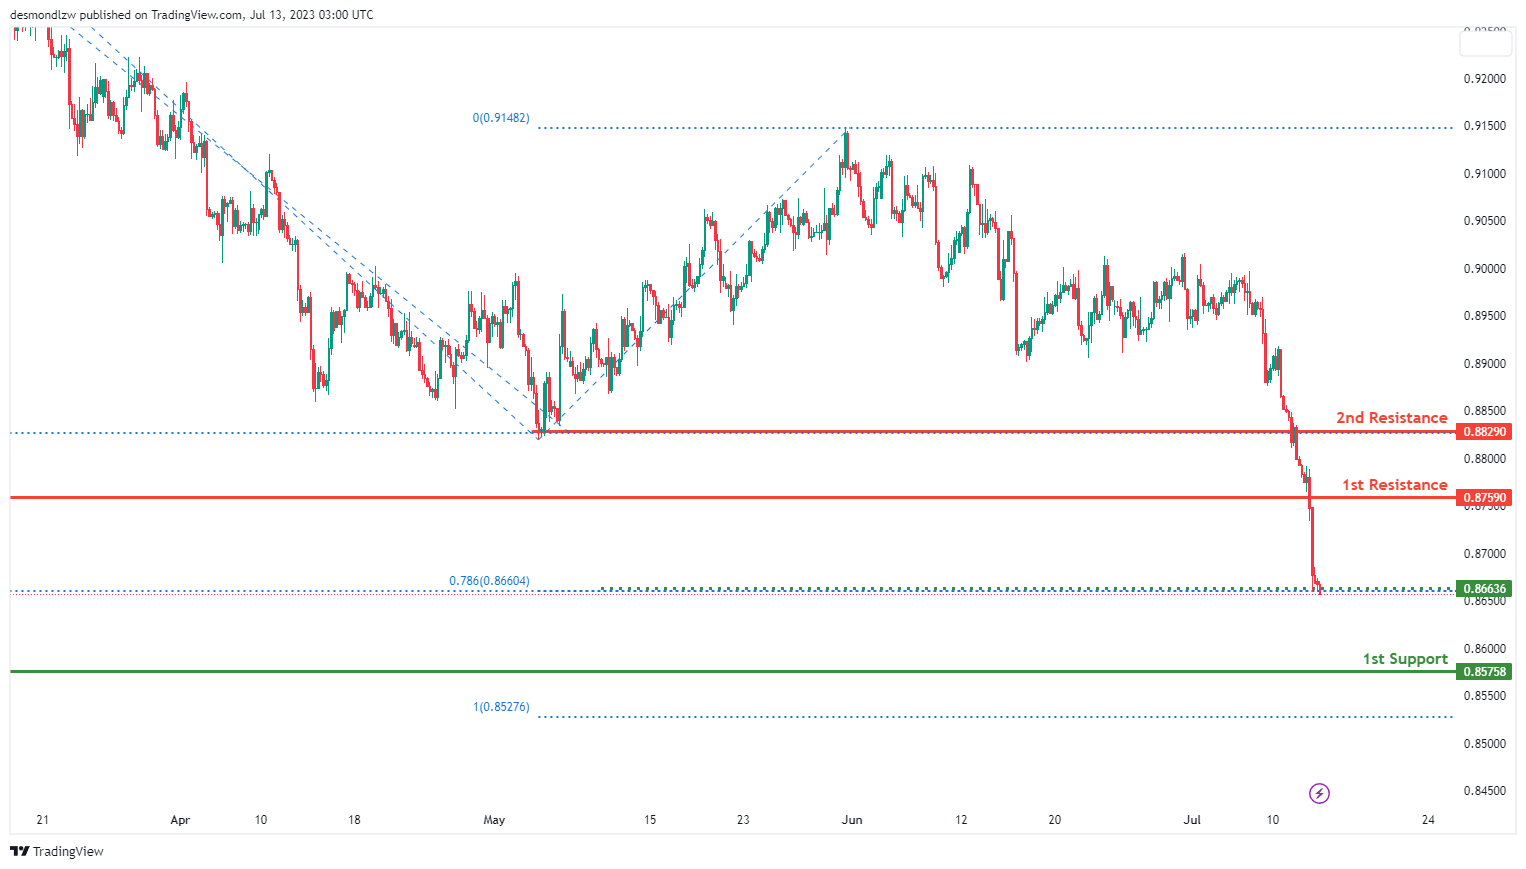
The USD/CHF pair is currently showing a bearish momentum, suggesting a potential continuation of this bearish trend towards the 1st support level.
The 1st support level is situated at 0.8575, characterized as a swing low support, which could provide a significant level of price stability. The intermediate support level at 0.8663, aligns with a 78.60% Fibonacci projection and a -27% Fibonacci expansion, signifying a Fibonacci confluence that reinforces this support level.
On the other hand, the price might encounter resistance at the 1st level of 0.8759, acting as a pullback resistance that might provide a challenge to any bullish trend.
If the price manages to surpass this resistance, it might aim for the 2nd resistance level at 0.8829, classified as a swing high resistance, which could serve as a significant hurdle to further price ascents.
USD/JPY:
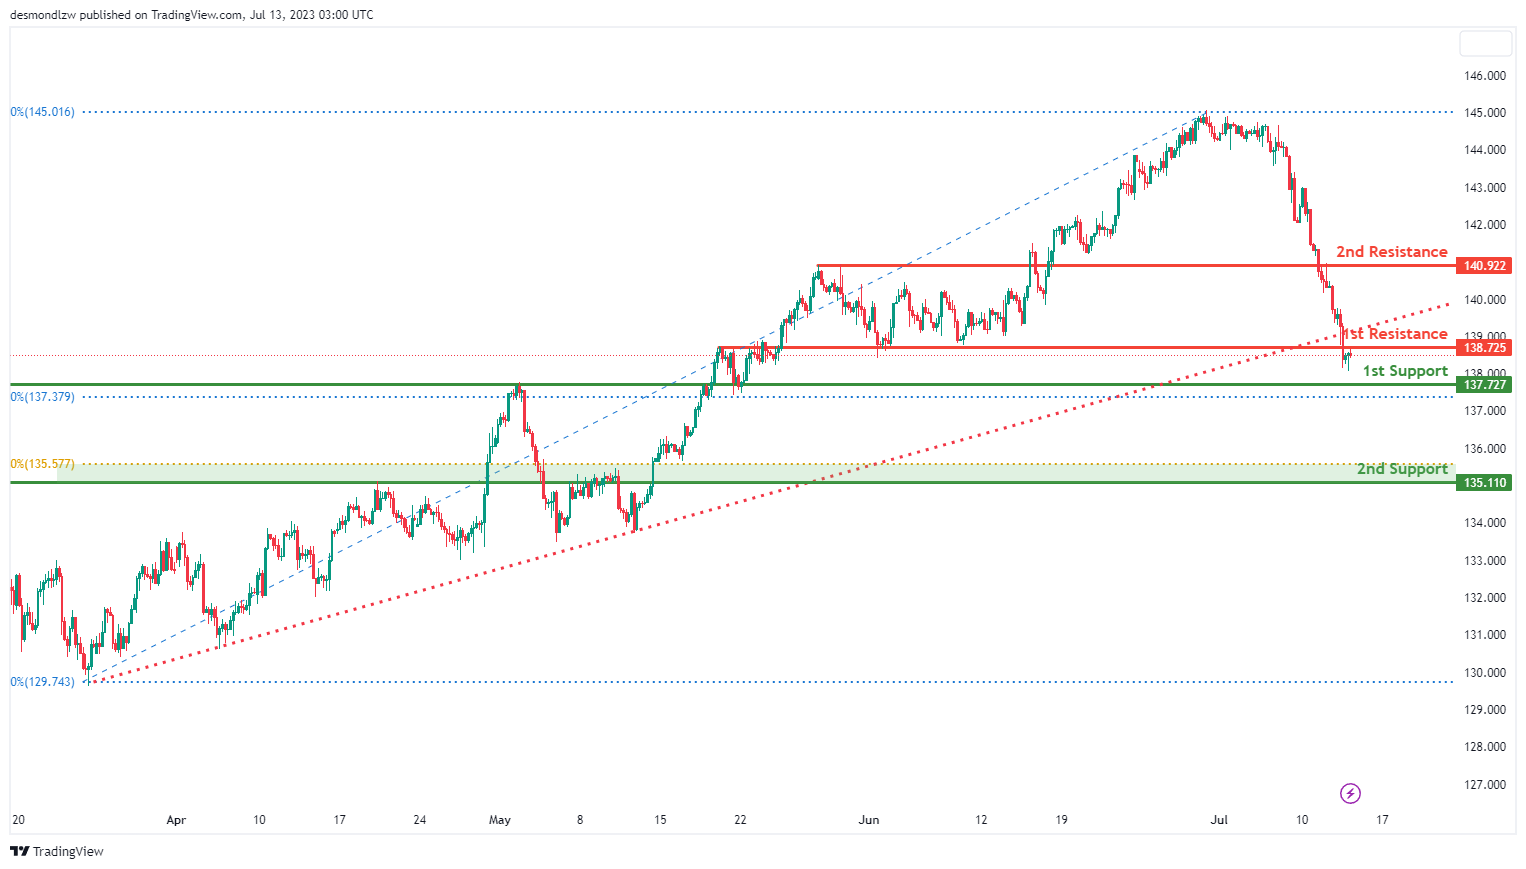
The USD/CHF pair is currently showing a bearish trend, triggered by a break below an ascending support line, suggesting a potential bearish continuation towards the 1st support level.
The 1st support level is situated at 137.72, characterized as an overlap support, coinciding with a 50% Fibonacci retracement, thus offering a significant level of price stability. Further down, the 2nd support level is at 135.11, another overlap support, aligning with a 61.80% Fibonacci retracement, reinforcing its significance.
On the upside, if the price starts to reverse, the 1st resistance level at 138.72, acting as a pullback resistance, could pose a significant challenge to the price advance.
If the price manages to breach this level, it might aim for the 2nd resistance level at 140.92, classified as an overlap resistance, which could serve as a potential hurdle to further price ascents.
USD/CAD:
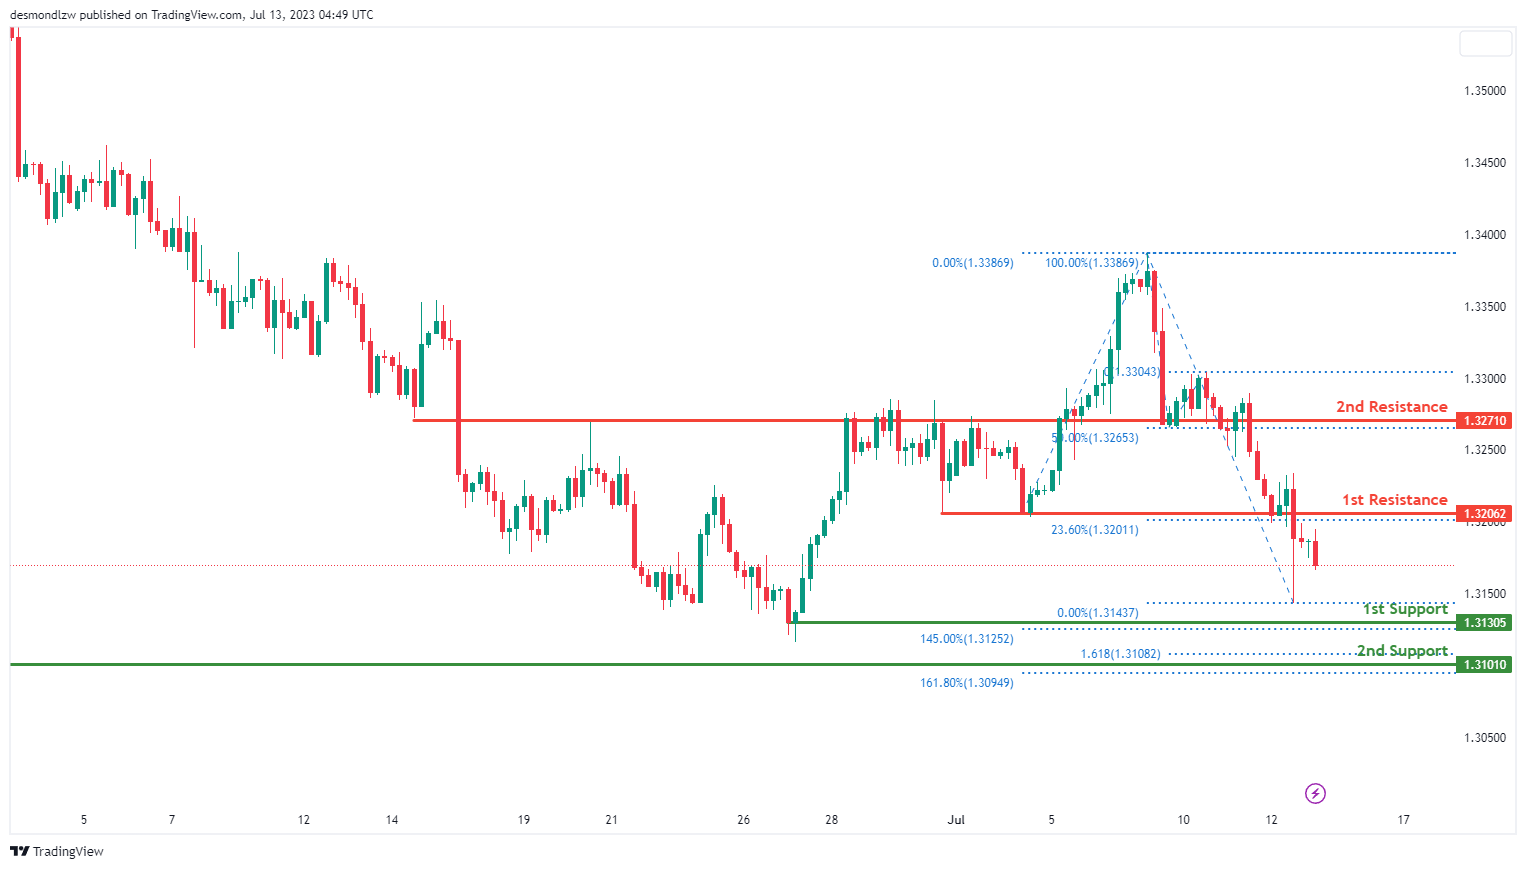
The USD/CAD pair is currently demonstrating a bearish trend, implying a potential bearish continuation towards the 1st support level.
The 1st support level stands at 1.3131 and is recognized as an overlap support that aligns with a 145.00% Fibonacci extension level, providing significant stability for the price. The 2nd support level at 1.3101, another overlap support, coincides with the 161.80% Fibonacci extension and 161.80% Fibonacci projection levels. The confluence of these Fibonacci levels adds robustness to this support level.
In contrast, the 1st resistance level is found at 1.3206, identified as an overlap resistance that also aligns with a 23.60% Fibonacci retracement level. This level could pose a significant hurdle to any upward price movements.
Further resistance might be encountered at the 2nd resistance level of 1.3271, which is an overlap resistance and coincides with a 50% Fibonacci retracement, offering another substantial barrier to price increases.
AUD/USD:
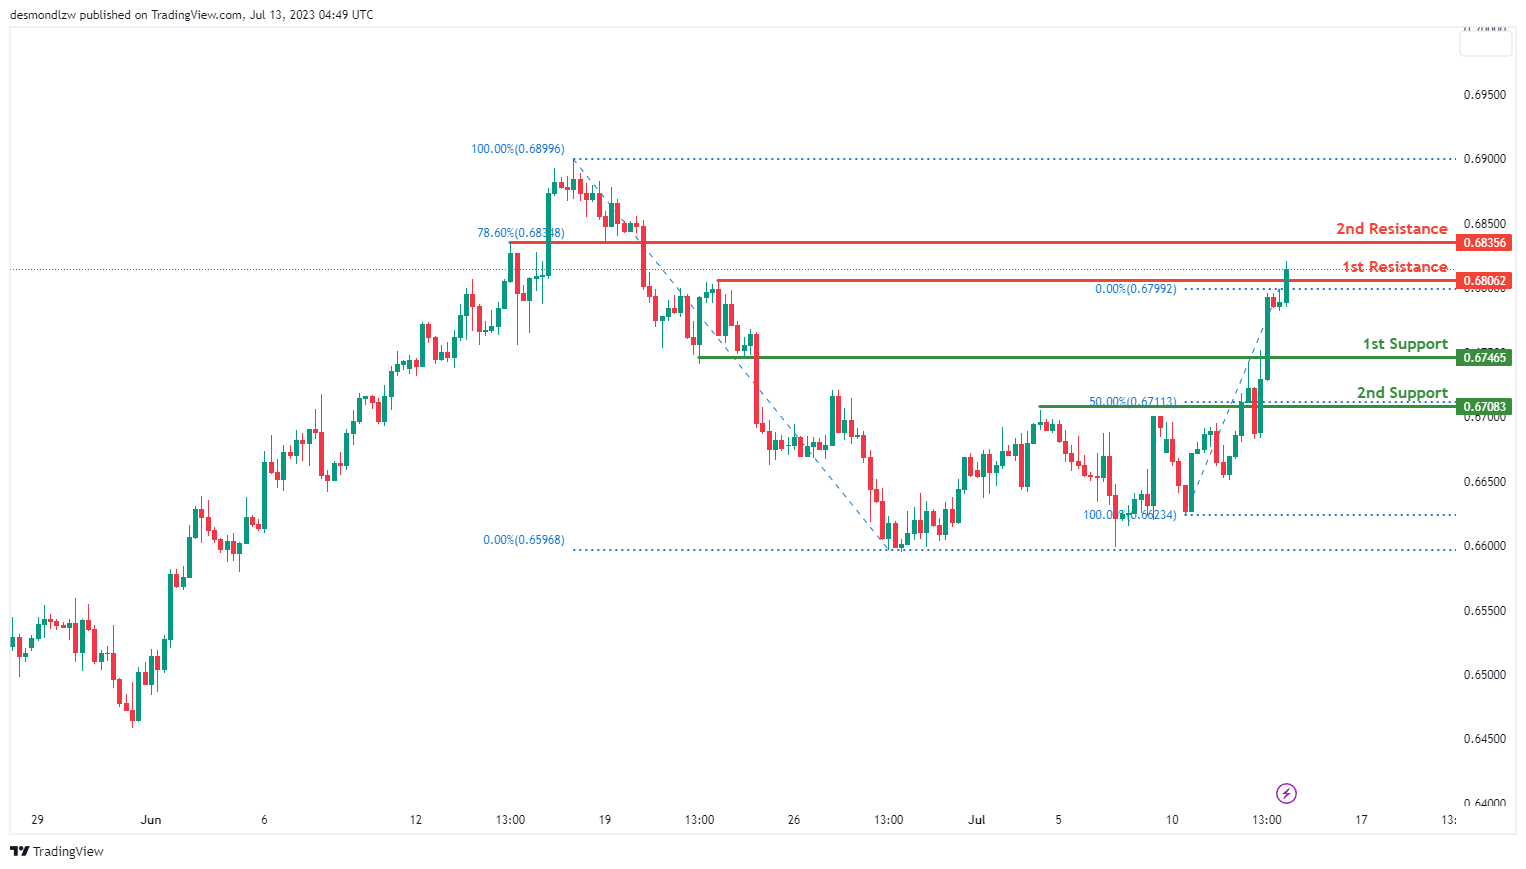
The AUD/USD pair is presently showing a bullish trend, suggesting a potential bullish continuation towards the 2nd resistance level.
The 1st support level is positioned at 0.6747, serving as an overlap support, offering significant stability for the price. The 2nd support level is situated at 0.6708, which is another overlap support, coinciding with a 50% Fibonacci retracement level, strengthening its role as a protective layer for the price.
Conversely, the price may continue its bullish movement towards the 2nd resistance level at 0.6836 after breaking through the 1st resistance at 0.6806, which was an overlap resistance. This 2nd resistance level, identified as an overlap resistance, aligns with a 78.6% Fibonacci retracement level, strengthening its importance.
NZD/USD
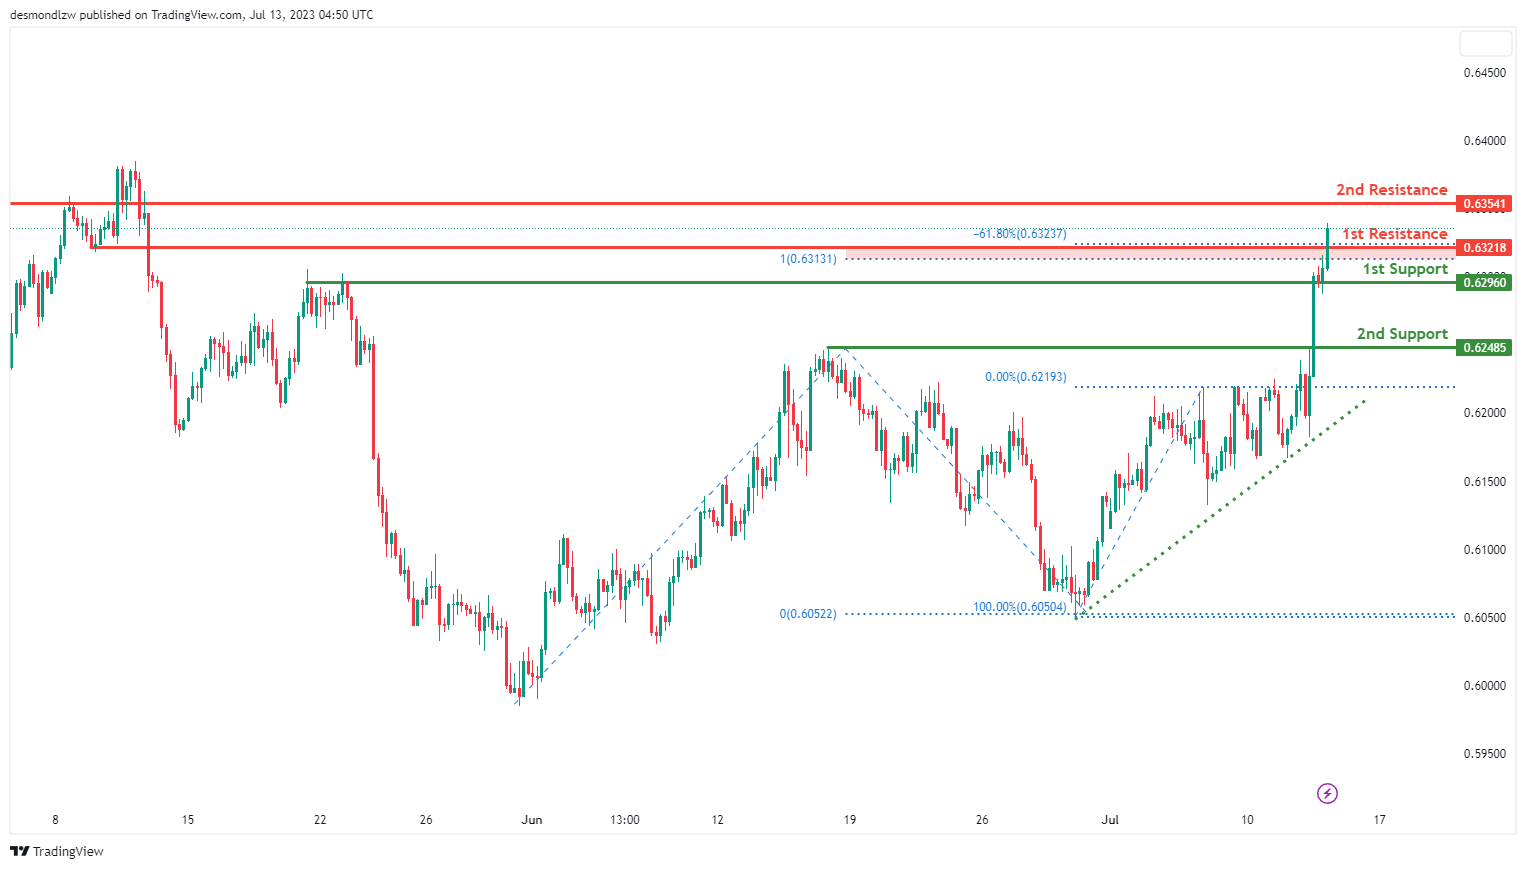
The NZD/USD pair currently exhibits a bullish momentum, indicating a possible bullish continuation towards the 2nd resistance level.
The 1st support level is set at 0.6296, acting as an overlap support, which provides a significant level of price stability. Further, the 2nd support level is found at 0.6249, functioning as another overlap support, offering additional assurance for potential price dips.
On the upside, the price may continue its bullish trend towards the 2nd resistance level at 0.6354 after breaking above the 1st resistance at 0.6322, which is an overlap resistance that aligns with a confluence of Fibonacci levels i.e. the -61.80% Fibonacci expansion and 100.00% Fibonacci projection levels, bolstering its significance.
DJ30:
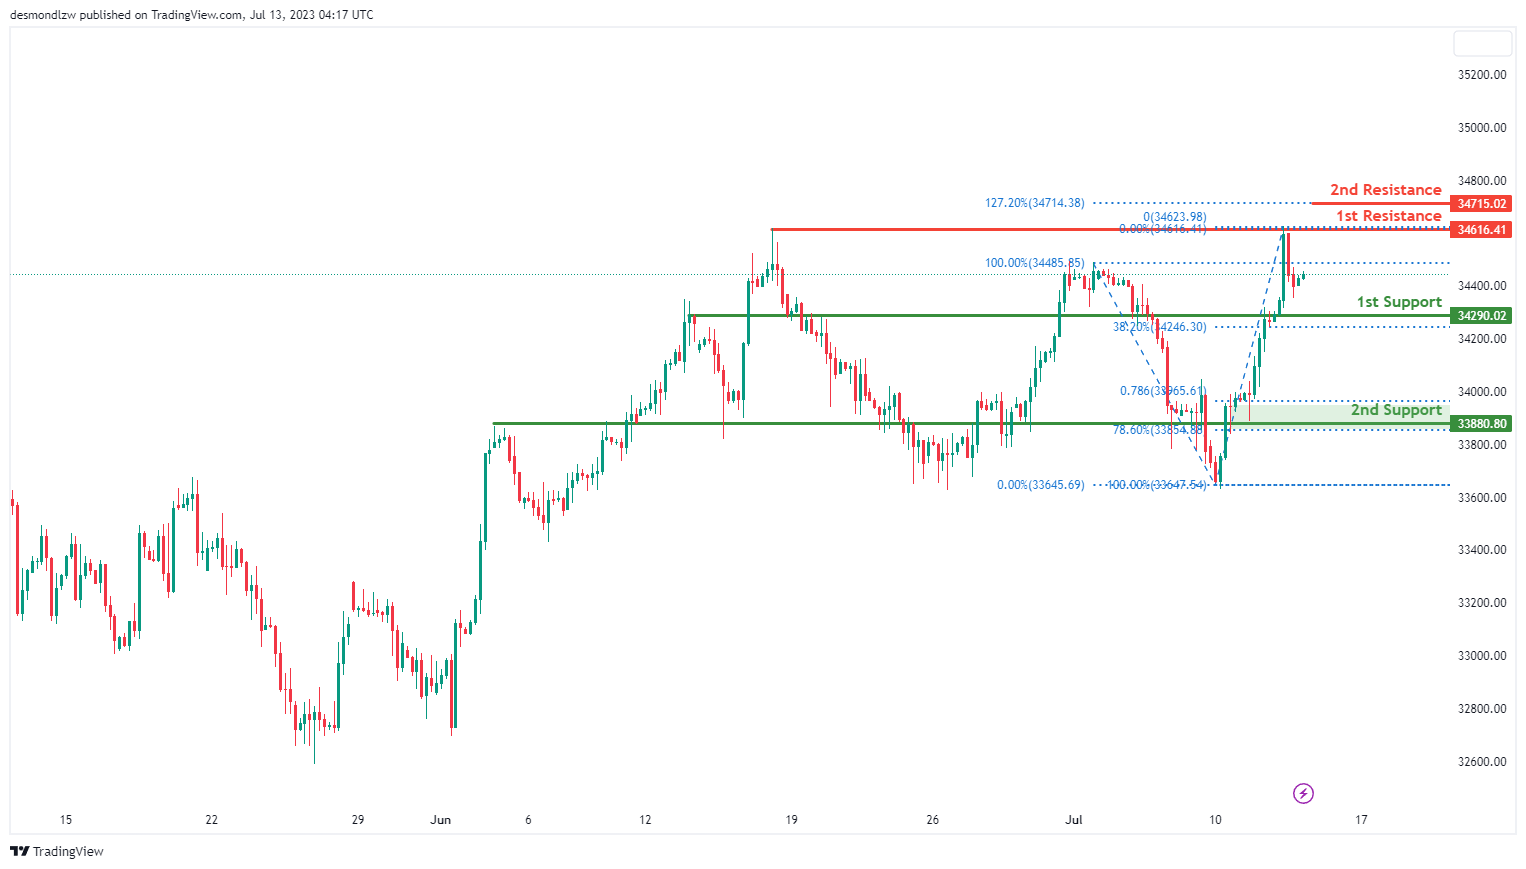
The DJ30 (Dow Jones Industrial Average) chart currently exhibits a bullish momentum. There is potential for the price to continue its upward movement towards the 1st resistance.
The 1st support level is located at 34290.0 and is considered significant as it represents an overlap support and aligns with the 38.20% Fibonacci retracement.
The 2nd support level is positioned at 33880.8 and is recognized as a strong support level. It represents an overlap support and aligns with the 78.60% Fibonacci retracement and the 78.60% Fibonacci projection, indicating a Fibonacci confluence.
Moving on to the resistance levels, the 1st resistance is found at 34616.4 and is deemed significant due to its role as a multi-swing high resistance. The 2nd resistance level is situated at 34733.2 and is considered noteworthy as it is situated at the 127.20% Fibonacci extension.
GER30:
The GER30 (DAX) chart currently exhibits a bullish momentum. There is potential for the price to continue its upward movement towards the 1st resistance.
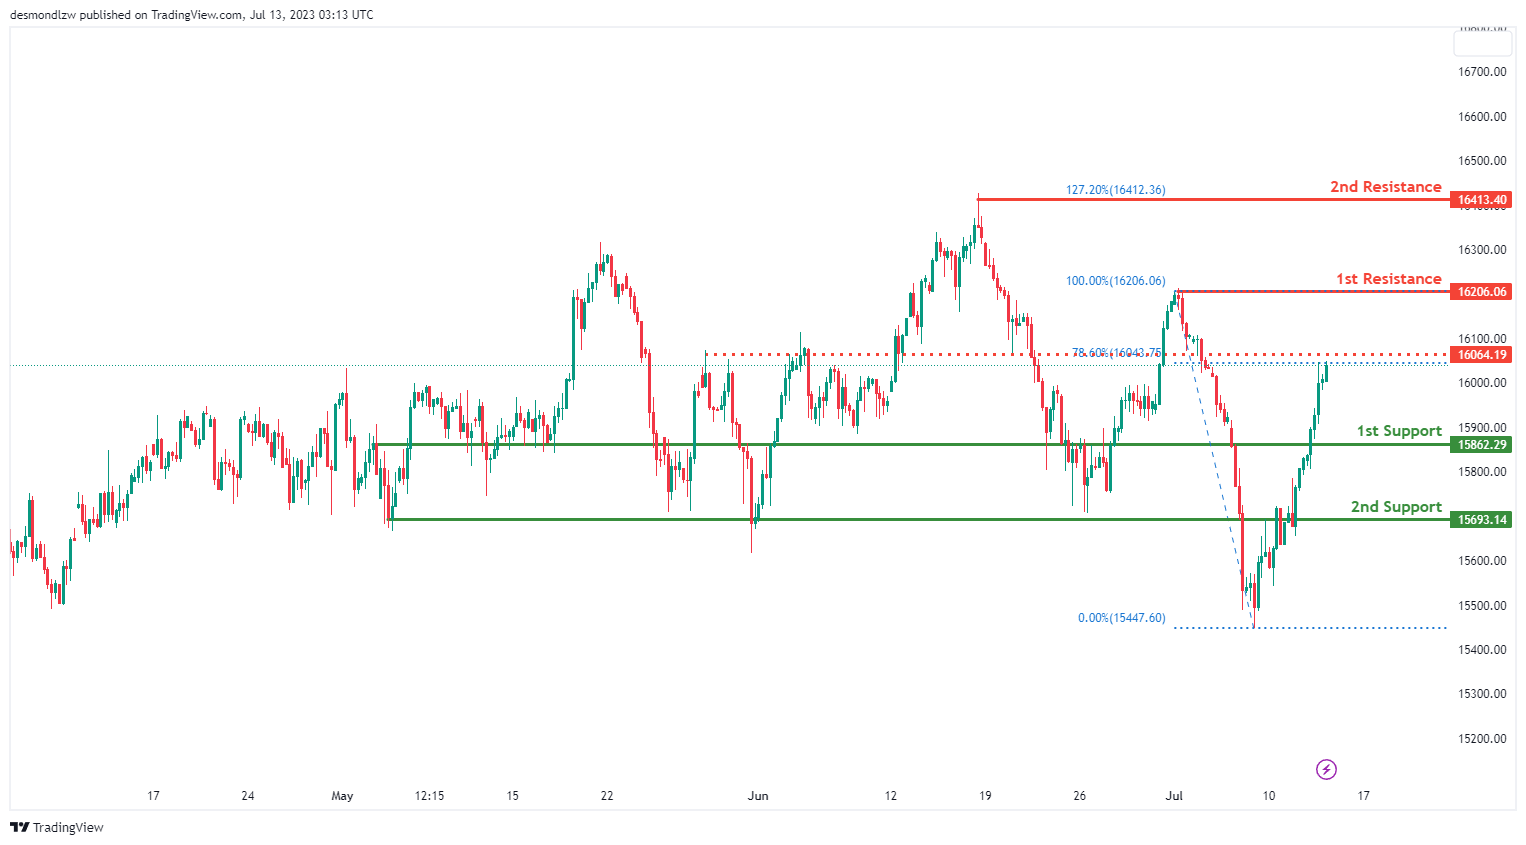
The 1st support level is located at 15862.2 and is considered significant as it represents a pullback support. The 2nd support level is positioned at 15693.1 and is recognized as a strong support level due to its pullback support characteristics.
Moving on to the resistance levels, the 1st resistance is found at 16206.0 and is significant as it represents a swing high resistance. The 2nd resistance level is situated at 16413.4 and is considered noteworthy as it represents another swing high resistance, along with a 127.20% Fibonacci extension.
Additionally, there is an intermediate resistance level at 16064.1, which is considered significant due to its overlap resistance and its correlation with the 78.60% Fibonacci retracement level.
US500
The US500 (S&P 500) chart currently demonstrates a bullish momentum. There is potential for the price to continue its upward movement towards the 1st resistance.
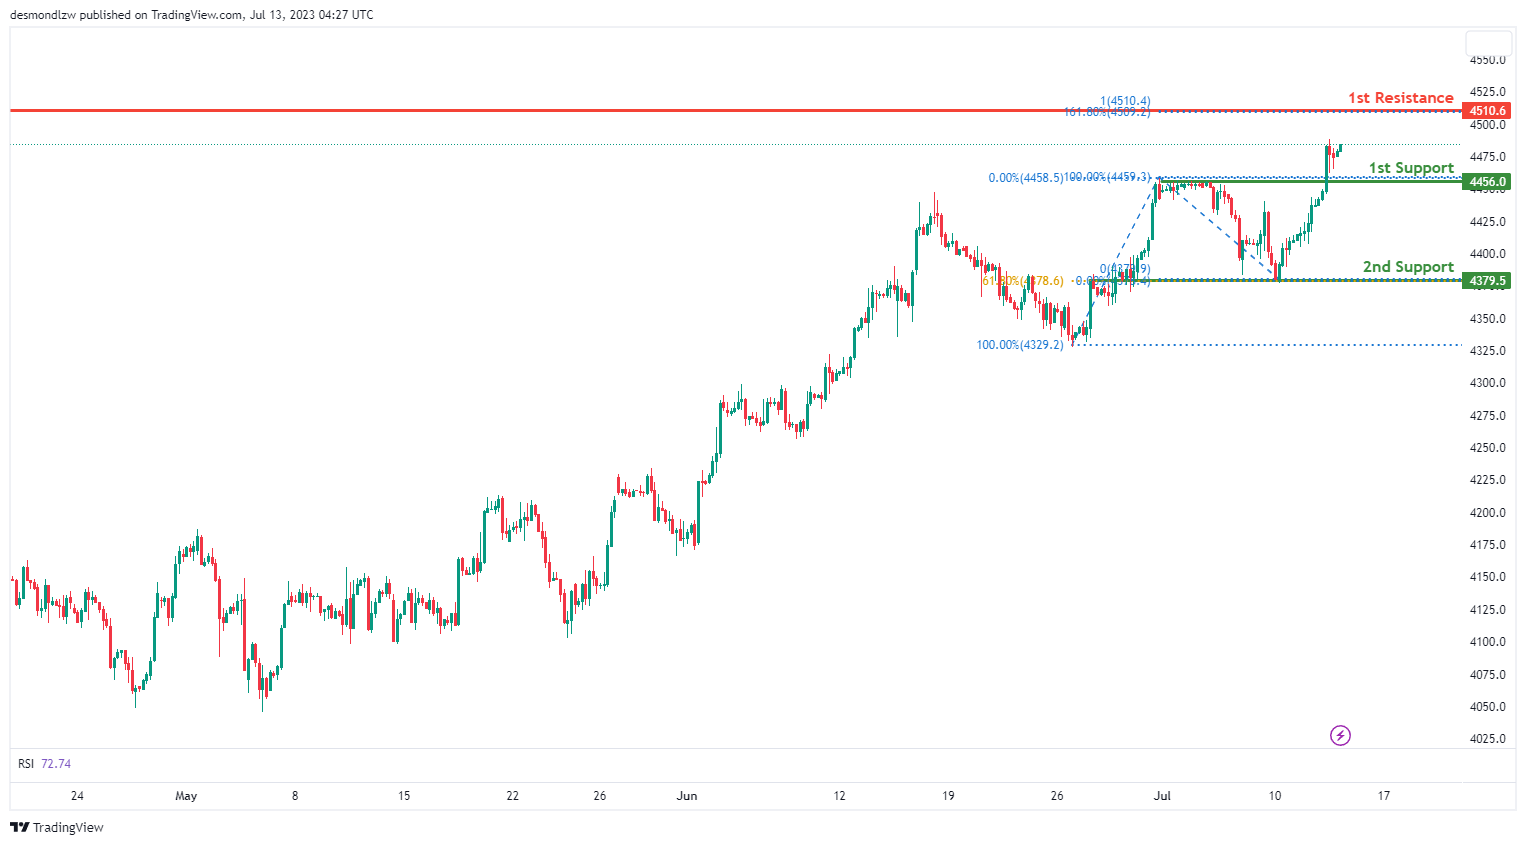
The 1st support level is located at 4456.0 and is considered significant as it represents a pullback support. The 2nd support level is positioned at 4379.3 and is recognized as a strong support level. It represents an overlap support and aligns with the 61.80% Fibonacci retracement level.
Moving on to the resistance levels, the 1st resistance is found at 4510.6. This resistance level is considered significant as it represents a swing-high resistance level, a 161.80% Fibonacci extension, and a 100% Fibonacci projection, indicating a Fibonacci confluence.
BTC/USD:
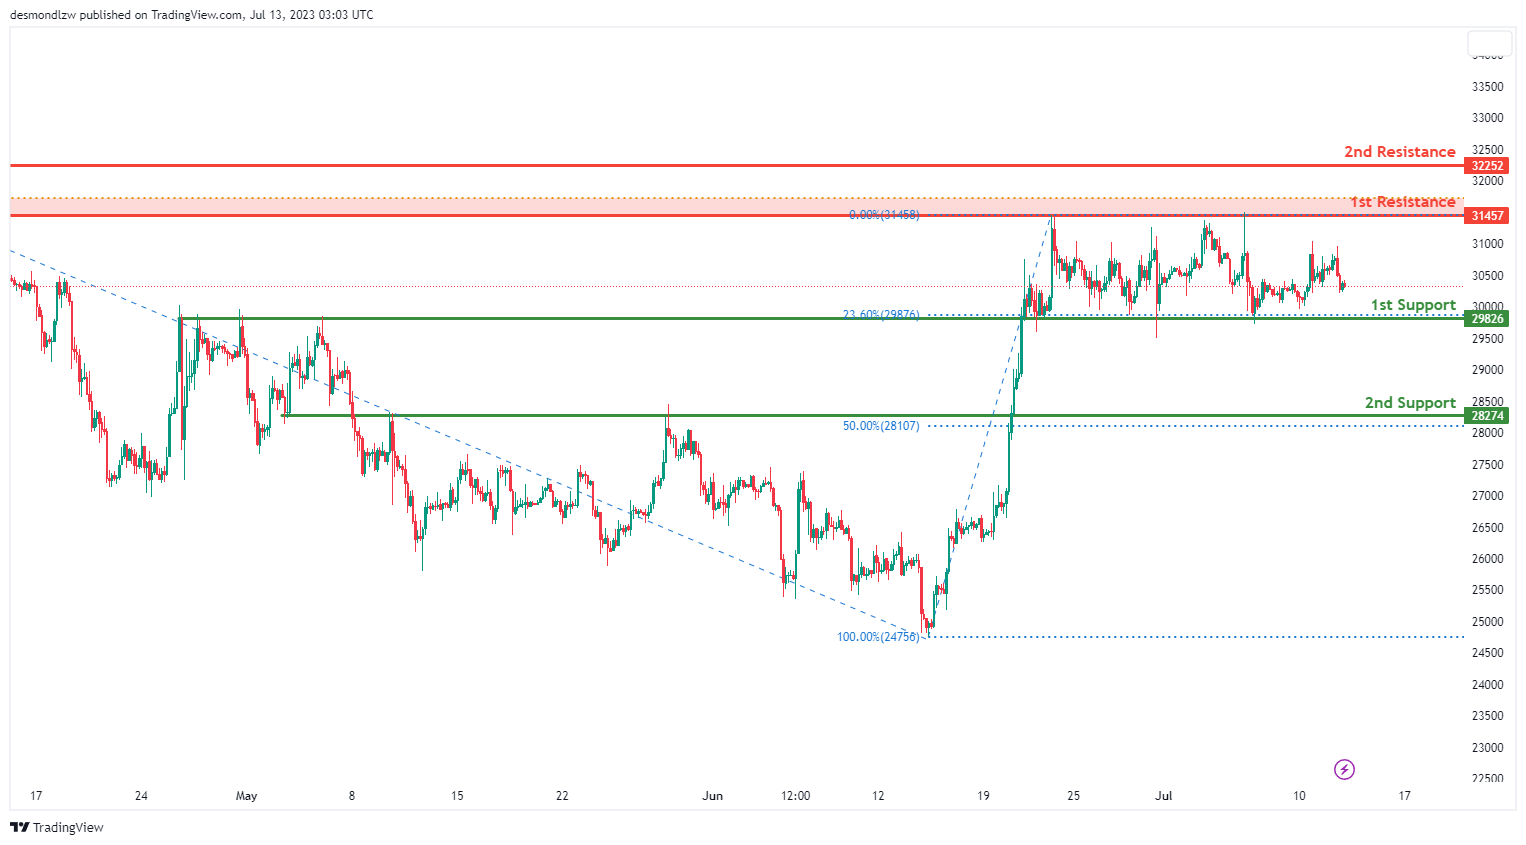
The BTC/USD instrument is currently showing a neutral overall momentum. It’s conceivable that the price might fluctuate between the 1st support and 1st resistance levels. The 1st support is positioned at 29826 and is viewed as strong due to its overlap support and a 23.60% Fibonacci Retracement.
The 2nd support, found at 28274, is also considered robust due to its overlap support and a 50% Fibonacci Retracement.
On the other hand, the 1st resistance is located at 31457 and is deemed significant owing to its multi-swing high resistance and a 61.80% Fibonacci Projection. The 2nd resistance, at 32252, is notable for its swing high resistance nature, which could potentially pose a significant obstacle for any upward movement in price.
ETH/USD:
The ETH/USD instrument is currently on a bearish trend, largely attributed to the price trading below the bearish Ichimoku cloud.
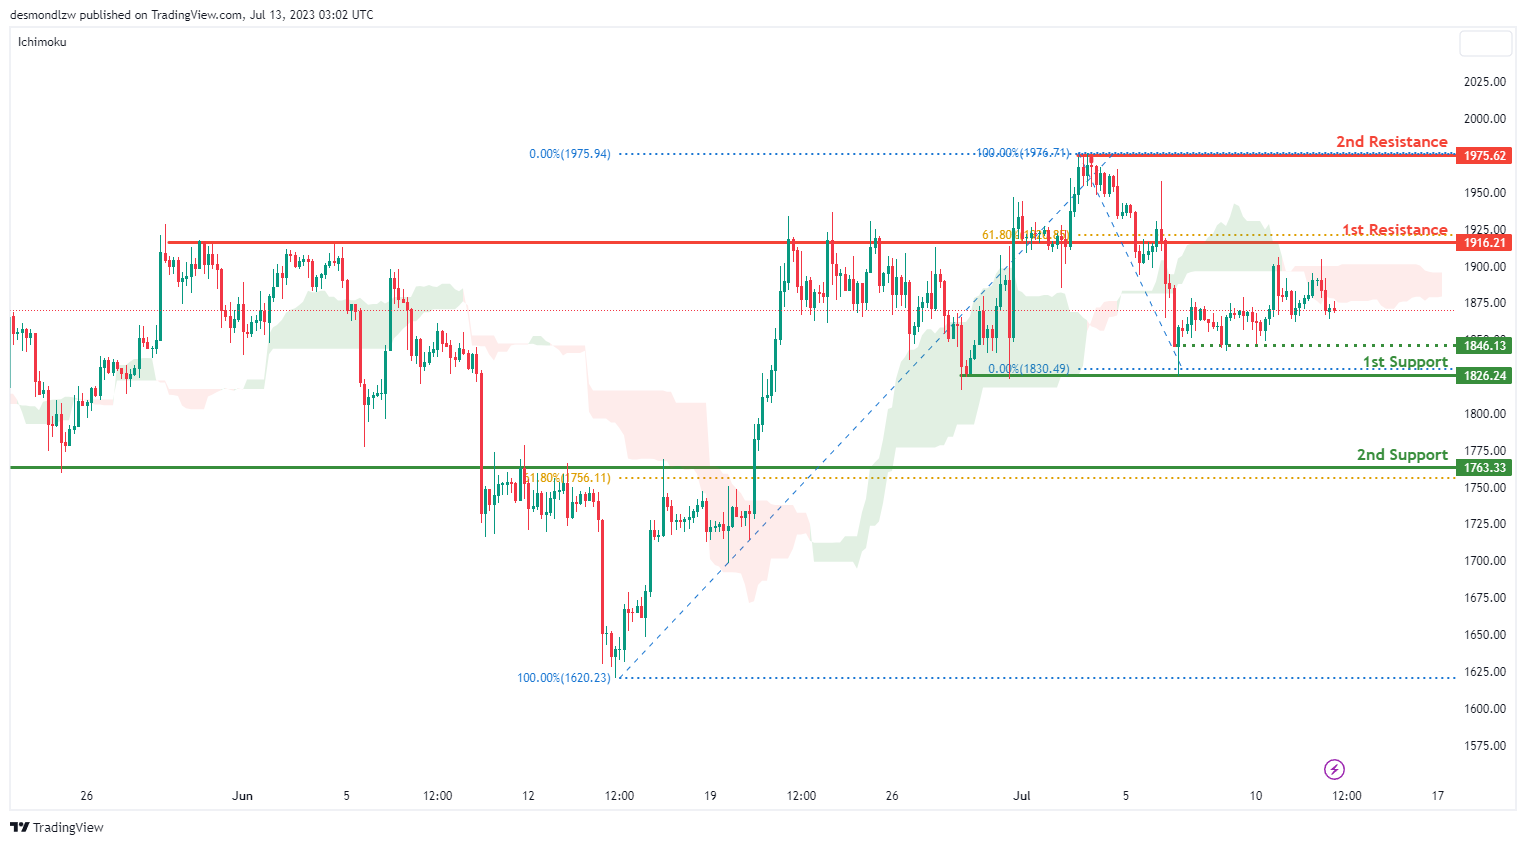
As the trend proceeds, it’s probable that the price might continue on this bearish direction towards the 1st support, positioned at 1826.24. This support level is regarded as strong due to its character as a multi-swing low support.
Further on, the 2nd support stands at 1763.33 and is considered strong due to its overlap support and a 61.80% Fibonacci Retracement.
On the other hand, the 1st resistance is positioned at 1916.21 and is recognized as significant due to its overlap resistance and a 61.80% Fibonacci Retracement. The 2nd resistance, found at 1975.62, is also notable as it represents swing high resistance, and could potentially pose an obstacle to any upward price movements.
An intermediate support level is also noticeable at 1846.13, recognized as durable due to its status as a multi-swing low support.
WTI/USD:
The WTI/USD chart is currently demonstrating bullish momentum, suggesting a potential continuation of this trend towards the 1st resistance level.
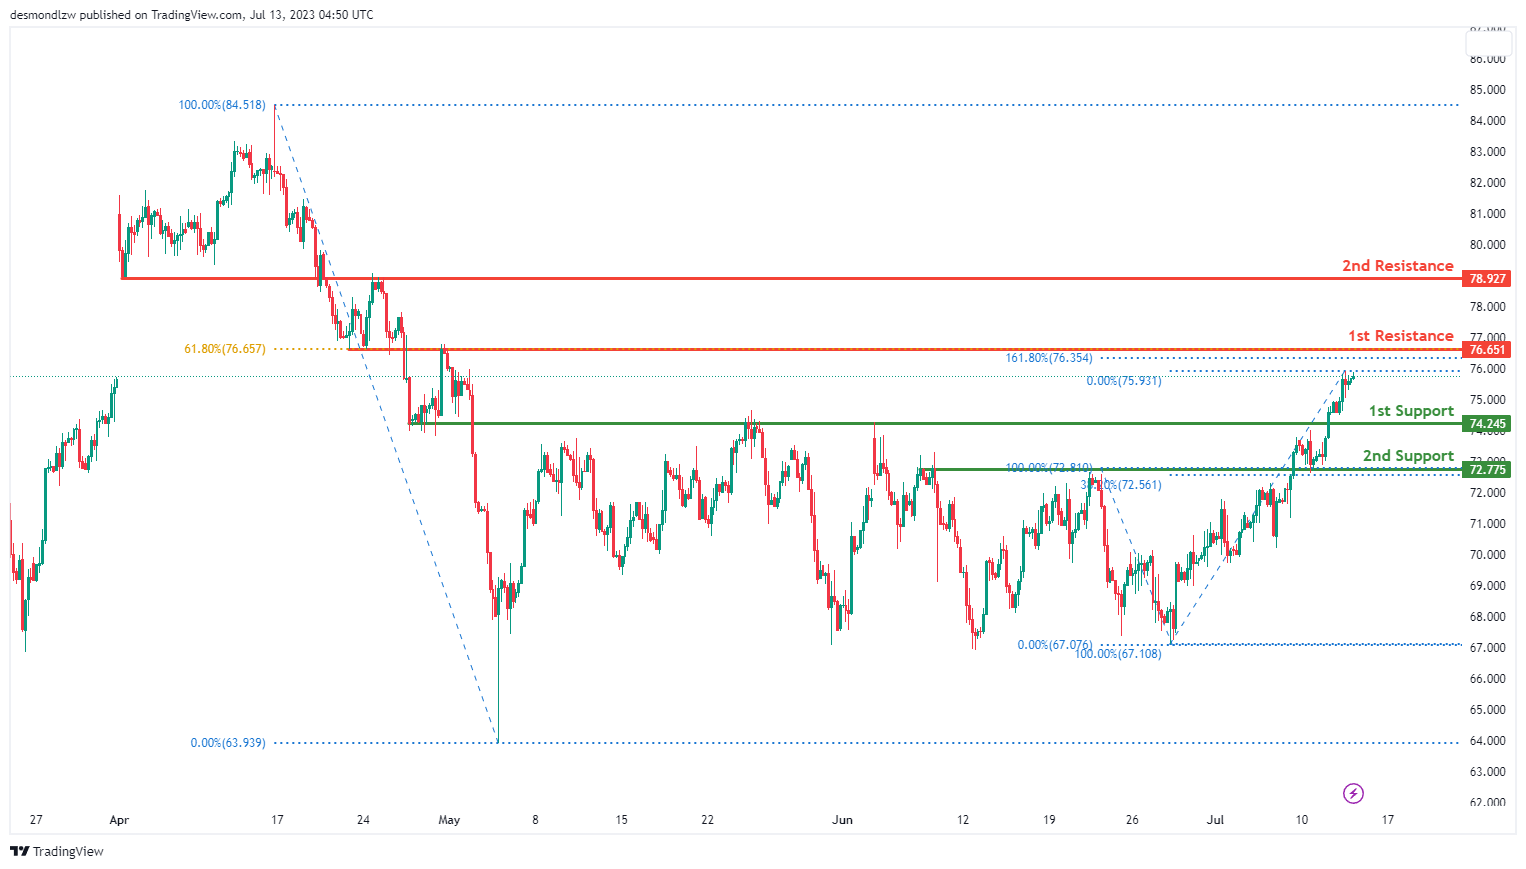
The 1st support level is at 74.25, characterized as an overlap support that provides a considerable level of price stability. A 2nd layer of support lies at 72.78, defined as another overlap support, and also aligns with a 38.20% Fibonacci retracement level, reinforcing its potential to halt a downward price movement.
On the bullish side, the 1st resistance level is at 76.65. This overlap resistance is significant as it coincides with the 61.80% Fibonacci retracement and 161.80% Fibonacci projection levels (Fibonacci confluence), adding to its potential to hinder upward price movement.
Should the price manage to breach the 1st resistance, it could then aim for the 2nd resistance level at 78.93. This overlap resistance stands as another potential barrier to further price ascents.
XAU/USD (GOLD):
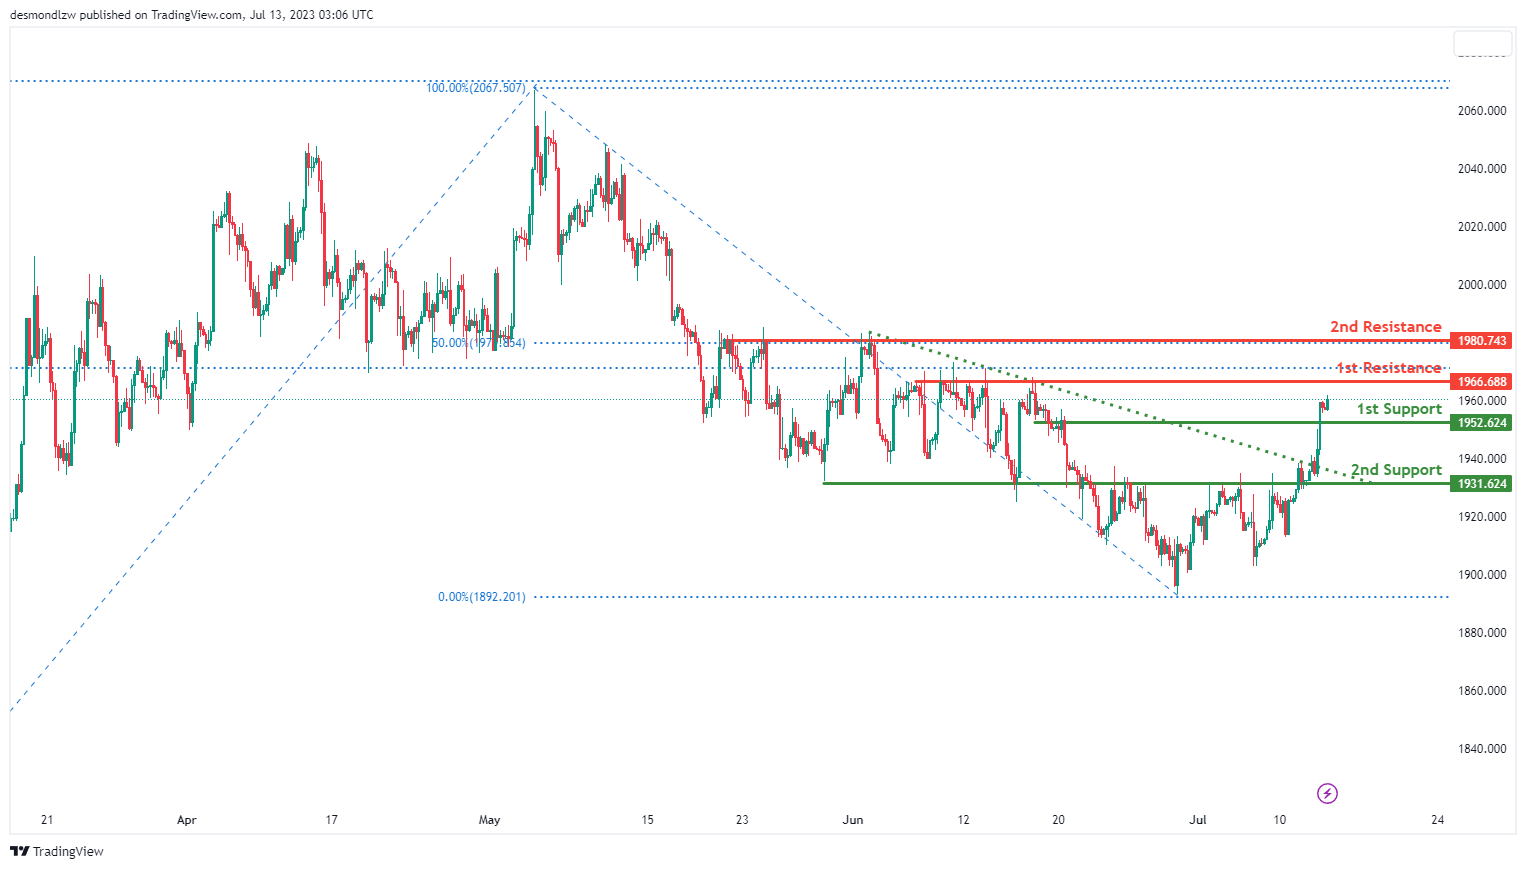
The XAU/USD pair currently exhibits a bullish trend, following a break above a descending resistance line, which suggests a potential bullish continuation towards the 1st resistance level.
On the downside, the 1st support level is found at 1952.62, serving as a pullback support, which could provide substantial stability to the price. Further down, the 2nd support level is located at 1931.62, identified as an overlap support that could potentially cushion any downward price movements.
On the upside, the price may continue its bullish trend towards the 1st resistance level at 1966.68. This resistance level is significant as it represents a multi-swing high resistance.
Should the price surpass this level, the next aim could be the 2nd resistance level at 1980.74, also a multi-swing high resistance, which aligns with a 50% Fibonacci retracement, strengthening its position as a potential barrier to further price increases.
UK GDP contracts -0.1% mom, production a main contributor
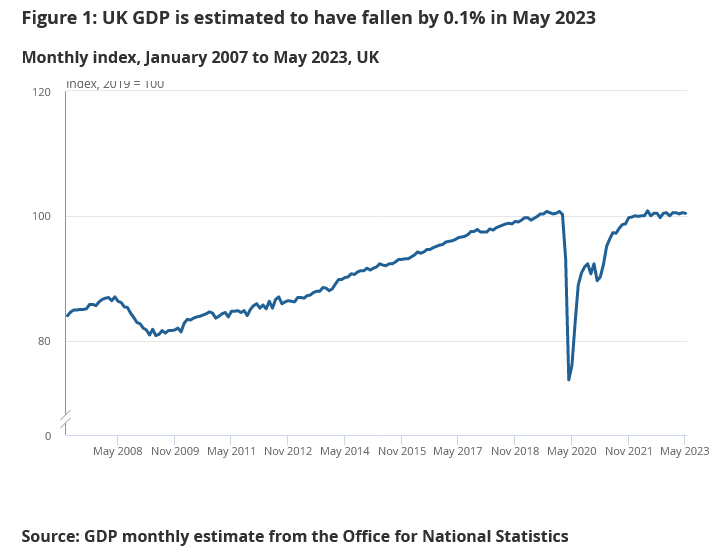
UK GDP contracted by -0.1% mom in May, slightly better than expectation of -0.3% mom contraction. However, taking a wider view, GDP showed stagnation over the three months to May. The contraction in May was largely due to a decrease in production output by -0.6% mom, contributing significantly to the overall GDP decline. In contrast, services output remained stagnant while construction output dipped by -0.2% mom.
ONS shed light on the situation, attributing part of the contraction to additional bank holiday for King Charles III's coronation on 8th May, which impacted a variety of manufacturing industries and construction businesses. On the brighter side, arts, entertainment, and recreation sector reported benefiting from the extra bank holiday.
The ONS report also highlighted that sectors such as health (specifically nursing), rail network, education, and civil service all saw industrial action take place in May 2023. Such strikes played a part in the month's economic movements.
Also released, industrial production came in at -0.6% mom, -2.3% yoy, versus expectation of -0.4% mom, -2.3% yoy. Manufacturing production was at -0.2% mom, -1.2% yoy, versus expectation of -0.5% mom, -1.7% yoy. Goods trade deficit widened from GBP -14.6B to GBP -18.7B, larger than expectation of GBP -14.6B.
USD/CHF Daily Outlook
Daily Pivots: (S1) 0.8623; (P) 0.8713; (R1) 0.8765; More...
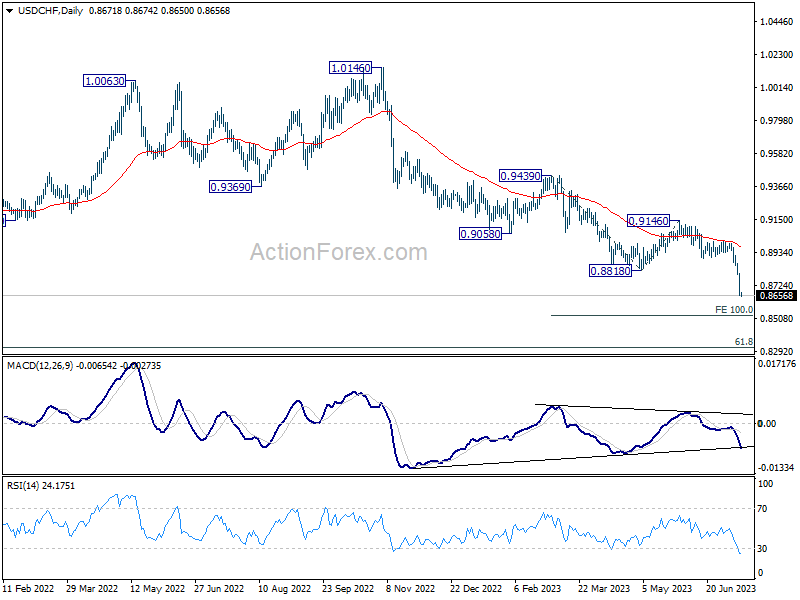
USD/CHF hits as low as 0.8650 so far today and intraday bias stays on the downside. Current fall should target 100% projection of 0.9439 to 0.8818 from 0.9146 at 0.8525 next. On the upside, above 0.8762 minor resistance will turn intraday bias neutral and bring consolidations first. But outlook will remain bearish as long as 0.8900 support turned resistance holds.
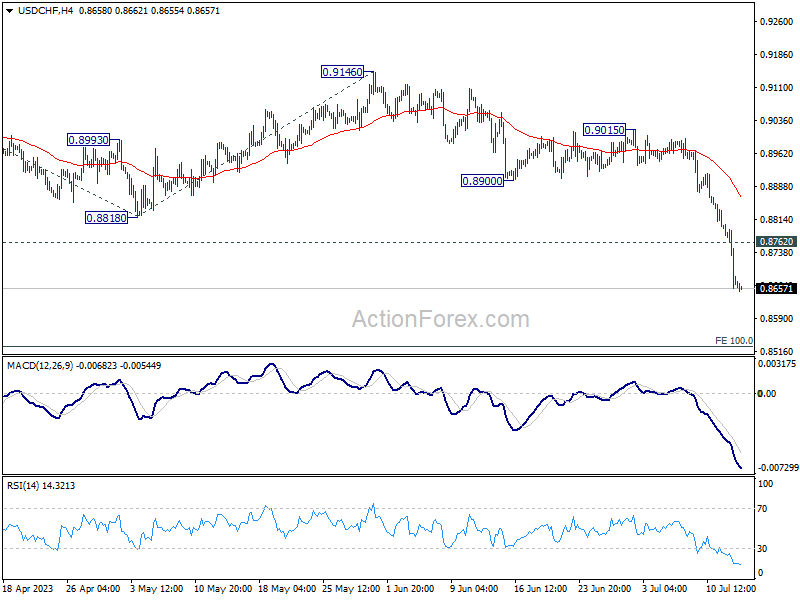
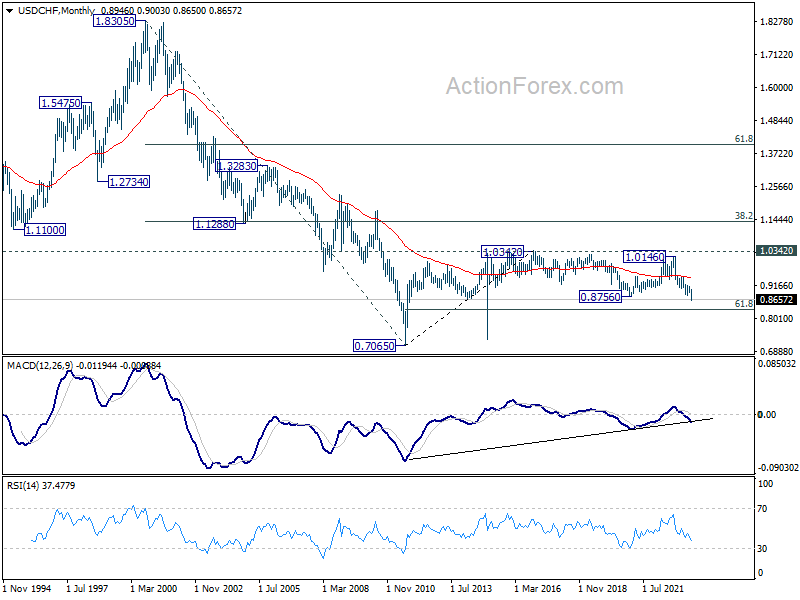
In the bigger picture, the break of 0.8756 (2021 low) indicates break out from the long term range pattern. For now, medium term outlook will stay bearish as long as 0.9146 resistance holds. Further fall would be seen to 61.8% retracement of 0.7065 (2011 low) to 1.0342 (2016 high) at 0.8317 next.
Dollar Might Take a Breather after Steep Selloff, Swiss Franc Taking the Top Spot
Following a significant post-CPI sell-off, Dollar's plunge appears to be losing some momentum during today's Asian trading session on oversold conditions. However, the greenback is yet to demonstrate any considerable signs of a rebound. Investors seem buoyed by the waning likelihood of Fed extending its tightening phase beyond the imminent July interest rate hike. As it stands, Fed fund futures are reflecting less than 30% chance for further rate hikes throughout the remainder of the year. In sync with this development, major Asian stock indexes are showing considerable gains, riding on the coattails of US market rally overnight.
New Zealand and Australian Dollar are the stronger ones for today. followed by Swiss Franc. Meanwhile, Dollar, Yen and Canadian are the worst. But for the week, Swiss Franc is the top gainer at this point, helped by EUR/CHF breaking through a key near term support level. Yen is still strong as the second, but got its first place taken by the Franc. Canadian Dollar is the second worst following Dollar despite yesterday's BoC rate hike. Euro is having a slight advantage over Sterling while Aussie and Kiwi are mixed.
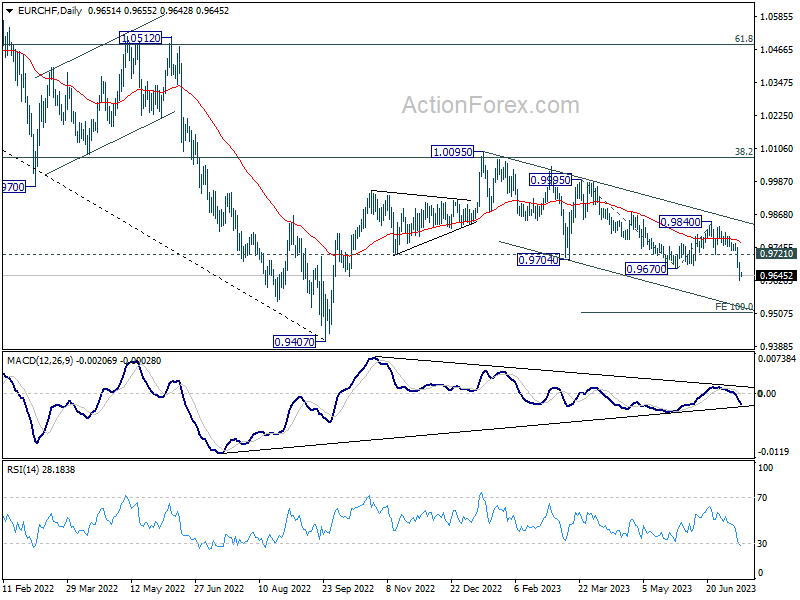
Technically, EUR/CHF's dive through 0.9670 support confirms resumption of whole decline from 1.0095. The structure of the fall still suggests that it's a corrective move. But deeper decline would remain in favor as long as 0.9721 support turned resistance holds. Next target is 100% projection of 0.9995 to 0.9670 from 0.9840 at 0.9515. If realized, the extended fall in EUR/CHF would make USD/CHF short a better trade than EUR/USD long.
In Asia, at the time of writing, Nikkei is up 1.40%. Hong Kong HSI is up 2.32%. China Shanghai SSE is up 0.99%. Singapore Strait Times is up 1.75%. Japan 10-year JGB yield is down -0.0080 at 0.472. Overnight, DOW rose 0.25%. S&P 500 rose 0.74%. NASDAQ rose 1.15%. 10-year yield dropped -0.119 to 3.861.
Fed Beige Book: Slight increase in economic activity and modest price rises
Fed's Beige Book report noted that the "overall economic activity increased slightly since late May." Notably, the level of economic development varied across the twelve districts, with five districts reporting growth, five noticing no change, and two marking modest declines.
The Beige Book described a cautiously optimistic picture for the future, stating that "overall economic expectations for the coming months generally continued to call for slow growth."
Despite the uneven growth rate, the districts generally agreed on the direction of price changes. The report noted that "prices increased at a modest pace overall, and several districts noted some slowing in the pace of increase."
Looking ahead, the report suggests that the "price expectations were generally stable or lower over the next several months".
The employment situation was characterized by a modest rise, with the Beige Book stating that "employment increased modestly this period, with most districts experiencing some job growth."
NZ BNZ PMI fell to 47.5, sector remains entrenched in contraction
New Zealand's manufacturing sector is experiencing a continuous contraction according to BusinessNZ Performance of Manufacturing Index. The Index showed a drop from 48.7 in May to 47.5 in June, marking another month of activity below the crucial 50.0 point mark which separates expansion from contraction.
An analysis of the sub-indices revealed mixed performances across different facets of the sector. While production showed a modest rise from 46.0 to 47.5, new orders experienced a significant drop from 50.2 to 43.8. Meanwhile, employment levels decreased from 49.3 to 47.0. Both finished stocks and deliveries saw rises, from 51.6 to 52.2 and 46.1 to 50.5 respectively.
Alongside this contraction in activity, the report noted an increase in negative sentiment among manufacturers. In June, the proportion of negative comments increased to 74.5%, up from 66.7% in May and 70.3% in April. According to manufacturers, the primary negative influences on current activity are declining demand, inflationary pressures, and issues surrounding production and staffing.
BusinessNZ's Director, Advocacy Catherine Beard, pointed out the persisting contraction in the sector, saying, "the sector remains entrenched in contraction, with eight of the last ten months showing overall activity below the 50.0 point mark."
China's exports down -12.4% yoy in Jun, imports down -6.8% yoy
China's trade dynamics in June spun a story of steeper than expected declines on both the import and export front. With the largest export drop since February 2020.
June's figures reveal a -12.4% yoy slump in China's exports, far exceeding anticipated -9.5% yoy decline and outpacing May's -7.5% yoy drop. Imports followed a similar pattern, decreasing by -6.8% yoy, steeper fall than projected 4.0% and more significant contraction than May's -4.5% yoy shrinkage.
Despite these challenges, China's trade surplus managed to grow from USD 68.1B to USD 70.62B. However, this increase didn't quite hit expectation of a USD 74.8B surplus.
Lu Daliang, a spokesperson for China's customs bureau, cautioned that the nation's trade is expected to face substantial pressure in the second half of the year. During a press conference, Lu attributed these pressures to high inflation in developed countries and geopolitical issues.
Looking ahead
UK GDP, production and goods trade balance; Eurozone industrial production, and ECB meeting accounts are the main highlights in European session. US will release jobless claims and PPI later in the day.
USD/CHF Daily Outlook
Daily Pivots: (S1) 0.8623; (P) 0.8713; (R1) 0.8765; More...
USD/CHF hits as low as 0.8650 so far today and intraday bias stays on the downside. Current fall should target 100% projection of 0.9439 to 0.8818 from 0.9146 at 0.8525 next. On the upside, above 0.8762 minor resistance will turn intraday bias neutral and bring consolidations first. But outlook will remain bearish as long as 0.8900 support turned resistance holds.
In the bigger picture, the break of 0.8756 (2021 low) indicates break out from the long term range pattern. For now, medium term outlook will stay bearish as long as 0.9146 resistance holds. Further fall would be seen to 61.8% retracement of 0.7065 (2011 low) to 1.0342 (2016 high) at 0.8317 next.
Economic Indicators Update
| GMT | Ccy | Events | Actual | Forecast | Previous | Revised |
|---|---|---|---|---|---|---|
| 22:30 | NZD | Business NZ PMI Jun | 47.5 | 48.9 | 48.7 | |
| 23:01 | GBP | RICS Housing Price Balance Jun | -46% | -30% | ||
| 01:00 | AUD | Consumer Inflation Expectations Jul | 5.20% | 5.20% | ||
| 03:00 | CNY | Trade Balance (USD) Jun | 70.6B | 74.0B | 65.8B | |
| 06:00 | GBP | GDP M/M May | -0.30% | 0.20% | ||
| 06:00 | GBP | Industrial Production M/M May | -0.40% | -0.30% | ||
| 06:00 | GBP | Industrial Production Y/Y May | -2.30% | -1.90% | ||
| 06:00 | GBP | Manufacturing Production M/M May | -0.50% | -0.30% | ||
| 06:00 | GBP | Manufacturing Production Y/Y May | -1.70% | -0.90% | ||
| 06:00 | GBP | Goods Trade Balance (GBP) May | -14.6B | -15.0B | ||
| 09:00 | EUR | Eurozone Industrial Production M/M May | 0.30% | 1.00% | ||
| 11:30 | EUR | ECB Monetary Policy Meeting Accounts | ||||
| 12:30 | USD | PPI M/M Jun | 0.20% | -0.30% | ||
| 12:30 | USD | PPI Y/Y Jun | 0.40% | 1.10% | ||
| 12:30 | USD | PPI Core M/M Jun | 0.20% | 0.20% | ||
| 12:30 | USD | PPI Core Y/Y Jun | 2.60% | 2.80% | ||
| 12:30 | USD | Initial Jobless Claims (Jul 7) | 250K | 248K | ||
| 14:30 | USD | Natural Gas Storage | 49B | 72B |
China’s exports down -12.4% yoy in Jun, imports down -6.8% yoy
China's trade dynamics in June spun a story of steeper than expected declines on both the import and export front. With the largest export drop since February 2020.
June's figures reveal a -12.4% yoy slump in China's exports, far exceeding anticipated -9.5% yoy decline and outpacing May's -7.5% yoy drop. Imports followed a similar pattern, decreasing by -6.8% yoy, steeper fall than projected 4.0% and more significant contraction than May's -4.5% yoyshrinkage.
Despite these challenges, China's trade surplus managed to grow from USD 68.1B to USD 70.62B. However, this increase didn't quite hit expectation of a USD 74.8B surplus.
Lu Daliang, a spokesperson for China's customs bureau, cautioned that the nation's trade is expected to face substantial pressure in the second half of the year. During a press conference, Lu attributed these pressures to high inflation in developed countries and geopolitical issues.
NZ BNZ PMI fell to 47.5, sector remains entrenched in contraction
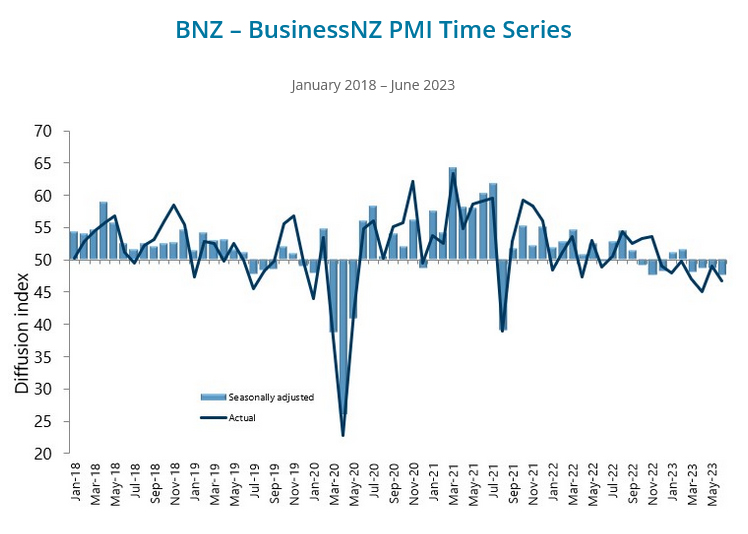
New Zealand's manufacturing sector is experiencing a continuous contraction according to BusinessNZ Performance of Manufacturing Index. The Index showed a drop from 48.7 in May to 47.5 in June, marking another month of activity below the crucial 50.0 point mark which separates expansion from contraction.
An analysis of the sub-indices revealed mixed performances across different facets of the sector. While production showed a modest rise from 46.0 to 47.5, new orders experienced a significant drop from 50.2 to 43.8. Meanwhile, employment levels decreased from 49.3 to 47.0. Both finished stocks and deliveries saw rises, from 51.6 to 52.2 and 46.1 to 50.5 respectively.
Alongside this contraction in activity, the report noted an increase in negative sentiment among manufacturers. In June, the proportion of negative comments increased to 74.5%, up from 66.7% in May and 70.3% in April. According to manufacturers, the primary negative influences on current activity are declining demand, inflationary pressures, and issues surrounding production and staffing.
BusinessNZ's Director, Advocacy Catherine Beard, pointed out the persisting contraction in the sector, saying, "the sector remains entrenched in contraction, with eight of the last ten months showing overall activity below the 50.0 point mark."
Fed Beige Book: Slight increase in economic activity and modest price rises
Fed's Beige Book report noted that the "overall economic activity increased slightly since late May." Notably, the level of economic development varied across the twelve districts, with five districts reporting growth, five noticing no change, and two marking modest declines.
The Beige Book described a cautiously optimistic picture for the future, stating that "overall economic expectations for the coming months generally continued to call for slow growth."
Despite the uneven growth rate, the districts generally agreed on the direction of price changes. The report noted that "prices increased at a modest pace overall, and several districts noted some slowing in the pace of increase."
Looking ahead, the report suggests that the "price expectations were generally stable or lower over the next several months".
The employment situation was characterized by a modest rise, with the Beige Book stating that "employment increased modestly this period, with most districts experiencing some job growth."
US Inflation: Great Progress, But Risks Remain
Headline inflation is now a fraction of its peak level; however, by itself, shelter’s contribution is greater than the FOMC’s 2.0%yr target.
In June, both the headline and core CPI outcomes were below expectations at 0.2%, leaving the respective annual rates at 3.0%yr and 4.8%yr, materially below their 2022 peaks of 9.1%yr and 6.6%yr. The so called ‘Supercore’ measure (core services ex housing) was midway between the headline and core prints at 4.0%yr and compares to a peak in 2022 of 6.5%yr.
In the underlying detail is clear evidence of a broad-based deceleration in price pressures. On a six-month annualised basis, inflation for ‘food at home’ has slowed from 12.5% last July to 2.5%; while ‘food away from home’ has eased from 10.8% in October to 6.3%. Inflation for goods ex energy and food is also only a fraction of its 2021 peak rate, 2.6% compared to 13.9%. Though in recent months, there has been considerable variability in price outcomes by item.
Whereas apparel has experienced consistent monthly gains of 0.3% over the past four months and new vehicle prices are little changed, used car prices rose 4.4% in both April and May and then only declined 0.5% in June. Conversely for services, while medical care and education prices are marginally lower over the past four months and recreation costs modestly higher, airline fares have plunged, -2.6%; -3.0%; and -8.1% in April to June to be 18.9% lower than a year ago. Clearly the post-pandemic re-opening has run its course; but, as for used cars, some sectors still face an imbalance between demand and supply.
The most important area of the economy facing such a concern is housing. While the shelter component of the CPI, which is primarily determined by rents, has decelerated from an average reading of 0.7% through Q1 to 0.5% in Q2, that still equates to a 6% annualised pace for Q2, twice the average pace back to 1994. Given its 35% headline CPI weight, shelter is currently contributing 2.1ppts to inflation on an annualised basis. For core, the contribution is larger still at 2.6ppts as shelter’s weight within the core is 43.5%.
This is a critical point to highlight: shelter has the capacity to create at or above target outcomes for inflation by itself if current rates of rent inflation persist. Our baseline expectation is instead that it will follow the market rent measures down through the remainder of the year to a still above average 4.5% annualised pace at December, allowing headline inflation to ease to 2.0% annualised. But clearly there are risks to the upside.
Changing tack, the Federal Reserve’s July Beige Book was also released overnight and was constructive for the outlook. Economic activity was reported to have “increased slightly since May”, employment only “modestly”. Most significant for inflation is that the “unusually high [labour market] turnover rates in recent years appear to be returning to pre-pandemic norms” and contacts “in multiple Districts reported that wage increases were returning to or nearing pre-pandemic levels”.
While not a factor for shelter, these outcomes support the case for a continued deceleration in discretionary service categories of inflation such as ‘food away from home’ and travel, particularly as momentum in goods input costs has already receded. The “reluctance to raise prices because consumers had grown more sensitive” shown by contacts in some districts in May to July is therefore likely to gain greater traction ahead, further helping to moderate inflation outside of housing. Price pressures seen as “generally stable or lower over the next several months” support this thesis.
With respect to the implications for the FOMC, as above we anticipate that by year end, six-month annualised inflation will be at 2.0%yr, albeit with the risk of a higher pulse if the shelter component shows greater persistence. On an annual basis, that equates to a 2.6%yr annual rate against the FOMC’s 3.2%yr expectation as per their June forecasts. At year-end, we also expect to see the unemployment rate around 4.0%, in line with the FOMC’s current expectation, and annual GDP growth of 0.7%yr, below the FOMC’s 1.0%yr forecast. Note, part of the difference between our and the FOMC’s expectation for growth through 2023 is a contraction in Q4 2023, which we see as the first part of a small technical recession over the six months to March 2024.
We therefore see the FOMC progressively becoming more focused on the risks to activity through the second half of 2023, having completed the tightening cycle in July with a 25bp hike to 5.375% and highlighted the need for policy to remain contractionary for an extended period at August’s Jackson Hole Symposium. The most likely timing for the first cut is therefore March 2024 when we expect a 25bp reduction (note, previously we had forecast 50bps of cuts in Q1 2024, but the January meeting now seems too early and 50bps at March too sudden). Rate cuts are then expected to continue at 50bps per quarter through Q2 2024 to Q2 2025, leaving the fed funds rate at 2.625% mid-2025 (unchanged from our prior forecast). At that level, the fed funds rate is best considered broadly neutral, being in line with the FOMC’s 2.50% ‘longer run’ expectation. As is the case in late-2023, the prime risk for 2024 and 2025 is that shelter inflation is stronger than currently forecast, leaving little room for inflation elsewhere in the consumer basket.
Crude Oil Price Extends Rally Above $75, US CPI Eases To 3%
Key Highlights
- Crude oil price started a fresh increase above the $72.50 resistance.
- A key bullish trend line is forming with support near $73.90 on the 4-hour chart.
- EUR/USD surged above the 1.1050 and 1.1080 resistance levels.
- The US CPI declined from 4% to 3% in June 2023 (YoY).
Crude Oil Price Technical Analysis
Crude oil price remained strong above the $70 level against the US Dollar. The price started a fresh increase and was able to clear a major hurdle at $72.50.
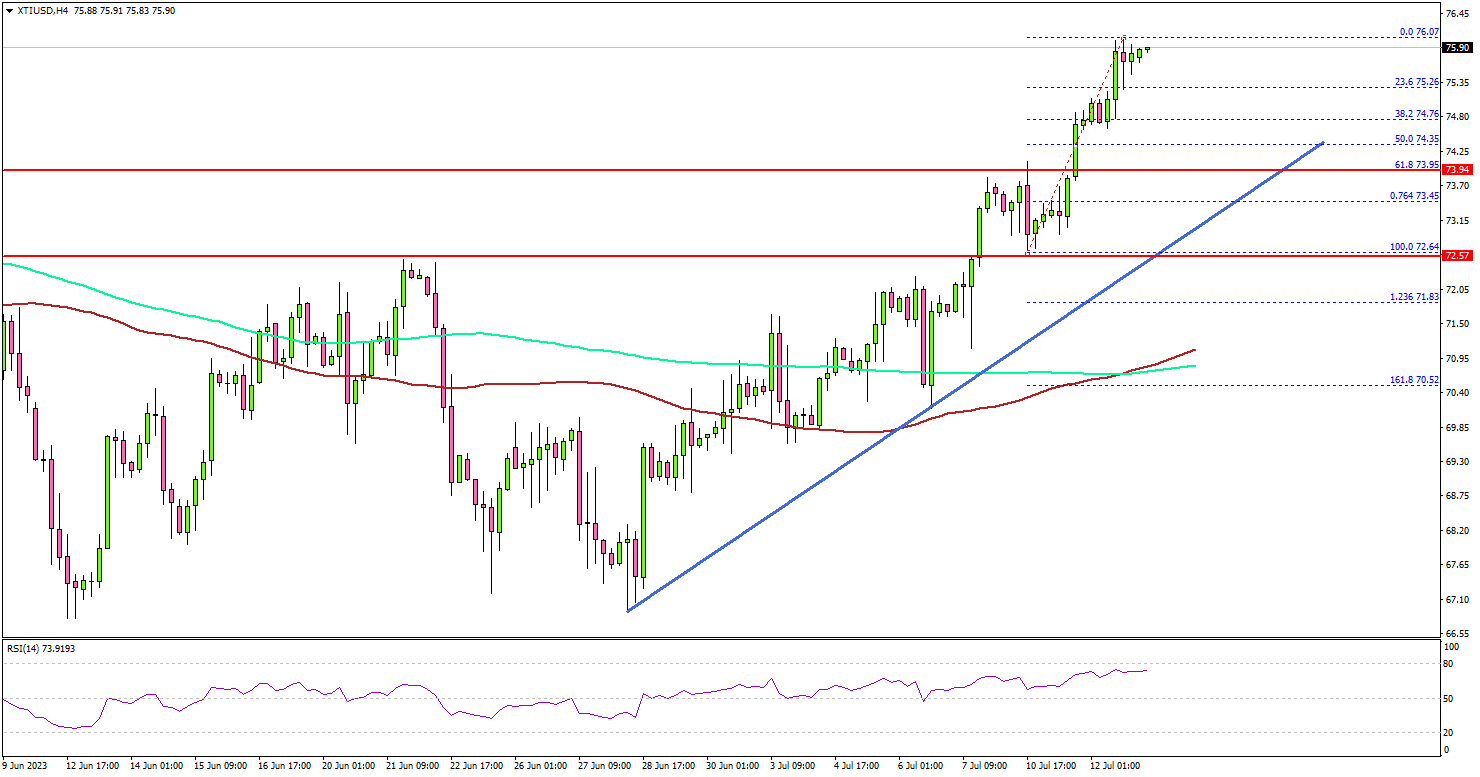
Looking at the 4-hour chart of XTI/USD, the price settled above the $73.50 level, the 100 simple moving average (red, 4-hour), and the 200 simple moving average (green, 4-hour).
The bulls even pumped the price above the $75 resistance. It tested the $76 level and started a consolidation. On the downside, initial support is near the $74.75 level. The next major support sits near the $74.00 level.
There is also a key bullish trend line forming with support near $73.90 on the same chart. Any more losses might call for a test of the $72.50 support zone in the coming days.
On the upside, the first major resistance is near the $76.50 level. The next major resistance is near the $78.00 level, above which the price may perhaps accelerate higher. In the stated case, it could even revisit the $80 resistance.
Looking at EUR/USD, the pair gained bullish momentum after there was a close above the 1.1010 level. It surged above the 1.1050 resistance and then 1.1100.
Economic Releases to Watch Today
- US Initial Jobless Claims - Forecast 250K, versus 248K previous.
- US Producer Price Index for June 2023 (MoM) – Forecast +0.2%, versus -0.3% previous.
- US Producer Price Index for June 2023 (YoY) – Forecast +0.4%, versus +1.1% previous.