

Sample Category Title
Gold Tries to Recover
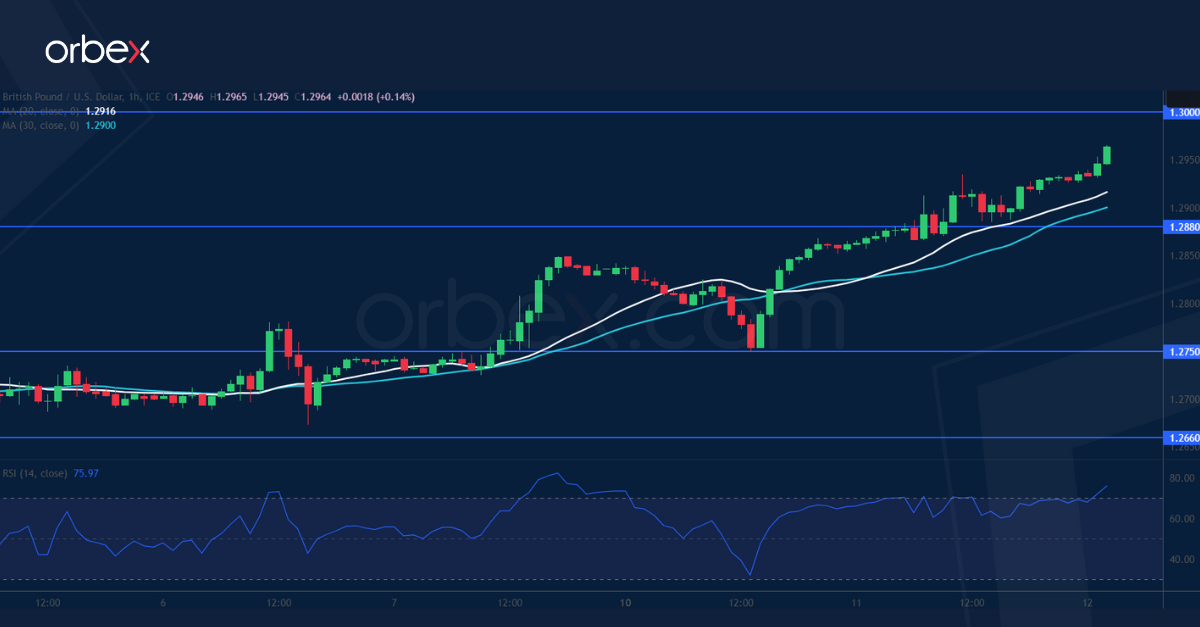
GBP/USD breaks higher
The pound advanced after resilient UK wage growth put pressure on the Bank of England to tighten policy. A new high above 1.2850 suggests a bullish continuation after a near four-week long consolidation. Such an upbeat confirmation in market sentiment would attract more trend followers. The supply zone formed by the psychological level of 1.3000 and a 15-month high of 1.3050 is next where resistance could be felt. As the RSI ventures into the overbought area again, 1.2880 is the closest support in case of a pullback.
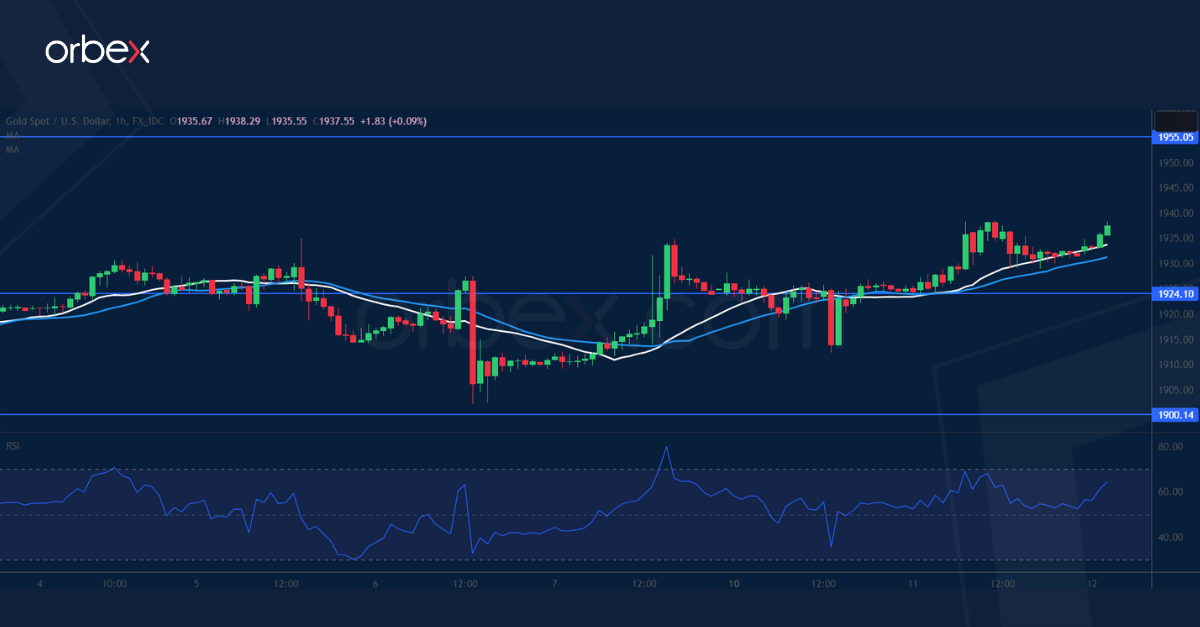
XAU/USD bounces back
Gold bounced as Fed officials hinted at the near end of the tightening cycle. The price seems to have found a solid foundation over the psychological level of 1900 from where the bulls hope the precious metal is bottoming out. A decisive break above the recent swing high of 1935 has prompted more bears to cover in fear of a short-squeeze, which could pave the way for an extended recovery towards June’s peak of 1982 with 1955 as an intermediate hurdle. 1924 is a fresh support to keep the rebound momentum intact.
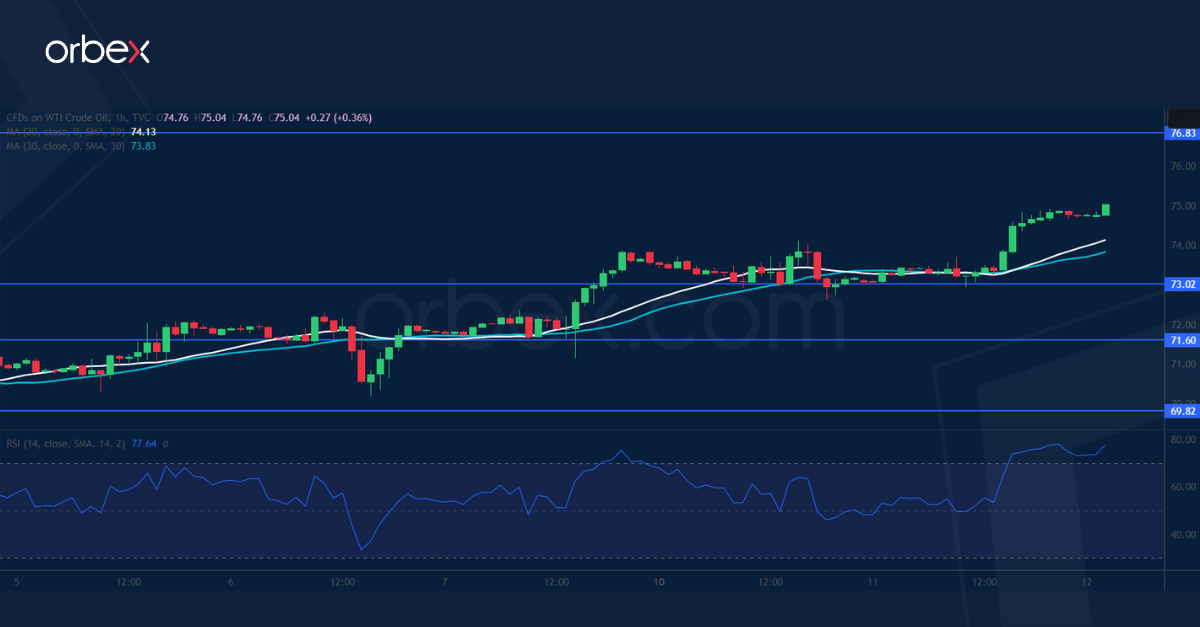
US Oil breaks key resistance
WTI crude rallied after the IEA commented that the market may tighten in the second half of the year. A close above the previous swing high of 72.50 then the 6-week high of 74.50 may open the door to a broader recovery in the medium-term by forcing the shorts to cut their losses. A bullish MA cross on the daily chart compounds the reversal pressure with 76.80 as the next target. The RSI’s double top in the overbought area may cause a limited fallback and the base of the momentum at 73.00 is the level to assess follow-up bids.
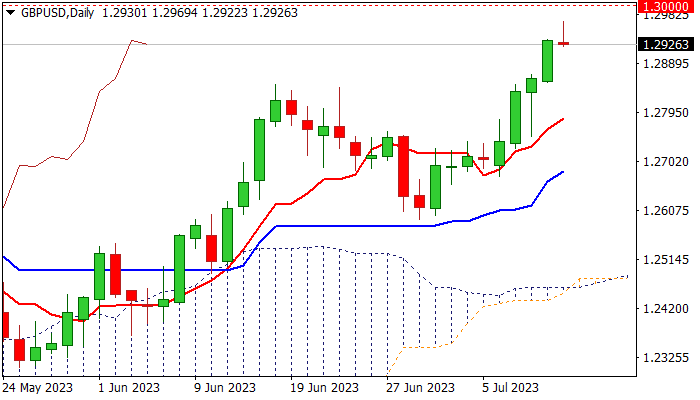
GBP/USD: Bulls Lose Traction on Approach to 1.30 Barrier, US CPI in Focus for Fresh Signals
Cable eases from new 15-month high (1.2969), posted in late Asian trading on Wednesday, as bulls faced headwinds on approach to psychological 1.30 barrier, due to overbought daily studies.
Wednesday’s action was so far shaped in a shooting star candlestick, which usually signals reversal when on top of an uptrend, generating initial signal of potential reversal, which will need a verification on completion of the pattern.
The signal is negative, but it collides with overall bullish structure and expectations for upbeat US inflation report, which may offer fresh support to sterling on weaker than expected June figures and lift pound through 1.30 barrier for the first time since Apr 2022.
Former top (1.2848) turned to solid support, with deeper pullback expected to find firm ground above rising daily Tenkan-sen (1.2784) to keep near-term bias with bulls.
Res: 1.2969; 1.3000; 1.3045; 1.3105.
Sup: 1.2900; 1.2848; 1.2800; 1.2784.
Gold Trends Higher; Resistance Within 1,940 Area
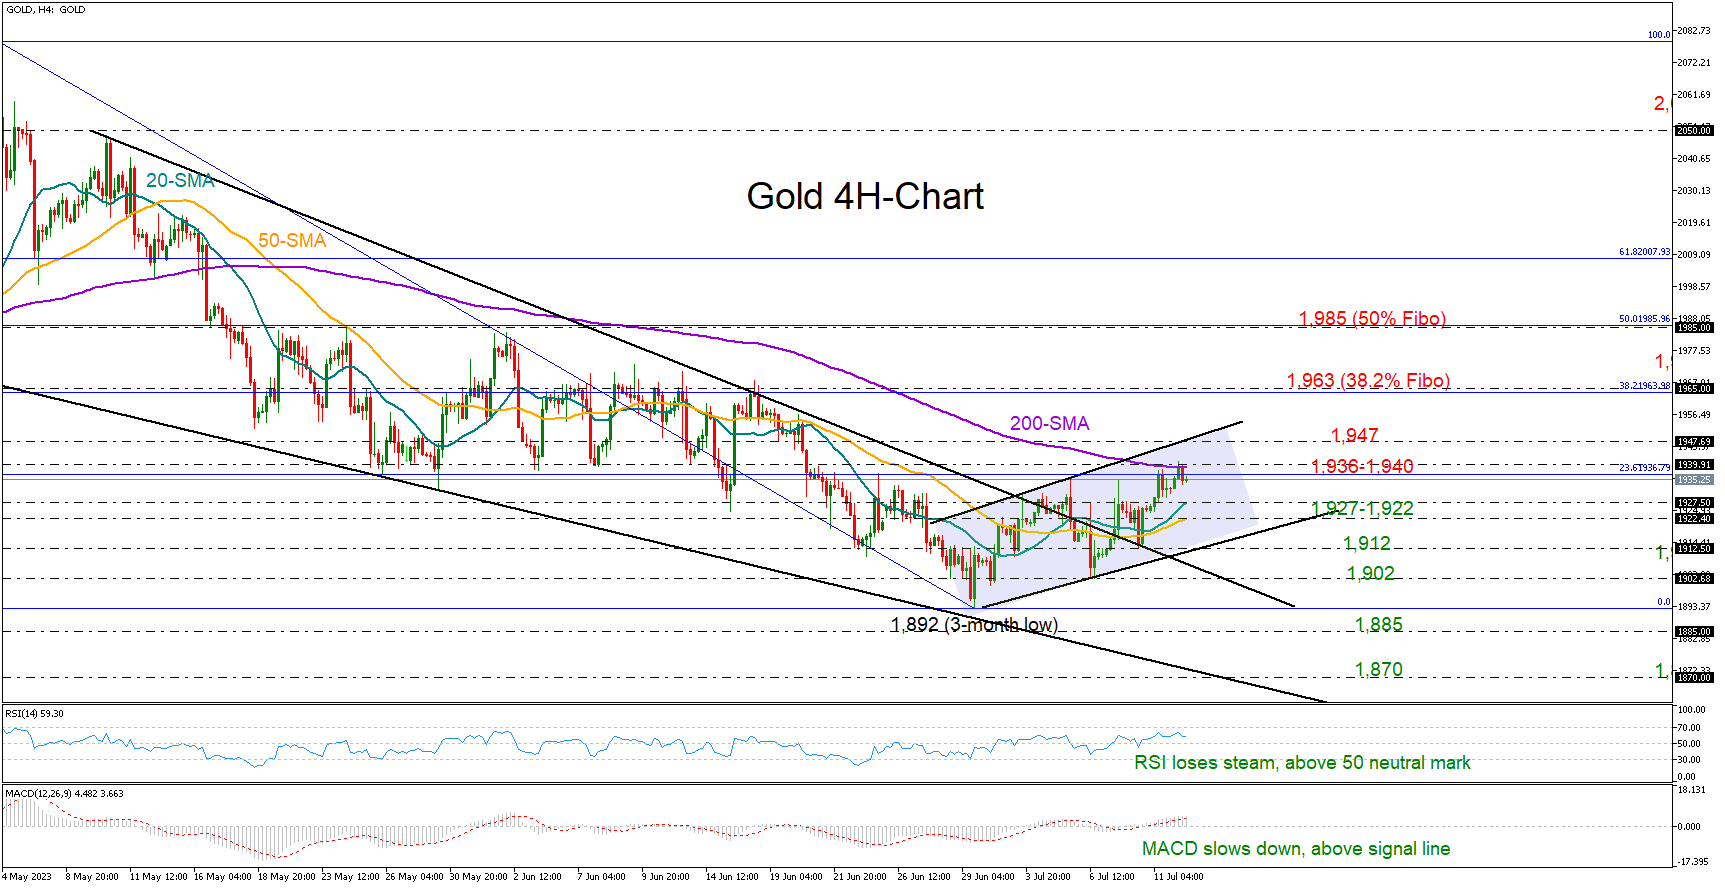
Gold has been swinging higher in the four-hour chart since hitting a three-month low of 1,892 at the end of June, rising as high as 1,940 today.
The precious metal is hovering around a familiar constraining zone and near the 200-period simple moving average, which caused a soft decline over the past few hours. The 23.6% Fibonacci retracement of the previous downleg is cementing that wall as well. Hence, traders might wait for a clear close above the 1,936-1,940 boundary before they target the upper band of the short-term bullish channel at 1,947. A successful move higher could last till the 38.2% Fibonacci mark of 1,963, while a steeper rally could approach the 50% Fibonacci of 1,985.
From a technical perspective, the short-term bias is still positive, as the RSI and the MACD are comfortably above their neutral levels. However, some caution might be needed as the indicators seem to have lost some momentum.
A pullback below 1,936 could pause somewhere between the 20- and 50-period SMAs at 1,927 and 1,922 respectively. If sellers persist, the price may slide towards the channel’s lower band at 1,912. Even lower, the bears might pressure the 1,900-1,896 floor with scope to mark new lower lows, likely around the 1,870 handle if the 1,885 low from March 15 gives way.
Summing up, the short upward trend in gold may keep buying interest intact in the coming sessions. A continuation above 1,947 could boost market sentiment, whilst a slide below 1,912 could add more pressure on the market.
FTSE 100 – Tentatively Higher With an Eye on US Inflation Data
- Attention remains on US inflation data today
- Only a much lower core CPI reading could tempt the Fed to reconsider hiking in two weeks
- UK100 rebounds but caution may remain unless key level is overcome
European stock markets are tentatively higher on Wednesday, with the FTSE 100 leading the way up more than 1%, as traders adopt a cautious position ahead of the US inflation report.
Any hopes of another pause from the Fed this month have dwindled in recent weeks as the data simply hasn't delivered what it needed to in order to convince the FOMC to do so for a second consecutive meeting. A second pause would be taken as a sign that the tightening cycle is over so it's not a decision that would be taken lightly.
The jobs report on Friday was nowhere near good enough to convince the Fed that it has achieved its objectives. There will no doubt have been relief that the NFP number didn't replicate that of the ADP but together with the wage component, it still pointed to a labor market that is very tight.
It would take something remarkable from the inflation report today to convince policymakers that they can afford to pause again. The headline CPI falling to 3.1% doesn't fall into that category when the core number is expected to remain high at 5%. It would take a real shock on the core side to really stimulate the debate in two weeks.
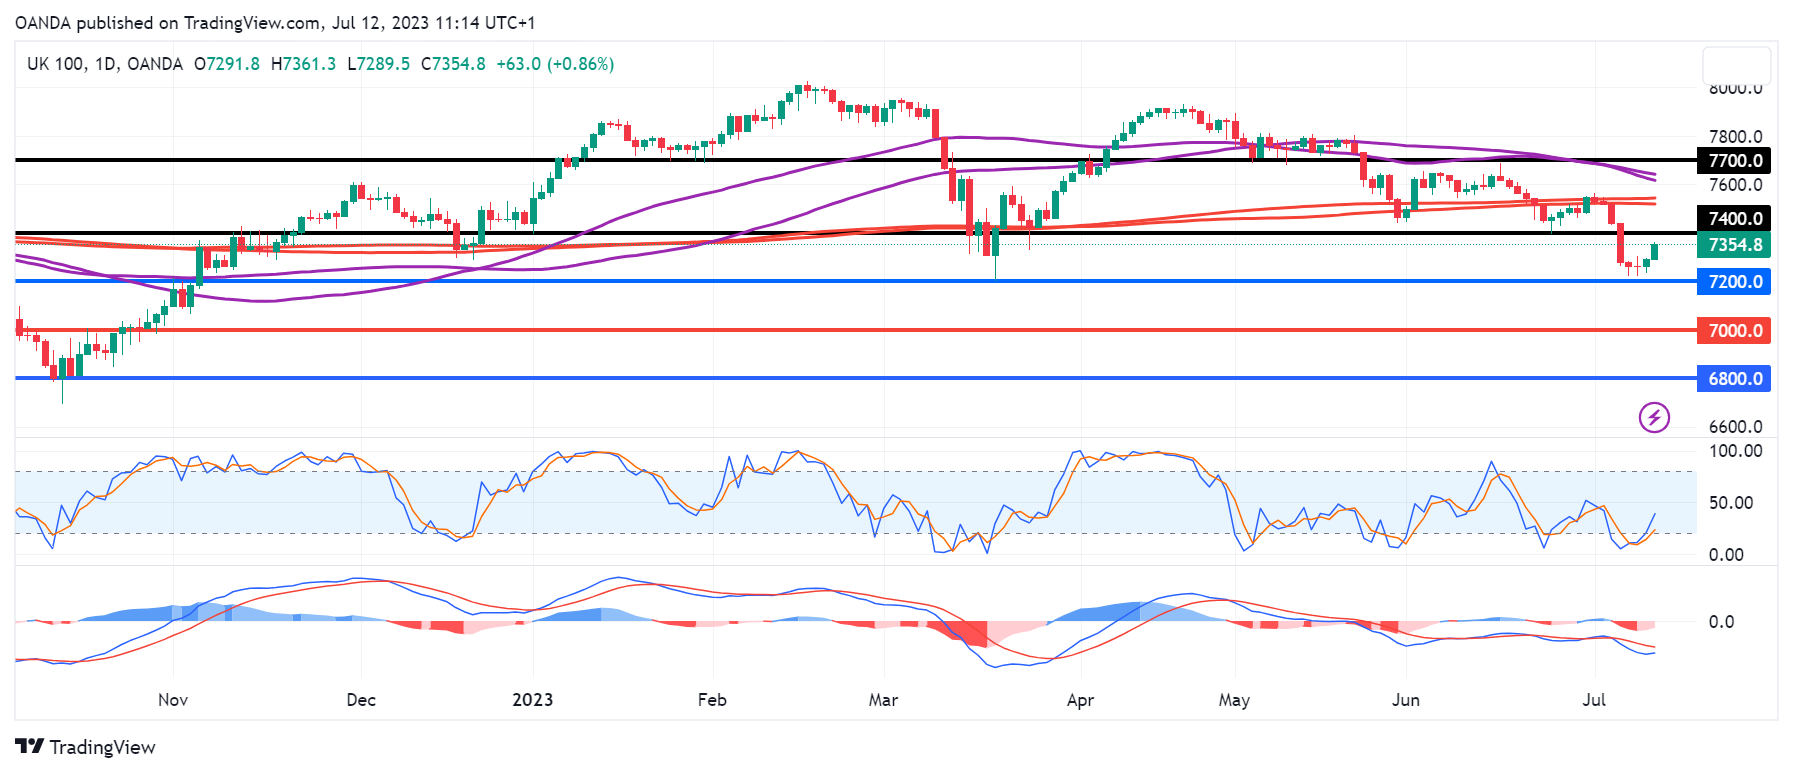
A failure to break back above 7,400 could be viewed as confirmation of the initial break
It hasn't been a great few months for the UK index, having fallen almost 9% from its April peak before rebounding a little this week. It did run into some support around 7,200 where it has reacted to on numerous occasions in the past, including in March, the last time it fell back to these levels.
UK100
Source – OANDA on Trading View
Having recovered a little in the last couple of days, it now faces a test around 7,400, another level it has previously been responsive to, most recently a couple of weeks ago when it saw strong support here.
A rebound off that level this time could be viewed as confirmation of the break below there on Thursday and therefore a bearish signal. That would draw attention back to 7,200 which may, as a result, look a little more vulnerable.
NZD/USD – RBNZ May Be Done With Its Tightening Cycle After Pause
- RBNZ leaves rates unchanged after near-two year hiking cycle
- Inflation is seen returning to target next year
- NZD performing better but potentially running on fumes
The RBNZ opted to pause its tightening cycle earlier today after a very aggressive tightening cycle over the last couple of years.
After increasing the cash rate to 5.5%, there are signs that the economy is slowing which will bring inflation down. While inflation has only fallen to 6.7% so far, data next week is expected to show it falling further and the central bank is confident it will return to its 1-3% target range next year.
New Zealand faced many challenges in the aftermath of the pandemic which contributed to surging inflation but much higher rates and levels of immigration appear to be easing those pressures.
Is the New Zealand dollar running on fumes?
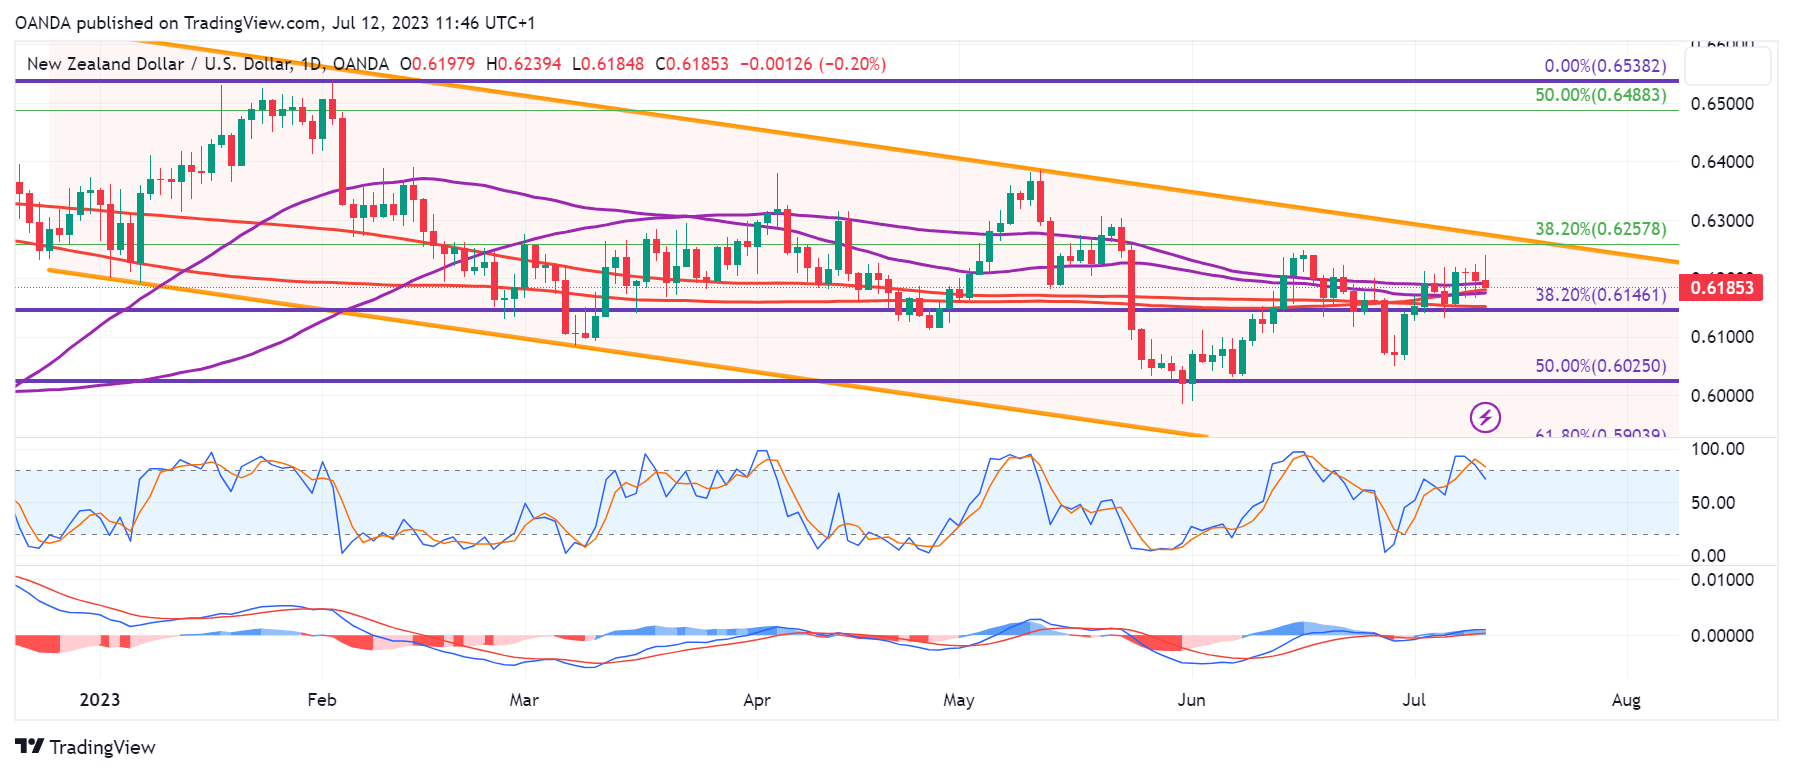
The kiwi has been gradually trending lower in the first half of the year but there have been some small signs that this may be about to change. The question is, if the RBNZ is done, has the bullish case softened somewhat? Or could a stronger economy draw investors back in?
NZDUSD Daily
Source – OANDA on Trading View
Over the last month, it's run into support around 0.60 against the US dollar which falls around the 50% Fibonacci retracement level – October 2022 lows to February 2023 highs.
Then in late June, it rebounded slightly ahead of that previous low which could be viewed as a bullish signal but many will still be unconvinced.
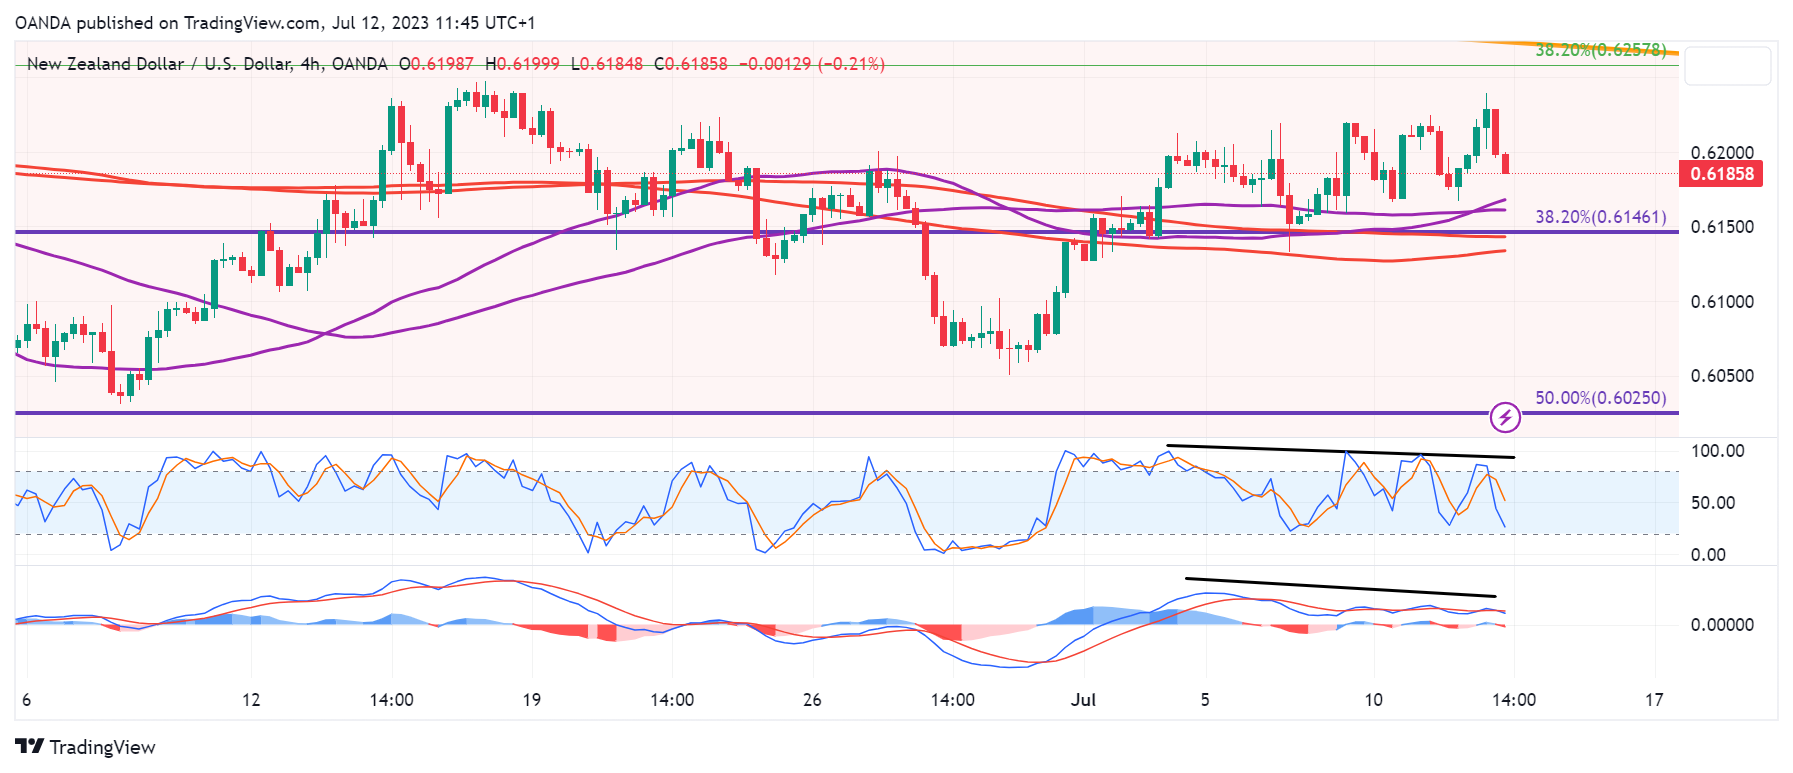
A break above the descending channel could be another stronger signal that the trend has turned for the pair, although so far, it appears to be running low on momentum just when it needs it most.
NZDUSD 4-Hour
CPI Release Will Decide the Next FOMC Step
Today's focus is on the US CPI data, which experts believe will be better than expected. The forecasted US CPI m/m is 0.3%, and y/y is 3.1%, a positive sign for the market as the Fed's inflation target is 2%. Even a strong inflation reading may lead to one more interest rate hike, keeping traders somewhat worried. The reaction of the 2-year Treasury yield and the dollar index will indicate the Fed's next move. With inflation slowing down, the path of least resistance for the US equity market is skewed to the upside.
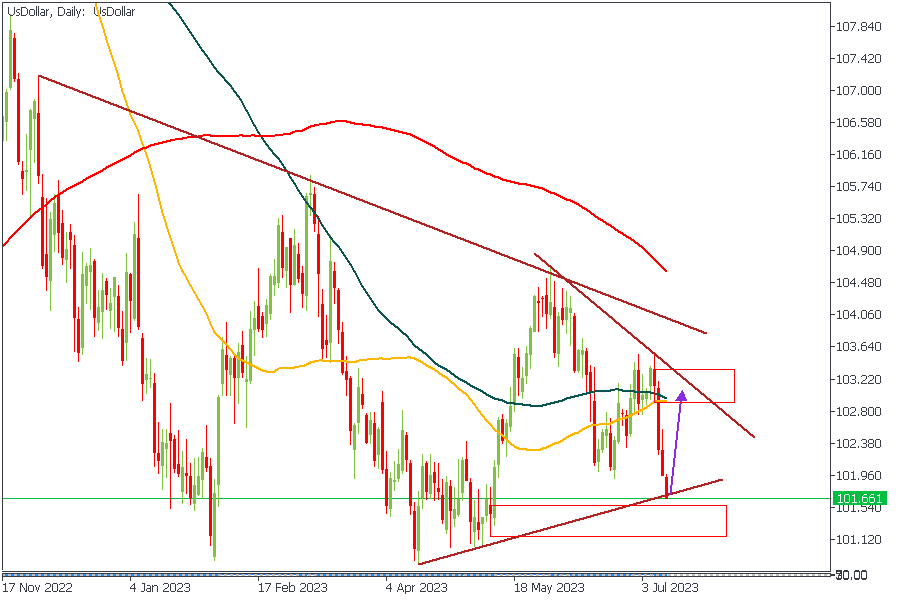
US DOLLAR - D1 Timeframe
The US Dollar on the daily timeframe has reached a significant mark. As the chart highlights, the demand zone presents a reliable point of interest for a likely reversal in the price action toward the resistance trendline. If the CPI figures are higher-than-expected, this is likely the course of movement on the Dollar.
Analyst’s Expectations:
- Direction: Bullish
- Target: 102.779
- Invalidation: 100.938
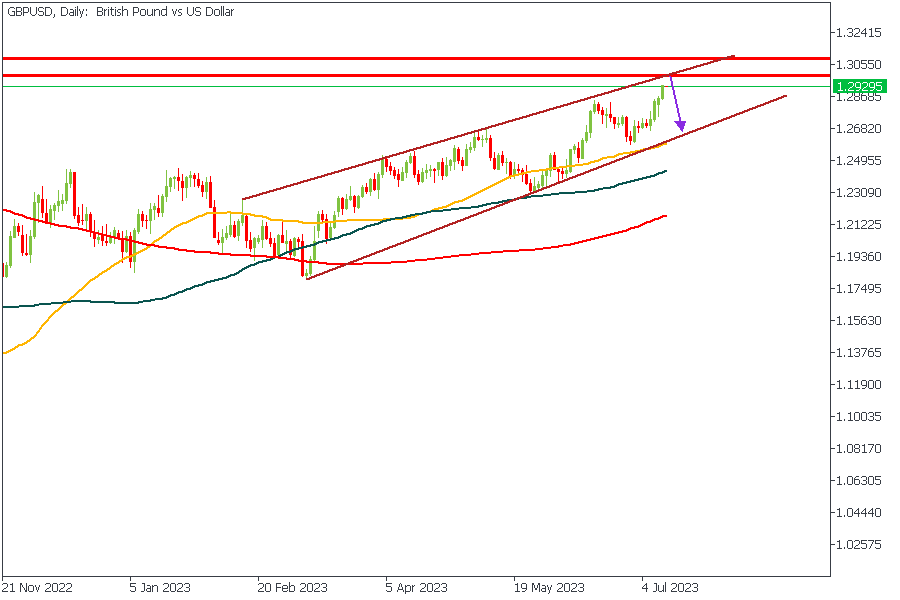
GBPUSD - D1 Timeframe
The upward movement of GBPUSD has been a steady climb in a channel pattern which seems to now be approaching a key area of resistance. As shown in the attached chart, the supply zone has further confluence from the resistance trendline and could be a turning point for the bullish price action - should the CPI favor the Dollar, as I mentioned earlier.
Analyst’s Expectations:
- Direction: Bearish
- Target: 1.28280
- Invalidation: 1.30393
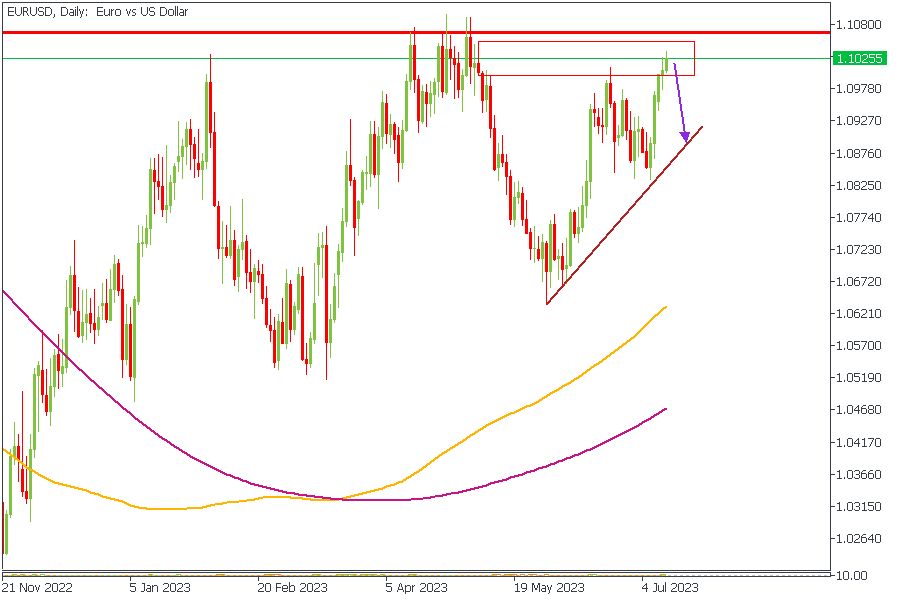
EURUSD - D1 Timeframe
EURUSD is another likely candidate for a brilliant reversal stunt. We currently see price trading within the supply zone right next to a major pivot level from the Weekly timeframe. Based on this and the likelihood of a positive CPI outcome for the Dollar, I would look for opportunities to short the market, possibly to the support trendline.
Analyst’s Expectations:
- Direction: Bearish
- Target: 1.08948
- Invalidation: 1.10985
CONCLUSION
The trading of CFDs comes at a risk. Thus, to succeed, you have to manage risks properly. To avoid costly mistakes while you look to trade these opportunities, be sure to do your due diligence and manage your risk appropriately.
USDJPY Sellers Could Stay in Play
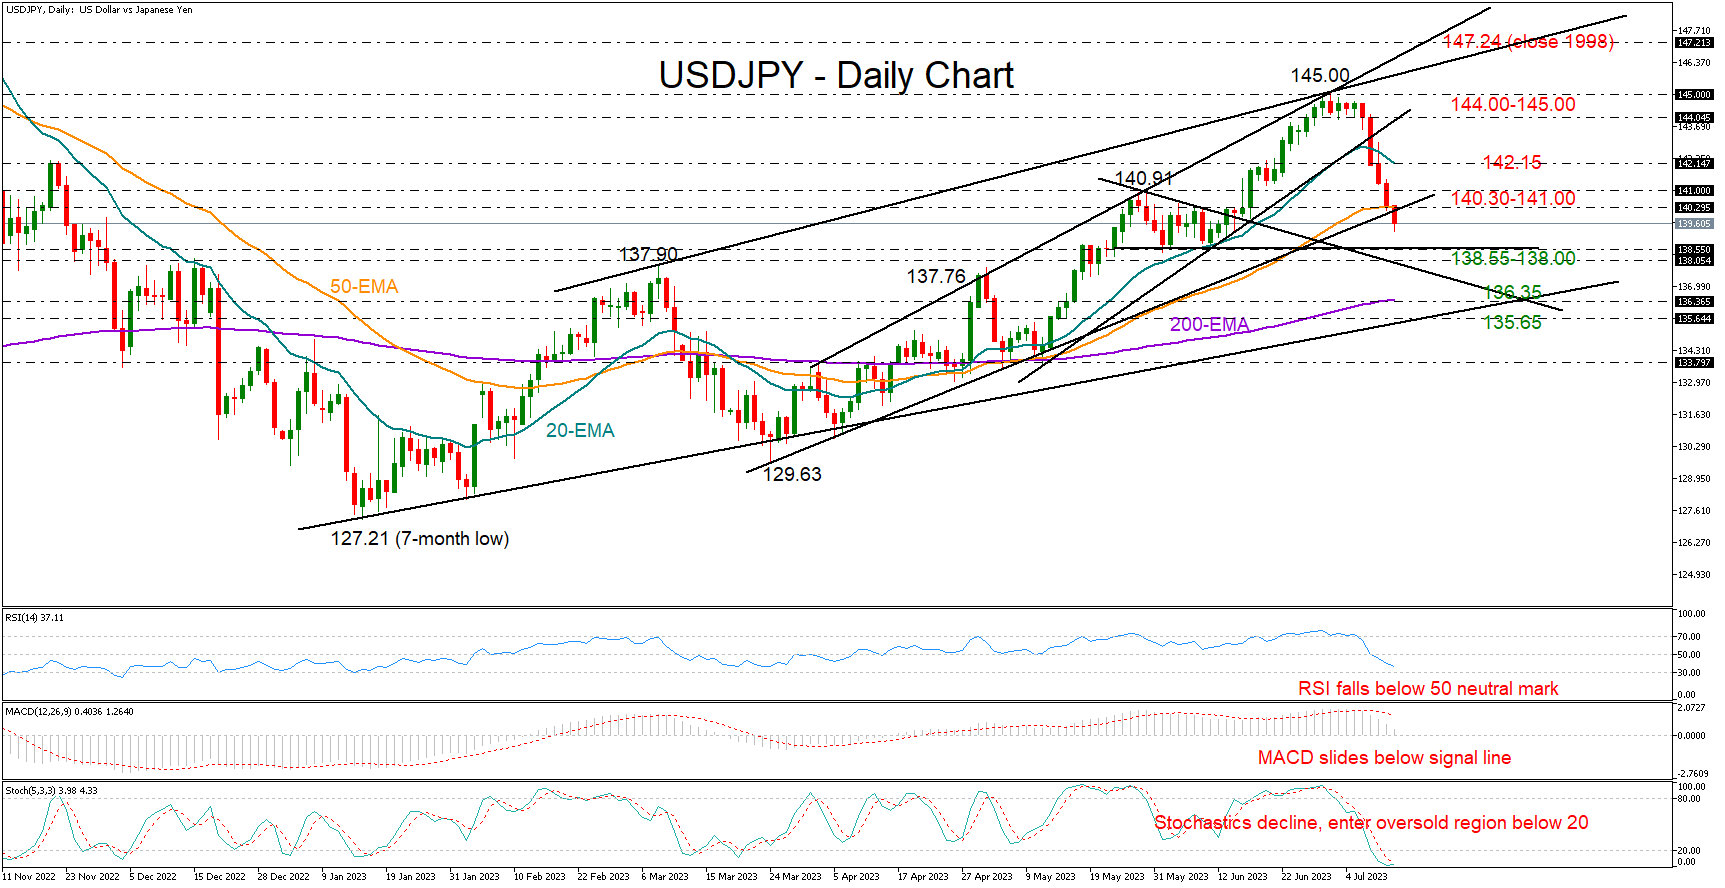
USDJPY has been sold aggressively since the NFP release last Friday, falling by almost 2.0% to a one-month low of 139.30.
The bears snapped the latest bullish wave from mid-June, which peaked at 145.00, currently aiming for a close below the 50-day exponential moving average (EMA) and the support trendline from the March low at 140.30.
Given the negative trajectory in the momentum indicators, the freefall in the price is expected to gain another leg to enter the 138.55-138.00 constraining zone, where the price stabilized back in June. It’s worthy to note that the 20-period EMA in the weekly chart is flattening within the same boundaries. Hence, a decisive close lower, and more importantly below 137.50, could renew selling pressures, shifting the spotlight to the 200-day EMA at 136.35. A drop below the 2023 ascending trendline at 135.65 would then signal a trend deterioration in the long-term picture.
An upside reversal, however, could be underway as the stochastic oscillator seems to be looking for a pivot within the oversold region below 20. Should the bulls take control immediately, pushing the pair back above the 140.30-141.00 area, they may initially pause around the 20-day EMA at 142.15. Even higher, traders would like to see an advance above the 144.00-145.00 zone and beyond the two ascending lines in order to raise their buying orders.
In brief, USDJPY could remain downbeat in the coming sessions, with traders looking for support within the 138.55-138.00 region. A bounce above 140.30-141.00 could reduce downside risks.
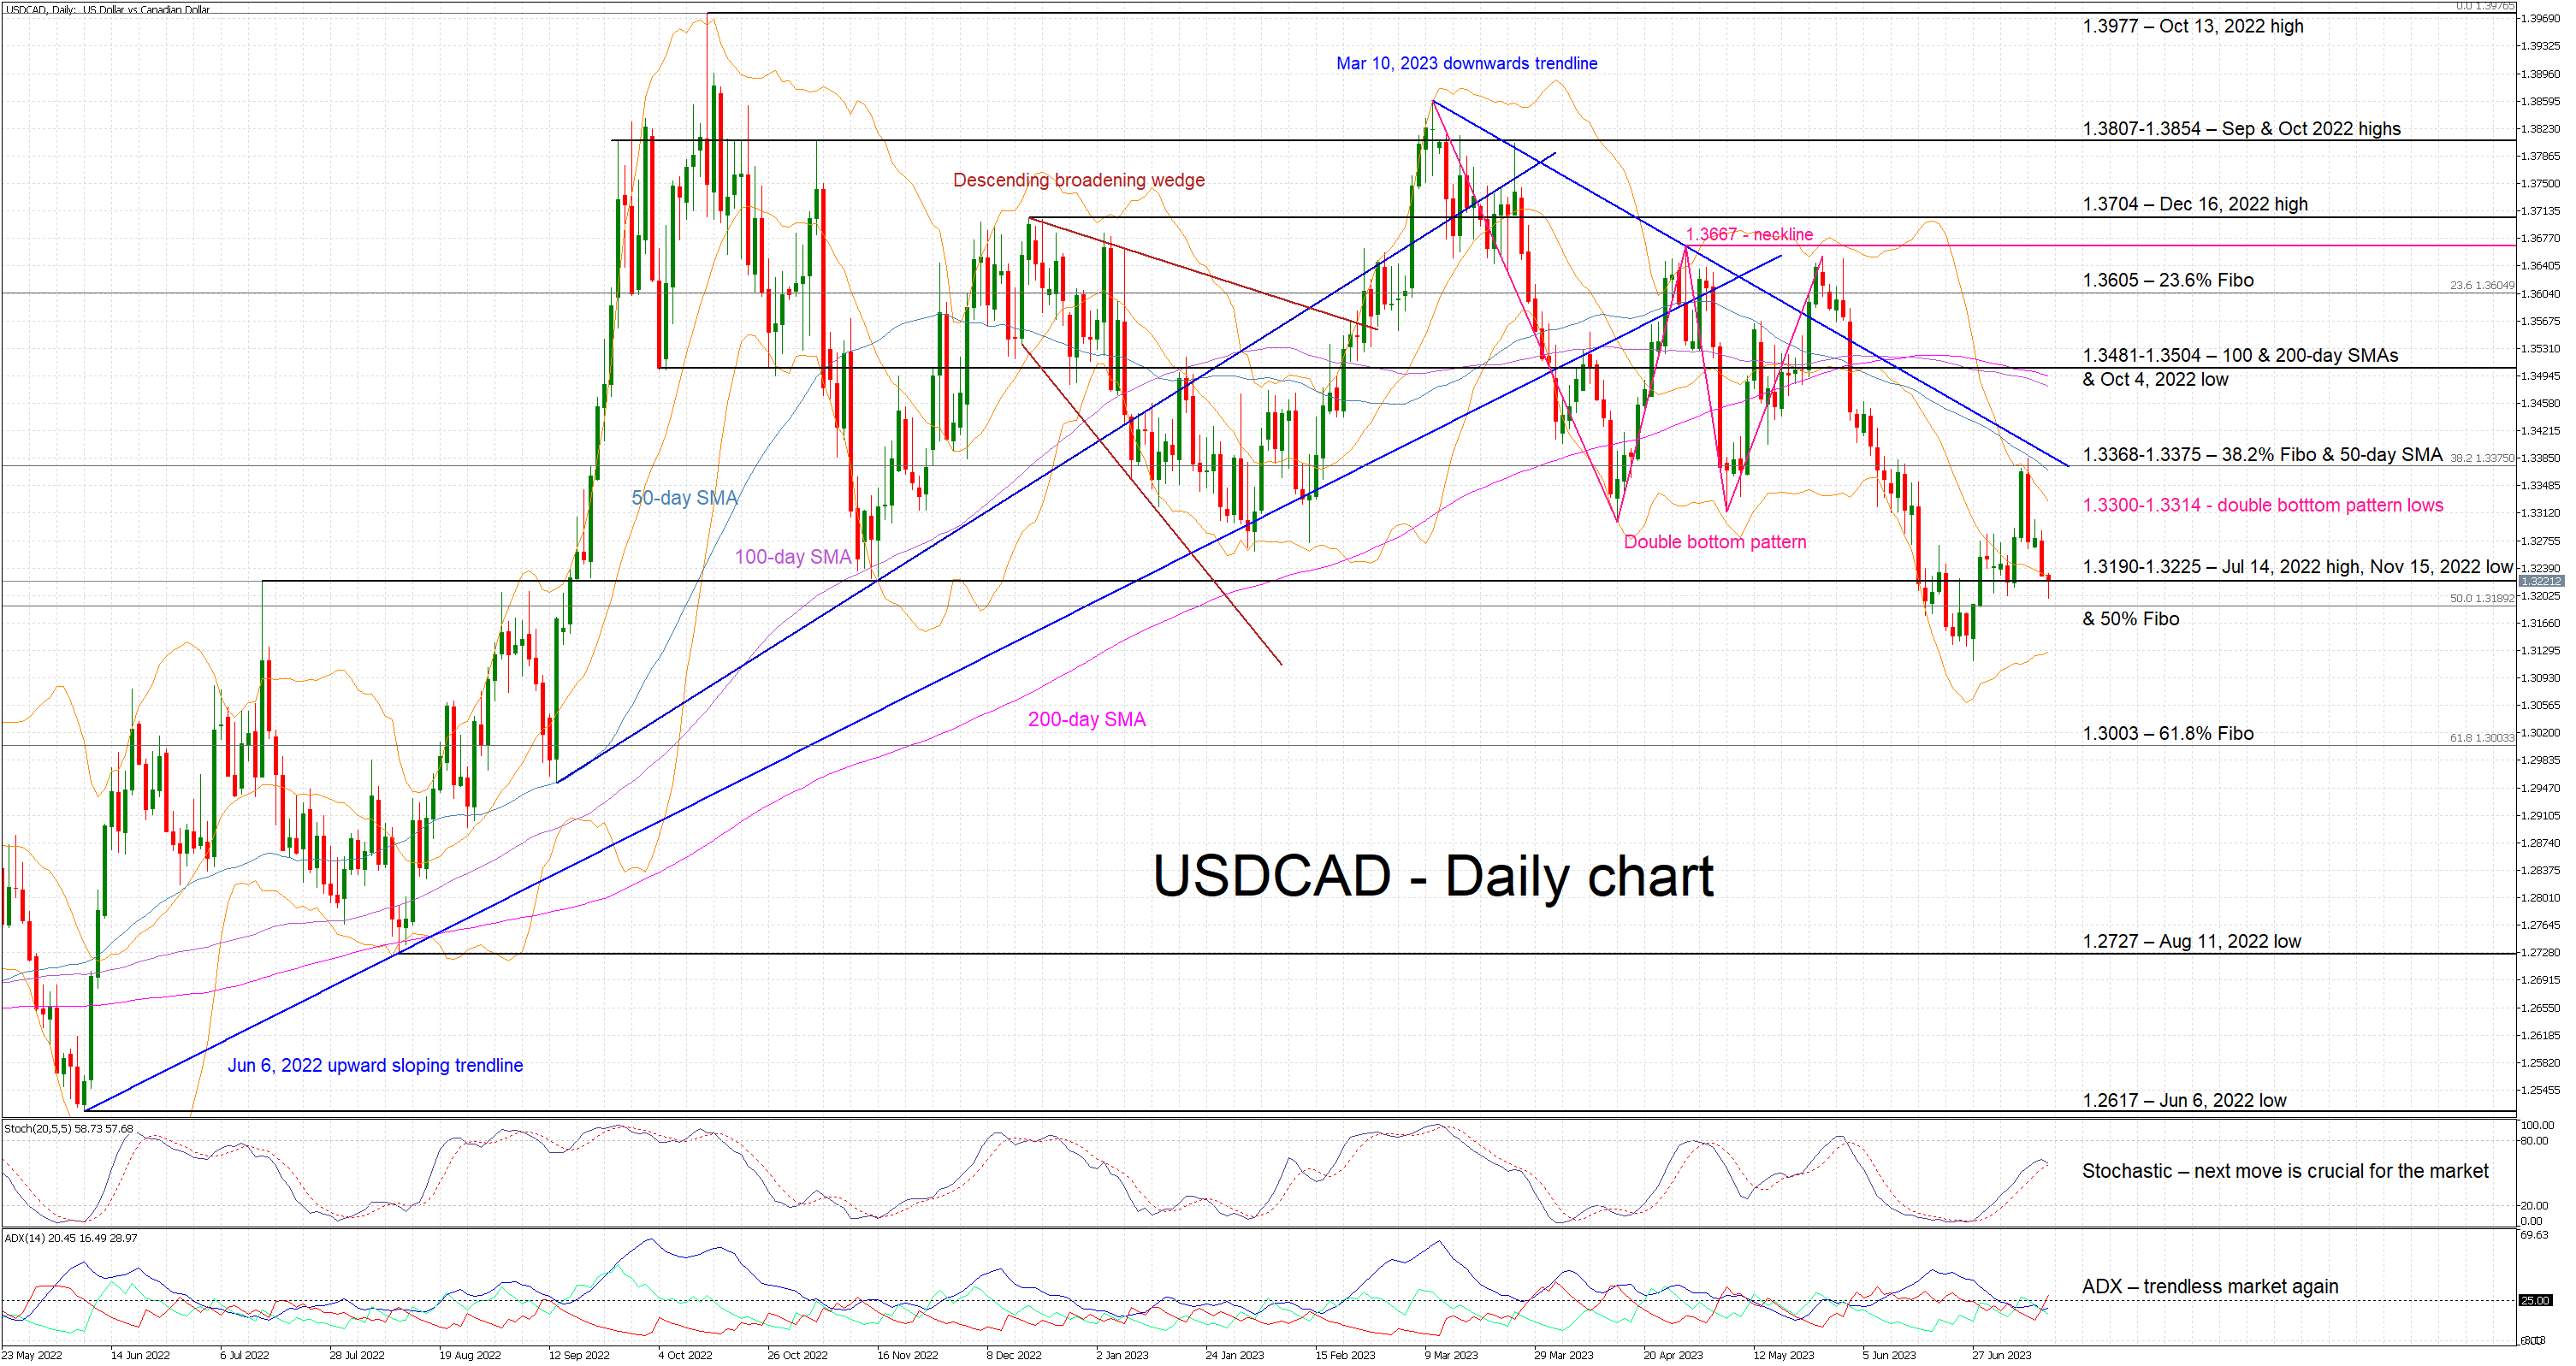
USDCAD Lower Again; Stochastic Could Dictate the Next Move
USDCAD’s recovery proved very short-lived as the pair has been dropping aggressively over the past four sessions. It is currently hovering inside the busy 1.3190-1.3225 area with the bears probably keen on continuing the recent series of lower highs and lower lows. The next trough has to occur below the 1.3116 low recorded on June 27 in order to keep this structure intact and valid.
The continued convergence of the 100- and 200-day simple moving averages (SMAs) supports the possibility of another sizeable move, but the bears have to look at the momentum indicators for clues on the direction of this next move. With the Average Directional Movement Index (ADX) not supporting the current downleg and still pointing to a range-trading market, the focus turns to the stochastic oscillator. This indicator is currently battling with its moving average (MA) and its next move will probably send a strong signal of the likely direction of the next leg in USDCAD.
If the stochastic manages to break below its MA, the bears would feel more confident in breaking the current 1.3190-1.3225 range that is defined by the July 14, 2022 high, the November 15, 2022 low and 50% Fibonacci retracement of the April 5, 2022 – October 13, 2022 uptrend respectively. The bears would then have the chance of recording a lower low, below the 1.3116 level, and then be able to target the 61.8% Fibonacci retracement at 1.3003.
Should the stochastic bounce higher, the bulls could try to stage another small upleg. The 1.3300-1.3314 range is unlikely to trouble them much but the same cannot be said for the busier 1.3368-1.3375 area. This is populated by the 38.2% Fibonacci retracement and the 50-day SMA, and proved too strong for the bulls at their July 7 attempt. If successful, the door will then be open for a retest of the key 1.3481-1.3504 range.
To sum up, USDCAD bears are keen on recording another lower low but their fate rests in the hands of the stochastic oscillator.
AUD/USD Technical: Bulls Rejected at 20 and 200-day Moving Averages ahead of US CPI
- Short-term momentum is likely to have turned negative as seen in the hourly RSI.
- Key short-term resistance stands at 0.6720.
- Intermediate supports to watch will be at 0.6630 and 0.6600/6580.
This is a follow-up analysis of our prior report, “AUD/USD Technical: Positive momentum ahead of RBA” published on 4 July 2023.
The price actions of the AUD/USD have staged the expected push-up and met the first resistance of 0.6720 as it printed a current intraday high of 0.6742 in today, 12 July Asian session.
Short-term elements are suggesting the risk of a short-term retreat as the release of the US CPI data looms later today at 1230 GMT.
Reintegrated below 20 and 200-day moving averages
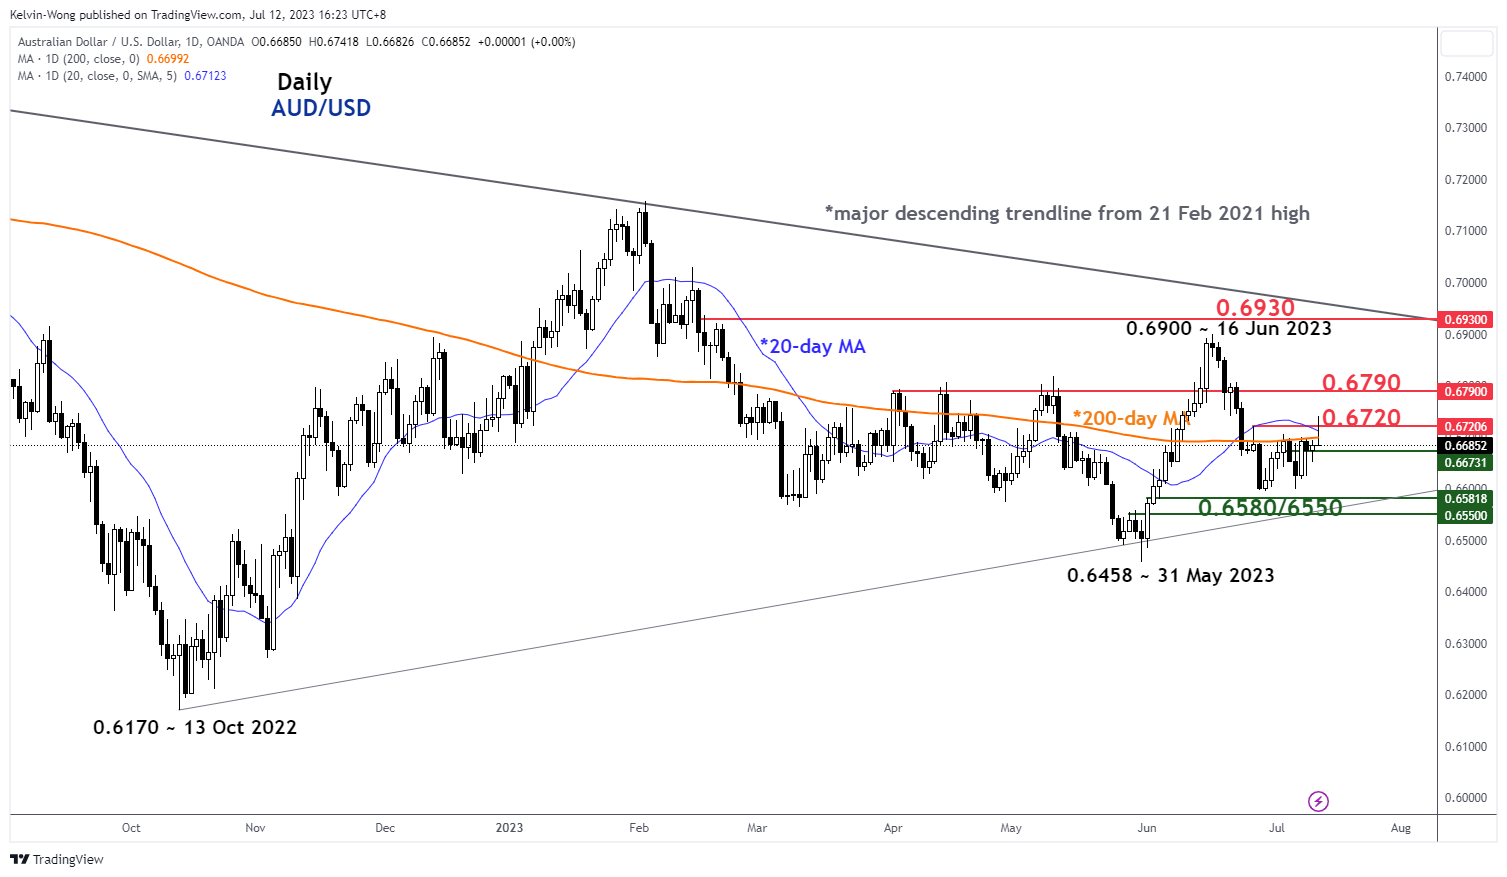
Fig 1: AUD/USD medium-term trend as of 12 Jul 2023 (Source: TradingView, click to enlarge chart)
The recent one and half week of rebound of +145 pips seen on the AUD/USD from its minor swing low of 29 June 2023 has stalled at the key 20 and 200-day moving averages which confluences with the 27 June 2023 swing high and the 38.2 % Fibonacci retracement of the prior minor decline from 16 June 2023 high of 0.6900 to 29 June 2023 low as well as the 1.236 Fibonacci extension of the rebound from 29 June 2023 low to 4 July 2023 high projected from 6 July 2023 low.
Short-term momentum has turned negative
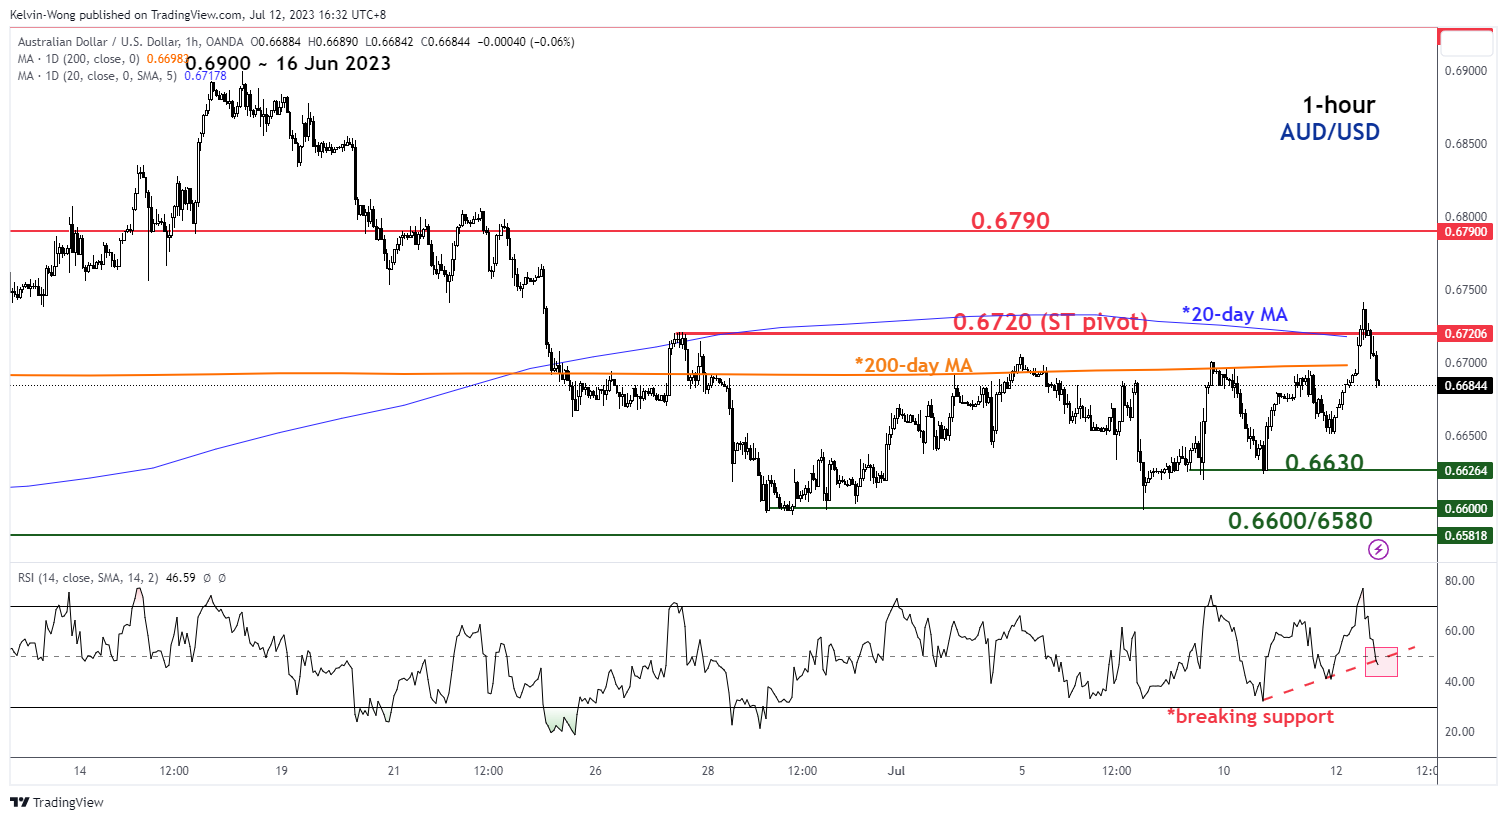
Fig 2: AUD/USD minor short-term trend as of 12 Jul 2023 (Source: TradingView, click to enlarge chart)
The hourly RSI oscillator has just exited its overbought region (above the 70 level) today and right now, it is attempting to break below its parallel ascending support at the 49 level which suggests that short-term momentum is likely to have turned negative.
Watch the 0.6720 key short-term pivotal resistance to maintain a bearish tone; a break below 0.6630 exposes the next support at 0.6600/6580.
However, a clearance above 0.6720 negates the short-term bearish tone to see the next resistance at 0.6790 (also, close to the 61.8% Fibonacci retracement of the prior minor decline from 16 June 2023 high of 0.6900 to 29 June 2023 low).
Bitcoin is Gaining Momentum
Market picture
Crypto market capitalisation rose by 0.5% on the day, approaching 1.2 trillion. The trend of capitalisation growth has been in place since the beginning of the week. Although the bulls’ attempt to accelerate has failed to gain traction, the market is approaching these local highs again as of early Wednesday afternoon.
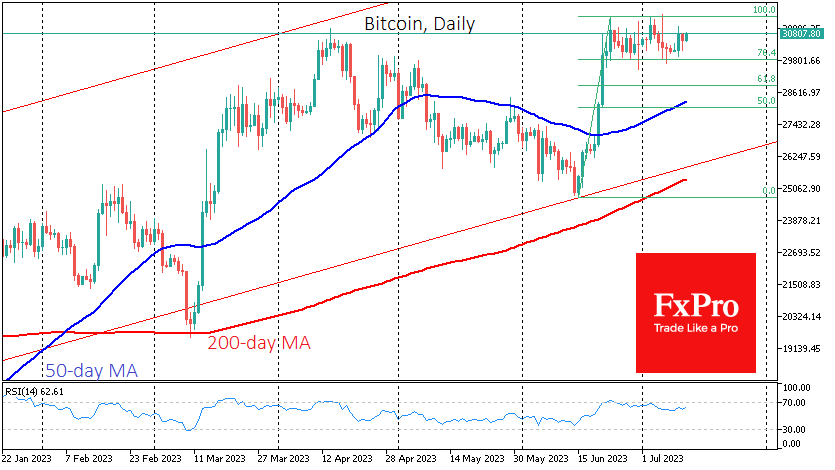
Bitcoin is up 0.6% at $30.8K and is approaching the upper boundary of its short-term range at $31.4K. Only a break above this level will indicate that the market is ready for further gains, with potential targets near $35.5K by the end of the month.
Bitcoin’s capitalisation is 50% of the total market and has been trending higher since the end of last year, coinciding with the turnaround in global equity indices. At the same time, it remains in a long-term downtrend, thanks to increasing competition from altcoins. However, increasing regulatory pressure poses a more significant threat to the latter.
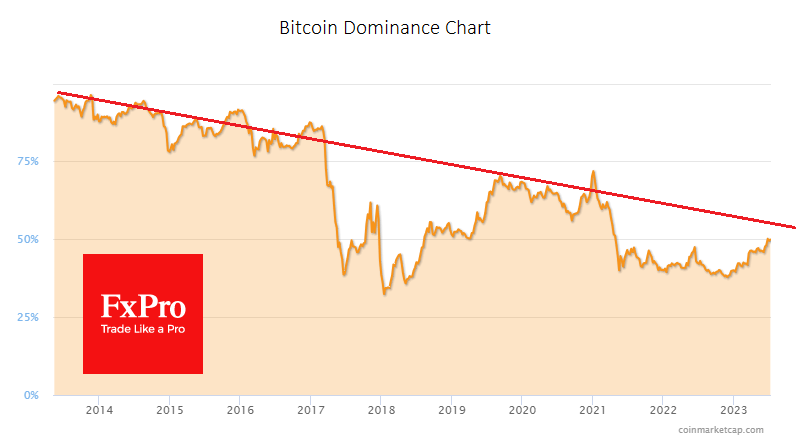
The market is experiencing a period of “reaccumulation”, which often occurs when halving is imminent, Glassnode notes. Previous such periods have resulted in several months of sideways trading. The Network Value to Transactions Ratio (NVT Ratio) indicator, based on 28 DMAs, suggests a “fair value” for Bitcoin of $35,900, above current prices for the first time since November 2022.
Spot trading volumes on centralised exchanges increased by 10.4% in June, while cryptocurrency futures trading volumes rose by 9.5%.
News background
According to K33 Research, employment in the cryptocurrency sector fell by 10% last year, from 210,000 to 190,000. The industry has around 10,000 companies with a total value of about $180 billion.
Bank of England Governor Andrew Bailey said that Bitcoin and other cryptocurrencies do not meet the standards of money. He said they are better classified as “highly speculative investments”.
The UK’s Financial Conduct Authority (FCA) has shut down 26 crypto ATMs in various cities nationwide for illegally offering cryptocurrencies. The regulator also warned consumers of these services that they could lose their money.
After the BRICS countries launch a gold-backed cryptocurrency in August, the US dollar will “die”, and bitcoin will rise to $120,000 in 2024, warned Robert Kiyosaki. He once again urged people to buy gold, silver, and bitcoin.