

Sample Category Title
GBP/JPY Daily Outlook
Daily Pivots: (S1) 183.32; (P) 183.61; (R1) 183.99; More...
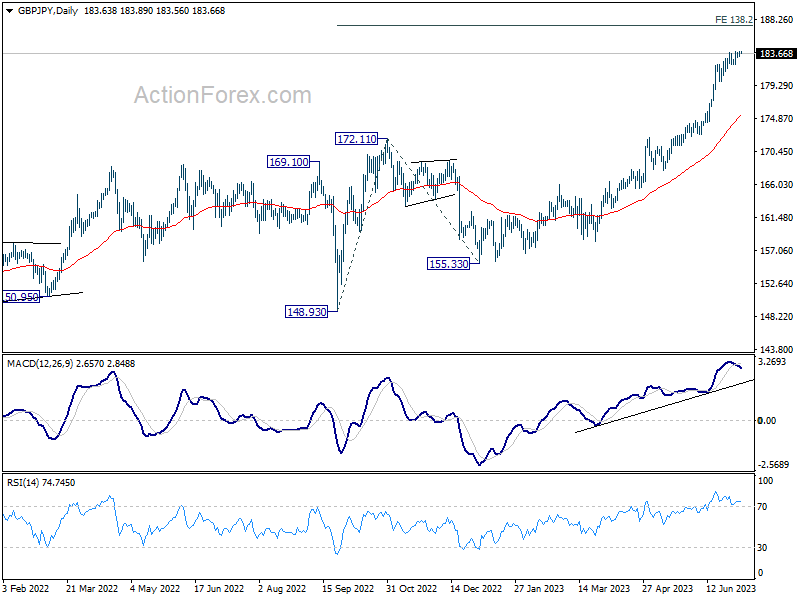
Intraday bias in GBP/JPY stays mildly on the upside at this point. Current up trend should target 138.2% projection of 148.93 to 172.11 from 155.33 at 187.36. On the downside, break of 182.12 minor support will turn bias back to the downside for deeper pull back first.
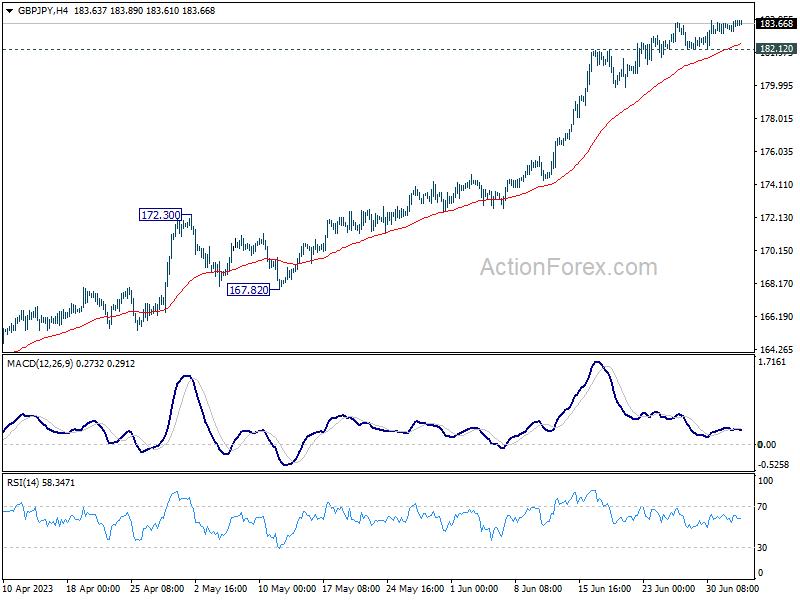
In the bigger picture, up trend from 123.94 (2020 low) is extending. Next target is 195.86 (2015 high). For now, medium term outlook will remain bullish as long as 172.11 resistance turned support holds, even in case of deep pull back.
EUR/JPY Daily Outlook
Daily Pivots: (S1) 156.91; (P) 157.41; (R1) 157.69; More....
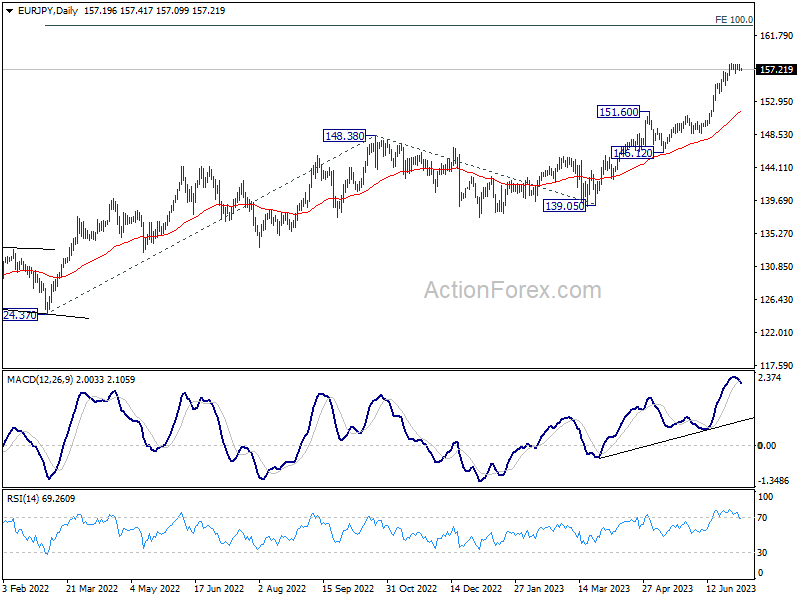
Intraday bias in EUR/JPY stay neutral at this point. Consolidation from 157.99 is extending and deeper retreat cannot be ruled out. But further rally is still expected as long as 154.03 support holds. On the upside, break of 157.99 will resume larger up trend to 162.82 projection level. However, break of 154.03 will argue that larger correction is under way back to 151.60 resistance turned support.
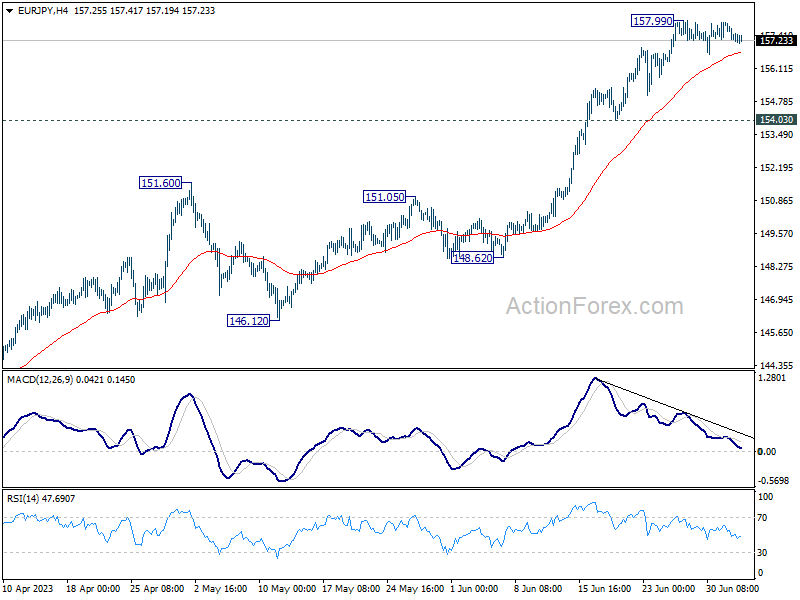
In the bigger picture, rise from 114.42 (2020 low) is in progress. Next target is 100% projection of 124.37 to 148.38 from 138.81 at 162.82. For now, medium term outlook will remain bullish as long as 151.60 resistance turned support holds, even in case of deep pull back.
EUR/GBP Daily Outlook
Daily Pivots: (S1) 0.8540; (P) 0.8572; (R1) 0.8588; More...
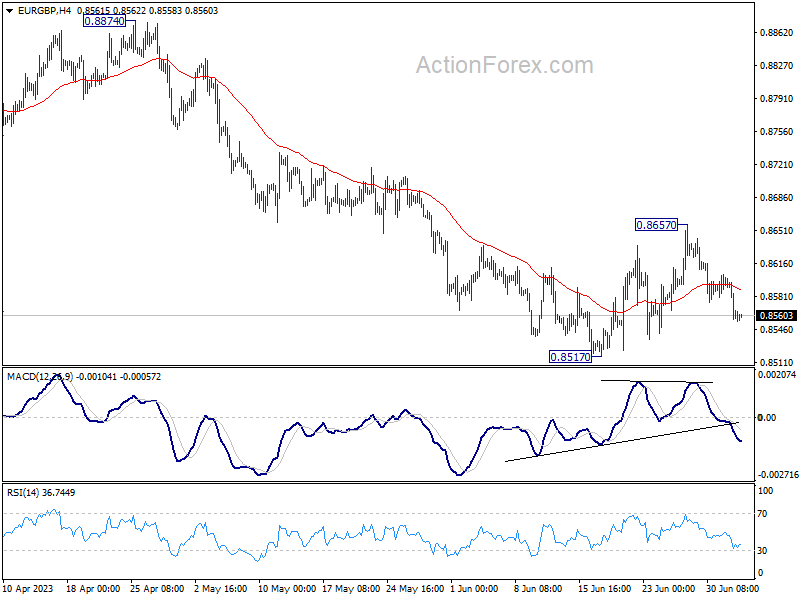
Intraday bias in EUR/GBP remains neutral as range trading continues. Rejection by 55 D EMA (now at 0.8646) is keeping near term outlook bearish. Break of 0.8517 will resume the whole decline from 0.8977. On the upside, above 0.8657 resistance will resume the rebound from 0.8517 towards 0.8717 support turned resistance.
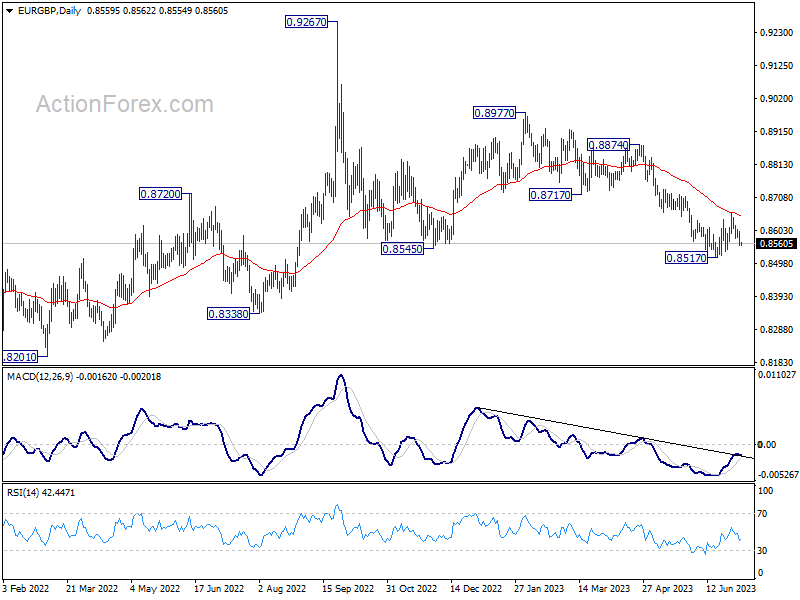
In the bigger picture, the down trend from 0.9267 (2022 high) is still in progress. It's seen as part of the long term range pattern from 0.9499 (2020 high). Deeper fall could be seen towards 0.8201 (2022 low). But strong support should be seen from there to bring reversal. This will now remain the favored case as long as 0.8717 support turned resistance holds.
EUR/AUD Daily Outlook
Daily Pivots: (S1) 1.6202; (P) 1.6307; (R1) 1.6361; More...
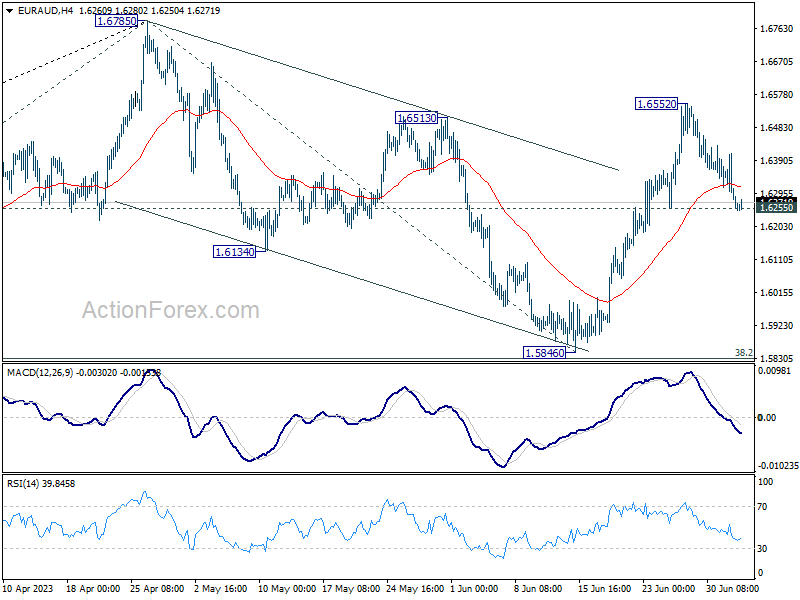
Intraday bias in EUR/AUD stays neutral and further rally is expected with 1.6255 support intact. As noted before, correction from 1.6785 should have completed with three waves down to 1.5846. Above 1.6552 will target a retest on 1.6785 high next. Nevertheless, on the downside, firm break of 1.6255 will dampen this view and turn bias to the downside for 1.5846 support.
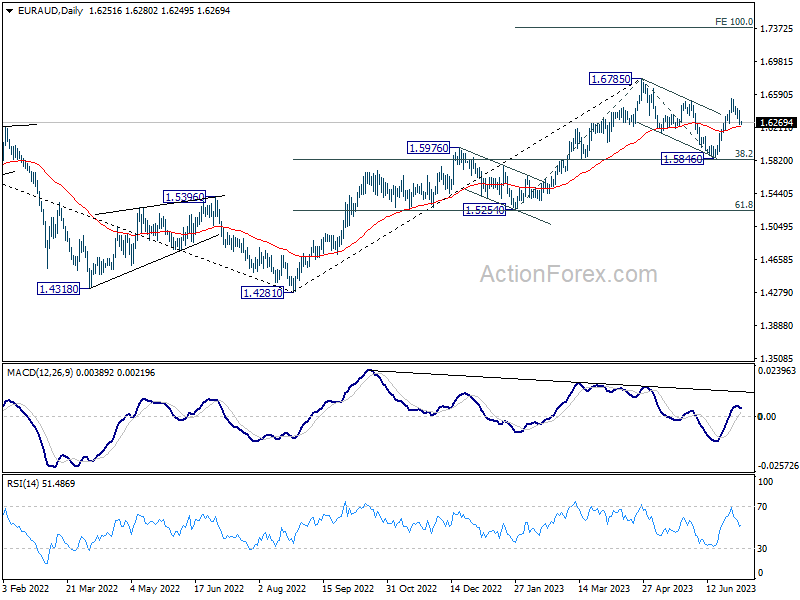
In the bigger picture, with 38.2% retracement of 1.4281 to 1.6785 at 1.5828 intact, rally from 1.4281 is still in progress. Firm break of 1.6785 will confirm rise resumption. Next target is 100% projection of 1.5254 to 1.6785 from 1.5846 at 1.7377. On the other hand, rejection by 1.6785 will extend the corrective pattern with another fall leg. But outlook will stay bullish as long as 1.5828 holds.
EUR/CHF Daily Outlook
Daily Pivots: (S1) 0.9746; (P) 0.9767; (R1) 0.9780; More...
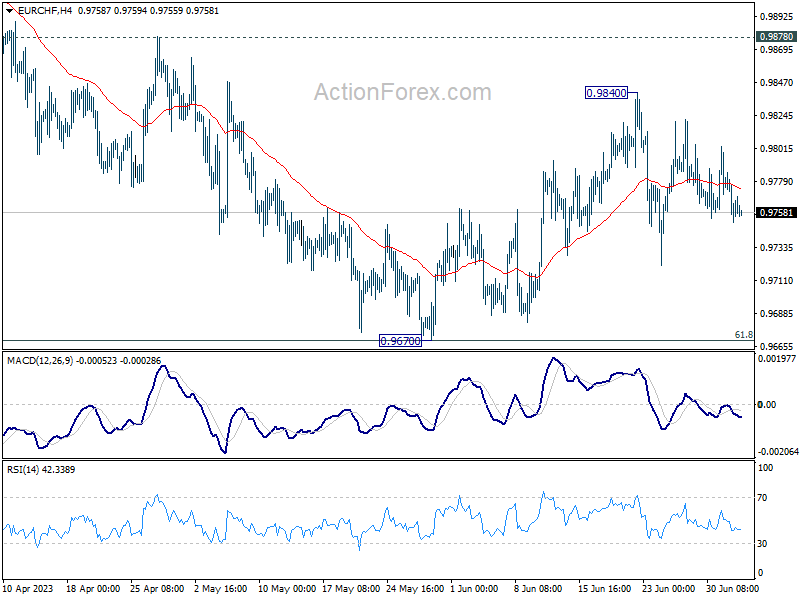
EUR/CHF is extending the sideway pattern from 0.9840 and intraday bias stays neutral at this point. On the upside break of 0.9840 will resume the choppy rebound from 0.9670. That will also revive the case that whole corrective decline from 1.0095 has completed at 0.9670. Further rally should be seen to 0.9878 resistance next. However, sustained trading below 0.9670 will resume the whole fall from 1.0095.
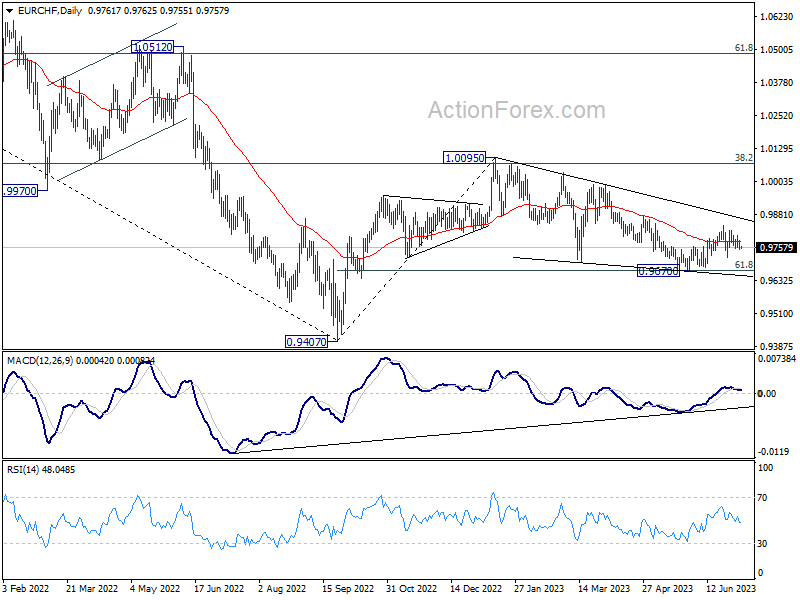
In the bigger picture, medium term outlook is staying bearish as the pair is capped below falling 55 W EMA (now at 0.9913). Down trend form 1.2004 (2018 high) is in favor to extend through 0.9407 at a later stage. Nevertheless, decisive break of 38.2% retracement of 1.1149 to 0.9407 will raise the chance of bullish trend reversal.
AUD/USD Could Struggle Near 0.6750, FOMC Minutes Next
Key Highlights
- AUD/USD found support near 0.6595 and corrected higher.
- It broke a key bearish trend line with resistance near 0.6640 on the 4-hour chart.
- EUR/USD and GBP/USD might gain bullish momentum.
- Crude oil prices are rising toward the $72.50 resistance.
AUD/USD Technical Analysis
The Aussie Dollar found support near 0.6600 after a major decline against the US Dollar. AUD/USD traded as low as 0.6595 and recently started an upside correction.
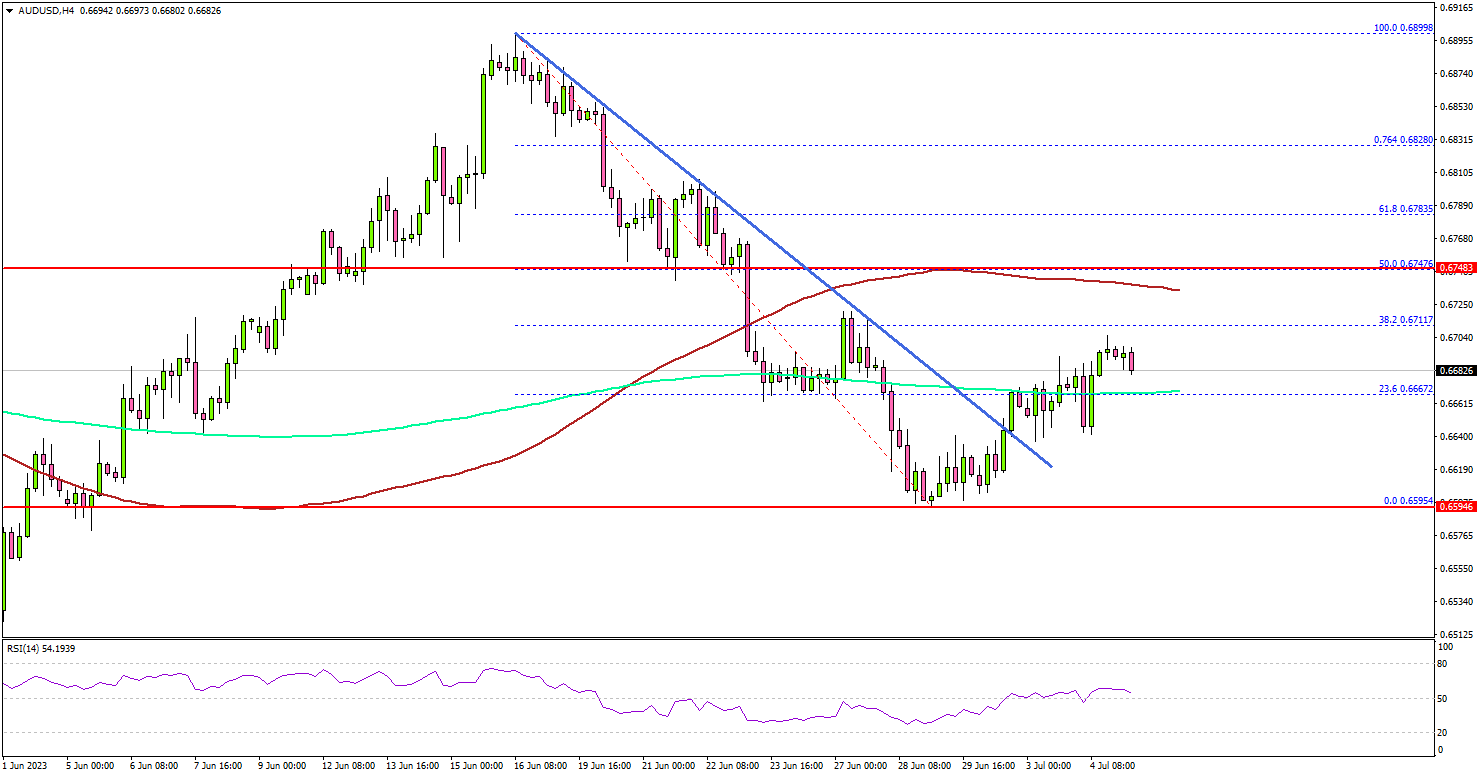
Looking at the 4-hour chart, the pair climbed above the 0.6625 resistance zone. It also broke a key bearish trend line with resistance near 0.6640.
The pair climbed above the 200 simple moving average (green, 4 hours) and the 23.6% Fib retracement level of the downward move from the 0.6899 swing high to the 0.6595 low. It is now rising toward a couple of key hurdles.
On the upside, the first major resistance is near 0.6750. It is close to the 50% Fib retracement level of the downward move from the 0.6899 swing high to the 0.6595 low. The next major resistance is near 0.6780.
If there is a move above the 0.6780 resistance, the pair could rise toward 0.6800. Any more gains might send AUD/USD toward the 0.6850 level.
Immediate support is near the 0.6640 level. The next major support is near the 0.6600 level. If there is a downside break below the 0.6600 support, the pair could decline toward the 0.6520 level in the near term.
Looking at crude oil prices, there was a fresh increase from the $66.90 zone and there could be a move toward $72.50.
Economic Releases
- Germany’s Services PMI for June 2023 - Forecast 54.1, versus 54.1 previous.
- Euro Zone Services PMI for June 2023 – Forecast 52.4, versus 52.4 previous.
- UK Services PMI for June 2023 – Forecast 53.7, versus 53.7 previous.
- FOMC Meeting Minutes.
WTI oil hovers in range on divided interpretation of output cut
Despite an early-week upswing, oil prices have struggled to extend gains and remain bounded within a familiar range. Saudi Arabia announced extension of its voluntary output cut. Russia and Algeria offered to trim their August output and exports. But these decisions are more seen as a sign affirming a waning optimism in demand growth.
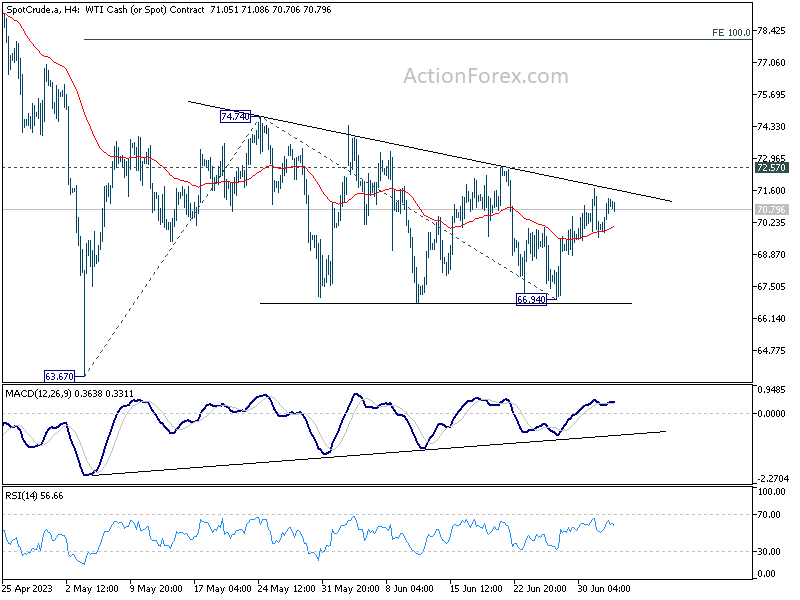
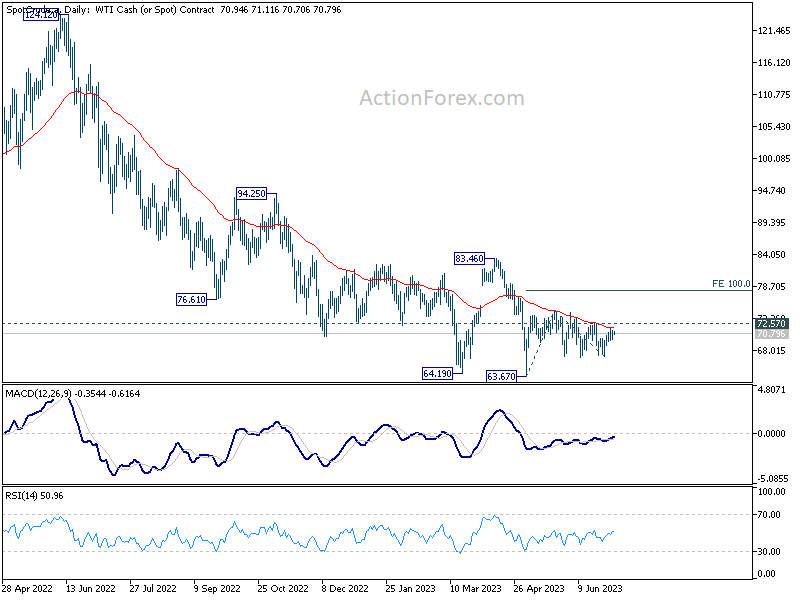
Technically, outlook in WTI crude oil is rather mixed for now. Repeated rejection by 55 D EMA is retaining bearishness. Yet there is no clear sign of extended selling.
Indeed, recent price actions could be interpreted as a triangle pattern that started in 74.74. If that's true, there is prospect of another bounce to resume the rebound from 63.67. Break of 72.57 resistance will solidify this case and push WTI through 74.74 resistance. Yet, upside would likely be capped by 100% projection of 63.67 to 74.74 from 66.94 at 78.01.
On the other hand, break of 66.94 support could prompt deeper selloff back to retest 63.67 low.
China Caixin PMI services fell to 53.9, recovery losing steam
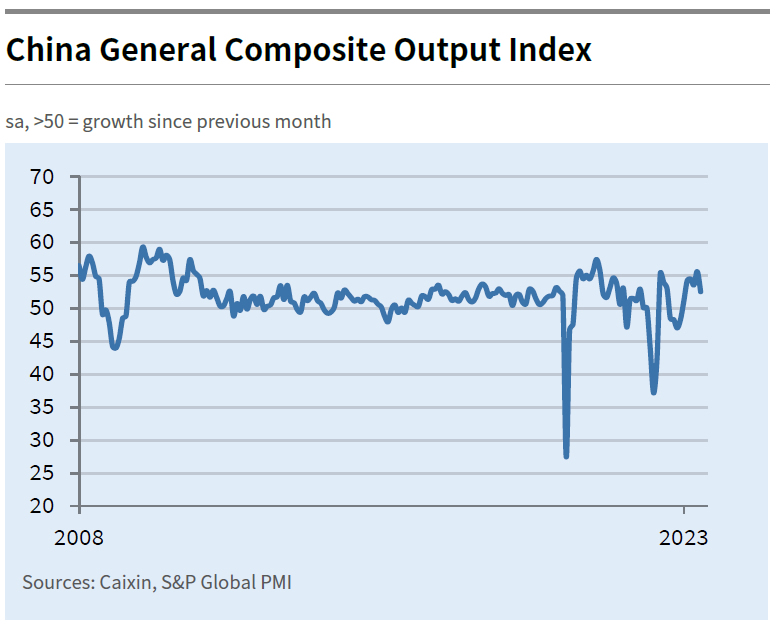
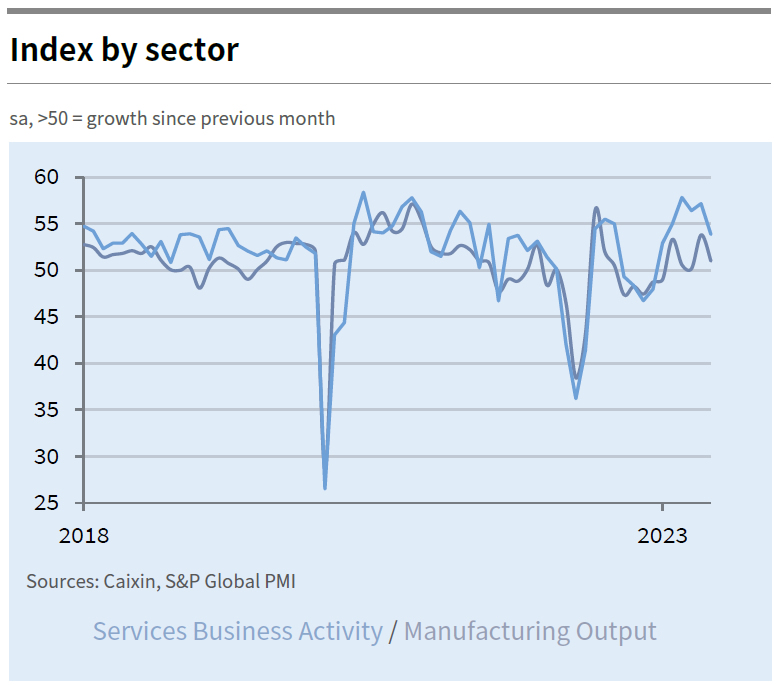
China's Caixin Services PMI for June plunged to 53.9, down from 57.1 in the previous month and significantly below the expectation of 56.2. The composite PMI also tumbled from 55.6 to a discouraging 52.5, marking the lowest readings since the growth cycle kick-started in January.
Wang Zhe, a senior economist at the Caixin Insight Group, commented on the less-than-promising data: "A slew of recent economic data suggests that China's recovery has yet to find a stable footing, with prominent issues including a lack of internal growth drivers, weak demand, and dimming prospects persisting."
Zhe emphasized the disparity between the manufacturing and services sectors, noting that "In June, Caixin China PMIs showed that conditions in the manufacturing sector lagged far behind services. Employment contracted, deflationary pressure mounted, and optimism waned in the manufacturing sector."
Despite the ongoing post-Covid rebound of the services sector, Zhe expressed concerns about the sustainability of the recovery, adding that "the services sector continued a post-Covid rebound, but the recovery was losing steam."
Can Oil Reverse after OPEC+ Meeting?
Saudi Arabia and Russia, two of the world's largest oil producers, have decided to extend cuts to their oil production to support oil prices and boost income. This move comes despite weakened demand due to the sluggish economy. The voluntary reductions, which will continue through next year, have had a limited impact on oil prices, providing some relief to consumers worldwide and allowing US drivers to fill their tanks more affordably. The extension of cuts by Saudi Arabia indicates the uncertain outlook for fuel demand, even as travel increases. Both countries require sustained high oil revenue for their economic objectives. Russia, in particular, faces the challenge of Western sanctions, resulting in lower export revenue. Let's now see whatever clue the price action may hold for us.
US Dollar - H4 Timeframe
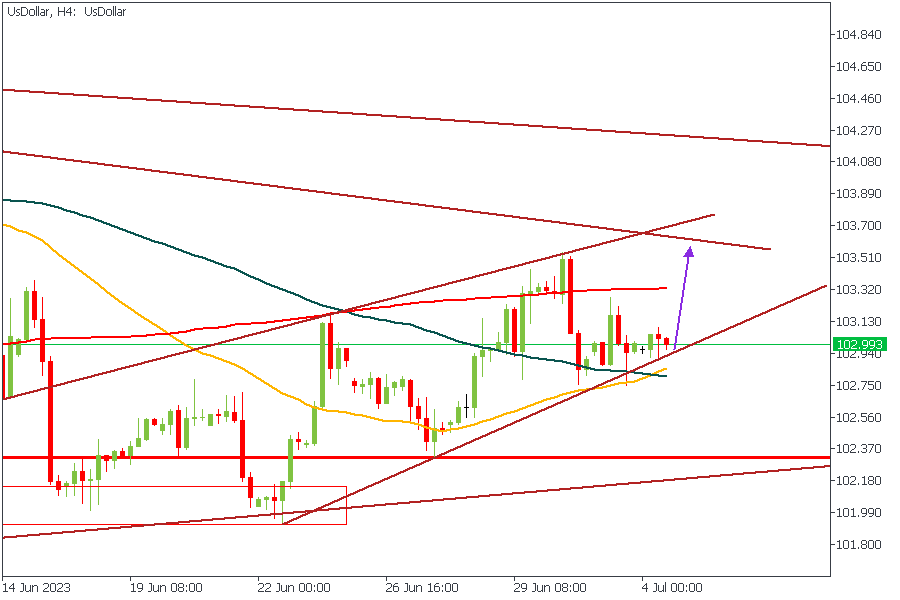
We will look at the US Dollar majorly because the Crude oil CFDs I will analyze in this piece are all paired against the US Dollar. The price action, as seen on the attached chart, shows the price leaning on a support trendline which sits perfectly within the vicinity of the 50 and 100 period moving averages; this suggests the likelihood of a bullish price action from the Dollar, which may be short-lived nonetheless.
Analyst’s Expectations:
- Direction: Bullish
- Target: 103.497
- Invalidation: 102.739
XTIUSD - H4 Timeframe
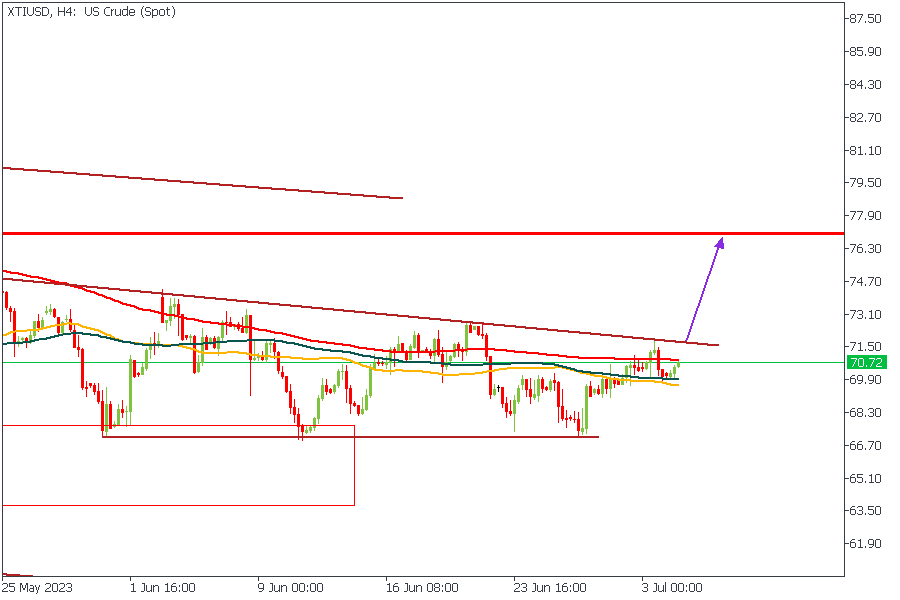
XTIUSD (US Oil) is currently trading within a consolidation pattern. The main reason why I am going to be somewhat conservative on my risk exposure in this trade is the fact that the Dollar seems to be prepping for a bullish recovery, which could negatively impact the price action here and cause a rejection from the resistance trendline I have drawn on the attached chart. To avoid unpleasant experiences, I will patiently wait for a break out of the consolidation zone before taking in trade in the direction of the breakout. Remember, a missed trade is much better than a lost one - protect yourself, folks!
Analyst’s Expectations:
- Direction: Bullish
- Target: 75.08
- Invalidation: 69.78
XBRUSD - H4 Timeframe
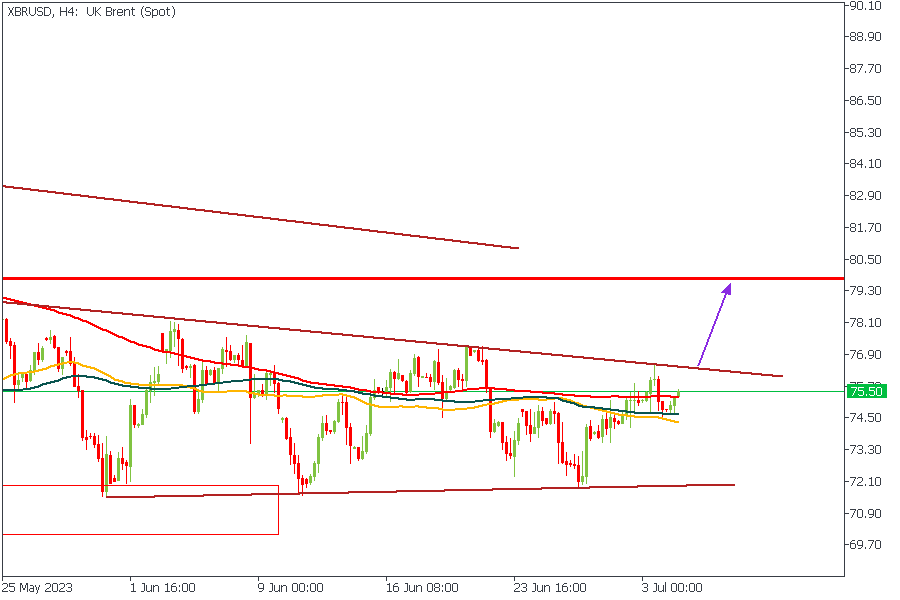
XBRUSD is creating a similar price action to what we have just seen on XTIUSD and will, as a result, be treated similarly. I expect to see the price break out of the zone before taking a position. This breakout will be the trigger required before taking a market stake.
Analyst’s Expectations:
- Direction: Bullish
- Target: 78.71
- Invalidation: 74.47
CONCLUSION
The trading of CFDs comes at a risk. Thus, to succeed, you have to manage risks properly. To avoid costly mistakes while you look to trade these opportunities, be sure to do your due diligence and manage your risk appropriately.
Litecoin (LTCUSD) Short Term Support Area
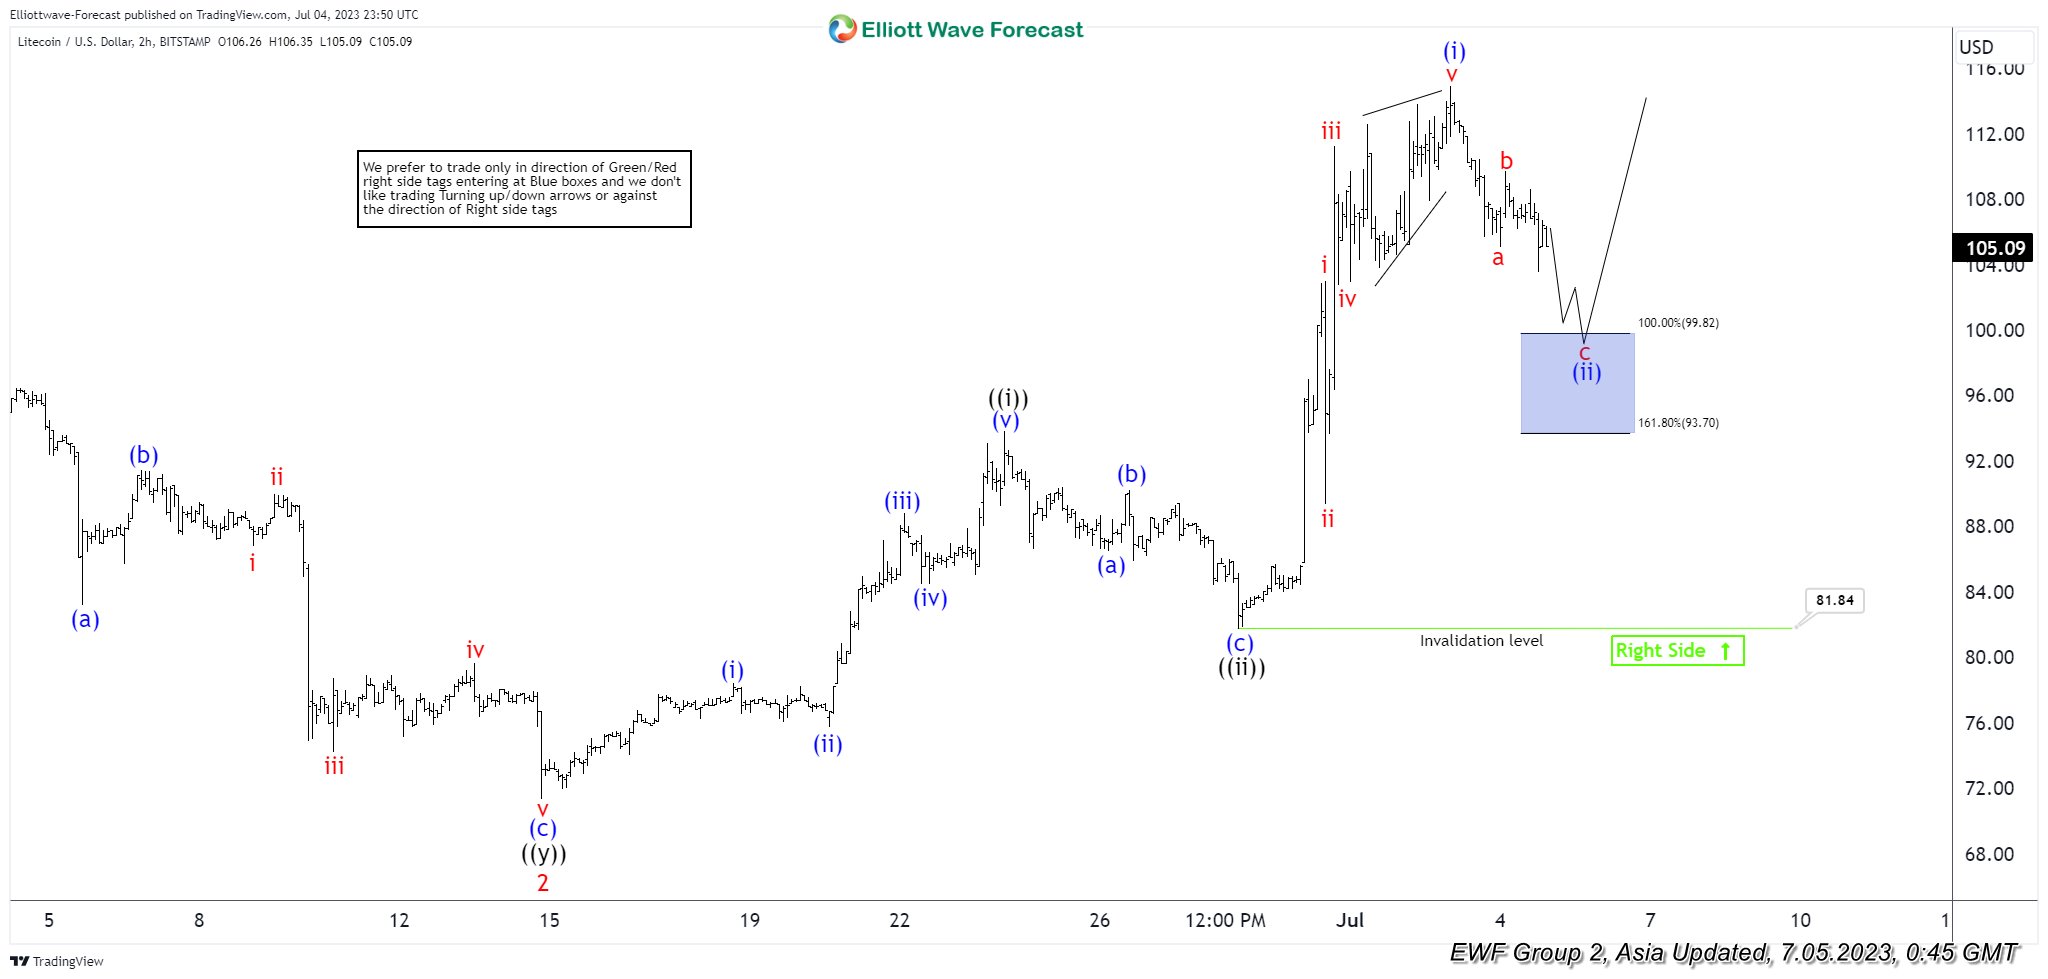
Litecoin (LTCUSD) shows a bullish sequence from 6.14.2022 low favoring further upside. Short term, rally from 3.11.2023 low is in progress as a 5 waves impulse Elliott Wave structure. Up from 3.11.2023 low, wave 1 ended at 103.41 and pullback in wave 2 ended at 71.37. The crypto currency has extended higher again in wave 3. Up from wave 2, wave (i) ended at 78.43 and pullback in wave (ii) ended at 75.73. The crypto currency extends higher again in wave (iii) towards 88.79 and pullback in wave (iv) ended at 84.48. Final leg wave (v) ended at 93.80 which completed wave ((i)). Pullback in wave ((ii)) ended at 81.84 with internal subdivision as a zigzag Elliott Wave structure.
Down from wave ((i)), wave (a) ended at 86.48 and rally in wave (b) ended at 90.25. Wave (c) lower ended at 81.84 which completed wave ((ii)). Litecoin then turns higher in wave ((iii)). Up from wave ((ii)), wave i ended at 103, pullback in wave ii ended at 89.38. Wave iii higher ended at 111.22 and dips in wave iv ended at 102.74. Wave v higher ended at 114.92 which completed wave (i). Pullback in wave (ii) is in progress as a zigzag Elliott Wave structure. Down from wave (i), wave a ended at 105.1 and wave b rally ended at 109.69. Expect wave c lower to complete at 93.7 – 99.8 which should end wave (ii) in higher degree. As long as pivot at 81.84 low stays intact, expect buyers to appear at blue box of 93.7 -99.82 for further upside.
Litecoin (LTCUSD) 2 Hour Elliott Wave Chart
LTCUSD Elliott Wave Video
https://www.youtube.com/watch?v=1gA5RSe-WEM