
Sample Category Title
EUR/AUD Weekly Outlook
EUR/AUD's decline resumed last week and hit 1.6620, but recovered since then. Initial bias remains neutral this week for consolidations. Outlook will stay bearish as long as 1.7060 resistance holds. Break of 1.6620 will resume larger down trend from 1.8554 to 138.2% projection of 1.8554 to 1.7245 from 1.8160 at 1.6351 next. However, firm break of 1.7060 will indicate short term bottoming, and bring stronger rebound.
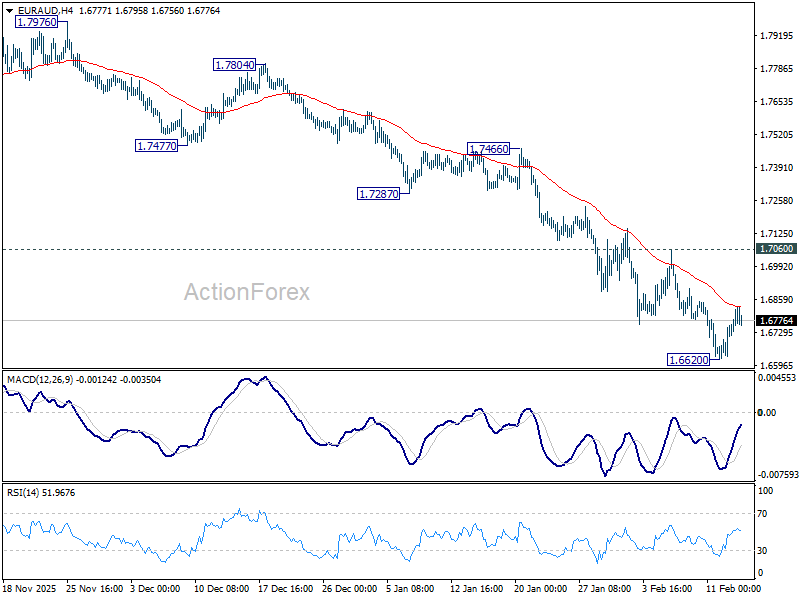
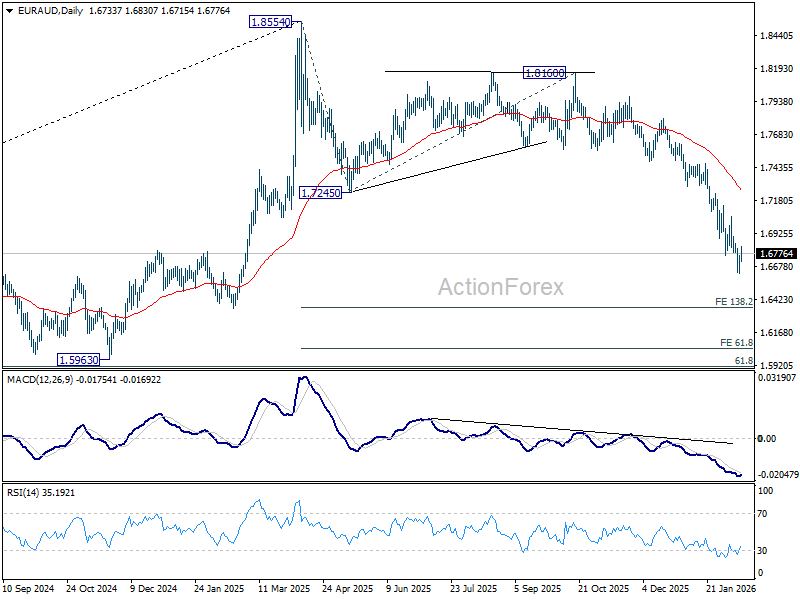
In the bigger picture, fall from 1.8554 medium term top is seen as reversing the whole up trend from 1.4281 (2022 low). Deeper decline should be seen to 61.8% retracement of 1.4281 to 1.8554 at 1.5913, which is slightly below 1.5963 structural support. For now, risk will stay on the downside as long as 1.7245 support turned resistance holds, even in case of strong rebound.
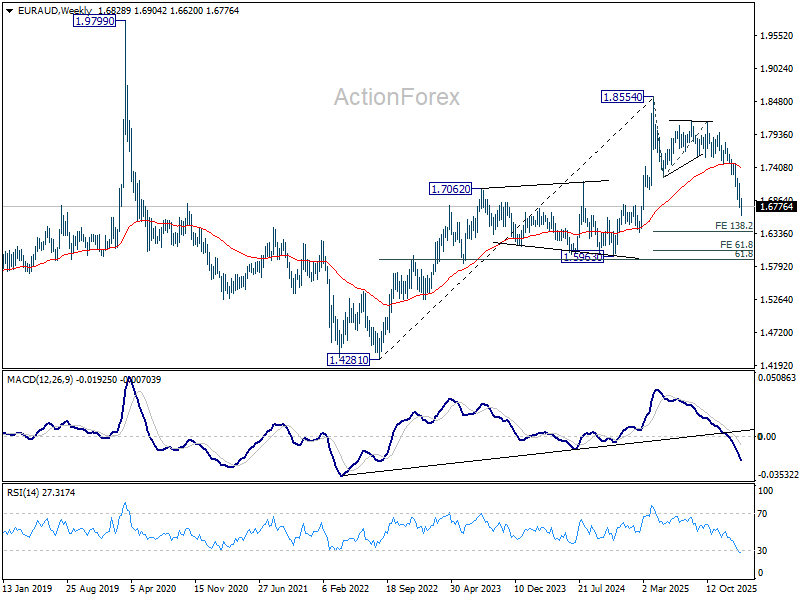
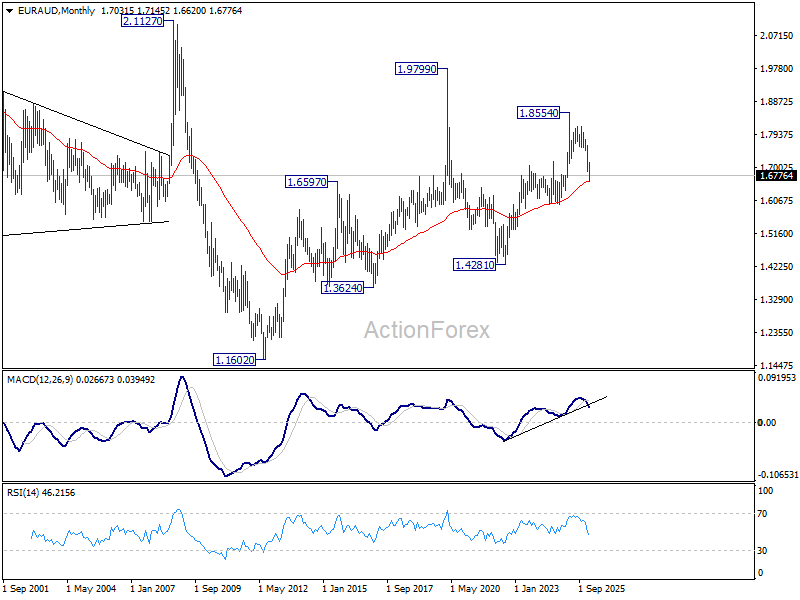
In the longer term picture, rise from 1.4281 is seen as the second leg of the pattern from 1.9799 (2020 high), which is part of the pattern from 2.1127 (2008 high). Current development argue that it has already completed at 1.8554. Sustained trading below 55 M EMA (now at 1.6603) will confirm this bearish case, and pave the way back towards 1.4281.
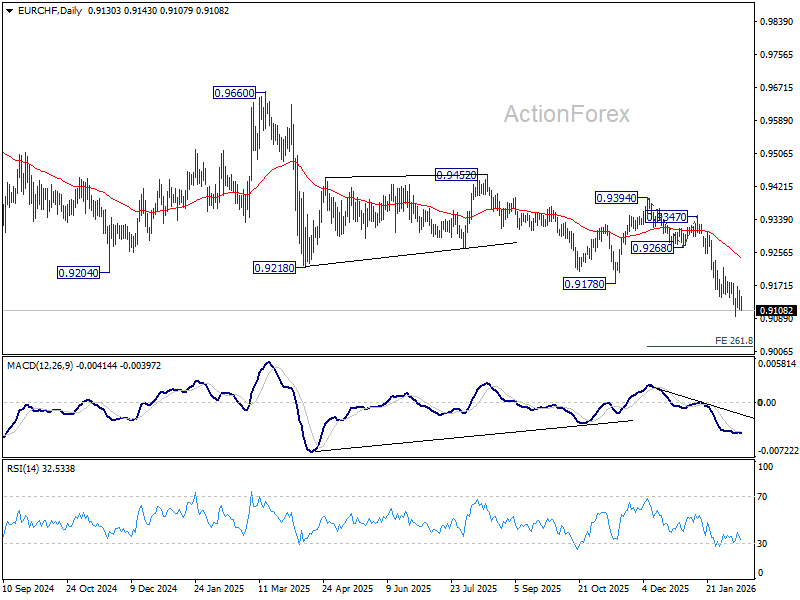
EUR/CHF Weekly Outlook
EUR/CHF's down trend resumed last week and dived to 0.9092, but recovered from there. Initial bias stays neutral this week first, and more sideway trading could be seen. Outlook will remain bearish as long as 0.9180 resistance holds. Firm break of 0.9092 will target 261.8% projection of 0.9394 to 0.9268 from 0.9347 at 0.9143. However, considering bullish convergence condition in 4H MACD, firm break of 0.9180 will indicate short term bottoming, and bring stronger rebound towards 55 D EMA (now at 0.9241).
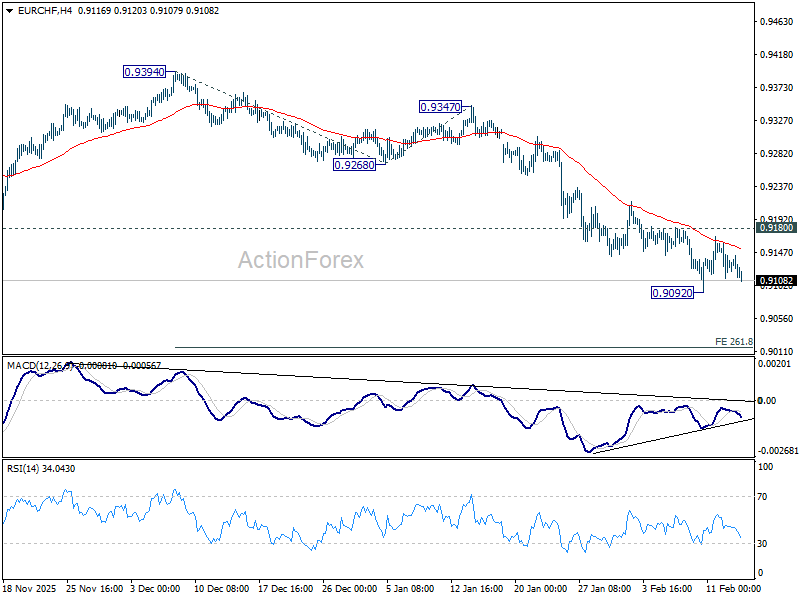
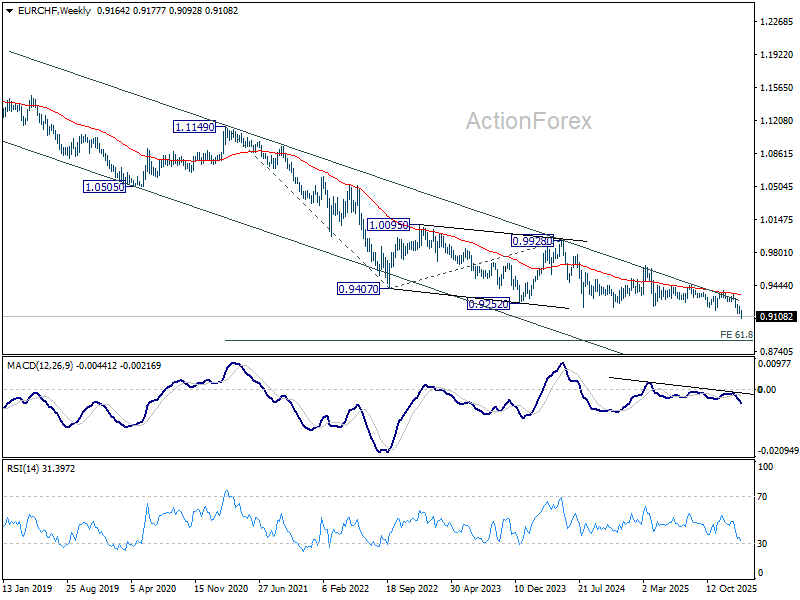
In the bigger picture, down trend from 0.9928 (2024 high) is still in progress with falling 55 W EMA (now at 0.9333) intact. Next target is 61.8% projection of 1.1149 to 0.9407 from 0.9928 at 0.8851. Outlook will stay bearish as long as 0.9394 resistance holds, in case of recovery.
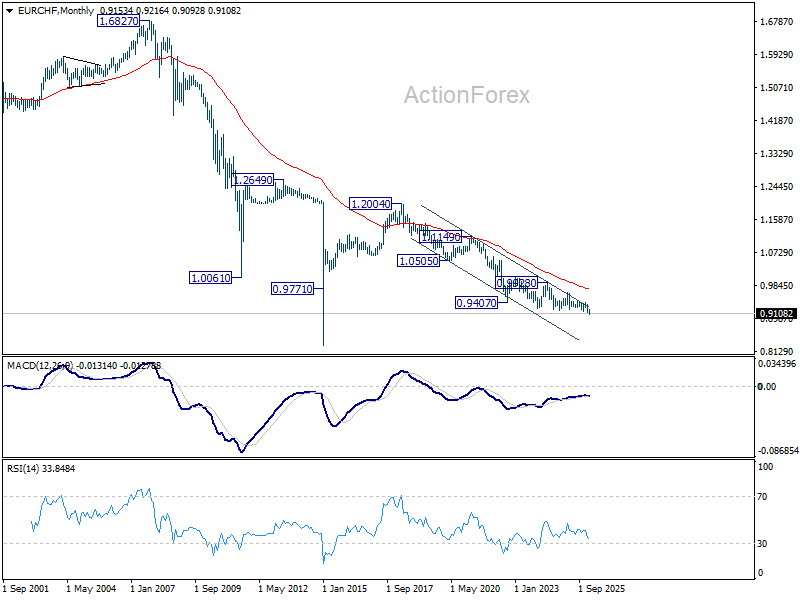
In the long term picture, EUR/CHF is also holding well inside long term falling trend channel. Down trend from 1.2004 (2018 high) is still in progress. Outlook will continue to stay bearish as long as falling 55 M EMA (now at 0.9739) holds.
Supreme Court Tariff Decision and Key Tests Ahead – Markets Weekly Outlook
- Discover our Weekly Market Outlook, exploring themes and events that forged financial flows throughout the week.
- After a volatile stretch, traders buckle for a heavy-slate of US data.
- Get ready for next week's action by exploring upcoming events across global Markets.
Week in review – Volatile swings and deleveraging continue
Markets are subject to particular waves of volatility in the past weeks, as years of upward trajectories and the recent acceleration are now questioning extreme valuations.
The culprit? Artificial Intelligence.
What had been a boon for Stocks is now coming back to bite the investor where it hurts, with investors realising that AI won't just be an upside-only catalyst.
Productivity gains by AI are now turning into fears of destruction for many firms, industries, and their components – Look at Tech and Softwares, straight-up bleeding since October.
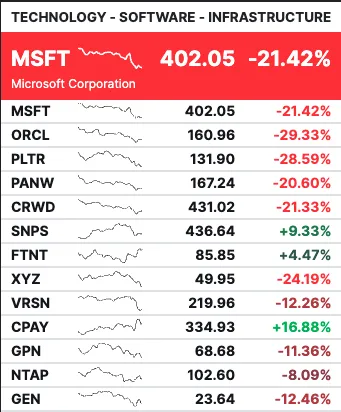
The Tech Sector is bleeding. 3-month Performance – Courtesy of Finviz
High investments and Capital Expenditures that were seen as only positive are now being targeted by profit-takers and short-sellers, as investors question how long it will take to materialize into profits.
This comes amid times when OpenAI, the founder of ChatGPT, is under heavy scrutiny for its fast-paced cash burning, and it gets even more damaging when OpenAI is pretty much the firm that started this entire AI trend to begin with.
In other words, AI won't just allow Markets to shoot higher eternally.
Some firms and industries will face pain ahead as the global economy prepares for an existential restructuring.
If and when large numbers of firms see their activities stolen by revolutionary technology, it could not only lead to massive layoffs and reduced consumption but also trigger cascades of entire industries unable to function correctly, resulting in lower profits and, in turn, an inability to repay their heavy debt levels.
This could quickly turn into a global liquidity and credit crisis – but for now, it's mostly fear: fear of creative destruction, which is for now still lifting global earnings to all-time highs.
To put things into perspective, the Dow Jones still reached a 50,000 all-time high just last week, and Nasdaq is still well below 10% to its record, so for now, it's only a turn in narrative – With Stock Indexes maintaining a broadly rangebound picture, it's essential to take a step back and not get too afraid too fast.
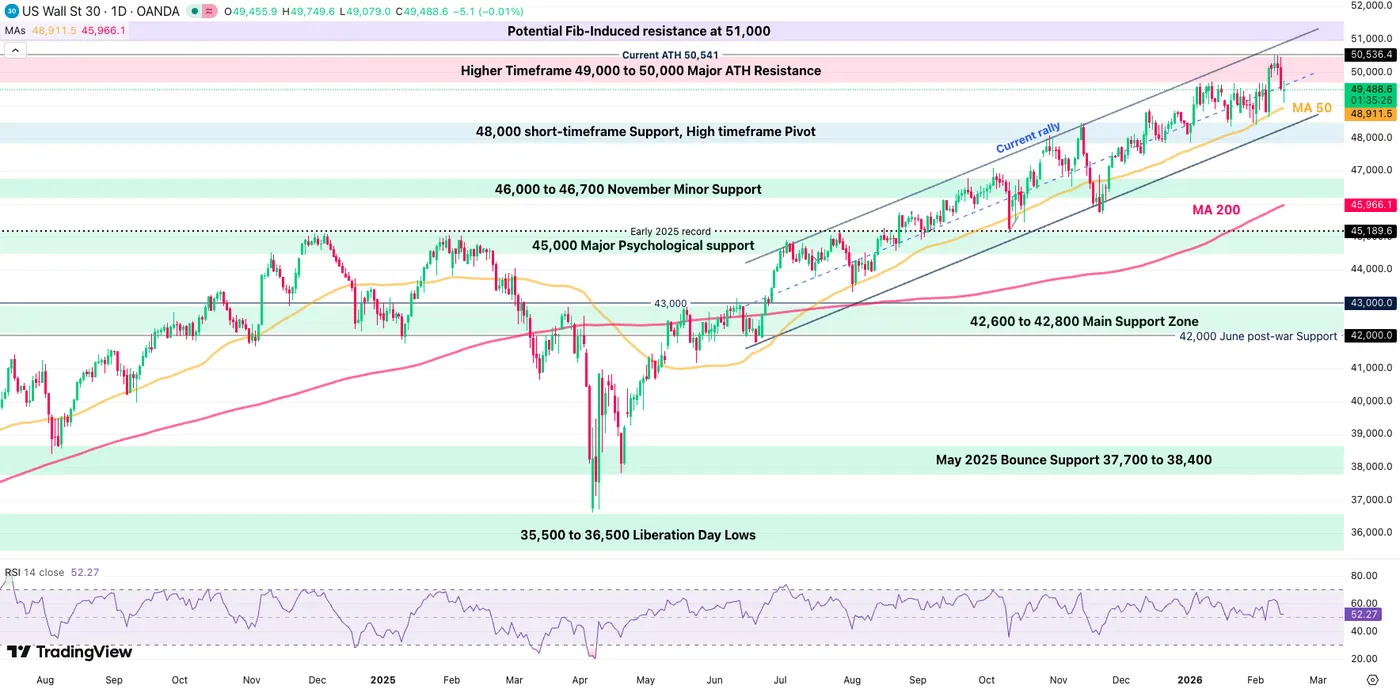
Dow Jones (CFD) Daily Chart – February 13, 2026 – Source: TradingView
Markets are all about risk, so too little risk could prevent seizing good opportunities.
And in any case, volatility is great, not for investors, but for traders who will enjoy more movement.
The narrative could also change quite suddenly, particularly after today's soft CPI print (2.4% vs 2.5% expected), which could finally wake the soft-landing hypothesis, especially with Non-Farm Payrolls beating expectations on Wednesday.
A harsh reality is settling in, and traders will have to keep that in mind when trading: in the times to come, price action will dominate the narratives, so always look at the bigger picture (and check higher-timeframe charts) to stay ahead of what's to come.
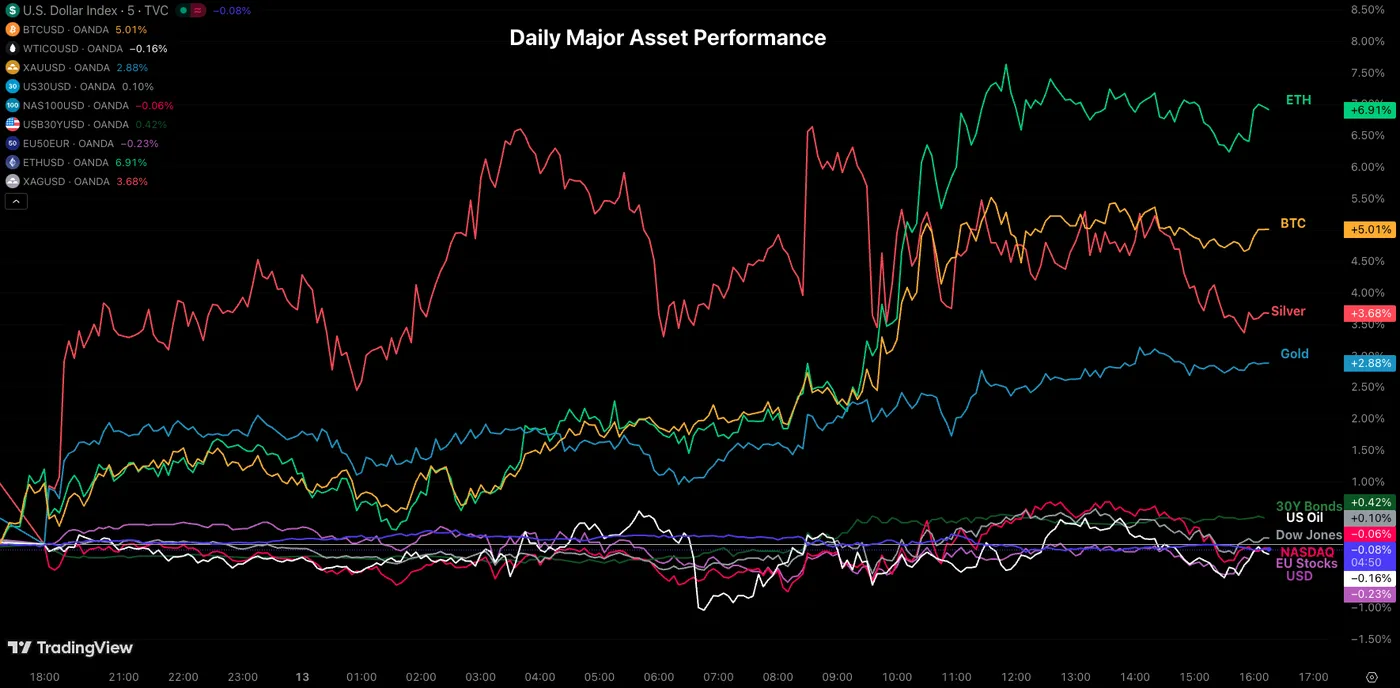
Weekly Performance across Asset Classes
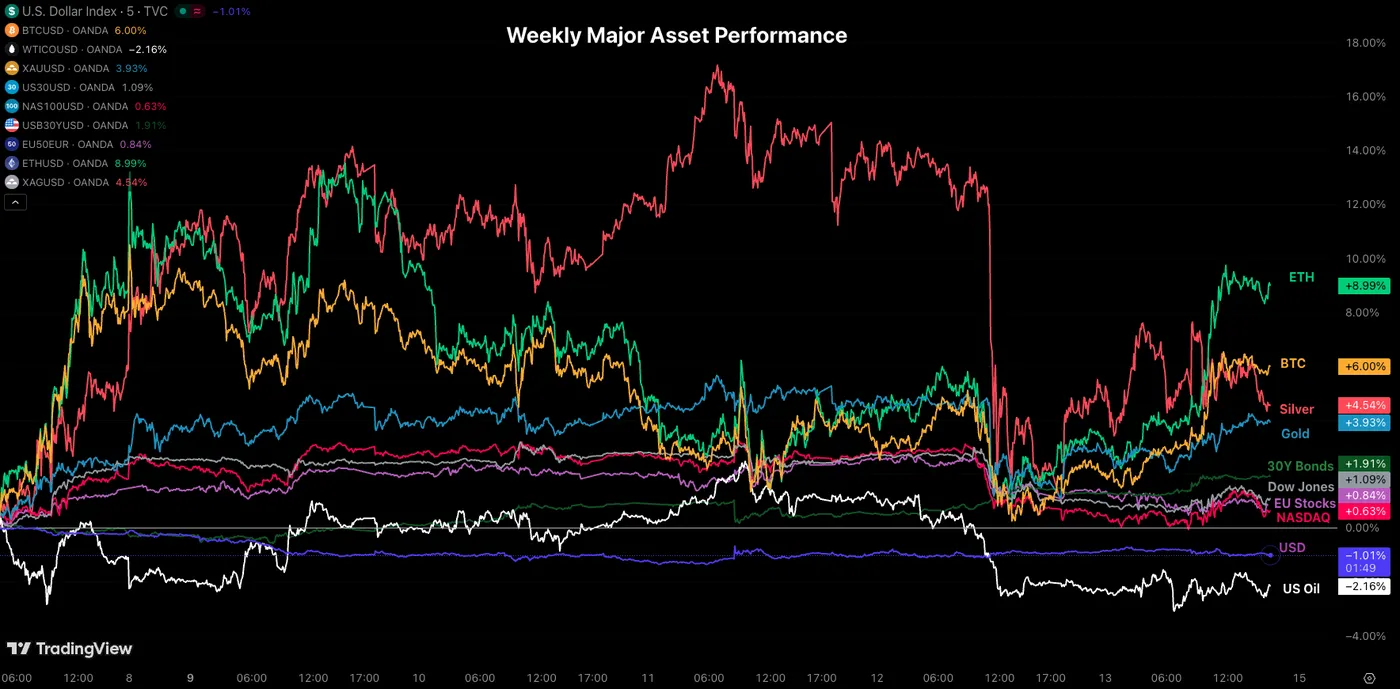
Weekly Asset Performance – February 13, 2026 – Source: TradingView
Most of the assets which got beaten down last Friday attempted a rebound in this week's action.
The best examples of this are of course Cryptocurrencies and Metals, which suffered heavily last week and are up between 3% to 8% on the week.
What also really shifted is the sudden interest in US Treasuries, which could launch a wave of repositioning.
Bonds had widely been left out of the everything rally in the past three years, bullied by risk-assets and elevated inflation, so keep a close eye to see if this changes.
The Week Ahead – Global Macro is back
Asia Pacific Markets – RBNZ Rate Decision and Australian Employment
Traders are getting ready for quite a heavy week for APAC trading.
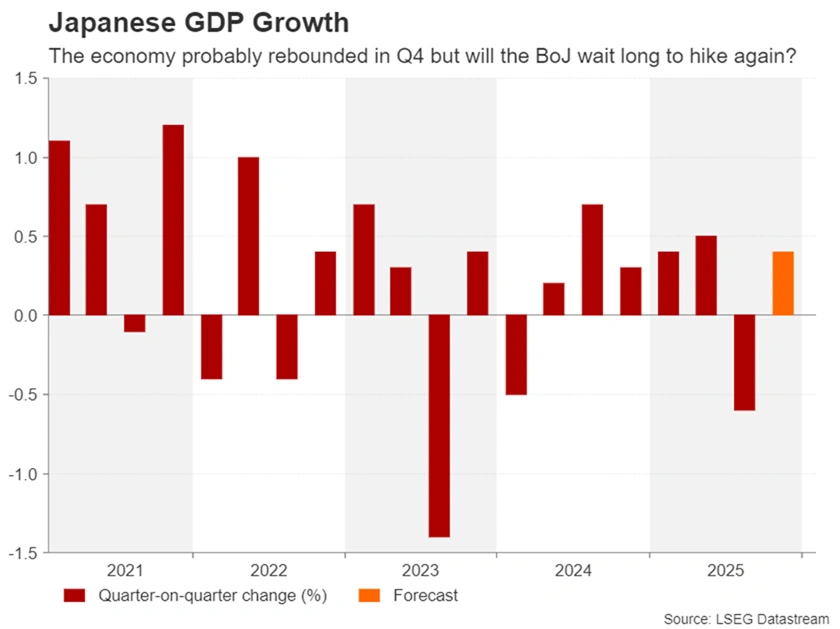
Sunday will commence with the Japanese GDP for Q4 where traders will now spot whether the effect of Takaichi's appointment turned into a positive for the Land of the Rising Sun.
Looking at how the JPY bounced last week, expect large reactions.
Monday will present the RBA Minutes, pretty important for FX traders particularly considering that the Australian Central Bank is the only one back to hiking.
The Aussie will also see an important test on Wednesday with its employment figures, essential to track whether last hike was just a one off or the beginning of a new cycle.
Tuesday however brings the most important test for APAC traders, with the RBNZ Rate decision. It will be the first press conference for Anna Breman, the new RBNZ Governor.
She will also appear on Thursday so make sure to listen to how she communicates for further clues.
A reminder that Antipodean currencies (AUD and NZD) have rallied quite severely since the beginning of 2026. They will both face a huge test next week.
Europe and UK Markets – Major data for Great Britain
Despite some key releases for the Eurozone and Germany (Surveys and German CPI on Tuesday, key speeches and PPI on Friday), participants will keep focus on UK data.
Similar to the US last week, they will face a confluence of high-tier releases.
Starting Tuesday, Markets await their Employment data, followed by UK inflation data (CPI, PPI and Retail Price Index) before concluding the week with Retail Sales on Friday.
The release are all during the overnight session in North America (2:00 A.M. ET), so make sure to keep your risk in check.
And of course Euro traders will have to stay aware for Lagarde's speech on Sunday (early) morning.
North American Markets – US Core PCE, Supreme Court Decision on Tariffs and Canadian CPI
North American traders will also have some work to do next week.
Not mentioning the few speeches (keep an eye on Bowman Monday), the week really starts on Tuesday with Canadian CPI.
Swap traders are aware that any beat there could significantly add pricing for hikes in Canada for the year to come, particularly after this week's BoC Minutes where it was noted that the current 2.25% rate is on the "Stimulative side".
Turning back to the US, FOMC Minutes will be presented on Wednesday, and while they are not expected to be a Market mover, they could provide interesting views on Inflation, particularly considering how this week's CPI release changed the narrative.
In any case, traders will have to await for Friday before seeing the release of Major data, with a streak of US releases.
The weekly closing session will commence with Core PCE (where Markets await to see if there is any real improvement in the Fed's favorite inflation tracker).
Promptly after, US Services and Manufacturing PMIs will be on deck.
It has been announced just this morning that the Supreme Court will give the decision regarding Trump's tariffs next Friday. This will be a major market mover.
Even after the latest ease in narrative, keep a close eye on geopolitical developments, particularly those involving the US-Iran talks, as they are likely to continue influencing Commodity and broader Markets.
Next Week's High Tier Economic Events
For all market-moving economic releases and events, see the MarketPulse Economic Calendar. (High-tier data only)
Friday 13 Market Wrap
Cross-Asset Daily Performance, February 13, 2026 – Source: TradingView
Today's session brought quite a shift in the Market, with today's inflation report allowing for struggling Stocks, Cryptos and Metals to rebound.
Stocks are however closing unchanged despite the very positive CPI report – This could be a rough sign for bulls.
The best outperformers there are of course Ethereum and Bitcoin which are both coming from very far after last week's tumble.
With FX remaining fairly muted, the US Dollar will be key to watch next week as traders await a repricing of FOMC cuts in 2026.
If it doesn't reach new lows next week, this sends a sign of relative strength for the Greenback, particularly with the upcoming Decision on Tariffs.
Safe Trades and enjoy your weekend!
The Weekly Bottom Line: Markets Blink, Jobs Hold Firm
Canadian Highlights
- The economic calendar was bare this week, but internal card spending data offered a glimpse into consumers early in 2026, suggesting a soft start to January.
- December insolvency data showed that the three-month moving average trend in consumer filings started to rise again – worth watching, but not yet alarming.
- The next week promises to be far more eventful with a slew of data releases. With risks to inflation looking balanced ahead of January’s CPI update next week, we think the Bank of Canada has enough reason to stay on hold when it meets in March.
U.S. Highlights
- Financial markets sold off this week as developments in AI and tech raised doubts about future earnings.
- January’s employment report delivered a clear upside surprise, easing concerns that the labor market was rolling over after last year’s slowdown.
- In other important data releases, there were softer signals from consumer spending and housing. Inflation had a softer-than-expected headline number, but some cautionary signs of inflation pressures in the core.
Canada – A Week to Reflect
The shooting in Tumbler Ridge overshadowed all else this week, as Canadians mourned the victims of this tragedy. As a result, the Prime Minister postponed his planned defence-industrial strategy announcements, and with no economic data on the calendar, the week was somberly quiet.
Markets, though, kept moving. Canadian equities fluctuated over the week but are set to finish with more than 1% gain. The bond markets followed suit, with the 10-year Government of Canada yield falling roughly 15 basis points to 3.25% (yields move inversely to prices).
With the data calendar bare, it’s a good moment to step back and frame the bigger picture. We expect Canada’s economy to remain lukewarm in 2026, with a bit more heat by year-end. Our forecast sees the economy ending next year about 1.4% larger than in 2025, although with the coming CUSMA review likely to be bumpy, the risks to growth are tilted to the downside.
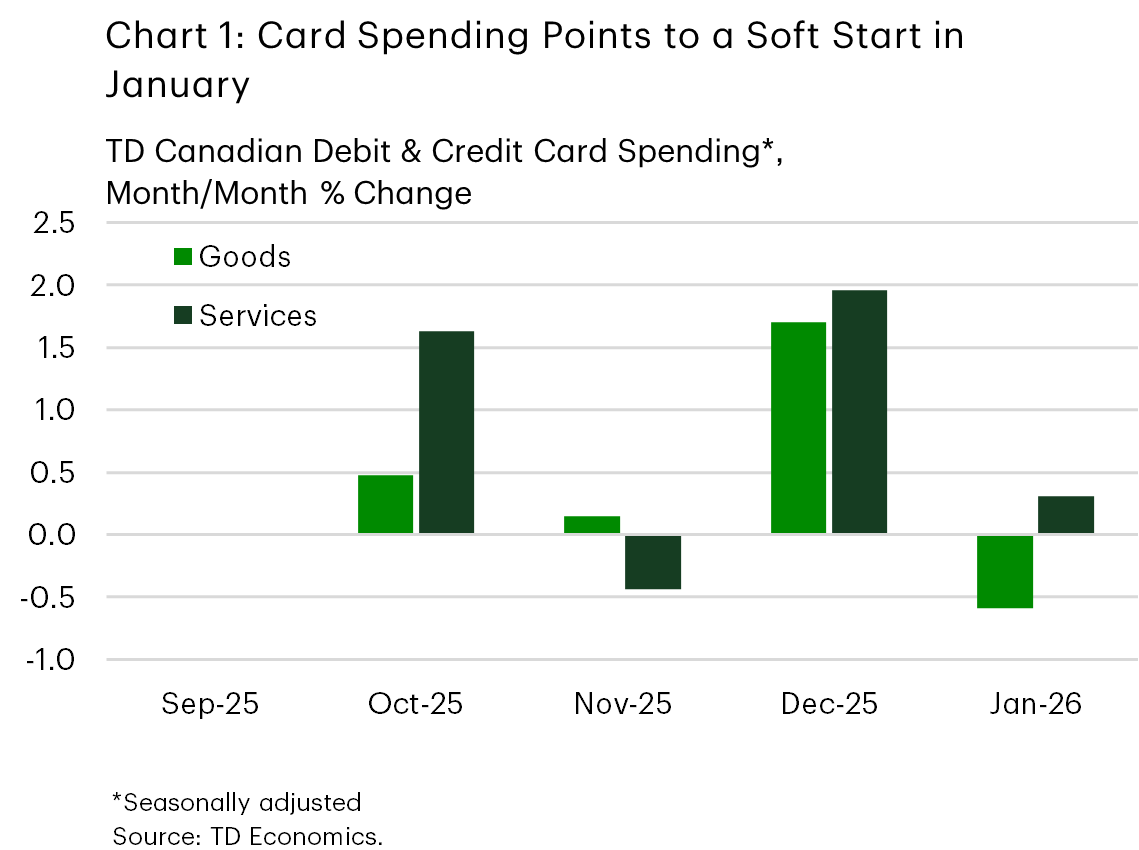
Business investment remains subdued amid lingering trade uncertainty and slower population growth is capping employment gains. But there are also reasons for optimism. Government spending is poised to provide support toward the end of 2026, and household spending remains one of the more stable pillars of the economy. TD card spending data point to a relatively solid December, with gains concentrated in services – particularly recreation and travel (Chart 1). Travel stayed strong in January too, as Canadians fled the winter storms for warmer destinations. Card spending on goods was firm in December, but softened in January, likely reflecting weather-related disruptions and reduced willingness to venture out. This sits somewhat at odds with the December retail sales flash estimate, which signaled a contraction. But auto sales, which were soft according to industry data, are included in retail sales and likely explain the gap. We also see a pullback in holiday-related categories such as clothing and electronics after strong December gains.
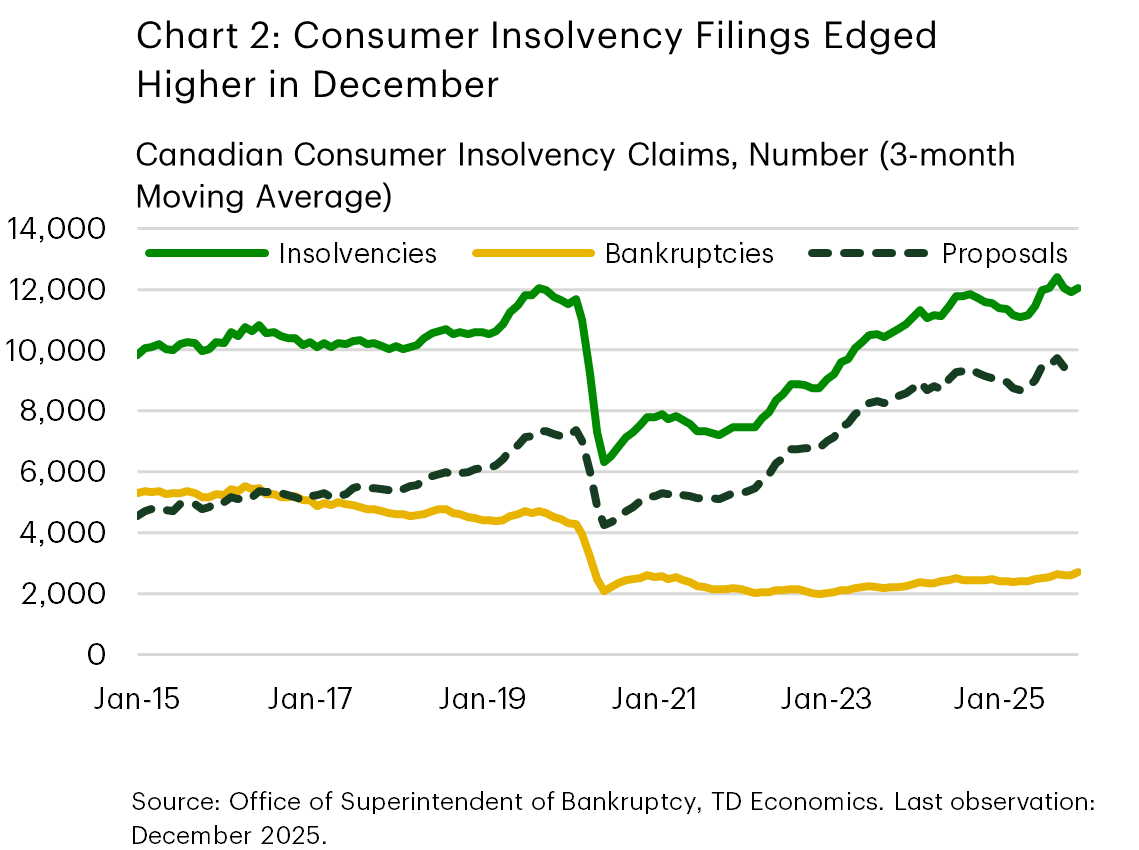
Above-trend growth in personal income and solid wealth gains helped support this spending. Still, not everyone is on solid ground. December insolvency data consumer filings rose 16% month-on-month. On a three-month moving average, filings rose 1.6%, reversing declines in the prior two months (Chart 2). The increase was driven by consumer proposals, though bankruptcies edged higher as well. While this bears watching, the trend is not yet alarming. Population-adjusted insolvency rates remain below pre-pandemic levels. Notably, bankruptcies are still historically low, with most of the rise coming from proposals – a mechanism that allows households to retain assets, maintain structured repayment plans, and face a comparatively milder hit to credit ratings.
Despite being short, next week promises to be far more eventful, with releases on inflation, merchandise trade, housing starts, home sales, and retail trade. Inflation bears close watching ahead of the Bank of Canada’s rate decision on March 18th. With inflation risks roughly balanced ahead of next week’s CPI, the central bank is right to share the Valentine’s Day spirit: committed but not quite ready to make a big move.
U.S. – Markets Blink, Jobs Hold Firm
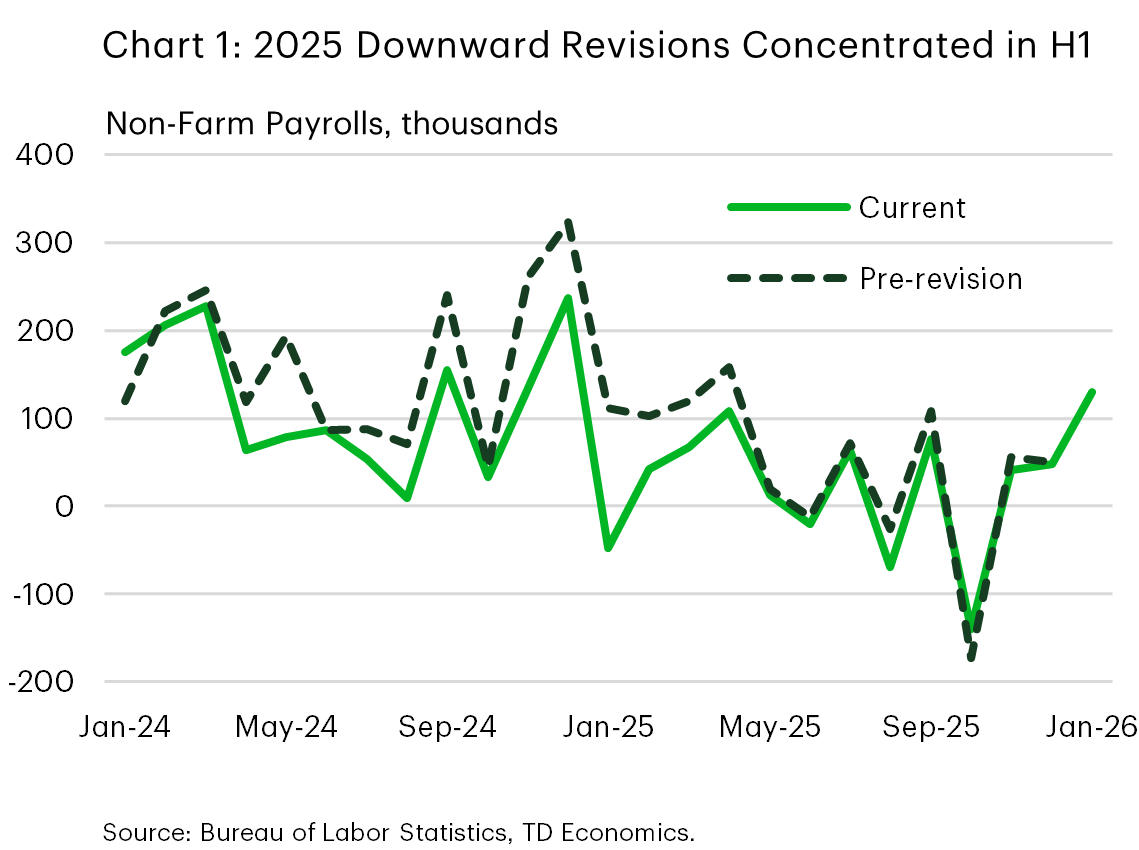
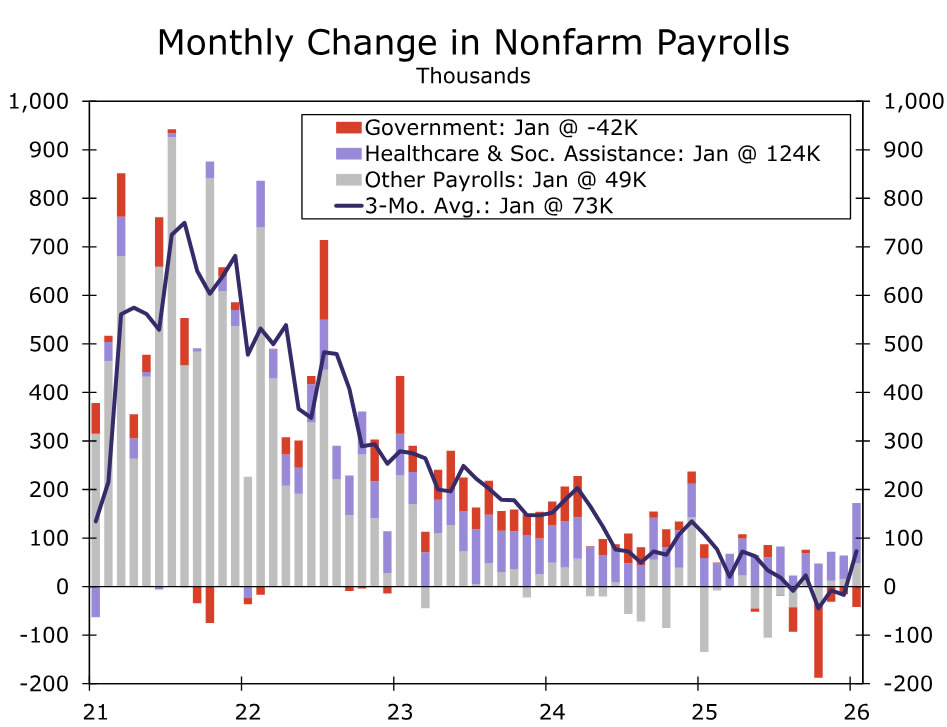
Financial markets endured a rough patch this week, with a broad sell off across equities reflecting anxiety about the threat AI could pose to earnings and employment, the path of interest rates, and the durability of the ongoing expansion. That market reaction stood in contrast to the message from the January employment report. Payrolls growth came in well ahead of expectations, accompanied by a further dip in the unemployment rate. While revisions did reveal that job growth over much of 2025 was weaker than previously thought, the January rebound suggests that labor demand remains intact (Chart 1).
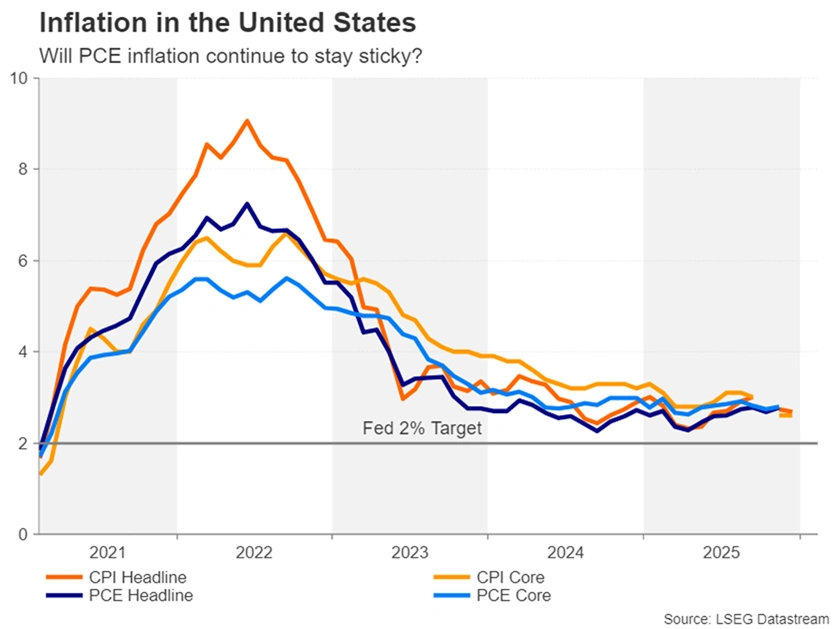
The rest of the data flow painted a more mixed picture of the economy. Headline CPI inflation came in softer than expected this morning, but core CPI picked up the most since August. Services inflation heated up while core goods inflation (excluding used vehicles) rose at its fastest monthly pace in nearly a year. The inflation report comes at a pivotal moment, as reports that the Trump administration may scale back its steel and aluminum tariffs suggest the administration is conscious of inflation risks.
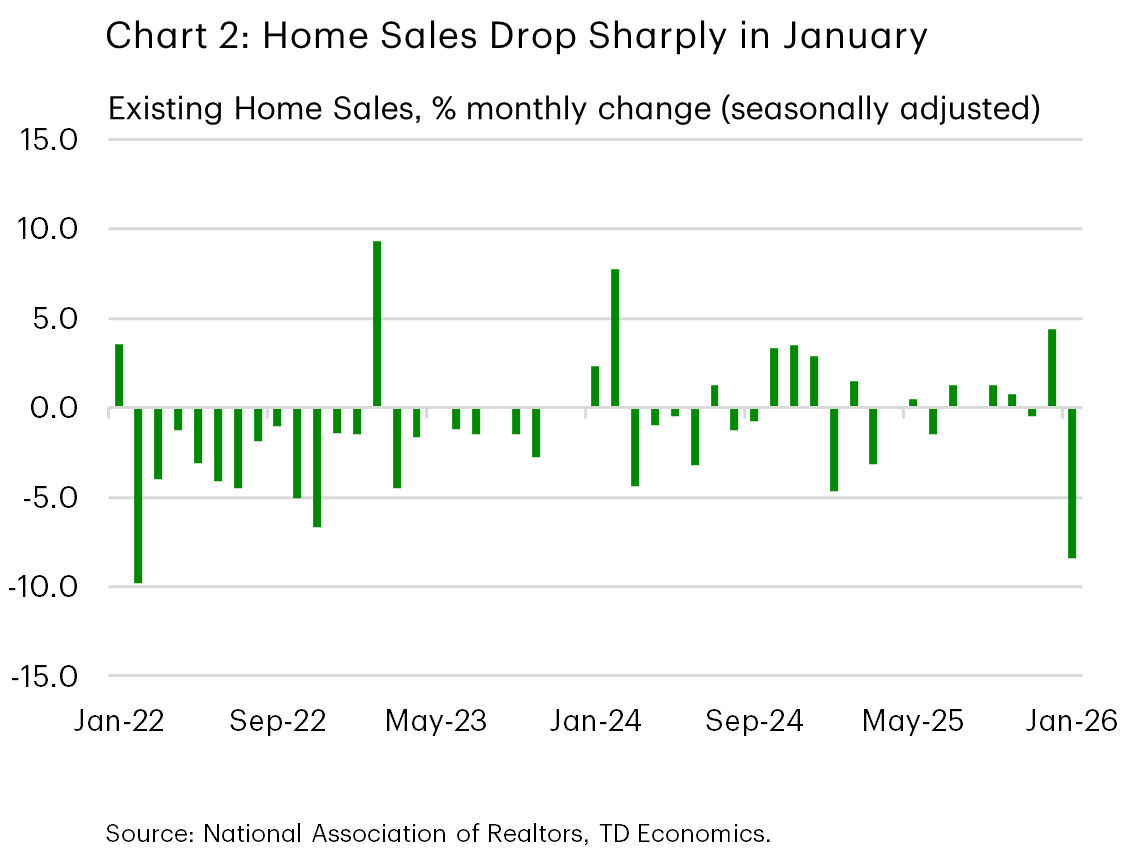
Retail sales ended 2025 on a soft note. December sales were flat after a solid November, and downward revisions tempered the momentum implied by earlier releases. Housing data were also notably weak. Existing home sales posted their largest monthly decline in nearly four years in January, reflecting a combination of affordability constraints and bad weather (Chart 2).
Markets, meanwhile, struggled to reconcile the week’s macro data with a less accommodating policy backdrop. The equity sell off reflected concerns about growth-sensitive sectors and fear that advancements in AI may dislodge large incumbents across a wide swath of the economy, and a reassessment of the path for interest rates following a string of Fed communications. Market pricing for the Federal Reserve to reduce rates in its June meeting have fallen from 60% to around 50% over the course of this week. Speeches this week from Federal Reserve officials revealed a balance of opinion. More hawkish voices stressed that inflation remains above target and warned against premature easing, while others acknowledged that, even with a strong jobs report, there is still an argument for rate cuts later this year if disinflation continues. On balance, we read the prevailing sentiment from Fed officials as one of patience rather than urgency, but still hold on to our call for a rate cut in June. This morning’s softer CPI release may help move the Fed’s perceived balance of risks slightly towards easing, particularly if the disinflationary pressure were to persist over the coming months.
Looking ahead, our eyes will be on next week’s release of the FOMC meeting minutes, which should provide additional insight into how policymakers have been weighing inflation risks against signs of labor market stabilization. And next Friday’s PCE inflation and consumer spending data will be helpful in assessing the durability of consumer spending and the extent of momentum in recent inflation data.
International Week Ahead: Growth Rebound to Keep BoJ Hikes in Play
Summary
International Week Ahead
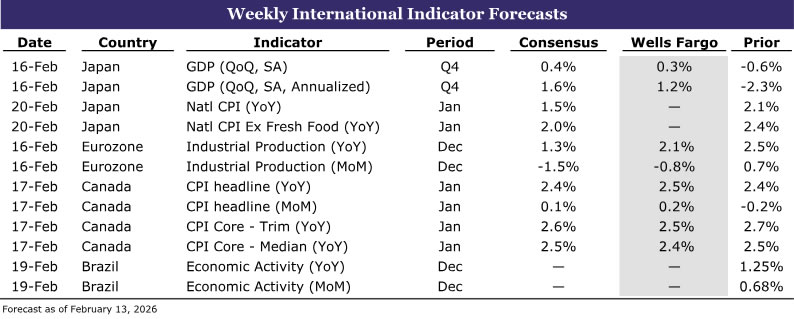
- Japan Q4 GDP: Growth Rebound to Keep BoJ Hikes in Play • (02/16)
- Canada January CPI: Noisy Headline and Cooling Core to Give BoC Breathing Room • (02/17)
- Brazil December Activity: Year-end Momentum to Influence Early ’26 BCB Policy • (02/19)
- Banxico February Meeting Minutes: Cryptic Communications, but Perhaps Minutes Clear the Smoke? • (02/19)
G10
Japan Q4 GDP • Monday
Growth Rebound to Keep BoJ Hikes in Play
While both we and consensus expect a rebound in Q4-2025 following the quarter-over-quarter annualized 2.3% contraction in Q3, we forecast a milder recovery of 1.2% versus 1.6% for consensus. The contraction in Q3 was driven largely by weaker net exports after shipments were pulled forward into Q2 ahead of anticipated U.S. tariffs. With tariffs lowered in July 2025, the drag from net exports should ease and turn supportive, while January trade data points to continued strength in global semiconductor demand, underpinning exports. Domestically, business sentiment has improved, as shown in the Bank of Japan's (BoJ) Q4 Tankan survey, which should translate into firmer business investment. Additionally, the front-loading of construction and residential investment ahead of new environmental regulations introduced in Q2 should also have faded, supporting a broader improvement in investment. Taken together, stronger exports and higher investment should be sufficient to drive a rebound in Q4 growth. A return to growth would keep BoJ rate hikes in play, though the broader policy backdrop warrants caution. The Takaichi administration’s recent landslide victory has revived concerns around expansionary fiscal policy, contributing to upward pressure on yields and pushing 10-year JGBs to historical highs. However, if new debt issuance is avoided, as the administration has indicated, the policy rate may not need to rise as much as markets currently expect. The BoJ is likely to proceed cautiously as it assesses fiscal developments and waits for clearer evidence of wage-price firming, particularly with inflation expected to cool further in data to be released next week due to government energy subsidies and stabilizing food prices. We maintain our base case for a 25 bps rate hike by Q3-2026, bringing the policy rate to 1.00%.
Canada January CPI • Tuesday
Noisy Headline and Cooling Core to Give BoC Breathing Room
We expect headline inflation to rise in Canada to 2.5% in January from 2.4% in the previous month as base effects peak. Base effects reflect the lowering of prices between December 2024 and February 2025 because of the temporary GST/HST holiday. Elsewhere, measures of underlying inflation such as the trimmed and weighted median inflation are likely to decline to 2.5% year-over-year and 2.4%, respectively, from 2.7% and 2.5% in December. The temporary rise in year-over-year headline inflation is likely to keep the market and consensus baseline view for an on hold Bank of Canada (BoC) intact near-term. We believe these base effects are worth about 0.6-0.8 percentage points and imply a substantial stepdown in inflation as early as the February report. It’s notable that underlying inflation as suggested by the 3m average of trimmed and weighted median inflation are running at 1.45% and 1.85% respectively vs. 6m averages around 2%. We believe headline inflation is likely to step down to below 2% as soon the February report (1.8% per our nowcast). As such, the macro narrative is likely to shift from the noise of elevated headline inflation to cooling underlying core inflation. This, combined with sub-trend growth, economic slack and downside risks to growth from continued trade uncertainty with the US, we see greater room for the BoC to cut rates than hike. Current policy rate at 2.25% is within the range of neutral rate estimates (2.25-3.25) for an economy that is likely undergoing a structural transition with more to come as USMCA negotiations continue. On the flip side, a faster rollout of fiscal stimulus is likely to contain downside risks and reduce the need for deeper rate cuts.
EMs
Brazil December Activity • Thursday
Year-end Momentum to Influence Early ’26 BCB Policy
The December activity index is likely to show Brazil’s economy lost steam at the end of last year. Uber-restrictive monetary policy settings and limited fiscal stimulus as well as pre-holiday spending rolling off should push the activity index lower relative to the prior month. We will be attentive to the activity index as data will fill in the rest of the economic story for Q4 as well as how Brazil’s economy performed for all of 2025. But more importantly, the December activity index will act as the last major gauge of activity that Brazilian Central Bank (BCB) policymakers will be able to assess before meeting in March. Inflation takes precedence for the BCB, but policymakers have committed to cutting interest rates at the March Copom with the only outstanding question being how aggressive policymakers want to lower the Selic Rate. December activity could play a more influential role this time around as recent commentary from BCB policymakers leave the door open to move gradually with a 25 bps cut or remove monetary policy restriction quicker by starting with a 50 bps rate reduction. For us, we believe policymakers will opt for caution and deliver a 25 bps cut, but we could be swayed toward a 50 bps cut come March if activity is especially weak. Right now, markets lean only slightly toward the BCB lowering the Selic Rate by 50 bps, so the activity index could reinforce calls for a larger move or dial back near-term easing expectations. We hold a less dovish view on BCB monetary policy for all of 2026, which also means a more rapid pace of easing to start the year would also force us to recalibrate our YE-26 Selic Rate forecast.
Banxico February Meeting Minutes • Thursday
Cryptic Communications, but Perhaps Minutes Clear the Smoke?
Central bank meeting minutes rarely offer a ton of new insight into future interest rate decisions. Minutes are backward-looking and do not reveal which policymaker said what, a dynamic which is especially true for Banxico. As such, we do not expect anything groundbreaking to come out of February Banxico minutes, but the official statement as well as post-meeting communications are sending mixed messages and creating more smoke than clearing the fog. Maybe Banxico minutes next week will offer clarity? Again, skeptical, especially after policymakers left rates on hold earlier this month, told markets keeping rates unchanged may prove to be a “pause” in the easing cycle, all while revising their inflation forecasts sharply higher. Adding a bit more confusion to the mix are Banxico Deputy Jonathan Heath’s recent comments to a local bank. Heath appeared to shred Banxico’s inflation forecasts as unrealistic (again) this time going so far as to say “almost nobody believes that not only are we not going to meet the goal for Q2-2027, but not even in the next four, five or ten years.” He did, however, mention that if inflation evolves in line with Banxico’s inflation target, which has again been revised higher, a majority of members could opt to vote for a rate reduction at the next meeting in March. At least based on how Banxico framed its latest official statement, that appears to be the message it is sending to markets, according to Heath. If policymakers are willing to accept higher inflation, why not just cut in January? Why “pause.” Why bury any kind of guidance in a podcast? Confused? Us too. Markets seem to be pricing more Banxico easing after Heath’s comments, which we believe is a mistake. Banxico may wind up cutting in March, but for now, we are sticking with our view that Banxico will hold rates steady at its next meeting and keep rates on hold for all of 2026. Minutes may offer some insight, but either way, we expect Banxico to communicate again with markets ahead of the March meeting.
Weekly Economic & Financial Commentary: Strong Payrolls Dampen Hopes for Near-Term Rate Cuts
Summary
U.S. Week in Review:
- Stronger labor market data and cooler inflation reduce the odds of near-term Fed easing. Job growth surprised to the upside (+130K), unemployment fell (4.3%) and recent hiring looks more stable than in outright deterioration—strengthening the Fed's case to stay on hold. At the same time, CPI cooled more than expected with the annual rate on core inflation touching its lowest in nearly five years (2.5%), reinforcing the disinflation trend and keeping the door open to cuts later in the year. The latest data suggest a March rate cut looks increasingly unlikely, but the prospects for additional rate cuts remains alive for later in the year.
U.S. Week Ahead:
- December Trade Balance (Thursday)
- December Personal Income & Spending (Friday)
- Q4 GDP (Friday)
U.S. Week in Review
Strong Payrolls Dampen Hopes for Near-Term Rate Cuts
The upshot of a mini-government shutdown last week was the somewhat unusual alignment of indicators that brought fresh data on both jobs and inflation inside a span of 48 hours. This pivotal double header showed improvement on both of the Fed's mandates. The job market improved, even if hiring remains quite concentrated in the healthcare and social services sector, and inflation cooled more than expected. Hawks on the FOMC can now point to a labor market that is regaining its footing, but doves can cite the improvement in bringing inflation closer to target as a rationale for adjusting rates down another notch closer to neutral.
For months now, we've been saying that the window for additional Fed cuts is closing. Taken together, this week's data has likely pushed the next rate cut out until June, with the prospects for any further rate cuts in this cycle remaining dependent on how the data evolve over the next few months. If the breadth of robust hiring extended beyond just a few sectors, we'd say the window for additional cuts is closed. For now though, the tepid pace of hiring ex-healthcare does not warrant such conviction.
January payrolls handily exceeded modest expectations with a +130K gain in net hiring. This lifted the three‑month average to 73K (chart) and pushed the unemployment rate back down to 4.3%—where it was in August 2025 before the FOMC cut rates at its three subsequent meetings. While revisions were deeply negative, they were largely anticipated and did little to change the forward signal: job growth appears to be stabilizing rather than rolling over. Inflation data were more constructive. Headline and core CPI both cooled in January, and core inflation is now running at its lowest annual level since early 2021 (chart). While core PCE inflation is likely to come in stronger for January (~0.37% m/m) due to different weightings, source data and seasonal adjustment factors, the disinflation narrative remains intact. That said, the combination of firm labor data and still-above-target inflation makes a March rate cut look highly unlikely, even as it preserves optionality for cuts later in 2026.
The Employment Situation report may hoard the limelight especially with a big upside surprise, but other measures of the jobs market have not been quite so rosy. Wage pressures continue to fade. The Employment Cost Index undershot expectations in the fourth quarter, with compensation growth slowing to a 3.4% year-over-year rate—the weakest pace since 2021. Cooling wages and benefits (outside of healthcare) alongside solid productivity gains ease concerns about a labor-cost-driven inflation resurgence. But it's these signs of a gradually moderating labor backdrop that keeps downside growth risks on the Fed’s radar. The latest consumer data point to some weakness with retail sales stalling in December. But, aggregate holiday spending rose 3.6% in November and December compared to a year-earlier, broadly in line with our earlier expectations. The year-end weakness appears narrow and goods-led rather than a broad retrenchment, leaving the outlook for consumer demand largely intact heading into 2026.
U.S. Week Ahead
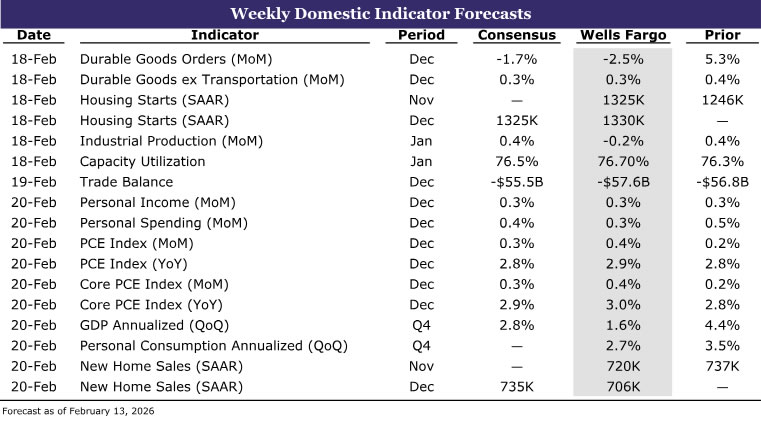
U.S. Trade Balance • Thursday
Recent trade data have been noisy, but the signal remains intact. After narrowing sharply in October, the trade deficit widened again in November, driven largely by volatility in a handful of categories—most notably gold, pharmaceuticals, and high‑tech imports. These swings reflect category‑specific distortions, not a broad deterioration in trade fundamentals. Stripping out gold and high‑tech effects, underlying import demand was soft in 2025, weighed down by tariff uncertainty and slower capital spending outside the technology sector.
Looking ahead, we expect the trade deficit to widen further to -$57.6 billion in December, as these specific factors continue to influence the year‑end data. However, the outlook for early 2026 is more constructive. Firm consumer demand, a recovery in more traditional areas of capital spending, and inventory normalization—absent evidence of a structural shift toward onshoring—should support a rebound in import growth as we move into the new year.
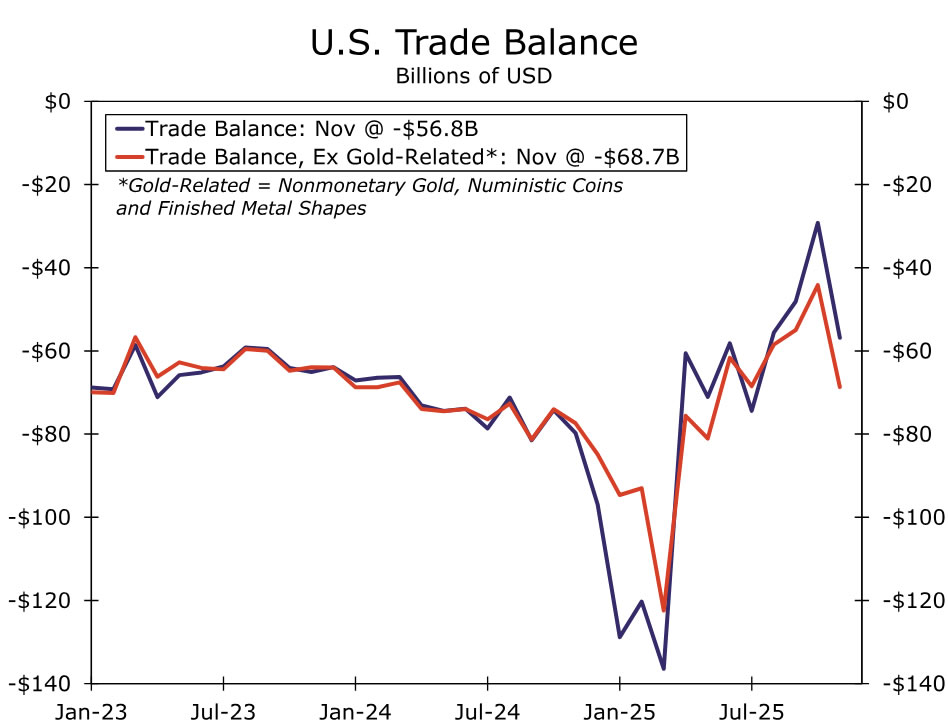
Personal Income & Spending • Friday
U.S. consumers remain on solid footing heading into 2026. Household spending continues to run at a healthy pace, and we look for nominal personal spending to rise 0.3% in December, leaving real spending roughly flat. While December retail sales were softer than expected and should weigh modestly on year‑end spending, the weakness appears driven by timing and pull‑forward effects rather than a deterioration in underlying demand. As a result, the softer retail print does not meaningfully change our constructive view of the consumer entering the new year.
Income growth remains the key watch point. Soft income gains have required households to lower saving rates, and we expect personal income to rise only 0.3% in December. Even so, the near‑term outlook for consumption remains supportive. Tax relief, easing inflation, and steadier job growth should help offset income headwinds and keep real consumer spending growing at a moderate pace through 2026.
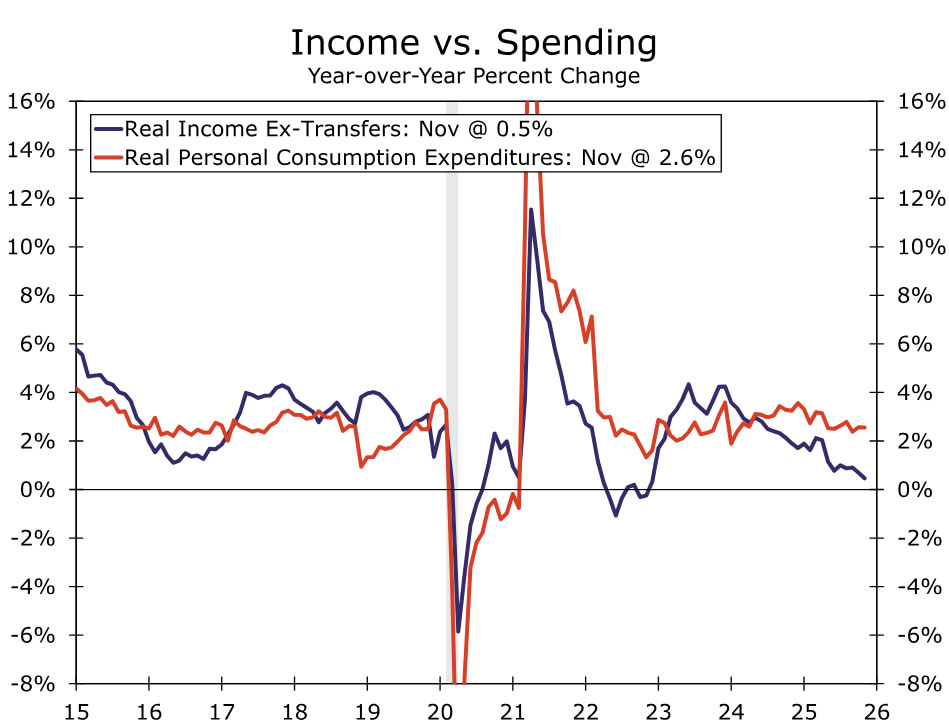
Q4 GDP • Friday
U.S. growth likely slowed at year‑end, but underlying fundamentals remain solid. We estimate real GDP grew at a 1.6% annualized pace in Q4, with most of the weakness attributable to the extended government shutdown from early October through mid‑November, which likely shaved roughly 1.2 percentage points from headline growth.
Stripping out shutdown effects, activity held up well. We expect real PCE to grow at a 2.7% annualized rate, while business investment likely posted a modest gain led by high‑tech equipment and intellectual property. Net exports and inventories remain the key sources of volatility. Beyond tariff uncertainty, a surge in investment‑related gold flows continues to cloud the signal from monthly trade data, while inventories remain inherently difficult to forecast given limited real‑time information. Through this noise, the economy appears to have ended 2025 in a healthy position, growing at a 2.2% average pace over the year.
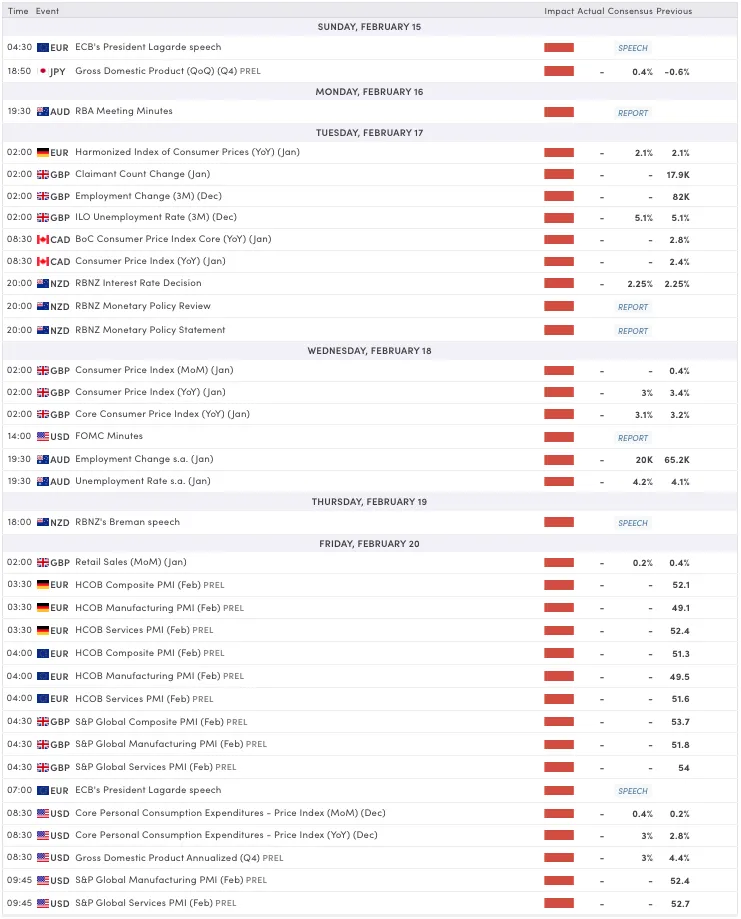
Summary 2/16 – 2/20
Monday, Feb 16, 2026
| GMT | Ccy | Events | Cons | Prev |
|---|---|---|---|---|
| 21:30 | NZD | Business NZ PSI Jan | 51.5 | |
| 23:50 | JPY | GDP Q/Q Q4 P | 0.40% | -0.60% |
| 23:50 | JPY | GDP Deflator Y/Y Q4 P | 3.20% | 3.40% |
| 04:30 | JPY | Industrial Production M/M Dec F | -0.10% | -0.10% |
| 10:00 | EUR | Eurozone Industrial Production M/M Dec | -1.50% | 0.70% |
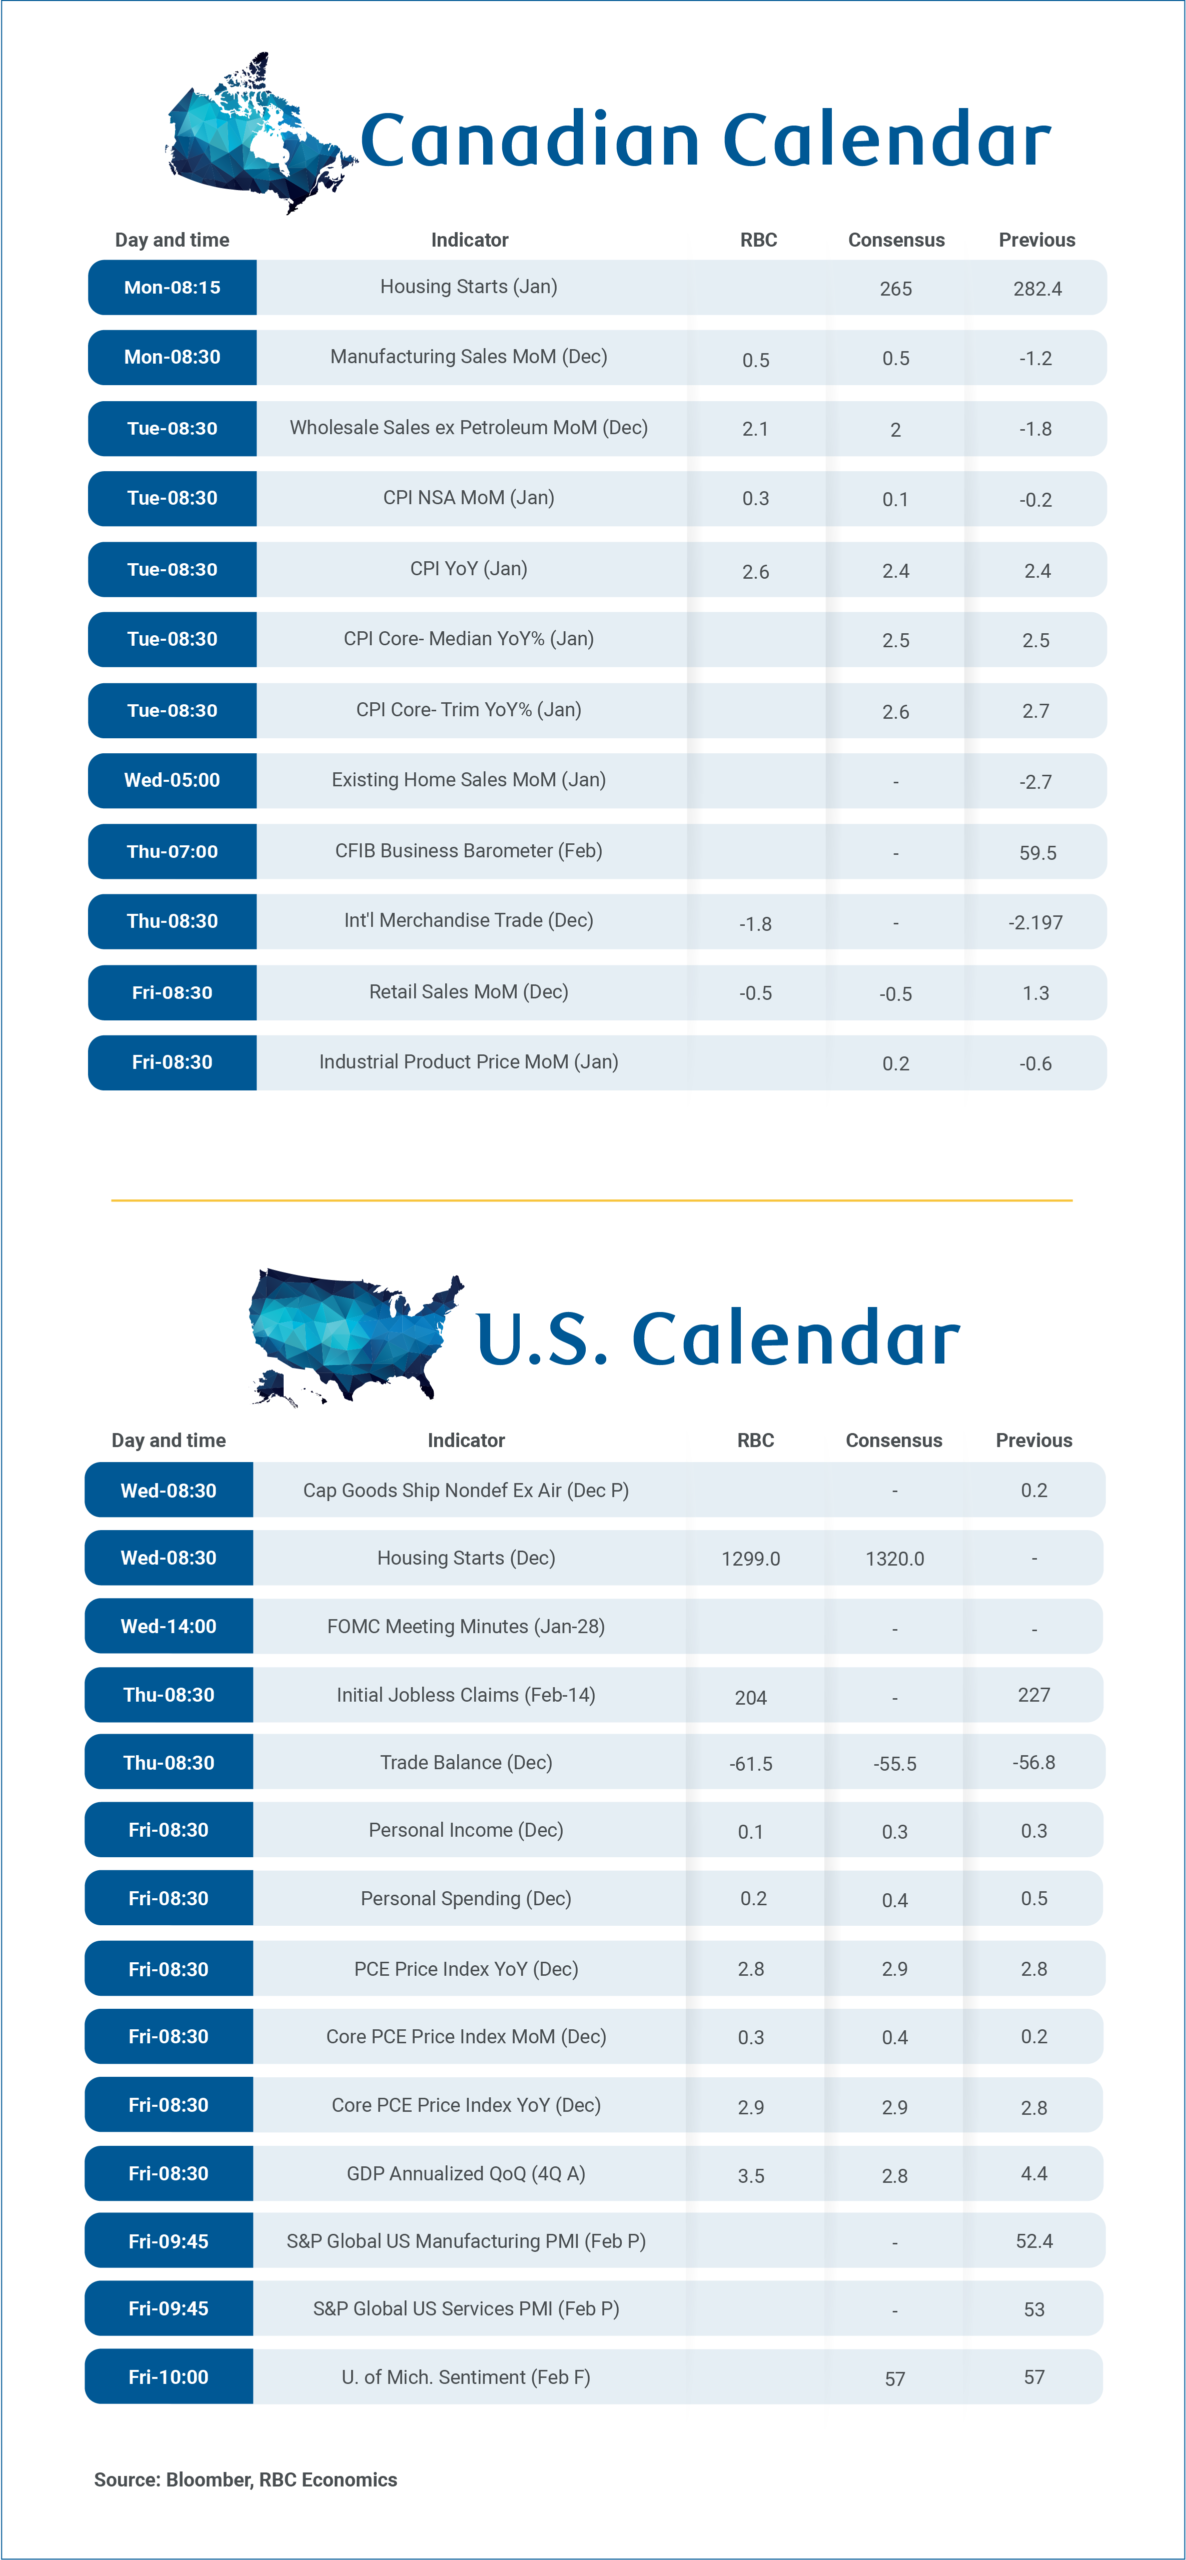
| 13:15 | CAD | Housing Starts Y/Y Jan | 265K | 282K |
| 13:30 | CAD | Manufacturing Sales M/M Dec | 0.50% | -1.20% |
| 21:30 | NZD |
| Business NZ PSI Jan | |
| Consensus | |
| Previous | 51.5 |
| 23:50 | JPY |
| GDP Q/Q Q4 P | |
| Consensus | 0.40% |
| Previous | -0.60% |
| 23:50 | JPY |
| GDP Deflator Y/Y Q4 P | |
| Consensus | 3.20% |
| Previous | 3.40% |
| 04:30 | JPY |
| Industrial Production M/M Dec F | |
| Consensus | -0.10% |
| Previous | -0.10% |
| 10:00 | EUR |
| Eurozone Industrial Production M/M Dec | |
| Consensus | -1.50% |
| Previous | 0.70% |
| 13:15 | CAD |
| Housing Starts Y/Y Jan | |
| Consensus | 265K |
| Previous | 282K |
| 13:30 | CAD |
| Manufacturing Sales M/M Dec | |
| Consensus | 0.50% |
| Previous | -1.20% |
Tuesday, Feb 17, 2026
| GMT | Ccy | Events | Cons | Prev |
|---|---|---|---|---|
| 00:30 | AUD | RBA Meeting Minutes | ||
| 04:30 | JPY | Tertiary Industry Index M/M Dec | -0.30% | -0.20% |
| 07:00 | EUR | Germany CPI M/M Jan F | 0.10% | 0.10% |
| 07:00 | EUR | Germany CPI Y/Y Jan F | 2.10% | 2.10% |
| 07:00 | GBP | Claimant Count Change Jan | 22.8K | 17.9K |
| 07:00 | GBP | ILO Unemployment Rate (3M) Dec | 5.10% | 5.10% |
| 07:00 | GBP | Average Earnings Including Bonus 3M/Y Dec | 4.60% | 4.70% |
| 07:00 | GBP | Average Earnings Excluding Bonus 3M/Y Dec | 4.20% | 4.50% |
| 10:00 | EUR | Germany ZEW Economic Sentiment Feb | 65.2 | 59.6 |
| 10:00 | EUR | Germany ZEW Current Situation Feb | -65.7 | -72.7 |
| 10:00 | EUR | Eurozone ZEW Economic Sentiment Feb | 45.2 | 40.8 |
| 13:30 | CAD | Wholesale Sales M/M Dec | 2.10% | -1.80% |
| 13:30 | CAD | CPI M/M Jan | 0.10% | -0.20% |
| 13:30 | CAD | CPI Y/Y Jan | 2.40% | 2.40% |
| 13:30 | CAD | CPI Median Y/Y Jan | 2.50% | 2.50% |
| 13:30 | CAD | CPI Trimmed Y/Y Jan | 2.60% | 2.70% |
| 13:30 | CAD | CPI Common Y/Y Jan | 2.70% | 2.80% |
| 13:30 | USD | Empire State Manufacturing Feb | 8.9 | 7.7 |
| 15:00 | USD | NAHB Housing Market Index Feb | 38 | 37 |
| 00:30 | AUD |
| RBA Meeting Minutes | |
| Consensus | |
| Previous | |
| 04:30 | JPY |
| Tertiary Industry Index M/M Dec | |
| Consensus | -0.30% |
| Previous | -0.20% |
| 07:00 | EUR |
| Germany CPI M/M Jan F | |
| Consensus | 0.10% |
| Previous | 0.10% |
| 07:00 | EUR |
| Germany CPI Y/Y Jan F | |
| Consensus | 2.10% |
| Previous | 2.10% |
| 07:00 | GBP |
| Claimant Count Change Jan | |
| Consensus | 22.8K |
| Previous | 17.9K |
| 07:00 | GBP |
| ILO Unemployment Rate (3M) Dec | |
| Consensus | 5.10% |
| Previous | 5.10% |
| 07:00 | GBP |
| Average Earnings Including Bonus 3M/Y Dec | |
| Consensus | 4.60% |
| Previous | 4.70% |
| 07:00 | GBP |
| Average Earnings Excluding Bonus 3M/Y Dec | |
| Consensus | 4.20% |
| Previous | 4.50% |
| 10:00 | EUR |
| Germany ZEW Economic Sentiment Feb | |
| Consensus | 65.2 |
| Previous | 59.6 |
| 10:00 | EUR |
| Germany ZEW Current Situation Feb | |
| Consensus | -65.7 |
| Previous | -72.7 |
| 10:00 | EUR |
| Eurozone ZEW Economic Sentiment Feb | |
| Consensus | 45.2 |
| Previous | 40.8 |
| 13:30 | CAD |
| Wholesale Sales M/M Dec | |
| Consensus | 2.10% |
| Previous | -1.80% |
| 13:30 | CAD |
| CPI M/M Jan | |
| Consensus | 0.10% |
| Previous | -0.20% |
| 13:30 | CAD |
| CPI Y/Y Jan | |
| Consensus | 2.40% |
| Previous | 2.40% |
| 13:30 | CAD |
| CPI Median Y/Y Jan | |
| Consensus | 2.50% |
| Previous | 2.50% |
| 13:30 | CAD |
| CPI Trimmed Y/Y Jan | |
| Consensus | 2.60% |
| Previous | 2.70% |
| 13:30 | CAD |
| CPI Common Y/Y Jan | |
| Consensus | 2.70% |
| Previous | 2.80% |
| 13:30 | USD |
| Empire State Manufacturing Feb | |
| Consensus | 8.9 |
| Previous | 7.7 |
| 15:00 | USD |
| NAHB Housing Market Index Feb | |
| Consensus | 38 |
| Previous | 37 |
Wednesday, Feb 18, 2026
| GMT | Ccy | Events | Cons | Prev |
|---|---|---|---|---|
| 21:45 | NZD | PPI Input Q/Q Q4 | 0.20% | |
| 21:45 | NZD | PPI Output Q/Q Q4 | 0.60% | |
| 23:50 | JPY | Trade Balance (JPY) Jan | -0.14T | -0.21T |
| 00:30 | AUD | Wage Price Index Q/Q Q4 | 0.80% | 0.80% |
| 01:00 | NZD | RBNZ Interest Rate Decision | 2.25% | 2.25% |
| 07:00 | GBP | CPI M/M Jan | -0.50% | 0.40% |
| 07:00 | GBP | CPI Y/Y Jan | 3.00% | 3.40% |
| 07:00 | GBP | Core CPI Y/Y Jan | 3.10% | 3.20% |
| 07:00 | GBP | RPI M/M Jan | -0.40% | 0.70% |
| 07:00 | GBP | RPI Y/Y Jan | 4.00% | 4.20% |
| 07:00 | GBP | PPI - Input M/M Jan | 0.40% | -0.20% |
| 07:00 | GBP | PPI - Input Y/Y Jan | 0.80% | |
| 07:00 | GBP | PPI - Output M/M Jan | 0.20% | 0.00% |
| 07:00 | GBP | PPI - Output Y/Y Jan | 3.40% | |
| 07:00 | GBP | PPI Core Output Y/Y Jan | 3.20% | |
| 07:00 | GBP | PPI Core Output M/M Jan | -0.10% | |
| 13:30 | USD | Durable Goods Orders Dec | -1.60% | 5.30% |
| 13:30 | USD | Durable Goods Orders ex Transport Dec | 0.30% | 0.50% |
| 14:15 | USD | Industrial Production M/M Jan | 0.30% | 0.40% |
| 14:15 | USD | Capacity Utilization Jan | 76.40% | 76.30% |
| 19:00 | USD | FOMC Minutes |
| 21:45 | NZD |
| PPI Input Q/Q Q4 | |
| Consensus | |
| Previous | 0.20% |
| 21:45 | NZD |
| PPI Output Q/Q Q4 | |
| Consensus | |
| Previous | 0.60% |
| 23:50 | JPY |
| Trade Balance (JPY) Jan | |
| Consensus | -0.14T |
| Previous | -0.21T |
| 00:30 | AUD |
| Wage Price Index Q/Q Q4 | |
| Consensus | 0.80% |
| Previous | 0.80% |
| 01:00 | NZD |
| RBNZ Interest Rate Decision | |
| Consensus | 2.25% |
| Previous | 2.25% |
| 07:00 | GBP |
| CPI M/M Jan | |
| Consensus | -0.50% |
| Previous | 0.40% |
| 07:00 | GBP |
| CPI Y/Y Jan | |
| Consensus | 3.00% |
| Previous | 3.40% |
| 07:00 | GBP |
| Core CPI Y/Y Jan | |
| Consensus | 3.10% |
| Previous | 3.20% |
| 07:00 | GBP |
| RPI M/M Jan | |
| Consensus | -0.40% |
| Previous | 0.70% |
| 07:00 | GBP |
| RPI Y/Y Jan | |
| Consensus | 4.00% |
| Previous | 4.20% |
| 07:00 | GBP |
| PPI - Input M/M Jan | |
| Consensus | 0.40% |
| Previous | -0.20% |
| 07:00 | GBP |
| PPI - Input Y/Y Jan | |
| Consensus | |
| Previous | 0.80% |
| 07:00 | GBP |
| PPI - Output M/M Jan | |
| Consensus | 0.20% |
| Previous | 0.00% |
| 07:00 | GBP |
| PPI - Output Y/Y Jan | |
| Consensus | |
| Previous | 3.40% |
| 07:00 | GBP |
| PPI Core Output Y/Y Jan | |
| Consensus | |
| Previous | 3.20% |
| 07:00 | GBP |
| PPI Core Output M/M Jan | |
| Consensus | |
| Previous | -0.10% |
| 13:30 | USD |
| Durable Goods Orders Dec | |
| Consensus | -1.60% |
| Previous | 5.30% |
| 13:30 | USD |
| Durable Goods Orders ex Transport Dec | |
| Consensus | 0.30% |
| Previous | 0.50% |
| 14:15 | USD |
| Industrial Production M/M Jan | |
| Consensus | 0.30% |
| Previous | 0.40% |
| 14:15 | USD |
| Capacity Utilization Jan | |
| Consensus | 76.40% |
| Previous | 76.30% |
| 19:00 | USD |
| FOMC Minutes | |
| Consensus | |
| Previous | |
Thursday, Feb 19, 2026
| GMT | Ccy | Events | Cons | Prev |
|---|---|---|---|---|
| 23:50 | JPY | Machinery Orders M/M Dec | 4.50% | -11.00% |
| 00:30 | AUD | Employment Change Jan | 20.3K | 65.2K |
| 00:30 | AUD | Unemployment Rate Jan | 4.20% | 4.10% |
| 09:00 | EUR | Eurozone Current Account (EUR) Dec | 9.2B | 8.6B |
| 09:00 | EUR | Eurozone Economic Bulletin | ||
| 13:30 | CAD | Trade Balance (CAD) Dec | -2.0B | -2.2B |
| 13:30 | CAD | New Housing Price Index M/M Jan | 0.10% | -0.20% |
| 13:30 | USD | Initial Jobless Claims (Feb 13) | 229K | 227K |
| 13:30 | USD | Trade Balance (USD) Dec | -55.5B | -56.8B |
| 13:30 | USD | Wholele Inventories Dec P | 0.20% | 0.20% |
| 13:30 | USD | Philadelphia Fed Manufacturing Feb | 7.8 | 12.6 |
| 15:00 | USD | Pending Homeles M/M Jan | 2.60% | -9.30% |
| 15:00 | EUR | Eurozone Consumer Confidence Feb P | -12 | -12 |
| 15:30 | USD | Natural Gas Storage (Feb 13) | -148B | -249B |
| 17:00 | USD | Crude Oil Inventories (Feb 13) | 1.7M | 8.5M |
| 23:50 | JPY |
| Machinery Orders M/M Dec | |
| Consensus | 4.50% |
| Previous | -11.00% |
| 00:30 | AUD |
| Employment Change Jan | |
| Consensus | 20.3K |
| Previous | 65.2K |
| 00:30 | AUD |
| Unemployment Rate Jan | |
| Consensus | 4.20% |
| Previous | 4.10% |
| 09:00 | EUR |
| Eurozone Current Account (EUR) Dec | |
| Consensus | 9.2B |
| Previous | 8.6B |
| 09:00 | EUR |
| Eurozone Economic Bulletin | |
| Consensus | |
| Previous | |
| 13:30 | CAD |
| Trade Balance (CAD) Dec | |
| Consensus | -2.0B |
| Previous | -2.2B |
| 13:30 | CAD |
| New Housing Price Index M/M Jan | |
| Consensus | 0.10% |
| Previous | -0.20% |
| 13:30 | USD |
| Initial Jobless Claims (Feb 13) | |
| Consensus | 229K |
| Previous | 227K |
| 13:30 | USD |
| Trade Balance (USD) Dec | |
| Consensus | -55.5B |
| Previous | -56.8B |
| 13:30 | USD |
| Wholele Inventories Dec P | |
| Consensus | 0.20% |
| Previous | 0.20% |
| 13:30 | USD |
| Philadelphia Fed Manufacturing Feb | |
| Consensus | 7.8 |
| Previous | 12.6 |
| 15:00 | USD |
| Pending Homeles M/M Jan | |
| Consensus | 2.60% |
| Previous | -9.30% |
| 15:00 | EUR |
| Eurozone Consumer Confidence Feb P | |
| Consensus | -12 |
| Previous | -12 |
| 15:30 | USD |
| Natural Gas Storage (Feb 13) | |
| Consensus | -148B |
| Previous | -249B |
| 17:00 | USD |
| Crude Oil Inventories (Feb 13) | |
| Consensus | 1.7M |
| Previous | 8.5M |
Friday, Feb 20, 2026
| GMT | Ccy | Events | Cons | Prev |
|---|---|---|---|---|
| 21:45 | NZD | Trade Balance (NZD) Jan | -745M | 52M |
| 22:00 | AUD | Manufacturing PMI Feb P | 52.3 | |
| 22:00 | AUD | Services PMI Feb P | 56.3 | |
| 23:30 | JPY | National CPI Y/Y Jan | 2.10% | |
| 23:30 | JPY | National CPI Core Y/Y Jan | 2.00% | 2.40% |
| 23:30 | JPY | National CPI Core-Core Y/Y Jan | 2.90% | |
| 00:30 | JPY | Manufacturing PMI Feb P | 51.5 | |
| 00:30 | JPY | Services PMI Feb P | 53.7 | |
| 07:00 | EUR | Germany PPI M/M Jan | 0.30% | -0.20% |
| 07:00 | EUR | Germany PPI Y/Y Jan | -2.10% | -2.50% |
| 07:00 | GBP | Retail Sales M/M Jan | 0.20% | 0.40% |
| 07:00 | GBP | Public Sector Net Borrowing (GBP) Jan | -24.0B | 11.6B |
| 08:15 | EUR | France Manufacturing PMI Feb P | 51.1 | 51.2 |
| 08:15 | EUR | France Services PMI Feb P | 49.1 | 48.4 |
| 08:30 | EUR | Germany Manufacturing PMI Feb P | 49.7 | 49.1 |
| 08:30 | EUR | Germany Services PMI Feb P | 52.6 | 52.4 |
| 09:00 | EUR | Eurozone Manufacturing PMI Feb P | 50.2 | 49.5 |
| 09:00 | EUR | Eurozone Services PMI Feb P | 51.8 | 51.6 |
| 09:30 | GBP | Manufacturing PMI Feb P | 51.6 | 51.8 |
| 09:30 | GBP | Services PMI Feb P | 53.8 | 54 |
| 13:30 | CAD | Retail Sales M/M Dec | -0.50% | 1.30% |
| 13:30 | CAD | Retail Sales ex Autos M/M Dec | 0.20% | 1.70% |
| 13:30 | CAD | Industrial Product Price M/M Jan | 0.20% | -0.60% |
| 13:30 | CAD | Raw Material Price Index Jan | 0.60% | 0.50% |
| 13:30 | USD | GDP Annualized Q4 P | 2.90% | 4.40% |
| 13:30 | USD | GDP Price Index Q4 P | 2.80% | 3.70% |
| 13:30 | USD | Personal Income M/M Dec | 0.30% | 0.30% |
| 13:30 | USD | Personal Spending Dec | 0.40% | 0.50% |
| 13:30 | USD | PCE Price Index M/M Dec | 0.40% | 0.20% |
| 13:30 | USD | PCE Price Index Y/Y Dec | 2.90% | 2.80% |
| 13:30 | USD | Core PCE Price Index M/M Dec | 0.40% | 0.20% |
| 13:30 | USD | Core PCE Price Index Y/Y Dec | 3.00% | 2.80% |
| 14:45 | USD | Manufacturing PMI Feb P | 52.4 | |
| 14:45 | USD | Services PMI Feb P | 52.7 | |
| 15:00 | USD | UoM Consumer Sentiment Feb F | 57.3 | 57.3 |
| 15:00 | USD | UoM 1-Yr Inflation Expectations Feb F | 3.50% | 3.50% |
| 21:45 | NZD |
| Trade Balance (NZD) Jan | |
| Consensus | -745M |
| Previous | 52M |
| 22:00 | AUD |
| Manufacturing PMI Feb P | |
| Consensus | |
| Previous | 52.3 |
| 22:00 | AUD |
| Services PMI Feb P | |
| Consensus | |
| Previous | 56.3 |
| 23:30 | JPY |
| National CPI Y/Y Jan | |
| Consensus | |
| Previous | 2.10% |
| 23:30 | JPY |
| National CPI Core Y/Y Jan | |
| Consensus | 2.00% |
| Previous | 2.40% |
| 23:30 | JPY |
| National CPI Core-Core Y/Y Jan | |
| Consensus | |
| Previous | 2.90% |
| 00:30 | JPY |
| Manufacturing PMI Feb P | |
| Consensus | |
| Previous | 51.5 |
| 00:30 | JPY |
| Services PMI Feb P | |
| Consensus | |
| Previous | 53.7 |
| 07:00 | EUR |
| Germany PPI M/M Jan | |
| Consensus | 0.30% |
| Previous | -0.20% |
| 07:00 | EUR |
| Germany PPI Y/Y Jan | |
| Consensus | -2.10% |
| Previous | -2.50% |
| 07:00 | GBP |
| Retail Sales M/M Jan | |
| Consensus | 0.20% |
| Previous | 0.40% |
| 07:00 | GBP |
| Public Sector Net Borrowing (GBP) Jan | |
| Consensus | -24.0B |
| Previous | 11.6B |
| 08:15 | EUR |
| France Manufacturing PMI Feb P | |
| Consensus | 51.1 |
| Previous | 51.2 |
| 08:15 | EUR |
| France Services PMI Feb P | |
| Consensus | 49.1 |
| Previous | 48.4 |
| 08:30 | EUR |
| Germany Manufacturing PMI Feb P | |
| Consensus | 49.7 |
| Previous | 49.1 |
| 08:30 | EUR |
| Germany Services PMI Feb P | |
| Consensus | 52.6 |
| Previous | 52.4 |
| 09:00 | EUR |
| Eurozone Manufacturing PMI Feb P | |
| Consensus | 50.2 |
| Previous | 49.5 |
| 09:00 | EUR |
| Eurozone Services PMI Feb P | |
| Consensus | 51.8 |
| Previous | 51.6 |
| 09:30 | GBP |
| Manufacturing PMI Feb P | |
| Consensus | 51.6 |
| Previous | 51.8 |
| 09:30 | GBP |
| Services PMI Feb P | |
| Consensus | 53.8 |
| Previous | 54 |
| 13:30 | CAD |
| Retail Sales M/M Dec | |
| Consensus | -0.50% |
| Previous | 1.30% |
| 13:30 | CAD |
| Retail Sales ex Autos M/M Dec | |
| Consensus | 0.20% |
| Previous | 1.70% |
| 13:30 | CAD |
| Industrial Product Price M/M Jan | |
| Consensus | 0.20% |
| Previous | -0.60% |
| 13:30 | CAD |
| Raw Material Price Index Jan | |
| Consensus | 0.60% |
| Previous | 0.50% |
| 13:30 | USD |
| GDP Annualized Q4 P | |
| Consensus | 2.90% |
| Previous | 4.40% |
| 13:30 | USD |
| GDP Price Index Q4 P | |
| Consensus | 2.80% |
| Previous | 3.70% |
| 13:30 | USD |
| Personal Income M/M Dec | |
| Consensus | 0.30% |
| Previous | 0.30% |
| 13:30 | USD |
| Personal Spending Dec | |
| Consensus | 0.40% |
| Previous | 0.50% |
| 13:30 | USD |
| PCE Price Index M/M Dec | |
| Consensus | 0.40% |
| Previous | 0.20% |
| 13:30 | USD |
| PCE Price Index Y/Y Dec | |
| Consensus | 2.90% |
| Previous | 2.80% |
| 13:30 | USD |
| Core PCE Price Index M/M Dec | |
| Consensus | 0.40% |
| Previous | 0.20% |
| 13:30 | USD |
| Core PCE Price Index Y/Y Dec | |
| Consensus | 3.00% |
| Previous | 2.80% |
| 14:45 | USD |
| Manufacturing PMI Feb P | |
| Consensus | |
| Previous | 52.4 |
| 14:45 | USD |
| Services PMI Feb P | |
| Consensus | |
| Previous | 52.7 |
| 15:00 | USD |
| UoM Consumer Sentiment Feb F | |
| Consensus | 57.3 |
| Previous | 57.3 |
| 15:00 | USD |
| UoM 1-Yr Inflation Expectations Feb F | |
| Consensus | 3.50% |
| Previous | 3.50% |
Week Ahead – Data Blitz, Fed Minutes and RBNZ Decision in the Spotlight
- US GDP and PCE inflation are main highlights, plus the Fed minutes.
- UK and Japan have busy calendars too with focus on CPI.
- Flash PMIs for February will also be doing the rounds.
- RBNZ meets, is unlikely to follow RBA’s hawkish path.
Dovish Fed bets suffer a fresh blow
The US jobs report for January, which was delayed slightly, didn’t do the dovish Fed bets any favours, as expectations of a soft print did not materialize, confounding the raft of weak job indicators seen in the prior week. Had the payrolls numbers disappointed, investors would likely be pricing in at least a 50% probability of a third 25-bps rate cut by year-end.
More significantly, outgoing Fed Chair Jerome Powell would have found himself in a somewhat awkward position, having dismissed concerns about the labour market at last month’s FOMC press conference. But Powell and his more hawkish colleagues can breathe a sigh of relief, as it seems that employment conditions improved in January, allowing the Fed to refocus on inflation, which remains uncomfortably above the 2% target.
Another packed US data agenda
Over the coming week, there will be plenty more data for the Fed to get its hands on, with a risk that total rate cut expectations for 2026 could slip below 50 basis points.
The Empire State manufacturing index will start things off on Tuesday, followed by durable goods orders, building permits, housing starts and industrial production on Wednesday. The Philly Fed’s manufacturing gauge is out on Thursday, along with pending home sales.
The main highlight, however, is Friday’s batch of stats, which include the first estimate of GDP growth in Q4 and the core PCE price index.
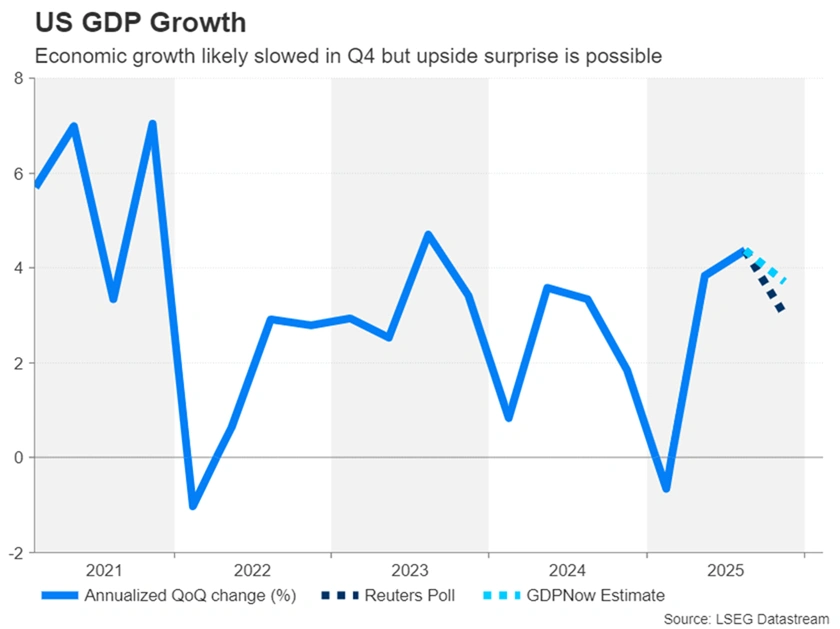
The US economy likely expanded at an annualized pace of 3.0% in the three months to December, slowing from Q3’s 4.4% pace. The Atlanta Fed’s GDPNow model puts the estimate at 3.7%, suggesting there’s a good chance of an upside surprise. A stronger reading would give the Fed hawks further ammunition to argue for a pause.
But more important will be how the PCE price indices affect the inflation picture. Both the headline and core PCE measures stood at 2.8% y/y in November. A slight moderation is possible in December, potentially reversing some of the recent unwinding of Fed rate cut bets and putting the US dollar on the backfoot again.
The personal income and spending figures will be watched too as consumption is the backbone of the American economy. Other releases on Friday include new home sales and S&P Global’s flash PMI readings for February.
Will Fed Minutes have much impact?
Aside from the data, the Fed will publish its minutes of the January policy gathering on Wednesday. The notable hawkish tilt was quite evident at this meeting, and judging from the Fedspeak since then, it’s only the usual suspects that are still pushing for immediate rate cuts, with most policymakers being comfortable to wait a bit before making up their minds on further reductions.
Nonetheless, the minutes might point to a willingness by FOMC members to put aside inflation worries in the event that the labour market sours again, and this could be positive for risk sentiment.
Yen bulls target Japanese data for more fuel
For the dollar, however, any ratcheting up of rate cut bets could be especially dangerous against the yen, as the Japanese currency is finally enjoying some buying pressure after months of being hammered in forex markets.
Prime Minister Takaichi’s landslide victory at last weekend’s snap election may have given her the green light to push through additional fiscal support measures, risking a new debt episode, but it could also have ushered in a new era of political stability in Japan, and this can be positive for a currency.
Moreover, with various senior Japanese officials repeatedly warning against excessive yen moves and the Bank of Japan sounding increasingly more hawkish, there is now talk of a ‘buy Japan’ trade. This was already demonstrated on the day of the NFP report when the dollar could only manage a short-lived spike versus the yen before drifting lower again despite the upbeat jobs data.
The yen’s rally has started to broaden against other majors and could gain further traction on Monday if the Q4 GDP estimate impresses. Japan’s economy is forecast to have grown by 0.4% q/q, recovering partially from the 0.6% contraction in Q3.
Also due over the next few days are trade figures on Wednesday, machinery orders on Thursday, and the flash February PMIs as well as the January CPI prints on Friday.
UK jobs and CPI on tap as BoE poised to cut again
The UK will not be spared by the data barrage either, as a crucial week awaits the pound. With Bank of England policymakers citing the weak labour market and sluggish growth for their dovish stance, Tuesday’s employment numbers for the three months to December will be scrutinized, particularly wage growth and the worrying uptrend in the unemployment rate.
Next up is the CPI report on Wednesday. Headline CPI disappointingly edged up to 3.4% y/y in December while the core rate held steady at 3.2% y/y. Should CPI resume its decline in January, the pound is likely to come under pressure, as rate cut bets for the next BoE meeting in March would get a lift, pushing the odds of a 25-bps reduction above the current 64%.
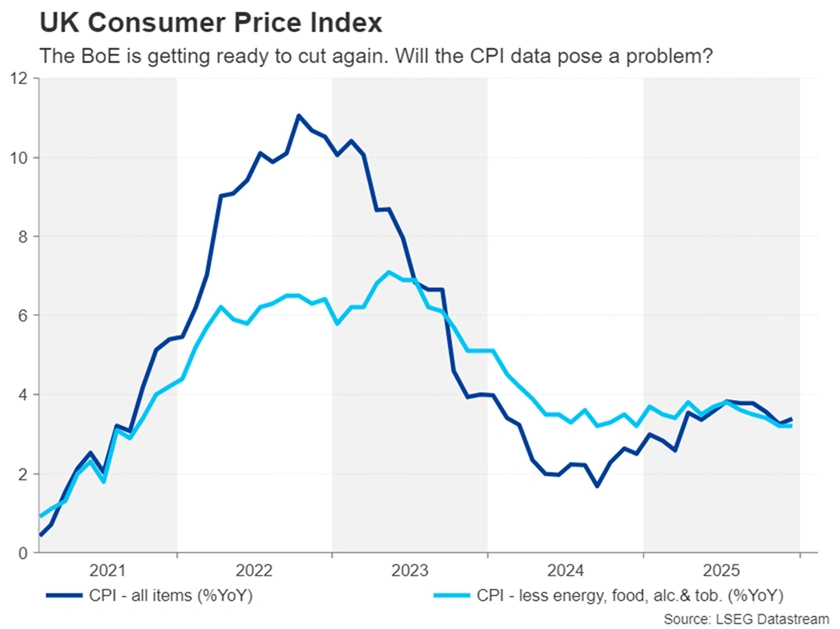
On the other hand, a surprise uptick in inflation could create a dilemma for the BoE’s less dovish MPC members.
Finally on Friday, January retail sales and the flash PMIs for February could inject some additional volatility into sterling before the week wraps up. Though, with the political storm over Prime Minister Starmer’s leadership easing for now, the downside has become more limited.
Canadian CPI may not offer any valuable insight
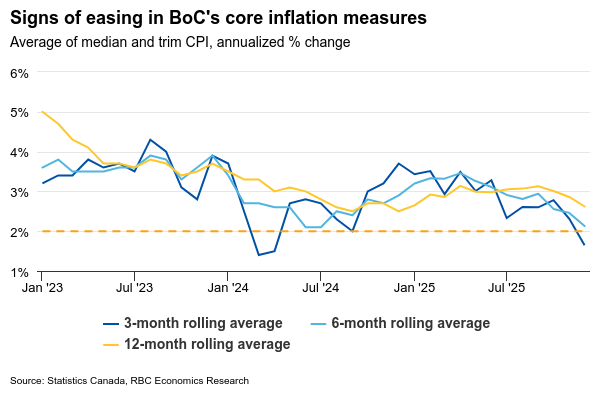
Another country that will be reporting CPI figures next week is Canada. In the minutes of its latest policy meeting published last Wednesday, the Bank of Canada acknowledged that the heightened global uncertainty is making it hard to predict the direction of interest rates.
Although the Canadian economy has been on a somewhat more solid footing lately, the BoC is concerned about the upcoming renewal of the United States-Mexico-Canada trade agreement amid President Trump’s unpredictable nature. Policymakers are also struggling to get a good read on inflation as the headline number has been inching higher in recent months but two key underlying measures have been falling.
Tuesday’s CPI readings for January are unlikely to prompt the BoC to unpause at its next meeting but may nevertheless help to clear some of the fog. Still, the Canadian dollar will probably be paying more attention to what’s happening to Fed expectations as well as to any fresh remarks by Trump on the country.
A not-so-exciting week for the Euro
In the euro area, the flash February PMIs are the main focal point for the single currency. Although the euro’s recent surge against the dollar has cooled, a revisit of the $1.20 territory remains on the cards as long as the Eurozone economy maintains its moderate but steady pace of growth and Fed rate cut bets aren’t scaled back beyond 50 bps.
The Eurozone’s composite PMI is forecast to have risen slightly in February. However, the spike in tensions between the EU and US over Greenland may have cast a shadow over business confidence in the early parts of the month, posing a downside risk.
Germany’s ZEW survey due Tuesday may also shed some light on business sentiment. But for euro/dollar, traders will probably be taking their cues from dollar developments.
Aussie hoping for jobs lift
In Asia, the impressive rally in equity markets has stumbled ahead of the long Lunar New Year holiday and could struggle further next week when liquidity is expected to be thin, as Chinese markets will be closed.
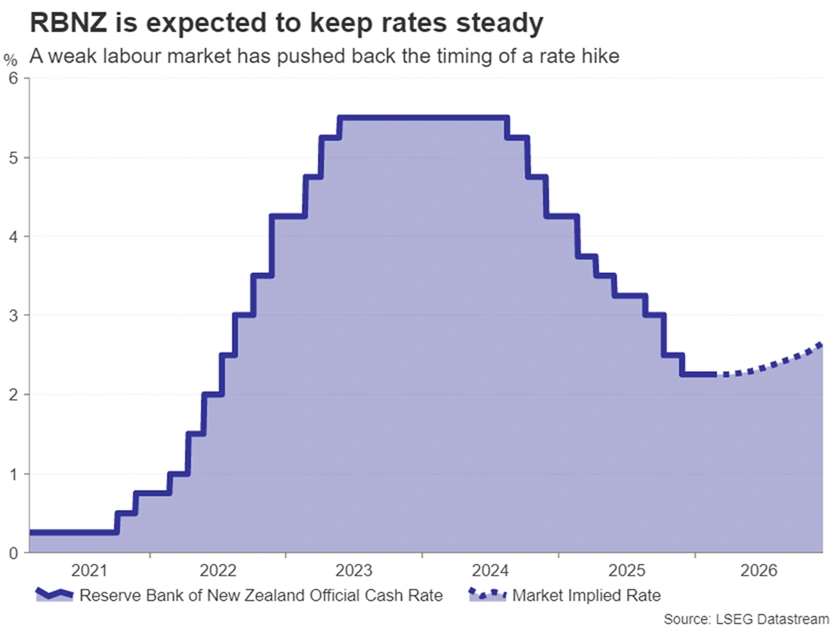
However, it may not necessarily be particularly quiet for the antipodean currencies as key jobs numbers are due on Thursday in Australia, while the Reserve Bank of New Zealand will announce its first interest rate decision of 2026 on Wednesday.
The Australian economy is showing early signs of overheating, prompting the Reserve Bank of Australia to become the first major central bank to revert back to a hiking cycle post pandemic. Moreover, RBA policymakers continue to beat the hawkish drums and Tuesday’s minutes of the February policy meeting will likely stress the upside threats to inflation.
Yet, investors see only about a 20% probability of a back-to-back rate increase at the May meeting. If the employment report for January reinforces the view of a strengthening jobs market, those odds could rise further, adding more bullish wind to the aussie’s sails. A day earlier, wage figures for Q4 will also be watched.
RBNZ to stay on hold
Interestingly, it wasn’t so long ago that the RBNZ was leading the race to hike rates first. But the recovery in New Zealand’s labour market has been slow and despite positive jobs growth in Q4, the unemployment rate hit a decade high of 5.4%.
Subsequently, investors don’t see a significant prospect of a rate hike before the autumn and the RBNZ is almost certain to keep policy unchanged on Wednesday. The New Zealand dollar, however, might still be subject to some swings if the RBNZ adopts a strong dovish or hawkish bias. The latter could even help the kiwi break the strong resistance in the $0.6075 area.
Data Dump to Give Clarity on Canada’s Growth and Inflation Backdrop
A packed Canadian economic release calendar in the coming week should reveal a partial recovery in auto production, a slightly narrower trade deficit in December, and further evidence that underlying inflation remains above the Bank of Canada’s 2% target despite edging lower.
International trade, manufacturing and wholesale sales reports should reinforce that some heavily trade exposed subsectors of the economy are still being significantly impacted by U.S. tariffs. But a sharp 20% drop in motor vehicle production in November—driven, at least, in part by semiconductor shortages—partially reversed seasonally adjusted in December. Advance estimates from Statistics Canada showed manufacturing sales up 0.5%, and wholesales 2.1% higher after falling in November.
Canadian exports tracking lower for 2025
The tick up in in motor vehicle production should also partially retrace November’s 11.6% drop in motor vehicle and parts exports. However, exports outside of autos likely remained depressed. Declining oil prices weighed on energy exports, and a surge in metal exports from November may also have partially reversed in December.
We look for the Canadian merchandise trade deficit on Thursday to narrow slightly to -$1.8 billion from -$2.2 billion in November.
Overall, 2025 proved exceptionally volatile for trade flows with U.S. inventory builds boosting exports earlier in the year before falling after tariffs took effect. For the full year, Canadian goods’ exports are tracking lower by approximately 2.5% from 2024.
Food prices and tax distortions to drive inflation higher
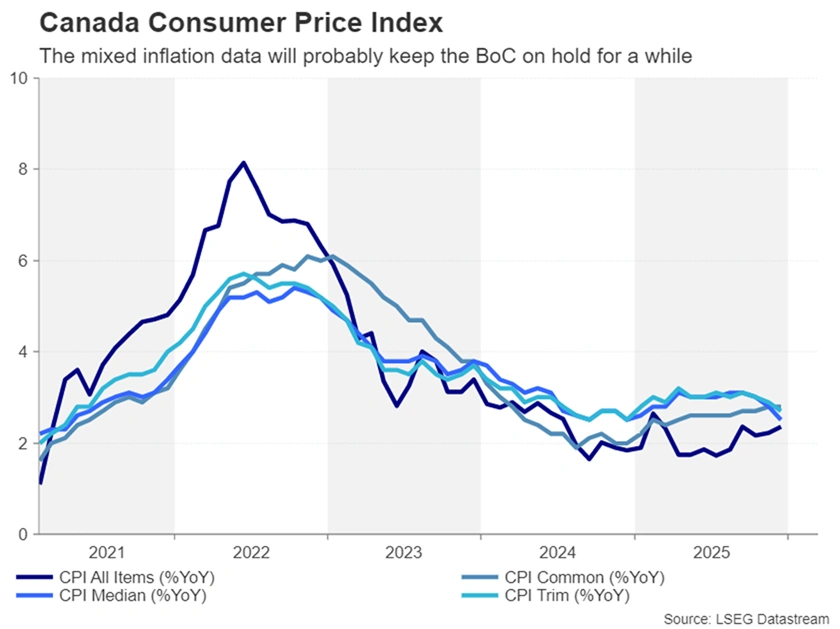
Tuesday’s Consumer Price Index report for January should show a tick higher in Canadian headline inflation to 2.6%, largely due to tax-related distortions — the prior year’s GST/HST holiday was not repeated this year – alongside still elevated grocery price growth.
Food price growth could spike above 7%, driven by rising restaurant costs compared to tax-exempt levels a year ago. But, grocery store price growth also likely remained high after hitting 5% in November. Energy prices, meanwhile, are tracking 11% below a year ago with gasoline down 17%—roughly half attributable to the removal of the carbon tax.
The BoC has limited control over global commodity trends affecting energy and food prices. The central bank will continue monitoring broader underlying price growth measures more closely. Median and trim CPI measures, which exclude indirect tax impacts, are expected to hold around 2.5% year-over-year—and have been gradually edging lower—but remain above the 2% target.
Weekly Focus – US Job Market Finally Recovers
After a long period of softness, the US labour market finally responded to the stronger growth seen in the second half of 2025, where GDP growth averaged 4.1% annualised. The labour market report showed a gain of 130k jobs in January, the strongest monthly rise in more than a year and the unemployment rate dropped from 4.4% to 4.3%. It lowers the probability of a rate cut from the Fed already in March.
It was not all good news in the US the past week, though. Benchmark revisions to the employment level showed a downward revision of around 900k in 2025 and although it was expected, it underlines that job growth has been much weaker in 2025 compared to previous years. It highlights the rising structural headwind from labour supply but also indicates that productivity growth has been strengthening. Retail sales for December showed a decline of 0.1% m/m in the core measure vs expectations of a 0.4% m/m increase and November was revised lower as well pointing a slower trend in consumption. We do see ebbs and flows in consumption growth, so it is too early to get concerned. We do expect some slowdown in consumption growth on the back of lower wage gains and softer employment growth, which lowers household income growth and thus spending power.
It was a quiet week in the Euro zone but a small lift to the Sentix survey added to signs that manufacturing growth is recovering again after a short soft patch. A sharp rise in German factory orders and rising metal prices also point to stronger manufacturing.
The Japanese election last weekend gave a landslide victory to LDP's prime minister Sanae Takaichi. She pursues a more expansionary fiscal agenda, and her win has driven new gains in Japanese stocks. The reaction has been more muted in the JPY and the bond market, partly because her win was widely anticipated and some profit taking took place in short JPY and bond positions.
In China, the main story was reports saying the financial regulator had told banks to reduce US treasury holdings. It was not confirmed officially, though, and we doubt China is about to sell US treasuries on a wider scale. However, they may lower purchases of long bonds and not refinance existing debt leading to a lower share of treasuries on their balance sheets. Chinese CPI inflation was lower than expected falling from 0.8%y/y to 0.2% y/y However, the data is distorted by timing of the Chinese New Year, which falls in February this year instead of January. More interesting was PPI data, which showed the fourth m/m increase in a row indicating that deflationary pressures are easing.
Financial markets were pretty quiet the past week with stock markets treading water, while bond yields have moved slightly lower despite the stronger US employment report. In oil markets, all eyes are on US-Iran talks and whether they will be able to make a deal to avert a US military intervention. As of today, Polymarket puts a 43% probability on a strike by June.
Next week focus turns to Flash PMIs in the US, euro zone and Japan. German ZEW, euro wage growth and Japanese CPI will also be scrutinized.