Sample Category Title
China’s Weak Foreign Trade Spurs Further Yuan Weakening
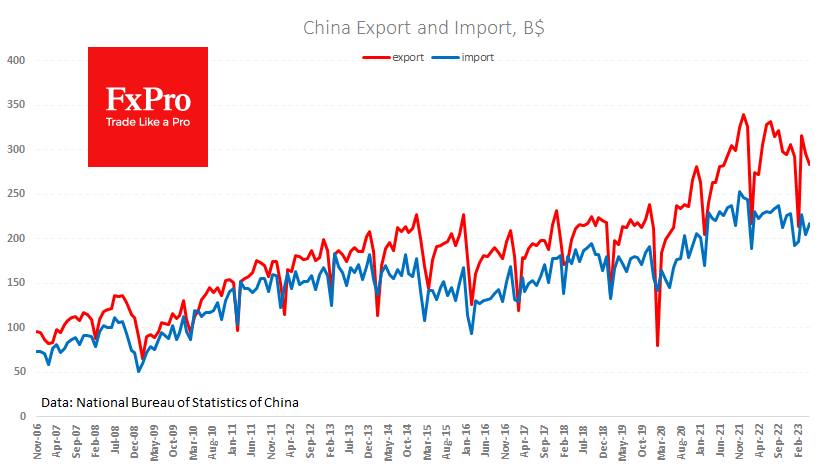
Further signs of a slowdown in China came from the trade balance. The foreign trade data published in the morning was noticeably weaker than expected.
Dollar-denominated exports fell by 7.5% YoY despite a more than 4.5% weakening of the Chinese yuan against the dollar during this time.
Imports fell by 4.5% y/y, declining against the previous year for nine of the last ten months.
The trade surplus narrowed in May to $65.8bn against expectations of $95bn, a sharp dip instead of an uptrend.
After this report, it is unsurprising that the People’s Bank of China had urged state banks to lower interest rates to stimulate domestic demand earlier in the day. Given the shallow inflation (starkly contrasting to most of the world), there is still plenty of room for stimulus.
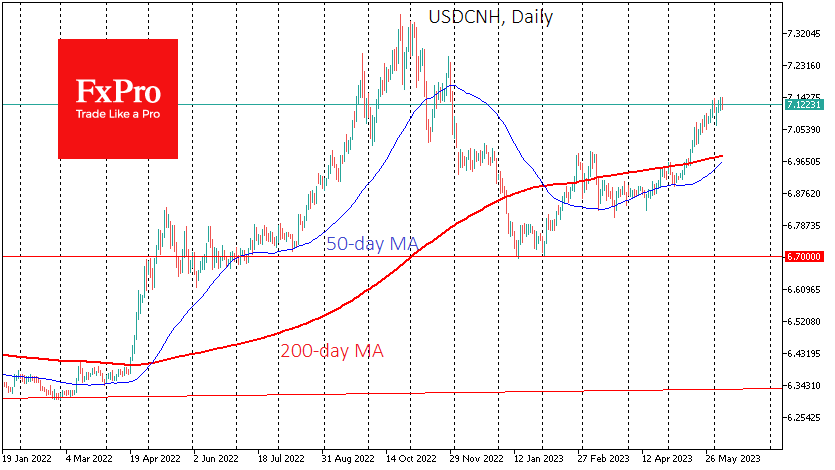
A separate trend is the renminbi, which has been retreating methodically against the dollar for the last eight weeks, roughly following the trend of last year and leaving the renminbi 7% below levels from a year ago.
If the authorities maintain the gradual weakening of their currency, this could support the competitiveness of Chinese exports. However, if no improvement in export dynamics is visible, further pressure on the renminbi should be expected. If the PBC tries to maintain a 7% weakening of the renminbi against the level of a year earlier, the USDCNH could rise to 7.8 in October.
AUD/USD Rises to 1-month High, Shrugs Off Soft GDP
- AUD/USD powers to 1-month high
- Australian GDP dips to 0.2%
- RBA expected to deliver more rate hikes
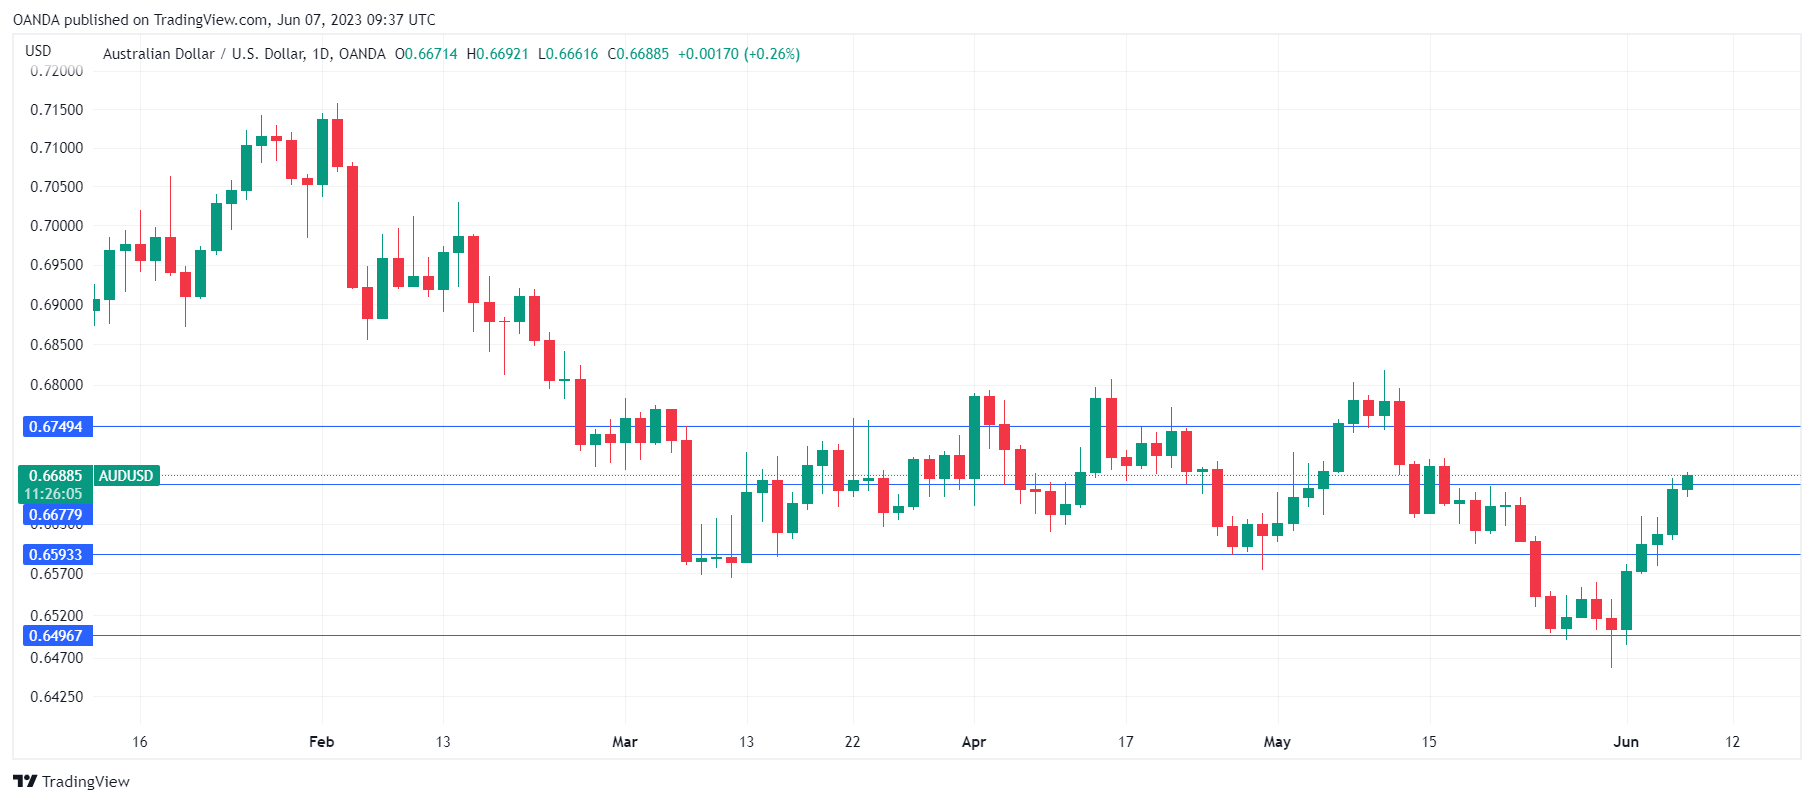
The Australian dollar has extended its rally on Wednesday. AUD/USD is trading at 0.6689, up 0.28%. Today’s weak GDP report and soft Chinese trade data haven’t spoiled the party, as the Australian dollar is up 1.2% this week.
Australian GDP slips
Australia’s GDP slowed to 0.2% in the first quarter, down from 0.6% in Q4 2022 and missing the consensus of 0.3%. On an annual basis, GDP fell to 2.3%, following a 2.7% gain in Q4 2022 and shy of the consensus of 2.4%.
The economy is cooling down, and that really shouldn’t come as a surprise. The cost of living crisis, rising interest rates and weaker demand have taken a bite out of economic activity. China’s reopening has faltered, as May trade data showed a decline in exports and imports. This is bad news for Australian exporters, as their largest market is China.
The GDP report was released just hours after the RBA announced a 25-basis point rate hike. The RBA has surprised the markets with two straight rate hikes as it wages a relentless war against inflation, which isn’t coming down fast enough for the central bank. Governor Lowe reiterated after the decision that the RBA would do whatever it takes to bring inflation back down to its 2-3% target, from the current 7%.
Core inflation has been stickier than expected and that means that more rate hikes can be expected. The cash rate is currently at 4.10% and the RBA has looked at different scenarios in which the cash rate peaked at 4.8%. The RBA may not actually move to that level, as the danger of a recession would be high, but there’s little doubt that more rate hikes are on the way.
AUD/USD Technical
- AUD/USD is testing resistance at 0.6677. Above, there is resistance at 0.6749
- There is support at 0.6568 and 0.6496
EURCAD Heads Towards Its Winter Lows
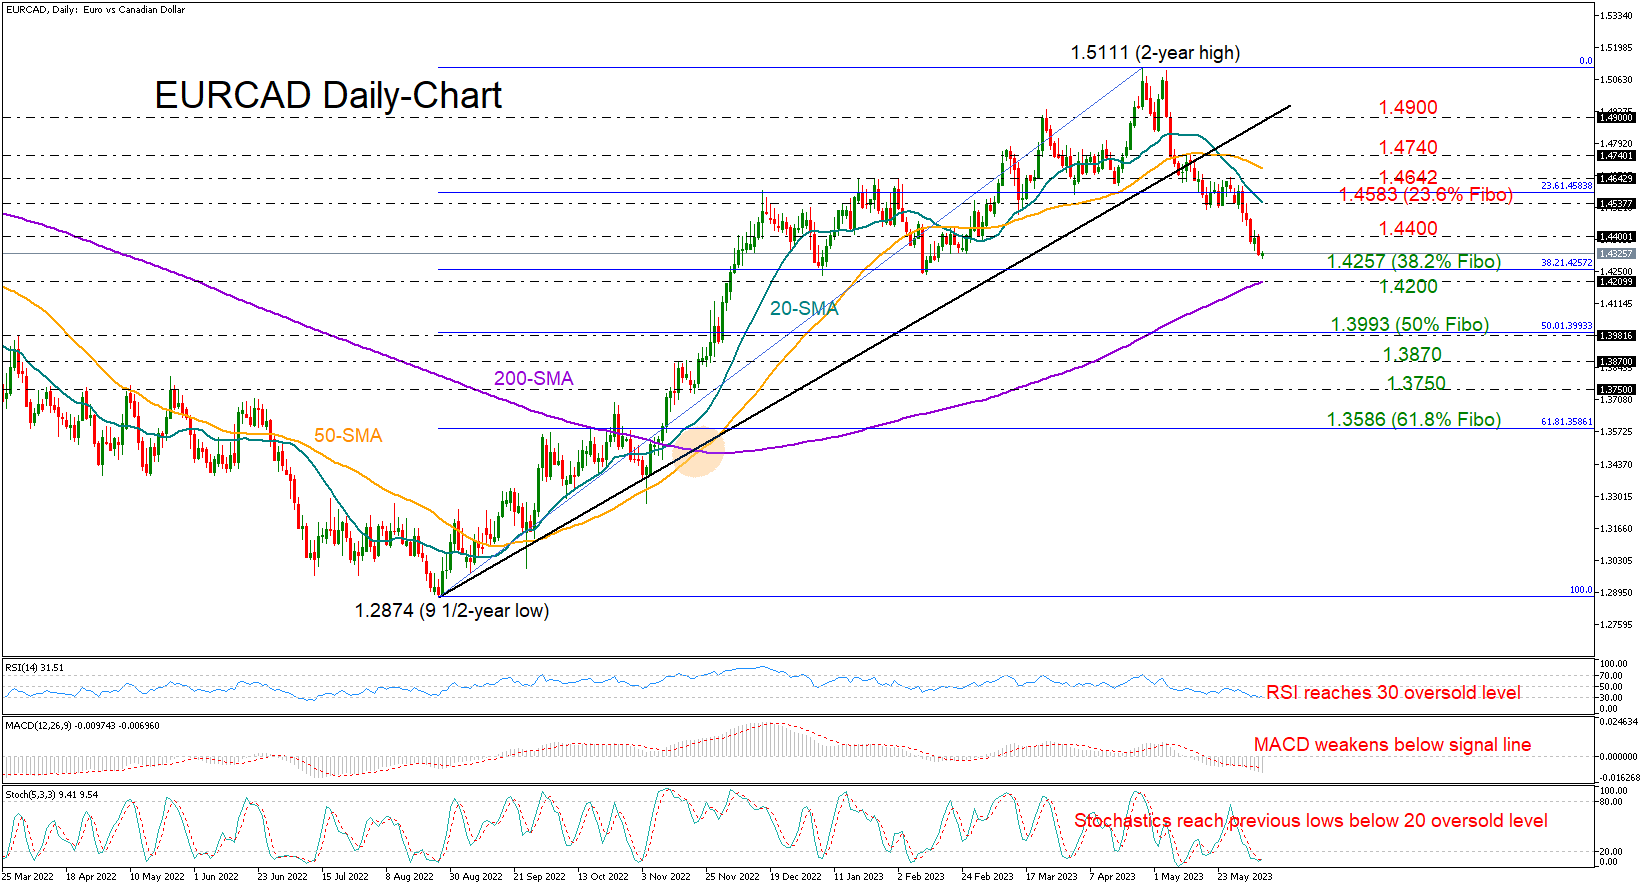
EURCAD is marking its sixth week of losses, falling by more than 4.0% since creating a bearish double top structure around a two-year high of 1.5111.
The pair is currently eyeing the key base of 1.4257, where the price pivoted higher in January and February. The 38.2% Fibonacci retracement of the previous upleg is also making this area important to watch ahead of the BoC rate decision due today at 14:00 GMT. It's worthy to note that the 200-day simple moving average is in short distance too.
A continuation below the 1.4200 round level could develop into a sharp sell-off that might last till the 50% Fibonacci level of 1.3993. The constraining zone of 1.3870 could be the next destination if the bears stay in power.
Conversely, a close above this week’s resistance of 1.4400 could navigate the price towards the 20-day simple moving average (SMA). Some congestion could also occur nearby, between the 23.6% Fibonacci of 1.4583 and the 1.4642 barricade, where the 50-day SMA is converging. If the latter proves easy to pierce through, with the price breaching the 1.4740 handle too, the recovery could expand towards the broken ascending trendline seen around 1.4900.
All in all, EURCAD is still in bearish territory, though with the pair approaching a familiar support zone and the technical picture sending oversold signals, an upside correction cannot be ruled out.
Silver Back Inside Its Early 2023 Rectangle
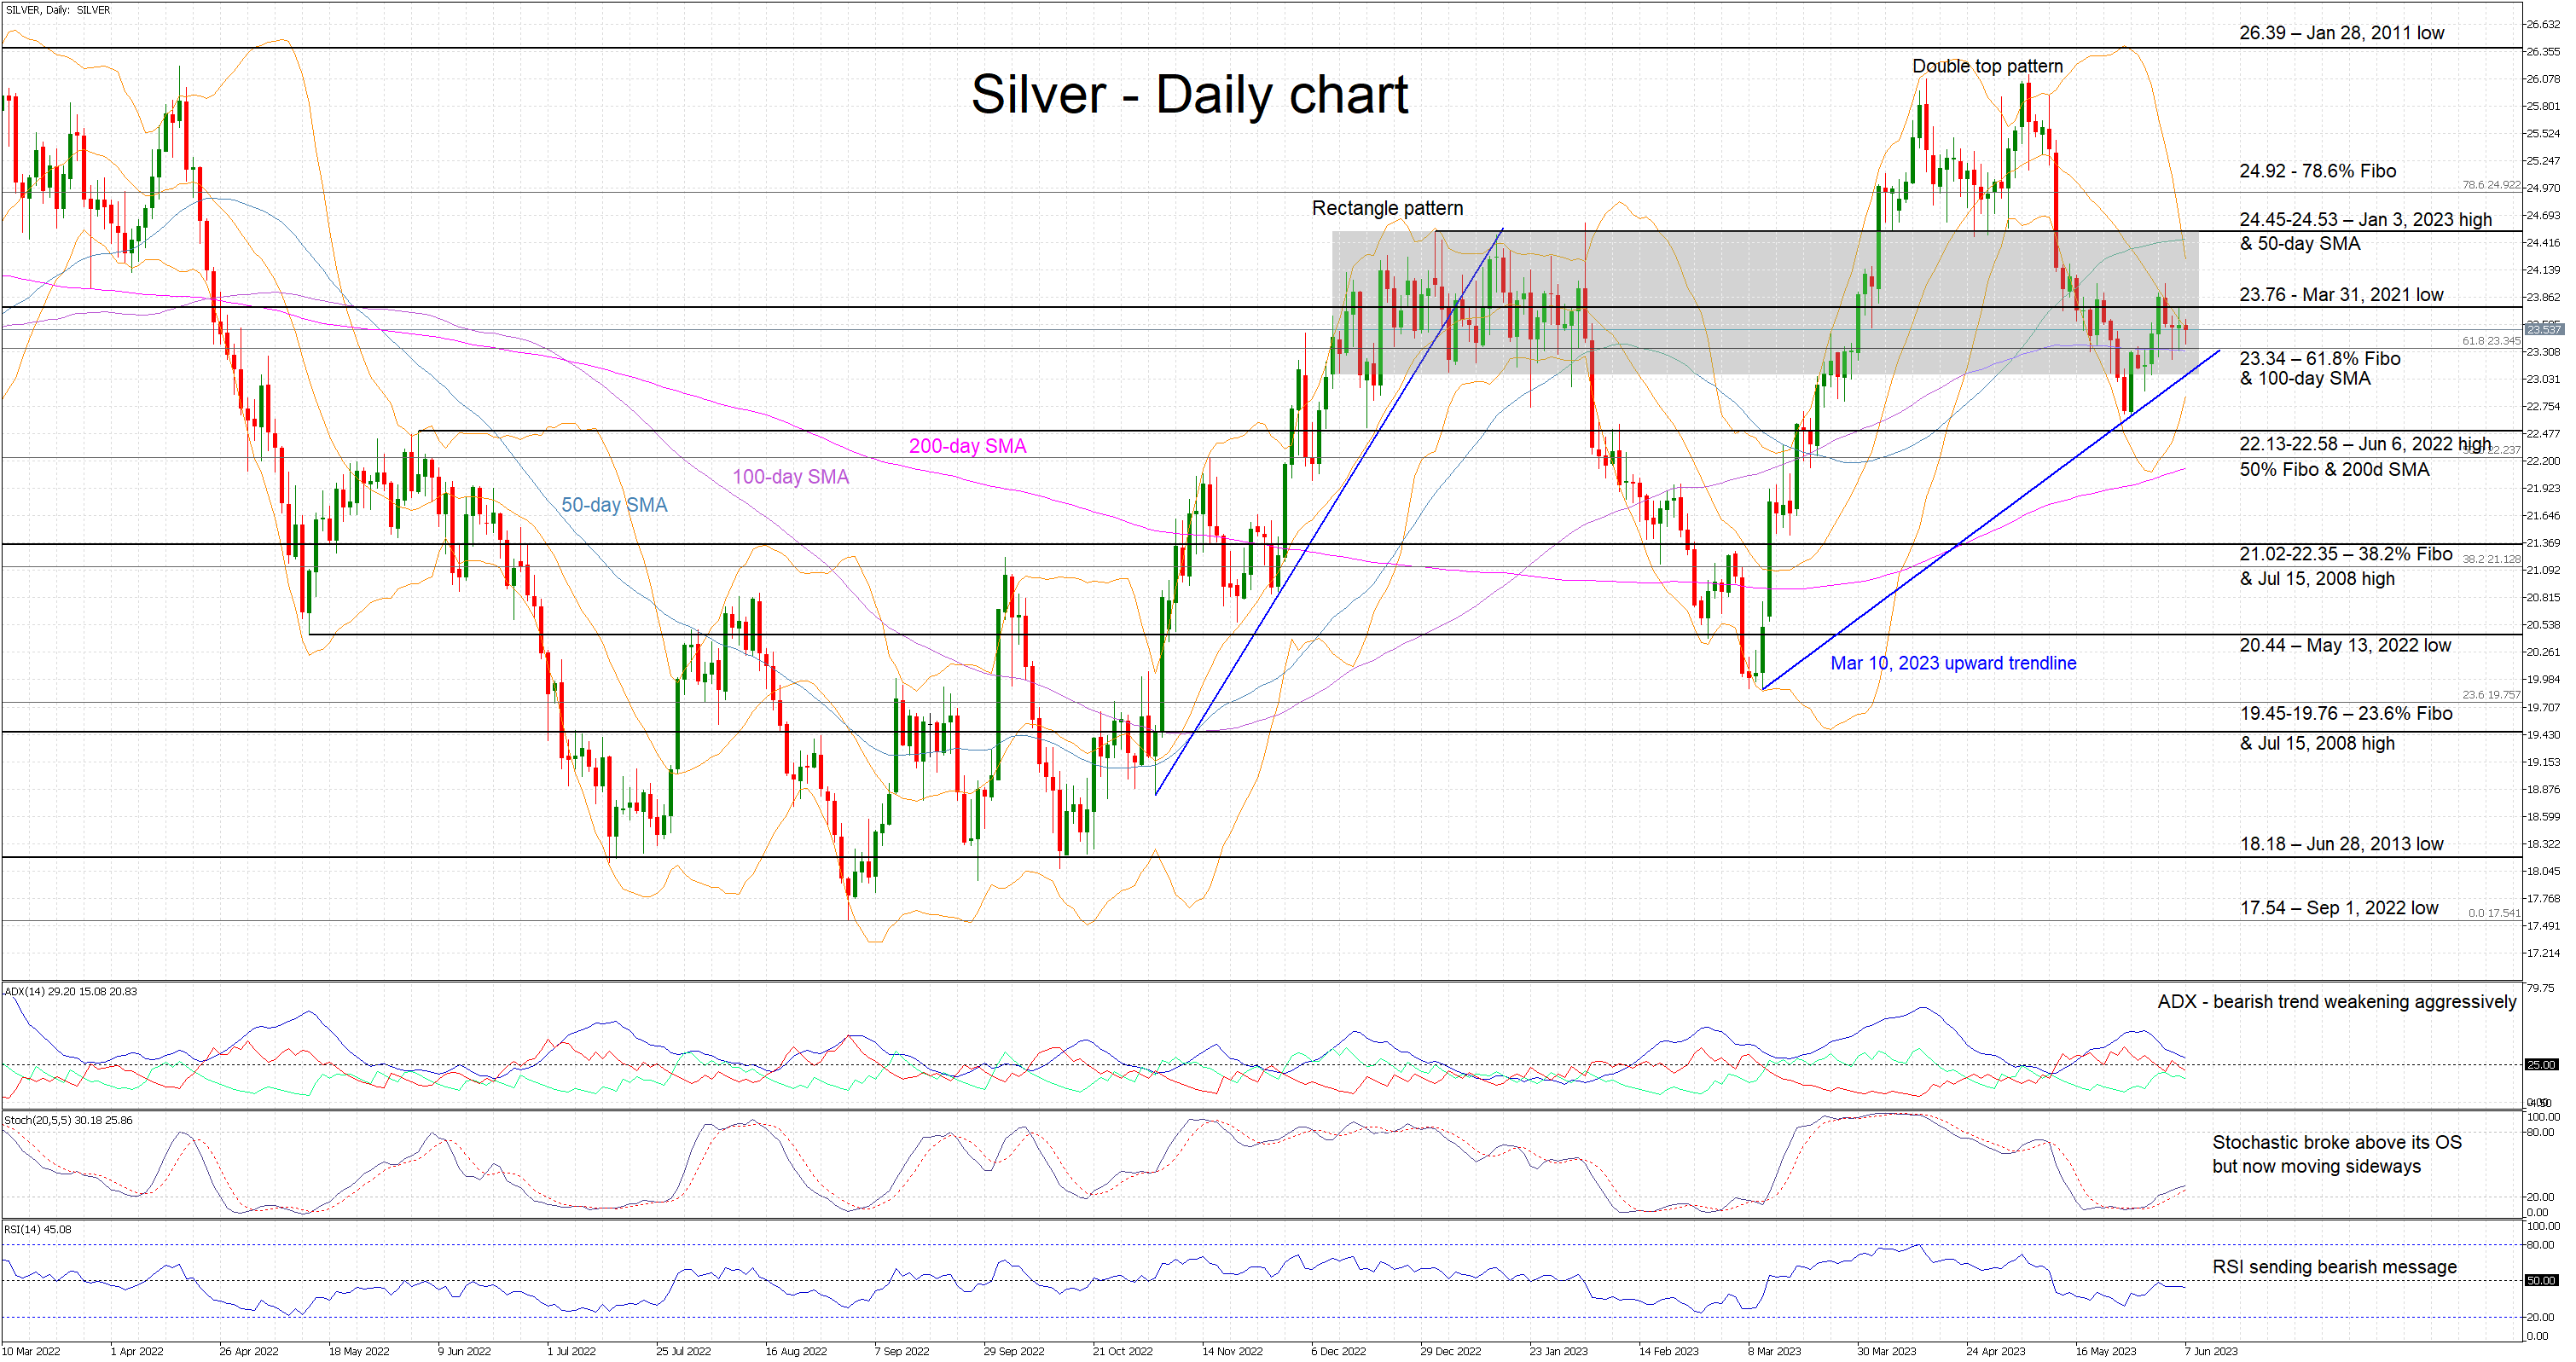
Silver is edging lower today as market participants weigh their options after the sizeable correction. The recent double top pattern achieved its theoretical target of 22.90 and thus does not appear to exert bearish pressure anymore. Silver has actually returned inside its December 2022-February 2023 rectangle, hence pointing to a range-trading phase.
The bears are keen on another sell-off, but the momentum indicators are sending a very mixed signal at this stage. The Average Directional Movement Index (ADX) is slightly above its 25-threshold and pointing to a weakening bearish trend. The RSI is hovering below its 50-midpoint and the stochastic oscillator is trading sideways, a tad above its oversold territory. In addition, the relative tightening of the Bollinger bands could be seen as an extra sign of the potential consolidation inside the aforementioned rectangle.
Amidst this environment, the bears appear to be targeting the 23.34 level populated by the 61.8% Fibonacci retracement of March 8, 2022 – September 1, 2022 downtrend and the 100-day simple moving average (SMA) respectively. Should they manage to break this level, they would then come up against the busy 22.13-22.58 area. This range is defined by the June 6, 2022 high, the 50% Fibonacci retracement and the 200-day SMA.
On the other hand, the bulls are anxiously trying to recover part of their recent losses. A successful break for the key 23.76 level would potentially help them build some momentum as they set their eyes on the 24.45-24.53 range. This is important from a short-term perspective as it is also the upper boundary of the recent rectangle. A decisive break could be a significant win for the bulls as they would then aim for the 78.6% Fibonacci retracement at 24.92.
To conclude, silver bears enjoyed the impressive decline, but they now have to fight even harder to maintain these gains, with 23.76 being the first key level.
USDJPY Eases After Hitting Upper Limit of Ascending Channel
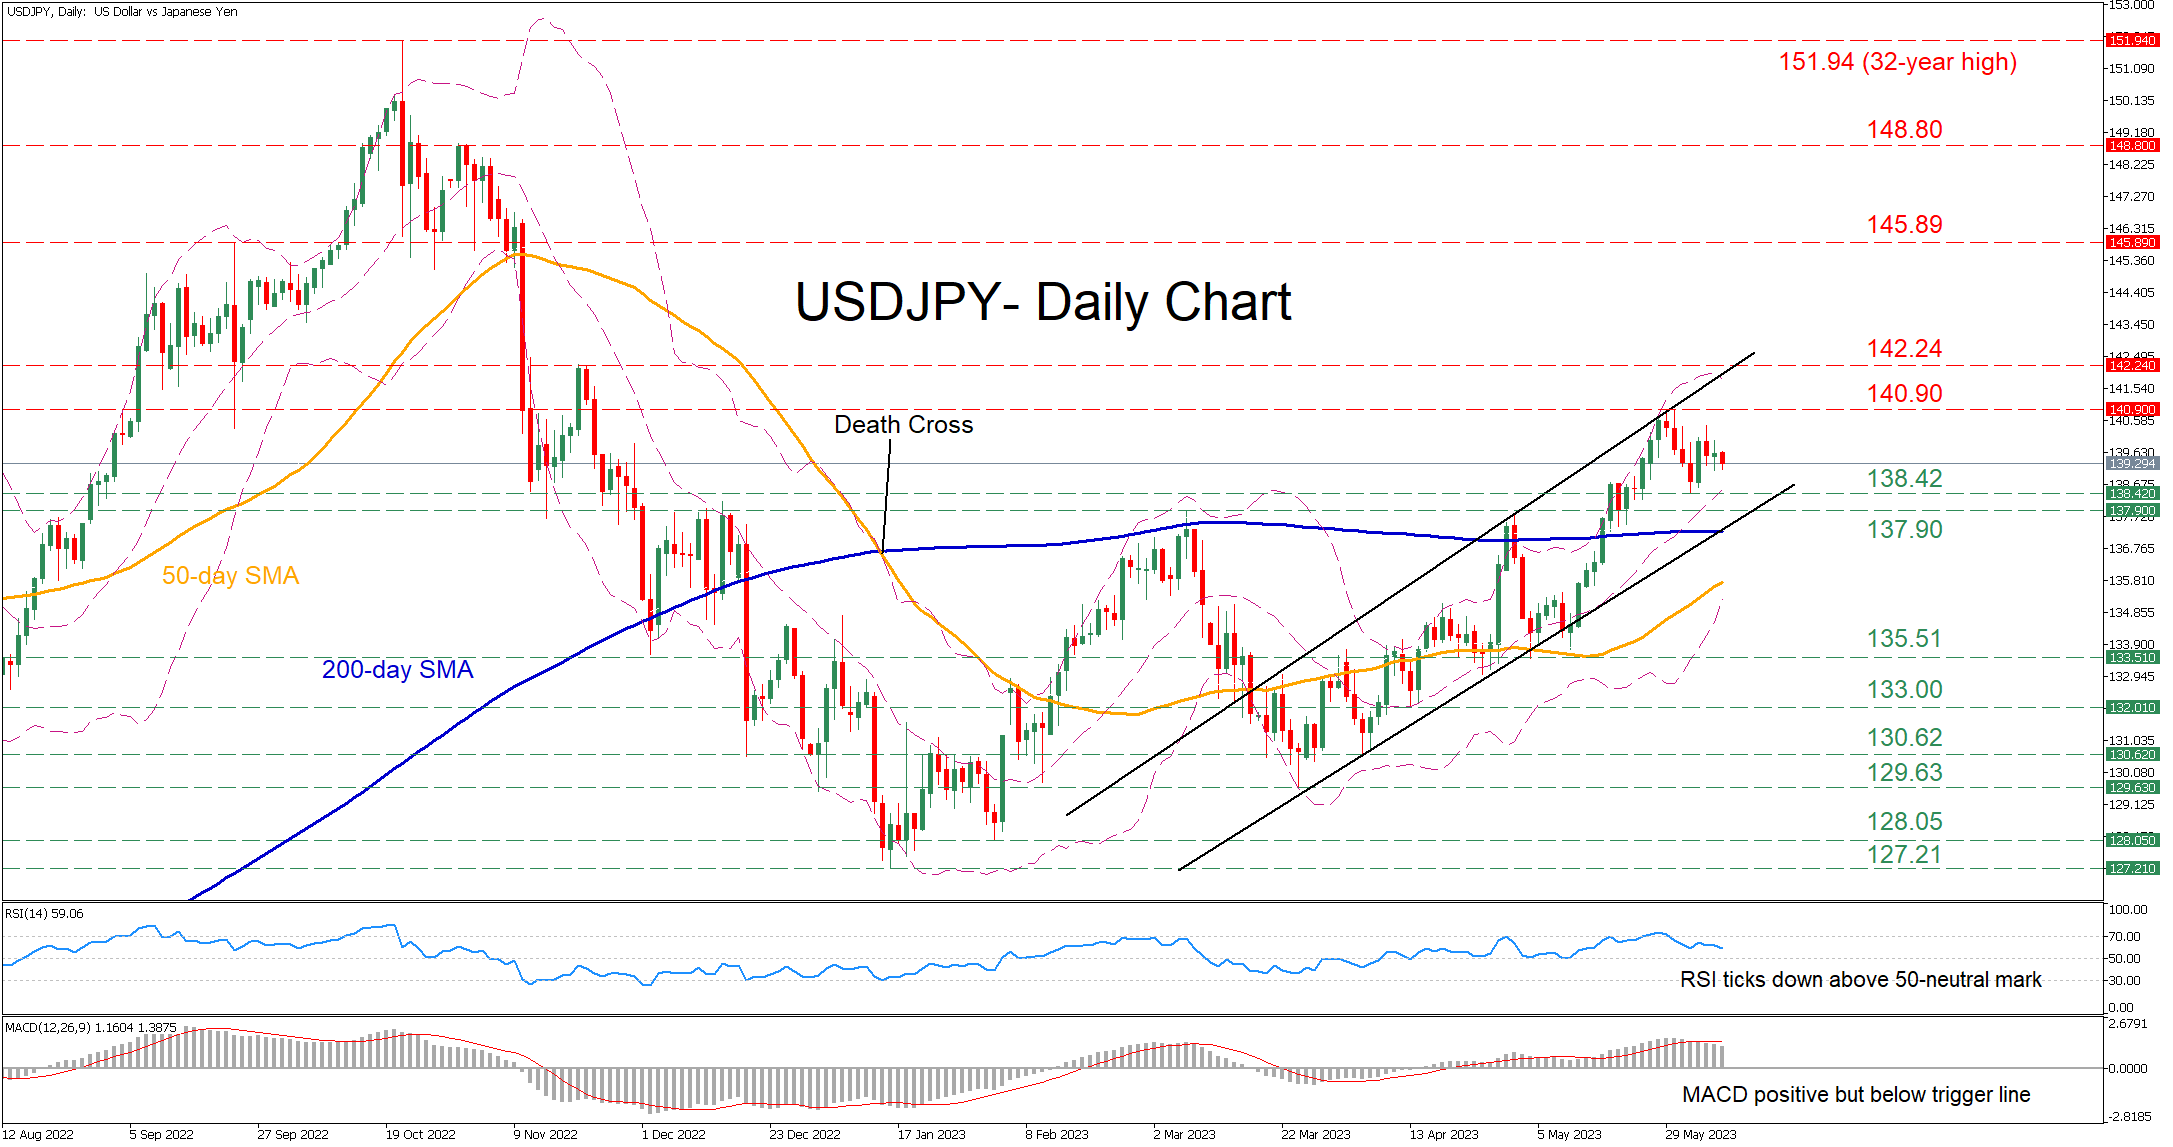
USDJPY has been trading within an upward sloping channel since mid-March, crossing above crucial technical levels and posting consecutive higher highs. However, the pair has been trading sideways in the past few sessions after its advance got rejected in the upper end of the bullish pattern.
The momentum indicators currently suggest that buying forces are subsiding. Specifically, the RSI is ticking downwards but remains above its 50-neutral mark, while the MACD dropped beneath its red signal line in the positive territory.
Should buyers try to push the price higher, initial resistance could be met at the six-month high of 140.90. Violating that zone, the pair could ascend towards the November 2022 resistance of 142.24 or higher to test the September peak of 145.89. Failing to halt there, the 148.80 hurdle could cap the pair’s upside.
Alternatively, should the uptrend lose steam and the price reverse lower, the recent support of 138.42 could act as the first line of defense. If that floor collapses, the bears might aim for the March high of 137.90 before the spotlight turns to 135.31. Further declines could then cease at the 133.00 support territory.
Overall, USDJPY seems to be experiencing a consolidation period after its latest advance got rejected, but the pair remains stuck within its medium-term ascending channel. Therefore, unless the bullish pattern gets violated to the downside, the uptrend will most likely resume.
Is EURJPY Losing its Shine?
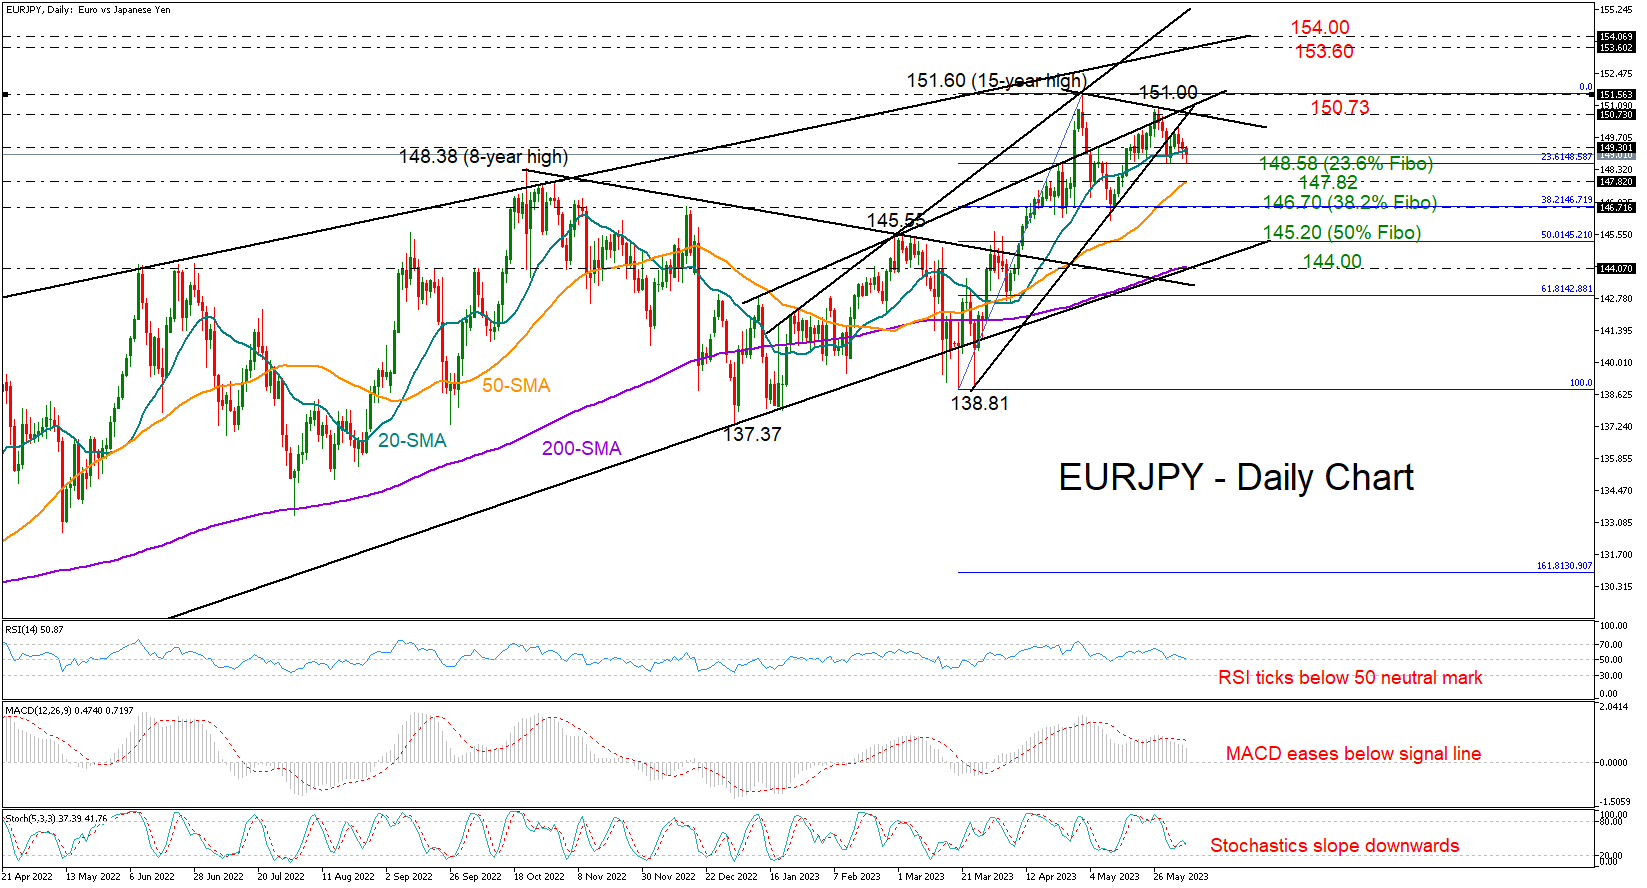
EURJPY has been declining over the past three days, stopping at the 148.58 zone that has been preventing upside and downside movements since April. The 23.6% Fibonacci retracement of the 138.81-151.60 upleg is adding extra credibility to the region.
Spring’s upward structure seems to be cracking given the lower high of 151.00 that preceded the latest bearish correction. That said, the rising simple moving averages (SMAs) have yet to reflect a weakening trend.
Meanwhile, the momentum indicators remain negatively charged, with the RSI set to enter the bearish region below its 50 neutral mark. That might be a warning sign that selling appetite could persist in the coming sessions. Yet, traders might wisely wait for a clear close below 148.58, and perhaps beneath the 50-day SMA at 147.82, before targeting the 38.2% Fibonacci level of 146.70. Another step lower would downgrade the short- and medium-term picture, likely activating a quick downfall towards the 50% Fibonacci mark of 145.20.
Should the bulls lift the price back above the 20-day SMA, they may initially get congested within the 150.73-151.60 region, where a couple of trendlines are located. Surpassing that wall, the positive trend could continue towards the long-term resistance line from August 2020 at 153.60.
In a nutshell, EURJPY seems to be losing its shine as the upward pattern in the price has started to lean on the downside. A step below 148.58, and more notably a close beneath 147.82, could activate fresh selling orders.
USD/JPY: Near-Term Bias Remains Negative Below 140
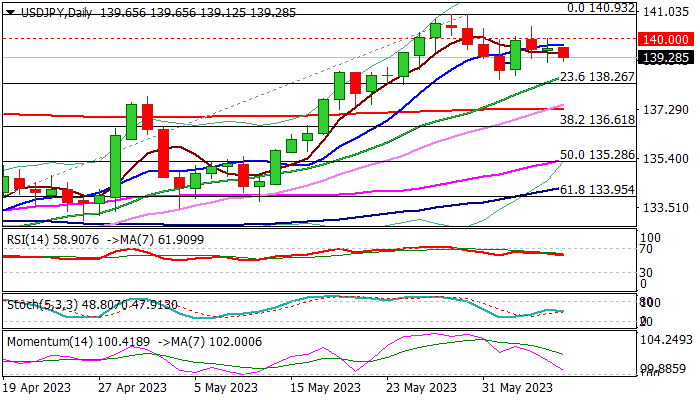
The USDJPY edges lower on Wednesday, keeping negative bias below psychological 140 barrier, after repeated failure to clear this level in past three days.
Overall picture is still bullish but weakening, as falling 14-d momentum is approaching the border of negative territory and RSI / Stochastic are heading south.
Break of pivotal supports at 138.54/26 zone (rising 20DMA / June 1 trough / Fibo 23.6% of 129.64/140.93 rally) is needed to generate strong bearish signal (also to complete a daily failure swing pattern) for extension of pullback from 2023 high at 140.93.
Conversely, prolonged sideways mode could be expected while the price stays above 138.26 pivot, though the action will remain bearishly aligned as long as 140 barrier caps.
Res: 139.73; 140.00; 140.93; 142.25.
Sup: 138.54; 138.26; 137.77; 137.29.
Cryptocurrencies Struggle to Stay Afloat
Market picture
The cryptocurrency market is up 2.7% to $1.121 trillion, approaching the middle of its trading range for the past month. Strong growth momentum late on Tuesday allowed for a brief recovery of capitalisation lost after news of SEC actions against Binance and Coinbase.
Bitcoin has risen 4% in the last 24 hours to $26.85K, finding strong support on dips below $25.5K. Such active buying is a sign that crypto enthusiasts are confident that a US regulator on the warpath will not cause global problems for cryptocurrencies.
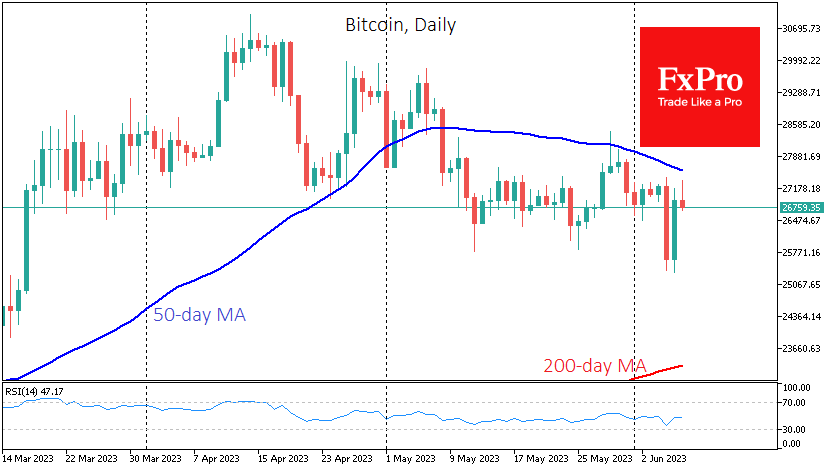
Technically, yesterday’s strong buying has somewhat lowered the temperature of concerns about the near-term outlook for the price. It was back above the 200-week average and within the closing ranges of the last four weeks. Nevertheless, a wait-and-see approach now seems more prudent as Bitcoin has yet to prove its ability to gain further strength. A significant bullish signal would be a surpass of $27.5K, where many local highs and the 50-day moving average are concentrated.
News background
Binance has issued a statement saying that it will “vigorously defend itself” in the case against the SEC. Binance has also refuted allegations that the platform puts customer funds at risk. The platform has been accused of falsifying trading volumes and trading in unregistered securities and has mentioned 61 tokens at once, including big names such as SOL, ADA, MATIC and ATOM.
In its crusade against crypto, the SEC sued Coinbase, the largest US crypto exchange. According to the agency, several tokens on the exchange fit the definition of securities: SOL, ADA, MATIC, FIL, SAND, AXS, CHZ, FLOW, ICP, NEAR, VGX, DASH and NEXO.
SEC chief Gary Gensler said on CNBC that the modern world doesn’t need cryptos.
Charles Hoskinson, Cardano founder, called on the crypto industry to unite against SEC authoritarianism to prevent totalitarian control of people’s finances. He said the regulator was “turning the US into an Orwellian dystopia” and introducing the digital dollar would give the Fed complete control over people’s finances.
GBP/USD Technical Analysis
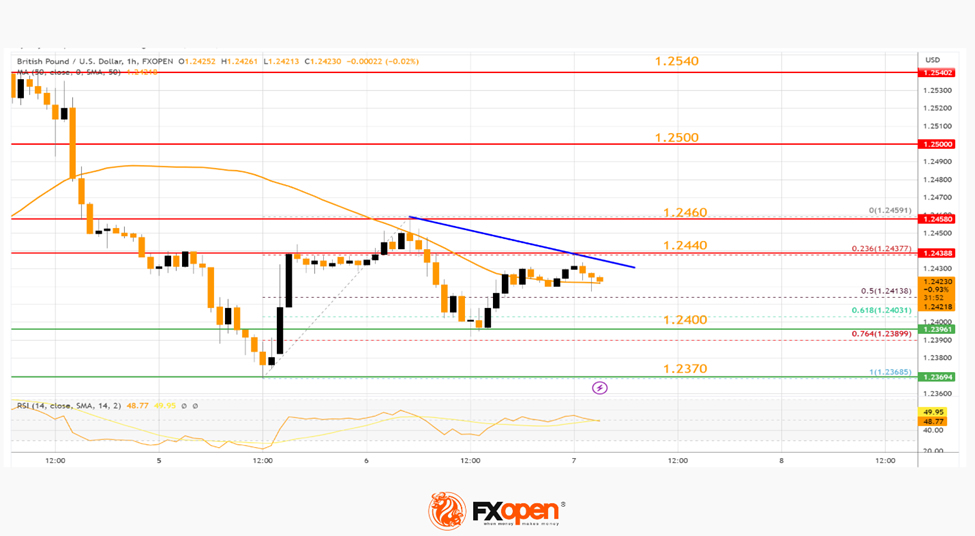
On the hourly chart of GBP/USD at FXOpen, the pair started a recovery wave from the 1.2370 zone. The British Pound is now trading above the 1.2400 pivot level against the US Dollar.
It tested the 1.2440 resistance and stayed above the 50-hour simple moving average. To start a fresh increase, the pair must clear and settle above the 1.2440 resistance zone.
The first major resistance is near the 1.2460 level. If there is a clear upside break above the 1.2460 resistance, the pair could rise toward the 1.2500 level in the near term. The next major resistance sits near the 1.2540 level.
On the downside, the first major support is near the 1.2400 level. The main support is forming near the 1.2370 level, below which GBP/USD might accelerate lower toward the 1.2320 support.
OECD upgrades global growth outlook, advocates for restrictive monetary policies
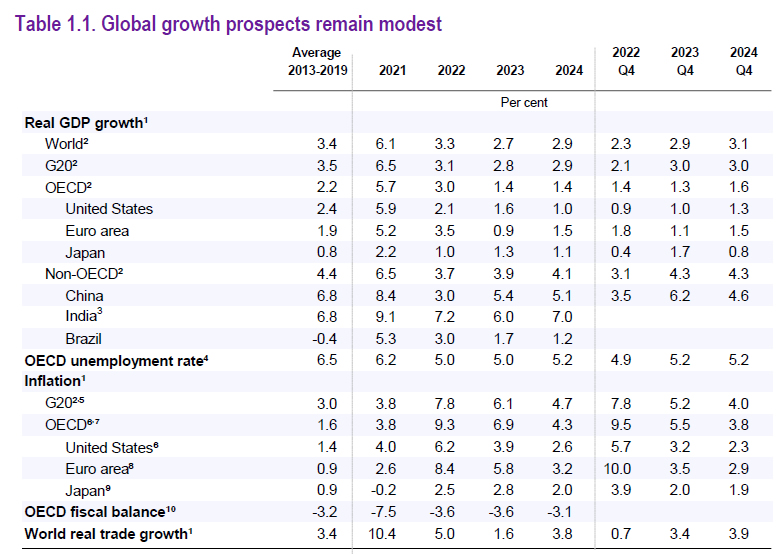
In the latest Economic Outlook, OECD has slightly upgraded global growth forecasts, and stressed the need for central banks to maintain restrictive monetary policies to curtail inflation.
OECD now projects global economic expansion at 2.7%, a slight upgrade from its previous forecast of 2.6% in March. The US and China, the world's two largest economies, saw their growth forecasts for 2023 nudged upwards by 0.1%, to 1.6% and 5.4% respectively.
In Eurozone, growth forecast was modestly bumped up by 0.1 points to 0.9%. However, Germany, the zone's largest economy, saw a significant downgrade with zero growth now expected. UK, on the other hand, received a boost with OECD predicting 0.3% growth rather than an economic contraction. Japan's GDP growth forecast was slightly revised down to 1.3%.
Despite the optimistic revisions, OECD chief economist Clare Lombardelli underscored the challenges ahead in a commentary accompanying the report.
"The global economy is turning a corner but faces a long road ahead to attain strong and sustainable growth," Lombardelli stated. She added, "The recovery will be weak by past standards."
Highlighting the ongoing inflationary pressures globally, Lombardelli advocated for a continued restrictive monetary stance from central banks. "Central banks need to maintain restrictive monetary policies until there are clear signs that underlying inflationary pressures are abating," she urged.