

Sample Category Title
USD/JPY Daily Outlook
Daily Pivots: (S1) 139.16; (P) 139.57; (R1) 140.05; More...
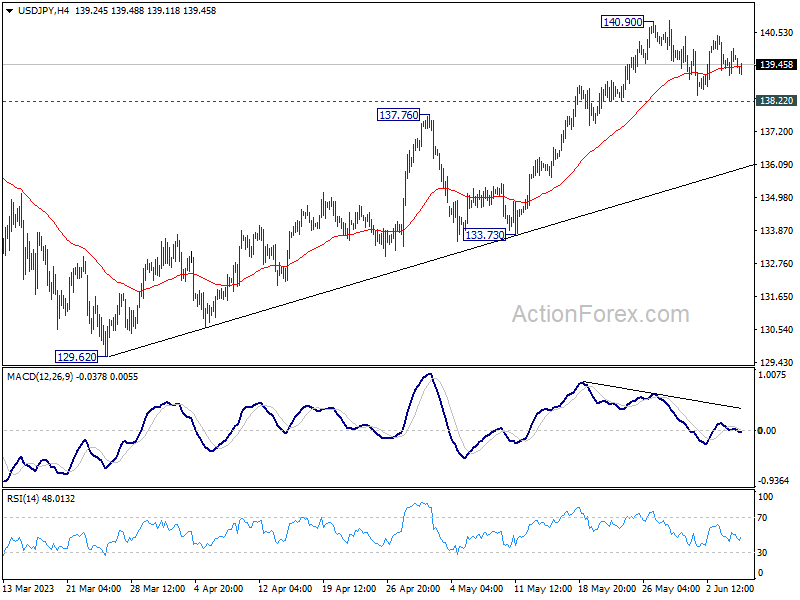
Intraday bias in USD/JPY remains neutral as consolidation from 140.90 is extending. Further rally is expected as long as 138.22 minor support holds. On the upside, break of 140.90 will resume larger rise from 127.20 to 142.48 fibonacci level. However, considering bearish divergence condition in 4 hour MACD, break of 138.22 will confirm short term topping, and turn bias back to the downside for 55 D EMA (now at 136.35).
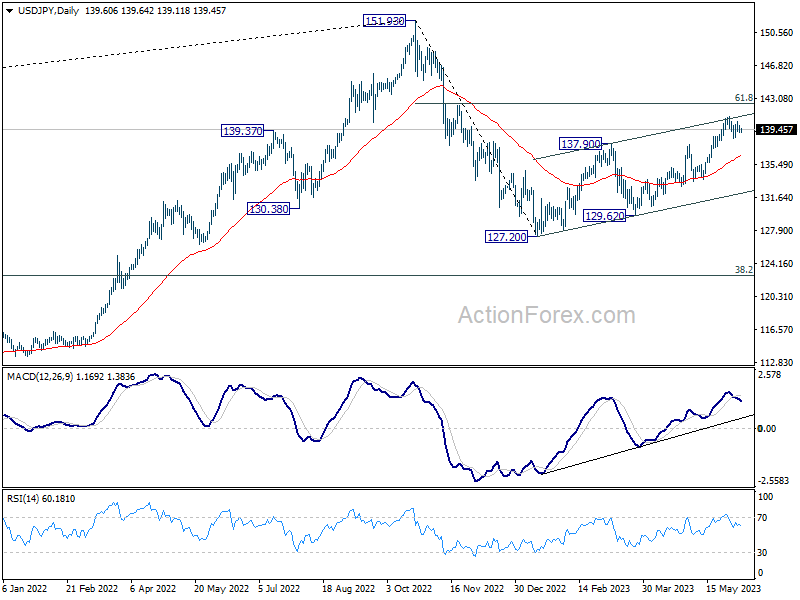
In the bigger picture, rise from 127.20 is seen as the second leg of the corrective pattern from 151.93 high. Stronger rally would be seen to 61.8% retracement of 151.93 to 127.20 at 136.34. Sustained break there will pave the way back to retest 151.93. On the downside, however, break of 133.73 support will argue that the pattern could have started the third leg through 127.20 low.
USD/CAD Daily Outlook
Daily Pivots: (S1) 1.3377; (P) 1.3415; (R1) 1.3439; More....
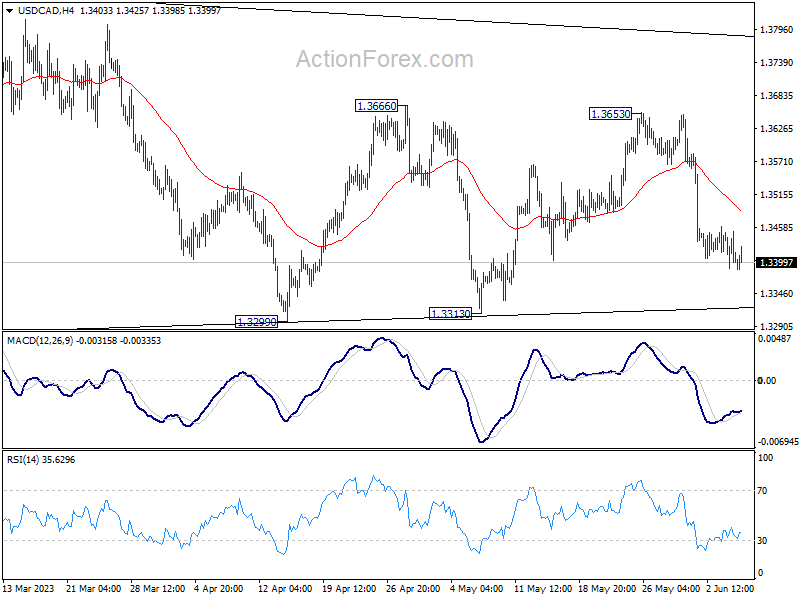
Intraday bias in USD/CAD stays neutral as range trading continues. Price actions from 1.3976 are seen as a triangle consolidation pattern. Above 1.3666 will target 1.3860 resistance first. Firm break of 1.3860 will argue that larger up trend is ready to resume through 1.3976 high. Nevertheless, sustained break of 1.3229 will dampen this view and turn near term outlook bearish.
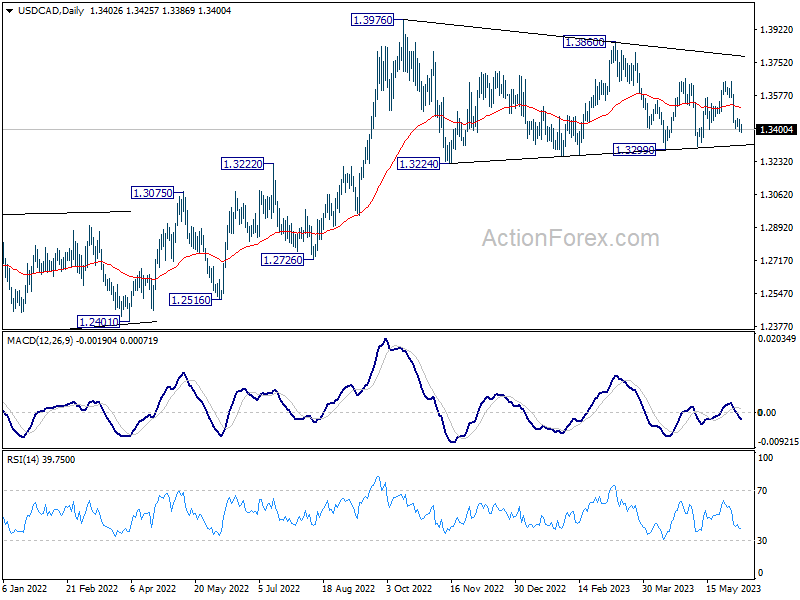
In the bigger picture, rise from 1.2005 (2021 low) is expected to resume through 1.3976 after consolidation from there completes. On decisive break of 1.3976, next target will be 1.4667/89 long term resistance zone. This will remain the favored case as long as 38.2% retracement of 1.2005 to 1.3976 at 1.3233 holds.
EUR/CHF and USD/CHF Weekly Chart Outlook
EUR/CHF is struggling to clear the 0.9960 resistance zone. USD/CHF could gain pace if it clears the 0.9290 resistance zone.
Important Takeaways for EUR/CHF and USD/CHF Analysis
- The Euro is facing strong resistance near 0.9960 against the Swiss Franc.
- There is a key bearish trend line forming with resistance near 0.9850 on the weekly chart of EUR/CHF at FXOpen.
- USD/CHF found support near 0.8820 and recently started an upside correction.
- There is a crucial bearish trend line forming with resistance near 0.9200 on the weekly chart at FXOpen.
EUR/CHF Technical Analysis
On the weekly chart of EUR/CHF at FXOpen, the pair started a decent recovery wave from the 0.9400 support zone. The Euro was able to climb above 0.9670 against the Swiss Franc.
During the increase, it traded above the 50% Fib retracement level of the last major decline from the 1.0515 swing high to the 0.9406 low. There was also a spike above the 0.9960 resistance and the 50-week simple moving average.
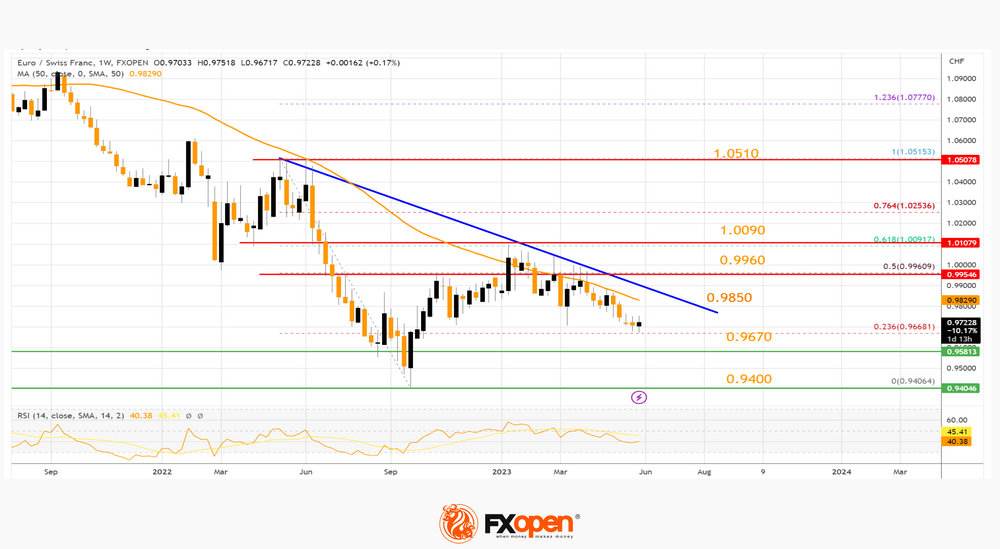
However, the pair struggled to clear the 1.0090 resistance zone. It failed near the 61.8% Fib retracement level of the last major decline from the 1.0515 swing high to the 0.9406 low.
On the EUR/CHF chart, the pair is moving lower and trading below the 50-week simple moving average. Immediate support is near the 0.9670 level. The first major support is near the 0.9400 level, below which the pair could decline toward 0.9200.
On the upside, the first major resistance is forming near a key bearish trend line at 0.9850. The next major resistance is near the 0.9960 level, above which the pair might revisit the 1.0090 resistance zone if the weekly RSI moves above 50. Any more gains might the pair toward 1.0500.
USD/CHF Technical Analysis
On the weekly chart of USD/CHF, the pair faced strong rejection near the 1.0100 level. The US Dollar started a major decline below the 0.9500 support against the Swiss Franc.
The pair tested the 0.8820 support. A low was formed near 0.8820 and the pair is now rising. It broke the 23.6% Fib retracement level of the downward move from the 0.9440 swing high to the 0.8820 low.
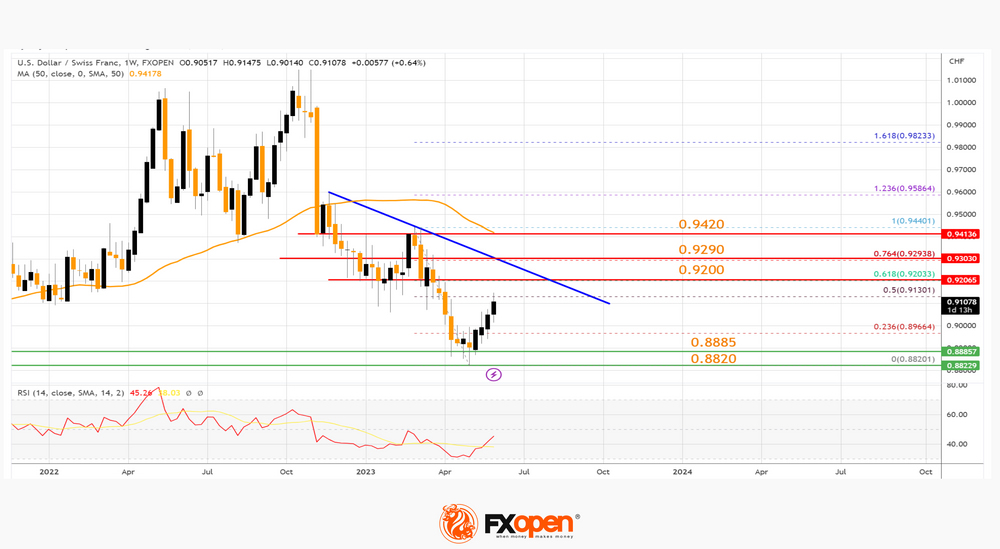
On the upside, the pair is facing resistance near a key bearish trend line at 0.9200. It is close to the 61.8% Fib retracement level of the downward move from the 0.9440 swing high to the 0.8820 low. The next major resistance is near the 0.9290 level.
The main resistance on the USD/CHF chart is near the 50-week simple moving average at 0.9420. A successful close above 0.9420 is likely to start a strong upward move toward 0.9800 in the coming weeks.
Conversely, if USD/CHF fails to break 0.9200, it could retreat lower and revisit the 0.8885 support area. The next major support is near the 0.8820 level. A downside break below the 0.8820 support might send the pair toward 0.8650.
Any more losses might push the pair further into a bearish zone. In the stated case, there is a risk of a drop toward the 0.8200 support zone in the medium term.
Weak Global Trade Weighs on Chinese Exports, Australian Growth Slows, Oil Slips Further
European indices and US futures look a little flat following a mixed session in Asia overnight, as Chinese trade data failed to inspire while Australian GDP pointed to further pain as the RBA continues raising rates.
Disappointing trade figures increase calls for stimulus
Chinese trade data offered further evidence of weakening demand both domestically and abroad, with exports falling particularly hard last month. A 7.5% decline far exceeded the -0.4% expected, while imports actually beat forecasts, albeit while also falling 4.5% in May.
Weaker global trade is not a new story but it is surprising how quickly China's reopening boost has faded, with backlogs of work supporting export numbers until now even as other countries have continued to see demand for their goods wane.
With China's reopening boom flagging so quickly, pressure is set to intensify on the leadership to announce new stimulus measures in a bid to revitalize the economy again and achieve its 5% growth target. That may initially come in the form of rate cuts, perhaps targeted to those sectors under the most pressure with authorities so far reluctant to engage in broad-based easing.
Australian growth slows as high interest rates bite
The Australian economy is slowing amid cost-of-living pressures, weaker household spending, and higher interest rates. GDP in the first quarter slipped to 0.2%, down from 0.6% in the final quarter of last year and below expectations. High-interest rates and inflation are hurting household finances and the economy is now suffering. This week's RBA hike is going to compound this and unless we see signs of price pressures easing, there may be more to come.
Oil remains under pressure after Saudi cut
Oil prices are falling again today as Saudi Arabia's attempt to dress up a unilateral move as a group cut fails to have the desired impact. Crude is now trading below the level it ended at Friday which suggests that, despite the knee-jerk reaction on Monday, traders were hedging against broader action from OPEC+ and got a light version of the deal they feared.
While Saudi Arabia remains price driven, the market is more concerned with the economic outlook, and the rest of the alliance seemingly isn't interested in taking more action in anticipation of what may come. The commitment from the start of the next year could easily change depending on what unfolds whereas markets are forced to respond to current risks and as far as the economy is concerned, they are tilted to the downside.
Gold awaiting further data following inconclusive reports
Gold is treading water again this morning, sitting right in the middle of the roughly $1,940-$1,980 range it found itself in these past weeks. The economic data we've had recently has been far from conclusive and that creates a lot of uncertainty around the policy path for interest rates and therefore appetite for the yellow metal.
Inflation has proven to be more stubborn than hoped while the labour market remains resilient, a combination that doesn't point to US rate cuts later this year as traders currently hope. This is a big summer and all of that may soon change but for now, that uncertainty is creating this choppiness and range trading we're seeing in gold.
Will the Binance and Coinbase sagas bring regulatory clarity to the space?
It's been an explosive couple of days in the crypto space, with the SEC targeting Binance and Coinbase with lawsuits containing various allegations that have rattled the industry. Bitcoin initially fell more than 5% on Monday before recovering largely on Tuesday and now it's trading only marginally lower, just below $27,000. While the initial response to the action was negative, it didn't exactly come as a shock and the companies will have been preparing for such a move for some time.
Given the size of the two exchanges and the recent scarring from the FTX scandal, there will obviously be some concern about what comes next. But one good thing that will hopefully come from this is regulatory clarity which has been lacking for years now.
Markets Enter Standby Mode
Asian stocks crawled higher on Wednesday, following the positive cues from Wall Street overnight after the S&P500 closed at its highest level in 2023. However, markets remain cautious despite hopes for stimulus in China with risk sentiment shaky after the World Bank’s warning on the global economic outlook. European futures are pointing to a cautiously positive open despite the industrial production figures for Germany rising less than expected in April. In the currency markets, the dollar seems to be on standby amid the absence of a fresh fundamental spark. Oil prices fell in the previous session, despite initially rallying on news of Saudi Arabia’s supply cut while gold was little changed.
In other news, Australia’s economy slowed more than expected in the first quarter of 2023 as aggressive policy tightening took hold. GDP expanded 0.2% from the prior quarter which was the weakest expansion witnessed since the third quarter of 2021. Year on year, the economy grew 2.3% cooling from a downwardly revised 2.6%. This disappointing report comes just one day after the Reserve Bank of Australia surprised markets with a 25-basis point rate hike. Aussie bulls seemed unfazed by the data, with the currency edging slightly higher across the board. Taking a quick look at the technicals, AUDUSD is bullish on the daily charts with prices approaching the 200-day SMA around 0.6690. A solid breakout above this point may encourage a move toward 0.6740.
Bank of Canada rate decision in focus
After the surprise 25 basis point hike by the RBA on Tuesday, all eyes will be on the Bank of Canada rate decision on Wednesday. While the central bank is not expected to hike rates, money markets are still pricing in a 46% probability of a rate rise becoming a reality this afternoon. It’s worth keeping in mind that the stronger-than-expected GDP and CPI data have supported expectations around the BoC keeping rates higher for longer. If the central bank surprises markets with a hike in June, the Canadian dollar could rally. Talking technicals, the CAD has been one of the best-performing G10 currencies month-to-date, gaining over 1% against the dollar. USDCAD has found itself trapped within a wide range on the monthly, weekly, and daily charts with a potential breakout on the horizon. With the current path of least resistance pointing south, it may be wise to keep an eye on how prices behave around the 1.3300 support.
Oil weighed by growth concerns
Oil prices were under pressure on Wednesday as concerns over global economic growth kept bears in the driving seat following the initial bounce at the start of the week on Saudi Arabia’s pledge to cut oil production. The global commodity is likely to remain volatile as fears over the demand outlook clash with supply-side forces. Nevertheless, the scales of power seem to remain in favour of the bears, especially when factoring in how oil has shed roughly 12% year-to-date amid China’s uneven growth and the Fed’s aggressive rate hikes. It may be worth keeping a close eye on the US weekly crude inventories report published later today which could influence oil prices. Another build in inventories could fuel downside losses, dragging WTI crude toward $70.
Commodity spotlight – Gold
Gold was steady this morning in the absence of a fresh fundamental catalyst. Given how we have entered the blackout period for Fed speakers and the rest of the week is light on US data, the precious metal could remain trapped in a range. Nevertheless, the OECD’s global economic outlook might inject some light into the precious metal ahead of the Fed decision next week. In the meantime, support can be found at $1935 and resistance around $1985.
Bitcoin (BTCUSD) Short Term 5 Swing Bearish Sequence Favors Lower
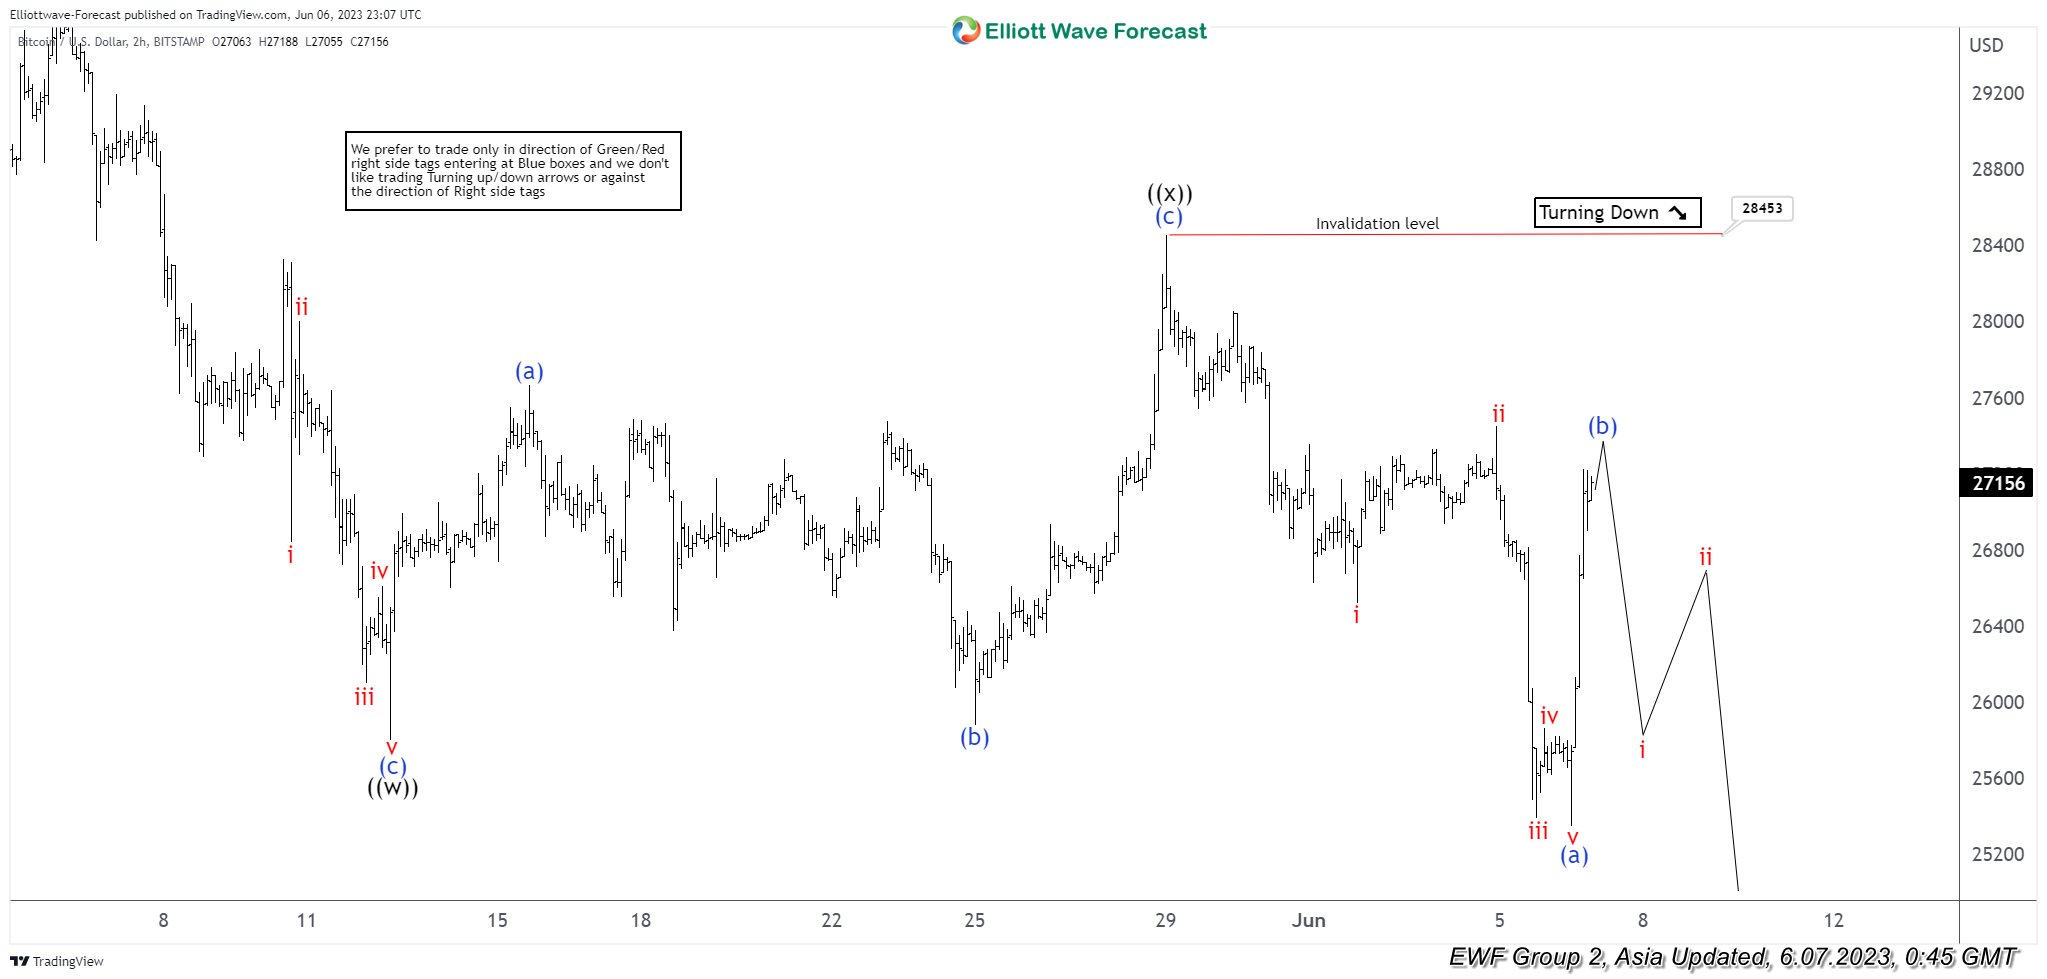
Bitcoin (BTCUSD) decline from 4.14.2023 high shows a 5 swing sequence suggesting further downside can’t be ruled out. A 5 swing sequence typically is an incomplete sequence and can see more downside to end 7 swing as a double three (double zigzag) Elliott Wave structure. Down from 4.14.2023 high, wave (a) ended at 26981 and rally in wave (b) ended at 29851. Wave (c) lower ended at 25800 which completed wave ((w)) in higher degree. Up from there, wave (a) ended at 27666, pullback in wave (b) ended at 25878. Wave (c) higher ended at 28453 which completed wave ((x)).
Bitcoin has turned lower in wave ((y)) with internal subdivision as another zigzag in lesser degree. Down from wave ((x)), wave i ended at 26519 and wave ii ended at 27451. Wave iii ended at 25389, wave iv ended at 25863, and wave v lower ended at 25350 which completed wave (a) of ((y)) in higher degree. Rally in wave (b) is expected to fail below 28453 in the first degree for further downside in wave (c). Ideal target lower is 100% – 161.8% Fibonacci extension from 4.14.2023 high which comes at 20020 – 23244. Near term, as far as pivot at 28453 high stays intact, expect rally to fail in 3, 7, or 11 swing for further downside.
Bitcoin (BTCUSD) 2 Hours Elliott Wave Chart
BTCUSD Elliott Wave Video
https://www.youtube.com/watch?v=B5yo3spURbA
EUR Struggles for Support
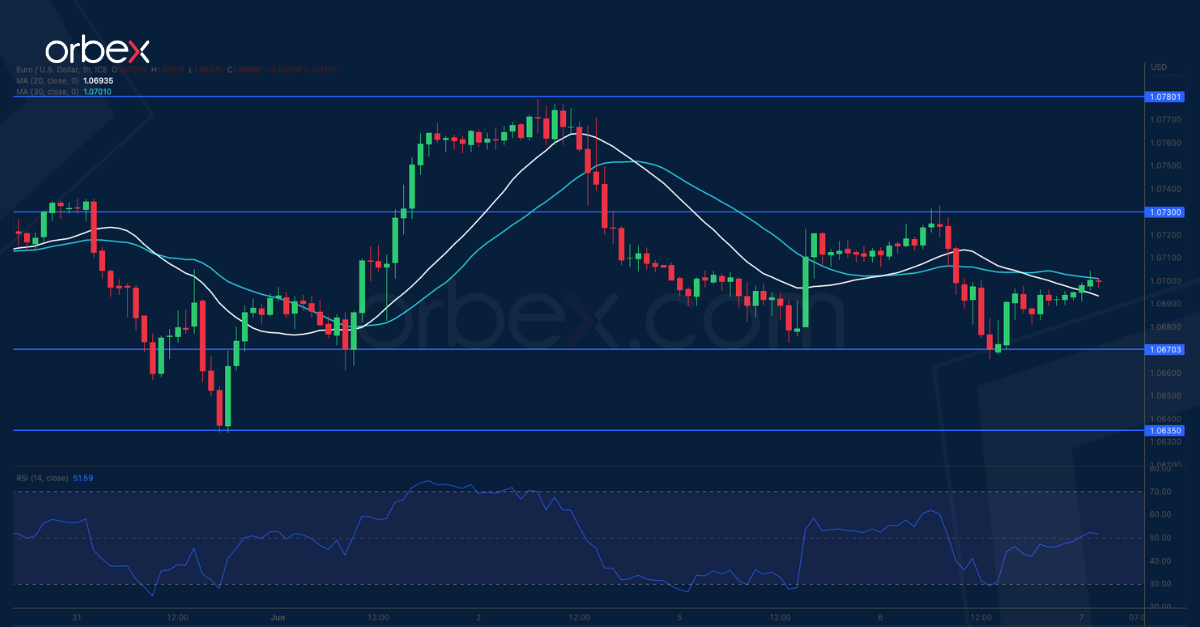
EUR/USD breaks lower
The Euro struggled after retail sales across the bloc remained flat in April. The pair has given up most of the gains from its mid-Mach rally and is heading towards the daily support of 1.0540. The latest bounce has met stiff selling pressure at 1.0780 and the subsequent U-turn sent the single currency back to the base of the rebound at 1.0670 with a tentative break suggesting further weakness. Its breach would invalidate the brief bullish momentum and cause a sell-off below 1.0635. 1.0730 has become a fresh resistance.
AUD/USD bounces back
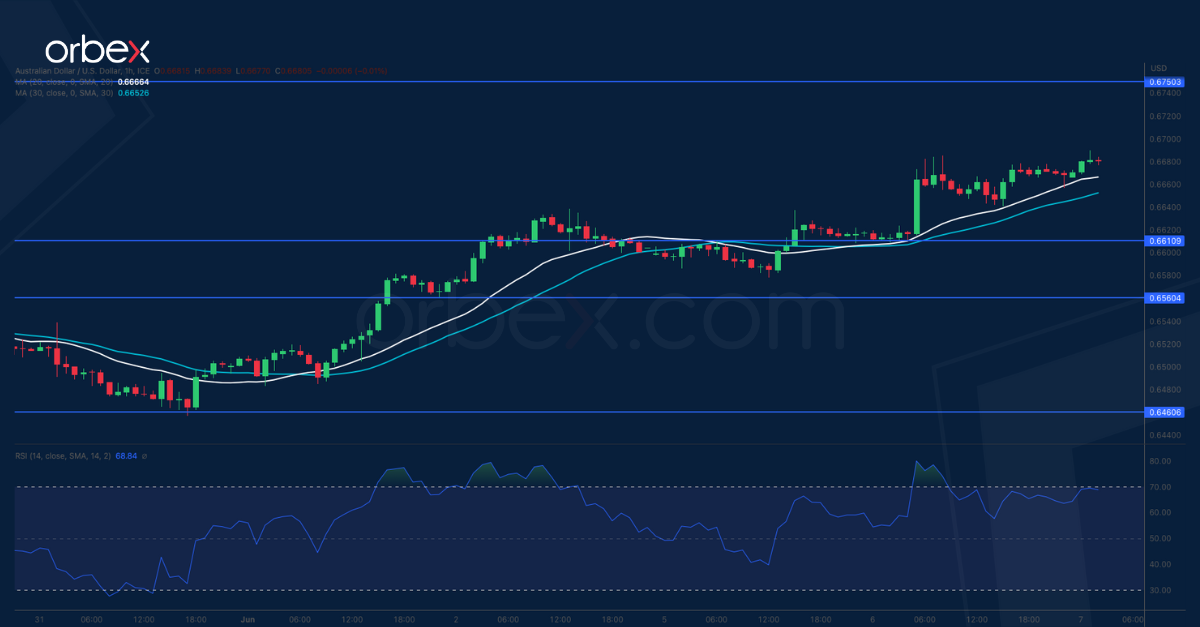
The Australian dollar jumped after the RBA surprised the market with another tightening move. The price continues to capitalise on its bounce off the base of last November’s rally at 0.6460. A surge above the key support-turned-resistance of 0.6640 has forced more sellers to cover their bets and eased the bearish pressure, clearing the path for a potential extension towards 0.6750. The RSI’s double top in the overbought zone may temporarily limit the bullish fever and 0.6610 is the closest support in case of a retracement.
UK 100 tests resistance
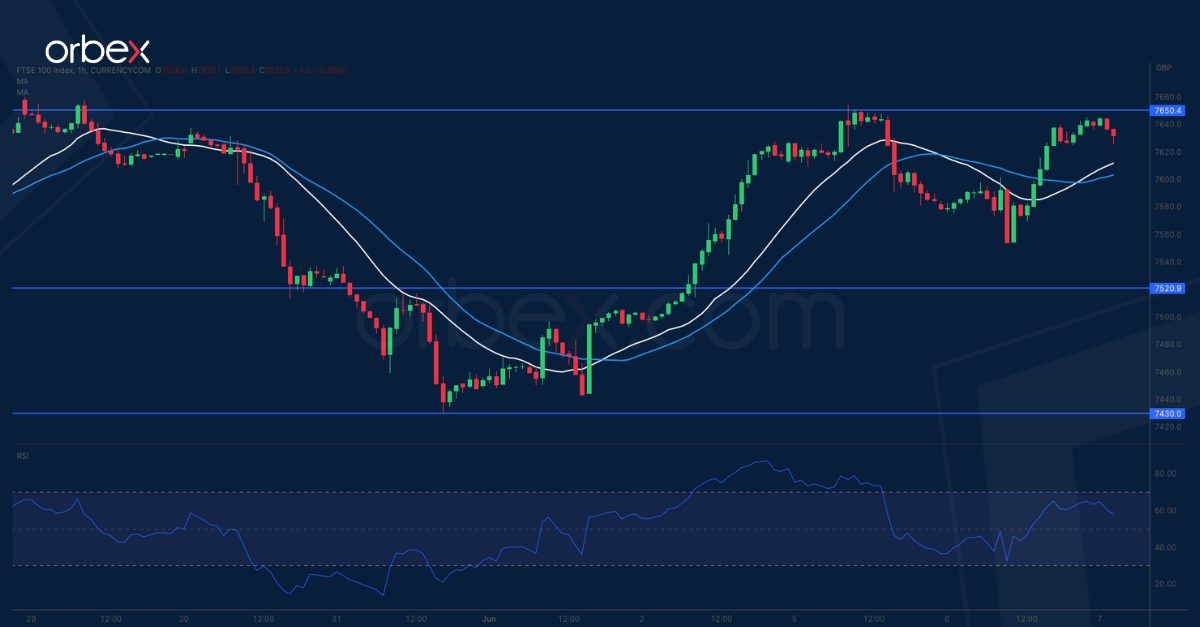
The FTSE 100 bounces back supported by a rally in energy stocks. A V-shaped rebound has brought the index to its first key resistance at 7650 which coincides with the 20-day SMA. A bullish breakout would flush selling interests out and pave the way for an extended recovery to the previous consolidation zone around 7800 where a liquidation kicked off later last month. A close above this major ceiling might trigger a bullish continuation above 8000 in the medium-term. 7520 is an important level to maintain the current momentum.
Weak Chinese Trade Data Add to Growth Worries
Markets
German Bunds outperformed US Treasuries during European trading hours following an unexpectedly strong decrease of inflation expectations in the ECB’s April Consumer Expectations Survey. The divergence between the two became even larger as US Treasuries started underperforming (especially at the front end the curve) during the US session. The move started after the US Treasury announced plans to boost the size of its coming bills sales: $60bn for the 4-week tenor (+$25bn), $50bn for the 8-week tenor (+$35bn) and $46bn for the 17-week auction (+$2bn). Since the debt ceiling has been raised, the US Treasury is rapidly trying to replenish its depleted general account with the Fed which shrank to its lowest level since 2017. In coming weeks/months, sizes at the longer tenors will be upped as well with the bigger question being whether this will drain more liquidity in times of Fed rate hikes and QT or whether it will just trigger a shift in investor allocation from one cash instrument to the other. Daily changes on the US curve ranged between +1.3 bps (2-yr) and -4.2 bps (30-yr). Minutes before the market close, US Treasuries managed to erase a large part of the intraday losses in a strange, inexplicable, short squeeze. German yields closed the session up to 4 bps lower at the front end and broadly stable at the very long end. Loss of interest rate support at the front end pulled EUR/USD back below 1.07 to close at 1.0693.
Asian risk sentiment is mixed this morning as weak Chinese trade data (May exports -7.5% Y/Y) add to growth worries. The calendar is again razor thin. The OECD updates its economic outlook. Yesterday’s, the World Bank did the same. It projects global growth to decelerate from 3.1% in 2022 to 2.1% in 2023. Risks of financial stress in emerging markets and developing economies is intensifying amid elevated global interest rates. The Bank of Canada’s policy rate decision is today’s biggest wildcard. Money markets are split 50/50 over whether the BoC will lift its policy rate again by 25 bps after pausing in March and April. It would be an omen for global central banks after the RBA earlier this week conducted a second 25 bps rate hike after a one-meeting pause in April.
News and views
Global supply chain pressures eased further in May according to the NY Fed’s Global Supply Chain Pressure index (GSCPI) which eased from to -1.71 from -1.35 in April. The reading was the lowest since the start of the series in 1997. There were significant downward contributions from Great Britain backlogs and Taiwan delivery times. Euro Area delivery times and backlogs exhibited the largest sources of upward pressure in May. Looking at the underlying data, readings for all regions tracked by the GSCPI are below their historical averages. The GSCPI integrates a number of commonly used metrics with the aim of providing a comprehensive summary of potential supply chain disruptions. Global transportation costs are measured by employing data from the Baltic Dry Index and the Harpex index, as well as airfreight cost indices from the US BLS. The GSCPI also uses several supply chain-related components from PMI surveys, focusing on manufacturing firms across seven interconnected economies
Australian GDP rose 0.2% Q/Q and 2.3% Y/Y in the first quarter of 2023. It was the sixth straight rise in quarterly GDP, but the slowest since the Covid-19 lockdowns in September 2021. Private and public global fixed capital formation (respectively +1.4% after -0.9% in Q4 and +3% from -1.2%) were the main drivers of GDP growth. Household consumption continued to slow in Q1 rising 0.2% Q/Q and resulting in a 0.1 ppt contribution to growth. Net trade detracted 0.2 ppt from growth as exports increased 1.8% and imports rose 3.2.%. Despite the deceleration in growth, prices continued to grow strongly in Q1. The GDP implicit price deflator rose 1.9% Q/Q and 6.8% Y/Y. Compensation of employees also continued to rise (2.4%) as did employment, hours worked, pay raises and bonuses in the public sector. The household saving to income ratio fell to 3.7%, its lowest level since 2008, driven by higher income tax payable, interest payable on dwellings, and increased spending due to the rising cost of living pressures.
Lira Opens Its Eyes in a Dark Post-Coma Room
The SEC sued Coinbase, a day after it sued Binance for allegedly breaking US security rules. A 101-page complaint revealed how Coinbase allowed its users to trade tokens which were, in reality, unregistered securities in the US.
Coinbase dived 12% yesterday and is down by almost 30% since the start of the week, Binance Coin lost up to 10% while Bitcoin has fully recovered the Binance shock and barely reacted to Coinbase news.
Cryptocurrency valuations have been impressively resilient to shocks in crypto exchanges; it is now clear for most crypto traders that the existential threat of cryptocurrency exchanges is not an existential threat for cryptocurrencies.
Globally sticky inflation and rising yields are a stronger headache for cryptocurrency valuations than crypto exchanges’ trouble with the SEC.
Pause, skip, hike?
The Fed is broadly expected to keep interest rates steady next week, but preserve the possibility of further rate hikes for the July meeting. The threat of another rate hike – sometime down the road – should be enough to keep the pressure in US yields to the upside. The US 2-year yield is steady around the 4.50% level.
Across the Atlantic Ocean, the policy tightening results are better seen and felt. Consumer expectations for the euro area fell significantly in April, a week after the Euro-area inflation revealed a much faster-than-expected fall in both headline and core numbers. According to the latest European Central Bank (ECB) survey, the inflation expectation for the next 12-months is down from 5% to 4.1%, and the expectation for the next 3-years is down from 2.9% to 2.5% - a stone’s throw distance from the ECB’s 2% policy target. The German 2-year yield slid more than 1% yesterday on the news, and the spread between the 10-year German and Italian bonds fell to the lowest level since April on improved sentiment following good news from the inflation front. The question is, whether the ECB will soften its hand, and adopt a Fed-like policy, where the rate hikes could pause, after next week’s almost certain 25bp hike, or will the Eurozone policymakers continue sounding and acting as hawkish as possible to avoid any accident between now and success. ECB Chief Chhrstinte Lagarde insisted in her latest speech that she sees ‘no clear evidence’ that inflation has peaked.
For now, investors are ready for two more 25bp hikes into the end of summer.
What does it mean for the euro? Well, because another Fed rate hike – in July, and two other ECB hikes in the coming meetings are broadly priced in, the softer inflation data from the eurozone comes to support the ECB doves, and apply additional pressure on the EURUSD. But because the US dollar also stagnates near 3-month high levels, and because the dollar rally is also giving signs of exhaustion, the EURUSD could hold ground and not crumble below the 1.07 level.
More of central bank talk, the BoC is expected to keep rates steady at 4.5% when it meets today, while the RBA surprised investors with a 25bp hike yesterday, pointing at sticky inflation, but softer-than-expected Australian GDP data and shrinking Chinese exports came to halt gains in the AUDUSD into the 200-DMA.
Lira jitters
The Turkish lira is back to running from record low to record low. The dollar-lira is up by almost 15% since mid-May, and more importantly, it looks like the central bank’s efforts to fight a stronger dollar is either fading – after Erdogan’s victory in the latest elections – or keeping the lira steady is becoming more difficult and increasingly expensive for the Turks.
In all cases, we see a movement in the lira that we haven’t seen for a long time. Keep in mind that the lira has not been trading freely since the end of 2021.
Do you get back to selling the lira? The lira is still a black box, and no one knows what the government is really up to. But we know that there is effort, after the elections, to shift Turkey’s beyond-absurd monetary policy toward a more orthodox place – which requires higher interest rates, obviously.
As a result, Turkey appointed Mehmet Simsek as its new finance minister. Mr. Simsek is well-known and well-appreciated by the markets, and is now supposed to clean up the mess of the past year-and-a-half, and eventually restore investor confidence.
But restoring confidence won’t be a piece of cake of course. In past years, Turkey didn’t lack talneted finance ministers or smart central bankers. But each time sometime tried to do his/her job correctly – which in Turkey means raising the rates – he/she got rapidly sacked. Therefore, what investors want to see in Turkey is not how talented Mehmet Simsek is in finance, but how resistant he will be to the low-rate pressure from the presidential office.
Focus on Geopolitics
Market movers today
Geopolitical events are stealing the spotlight during an otherwise uneventful week. Ukraine's counter offensive seems to have finally started although it is being overshadowed by the destruction of the Kakhovka dam yesterday. Ukraine is accusing Russia for blowing up the dam, and the US intelligence hints to same direction, but Russia has not claimed responsibility. By late Tuesday evening, more than a thousand people had been evacuated and 40,000 people were estimated to be affected by the flooding. While Ukraine's spring offensive is their best opportunity to defeat Russia, the massive flooding of the Dnipro river will now complicate operations on both sides.
On data front, today brings Germany's industrial production and US trade balance data for April.
We also have a few ECB speeches scheduled just before the quiet period begins tomorrow.
The 60 second overview
EU: With the dry weather spell ongoing in Europe, we observe a risk for a stagflationary shock hitting the euro area. We observe that the water level in the key water pass way 'Kaub' in the Rhine is well below the past 10y mean level. Compared to last year's level it is +50cm higher at this point in time. Last year this was a driver of higher energy, notably higher natural gas prices, as this pathway is also used to transport coal to the power plants.
EUR/USD declined below the 1.07 mark yesterday on generally cautious market sentiment and relatively weak tier 2 releases from the euro area. German factory orders and euro area retail sales both declined more than expected, while the ECB found an across-the-board deterioration in its consumer expectations survey for April - the view on inflation, nominal income growth, nominal spending and house price growth all waned, while expectations for economic growth remained in negative territory. Overall, clear indications of weakening demand in the euro area.
China-US relations: Media reported that US secretary of state Anthony Blinken is eyeing a visit to China to meet Xi in the coming weeks.
Equities: Equities were softly higher yesterday in thin news flow. Cyclicals led the march higher, but the outperformance is no longer limited to FANMAG but also financials and real estate, especially regional banks. Small caps bounced back after the sell-off on Monday, with Russell 2000 surging +2.7% vs S&P 500 +0.2%. Futures are basically flat this morning.
FI: The ECB's CES initially took European yields lower across the maturity spectrum as inflation expectations declined in April. That said, longer dated issuance helped steepen the curve.
FX: AUD rallied further yesterday and Scandies sold off on a relatively quiet day on the G10 FX market where notably oil market lost momentum from OPEC+'s output cut announcement. EUR/USD remained anchored around the 1.07 level. EUR/SEK climbed towards last week's high and EUR/NOK rose close to the 11.90 level.
Credit: iTraxx Xover tightened 7.4bp and Main 1.3bp, with both indices closing at the tightest levels since prior to the SVB debacle. Primary market activity continued at a high pace and both OP Corporate Bank and DNB were in the market in preferred senior and Tier 2 format, respectively.