Sample Category Title
AUD/USD Eyes Steady Increase To 0.6800
Key Highlights
- AUD/USD is moving higher above the 0.6550 resistance.
- It broke a major bearish trend line with resistance near 0.6510 on the 4-hour chart.
- EUR/USD is still struggling to start a recovery wave above the 1.0780 resistance.
- The BoC interest rate decision is scheduled today (forecast 4.5%, versus 4.5% previous).
AUD/USD Technical Analysis
The Aussie Dollar found support near the 0.6460 zone against the US Dollar. AUD/USD started a fresh increase and was able to clear the 0.6500 resistance.
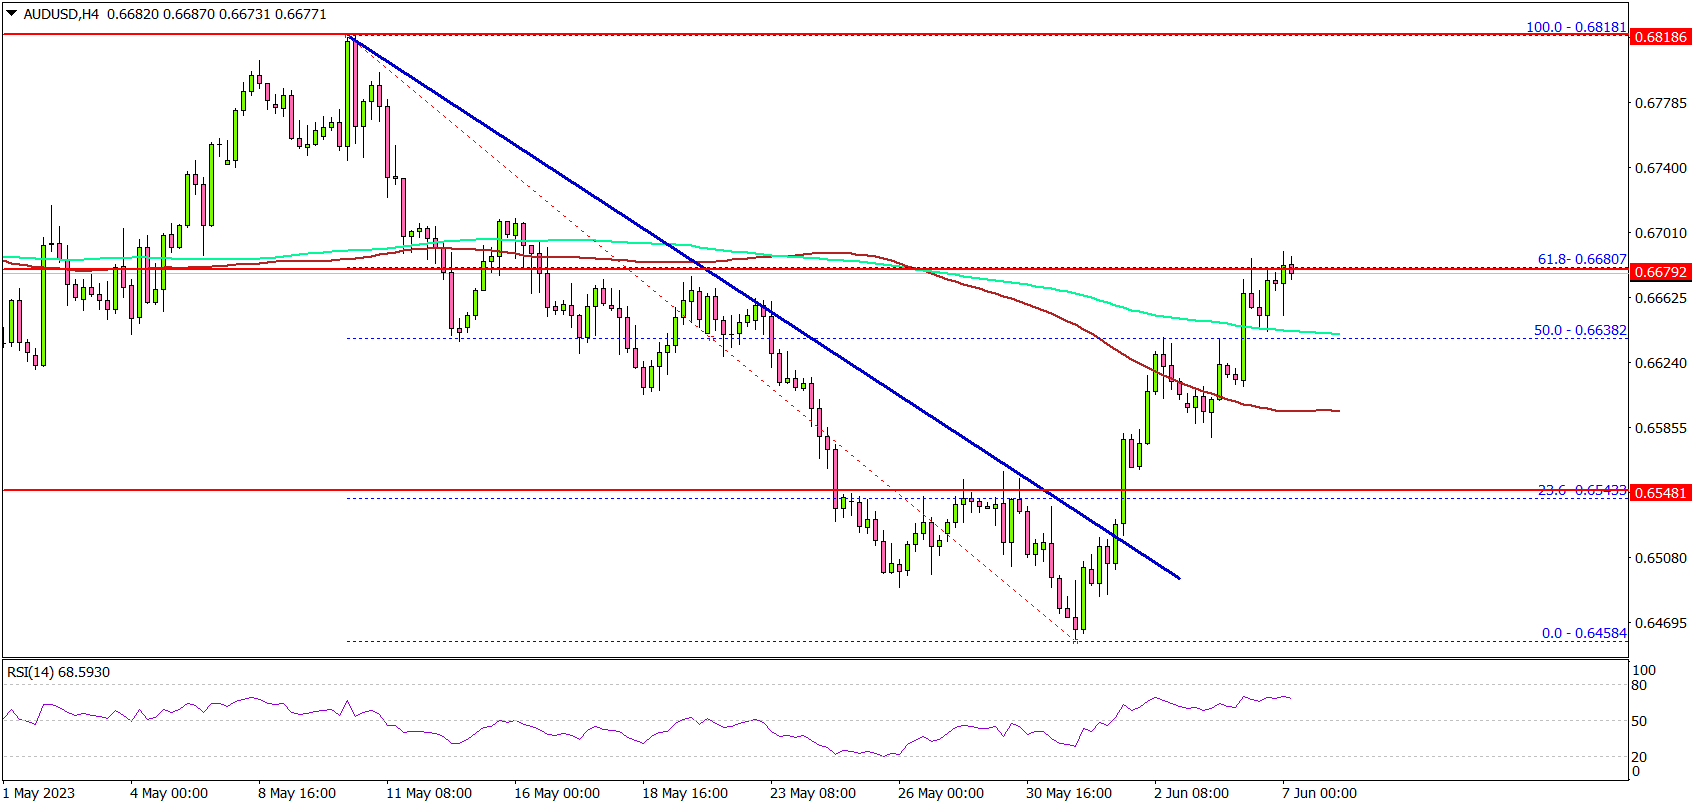
Looking at the 4-hour chart, the pair broke a major bearish trend line with resistance near 0.6510. There was a close above the 100 simple moving average (red, 4 hours). The bulls pushed the pair above the 50% Fib retracement level of the downward move from the 0.6818 swing high to the 0.6458 low.
It is now trading above the 200 simple moving average (green, 4 hours) and testing the 76.4% Fib retracement level of the downward move from the 0.6818 swing high to the 0.6458 low.
If there is a move above the 0.6680 resistance, the pair could drift toward 0.6750. The main resistance is near 0.6800, above which the pair might rise steadily.
If there is no wave above 0.6680, the pair could dip toward 0.6620. The next major support is near the 0.6550 level. If there is a downside break below the 0.6550 support, the pair could decline toward the 0.6500 support.
Looking at EUR/USD, the pair is now consolidating losses and still facing a lot of hurdles near the 1.0780 level.
Economic Releases
BoC Interest Rate Decision – Forecast 4.5%, versus 4.5% previous.
AUDNZD Wave Analysis
- AUDNZD broke resistance level 1,0900
- Likely to rise to resistance level 1.1045
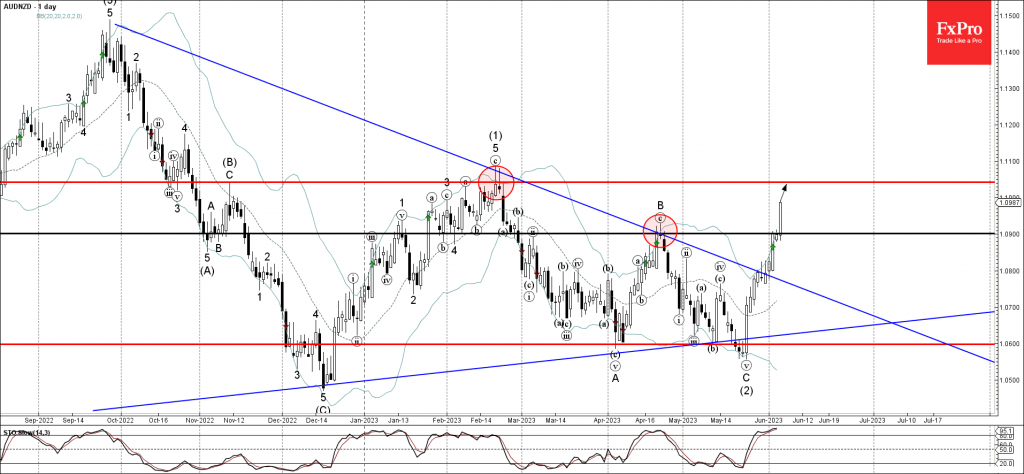
AUDNZD under the bullish pressure after the price broke above the pivotal resistance level 1,0900 (which has been reversing the price from the start of March).
The breakout of the resistance level 1,0900 was preceded by the breakout of the weekly Triangle from last September.
AUDNZD can be expected to rise further toward the next resistance level 1.1045 (top of the previous waves (B) and (1)).
Nikkei 225 Wave Analysis
- Nikkei 225 broke long-term resistance level 30735.00
- Likely to rise to resistance level 33000.00
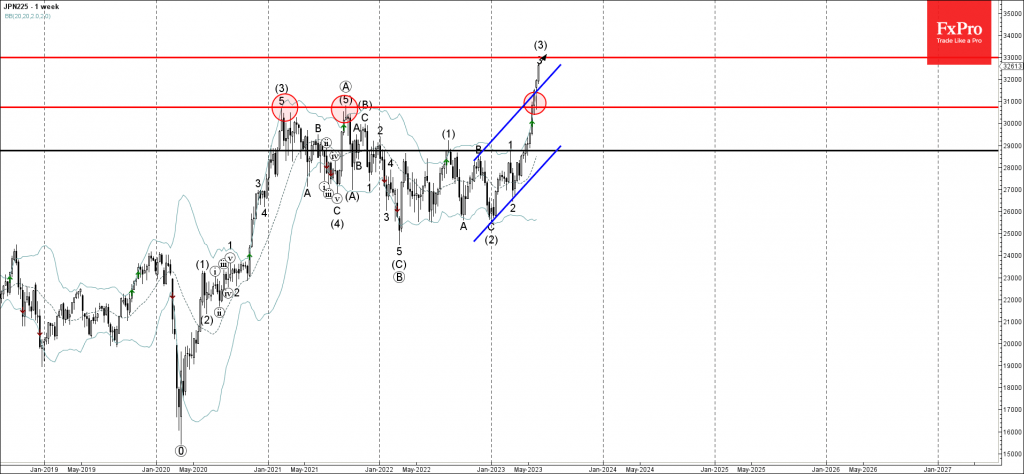
Nikkei 225 index continues to rise sharply after the price broke through the major long-term resistance level 30735.00 (former Double Top from 2021).
The breakout of the resistance level 30735.00 coincided with the breakout of the weekly up channel from last year, which accelerated the active impulse waves 3 and (3).
Given the strong weekly uptrend, Nikkei 225 can be expected to rise further toward the next resistance level 33000.00.
Is a Big Oil Slump Brewing?
Oil started the week with a 2.5% jump, picking up on news of Saudi Arabia’s surprise decision to voluntarily cut production by 1M BPD. In addition, OPEC+ agreed to Russia’s production cut from next year.
These measures look like an impressive attempt to increase energy prices, giving traders a sense of increased energy shortages for at least the coming quarters.
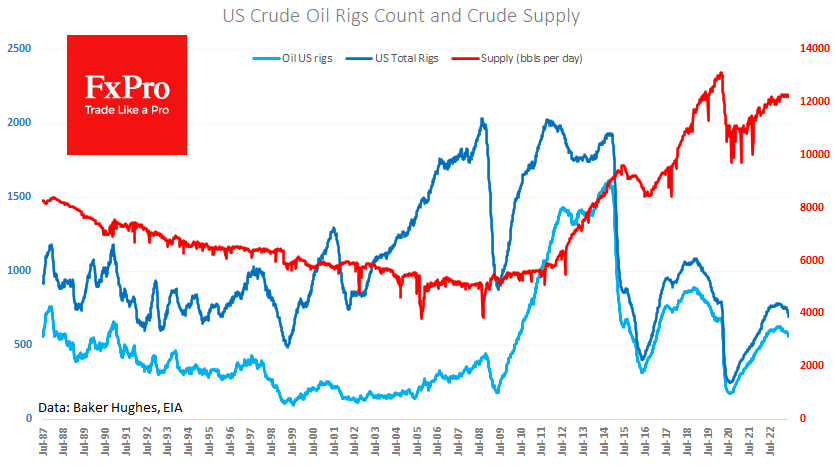
On the US side, news on production levels is also working to support this perception. The latest data from Baker Hughes noted a drop of 15 oil production rigs to 555 – the lowest since April 2022.
Since the start of the year, US production has been close to 12.2M BPD, which is only a modest 2.5% higher than exactly a year ago. Thus, US producers are in no hurry to take the market share that Saudi Arabia and Russia are willing to give up. There are two reasons for this.
Firstly, producers need to be more impressed by prices. Technically, they are near the 2018 peak, which is not low by historical standards. But here, one must add significantly higher market interest rates and a pronounced green agenda of financial institutions.
Secondly, the apathy of the major oil producers could result from lower demand in key areas, forming a bearish market environment.
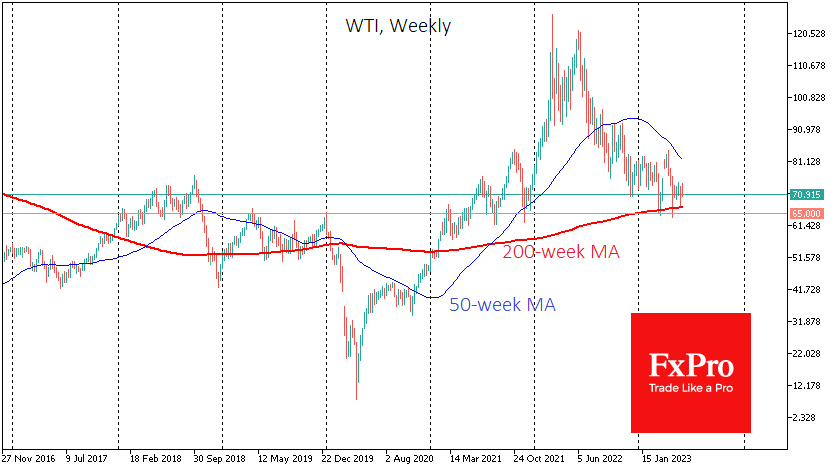
Judging by the fact that WTI closed the gap before the end of Monday and lost another 1.8% on Tuesday, traders in the market are leaning towards the second scenario, which makes us assume a further downside in the price.
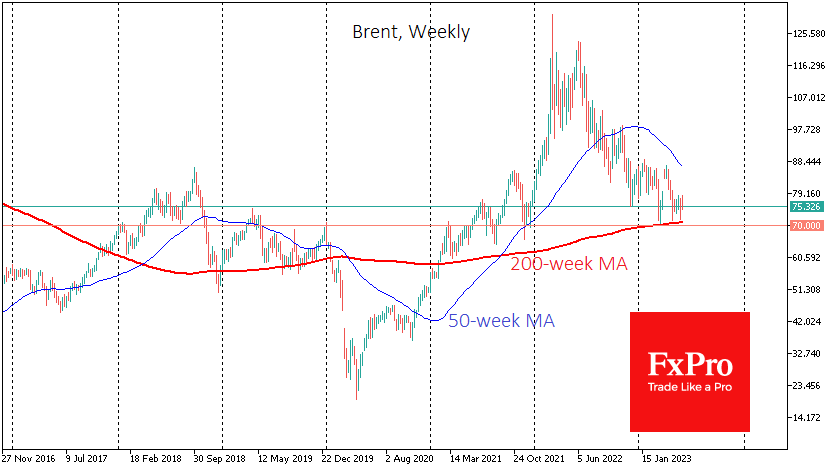
On the other hand, Saudi Arabia has stepped up its efforts to cut production as soon as the price of Brent drops to around $71 and WTI touches $65. Therefore, downside play is worth being cautious when approaching these levels.
That said, a breakout of these levels could look like a capitulation and trigger a big sell-off, like those in 2014 and 2020, when oil producers lost coordination. Technically, these levels coincided with price consolidation under the 200-week average. The market has already tested these levels ($67/bbl. WTI and 70.80/bbl. Brent) but bounced back.
Sunset Market Commentary
Markets
This morning’s hawkish rate hike by the Reserve Bank of Australia was set to be today’s sole highlight. The central bank unexpectedly raised its policy rate for a second meeting running by 25 bps after installing a pause back in April (Fed, are you listening?). On top, they worry more over upside inflation risks. This might even require some further tightening of policy in the future. The market impact remained restricted to Australian markets despite potentially being a global example. AUD/USD reached its strongest level since the start of the USD-comeback mid-May (0.6685). AUD swap yields added up to 7.4 bps at the front end (2y) with money markets almost completely discounting another 25 bps rate hike by the September meeting.
The eco & event calendar looked extremely dull in Europe and the US, but the ECB’s April Consumer Expectations’ Survey results caught investors by surprise. Although outdated, they managed to nonetheless trigger a market reaction as consumer inflation expectations decreased significantly, reversing most of the increases seen in Q1 this year. The median rate of perceived inflation over the previous 12 months decreased to 8.9% in April 2023, from 9.9% in March. Median expectations for inflation over the next 12 months decreased to 4.1% in April, from 5% in March, and those for inflation three years ahead decreased to 2.5%, from 2.9% in March. Uncertainty about inflation expectations 12 months ahead also decreased. Economic growth expectations for the next 12 months were less negative in April, standing at -0.8% compared with -1% in March. Expectations for the unemployment rate 12 months ahead decreased to 11.2% in April, from 11.7% in March. In the run-up to next week’s ECB meeting, markets obviously zoomed in on the inflation expectations component. While they don’t doubt the ECB’s commitment at the June and July policy meetings, it could result in a more balanced tone by ECB Lagarde at the Q&A session afterwards. German Bunds outperform US Treasuries today with German yields losing up to 4.7 bps at the front end of the curve. Daily US yield changes vary between +1.1 bp (30-yr) and +3.8 bps (2-yr). Loss of interest rate support pulls EUR/USD back below 1.07 (1.0677 currently) with EUR/GBP copying the move to a lesser extend (0.8608). Risk sentiment on stock markets is mildly negative.
News & Views
According to Czech statistical office (CZSO), industrial production in real terms declined 1.9% M/M to be 1.2% higher compared to the same month last year (WDA). According to CZSO ‘the April result of industry was mainly influenced by last year’s low comparison basis in manufacture of motor vehicles. The number of economic activities of industry in which production increased, year-on-year, decreased again. Manufacturing of motor vehicles and trailers increased by 30% Y/Y, but declined 5% M/M. Y/Y production also increased in electrical equipment, in repair and installation of machinery and equipment and in pharmaceutical products. New orders at current prices increased 2.7% Y/Y. Non-domestic orders declined 1.6% Y/Y, but domestic orders increased by 11.3%. Again the rise was mainly due to a low comparison base in the automotive industry last year. The average registered number of employees in industry decreased by 1.7% Y/Y. Their average gross monthly nominal wage increased 9.6% Y/Y. Other data also showed a further decline in construction output (-3.4% M/M and 6.4% Y/Y). Despite mediocre activity data, the Czech koruna remains well bid near EUR/CZK 23.51.
Hungarian retail sales suggest ongoing sluggish domestic demand. Alongside a significant base effect from last year, sales were 12.6% lower in April compared to the same month last year. Sales declined 8.6% Y/Y in food shops, by 10.7% in non-food shops and by 22.9% in automotive fuel retailing. Despite the domestic slowdown, the Hungarian forint holds near recent peak levels (EUR/HUF 368.5). The MNB last month started reducing the O/N deposit rate from 18% to 17%. In the view of the Hungarian central bank this was mainly inspired by a return of financial stability on Hungarian markets (including a solid performance of the forint) rather than by monetary policy considerations (inflation) or as a means to support demand.
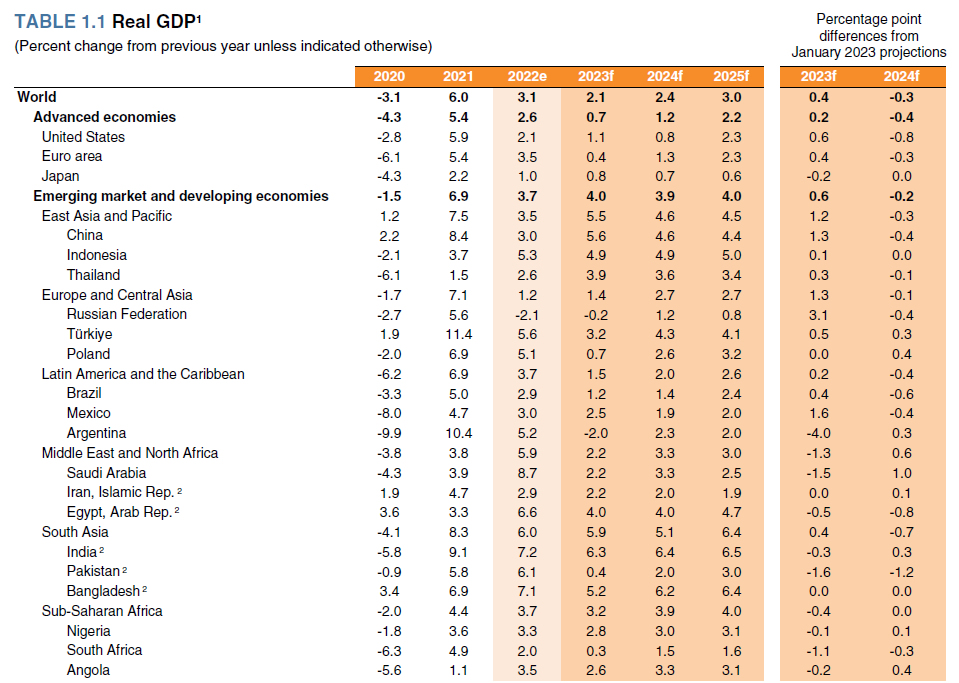
World bank upgrades 2023 global growth forecast to 2.1%
In the latest Global Economic Prospects, World Bank raised 2023 global growth forecast to 2.1%, from January's projection of 1.7%. Nevertheless, growth forecast for 2024 was downgraded from 2.7% to 2.4%. Growth is expected to accelerate further to 3.0% in 2025.
"Growth over the rest of 2023 is set to slow substantially as it is weighed down by the lagged and ongoing effects of monetary tightening, and more restrictive credit conditions," the report said.
"These factors are envisaged to continue to affect activity heading into next year, leaving global growth below previous projections."
EUR/USD Recovers Amid U.S. Debt and Employment Shifts
The most heavily traded currency pair, EUR/USD, experienced a rebound to 1.0720 following a significant downturn.
The concerns about U.S. public debt subsided after the proposal to increase the debt limit was endorsed first by the House of Representatives, followed by the Senate and the White House. This resolution was widely anticipated and successfully prevented a halt to federal government operations.
U.S. employment statistics for May presented a mixed picture. Non-farm payrolls (NFP) rose more than expected, surging by 339 thousand, which was welcome news. However, the average wage increase was modest, ticking up by a mere 0.3% month on month. This modest wage growth served to limit market dynamics.
Currency markets are now focusing their attention on the upcoming Federal Reserve meeting scheduled for next week. Investors are eager to know the Fed's stance: Will it pause its interest rate hike, or will the cycle continue? The market consensus on this matter remains divided.
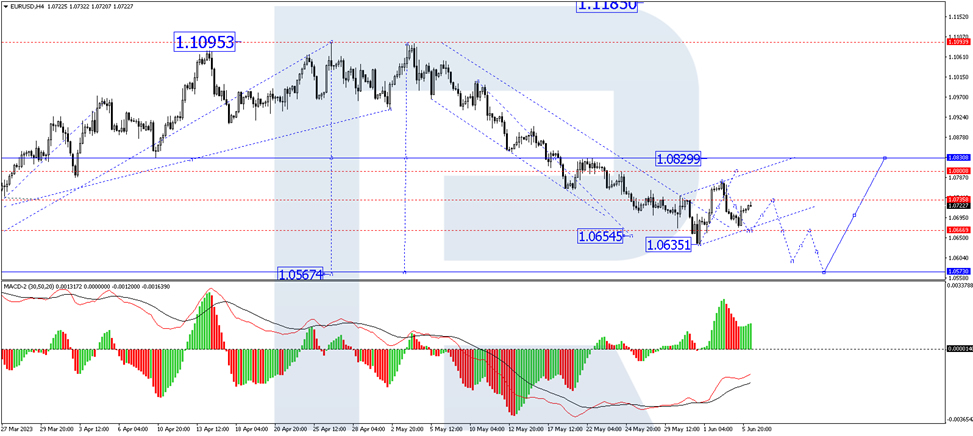
On a 4-hour chart (H4), EUR/USD corrected to 1.0762. The market is currently forming a downward impulse to 1.0666. Once this level is reached, an uptick towards 1.0735 may occur. Essentially, a consolidation range could form above 1.0666. An upward breakout from this range could trigger a correction towards 1.0830. Alternatively, a downward breakout could continue the bearish trend down to 1.0596. This technical scenario is supported by the Moving Average Convergence Divergence (MACD) indicator. Its signal line is below zero and poised for an upward move to test from below, followed by a potential drop to new lows.
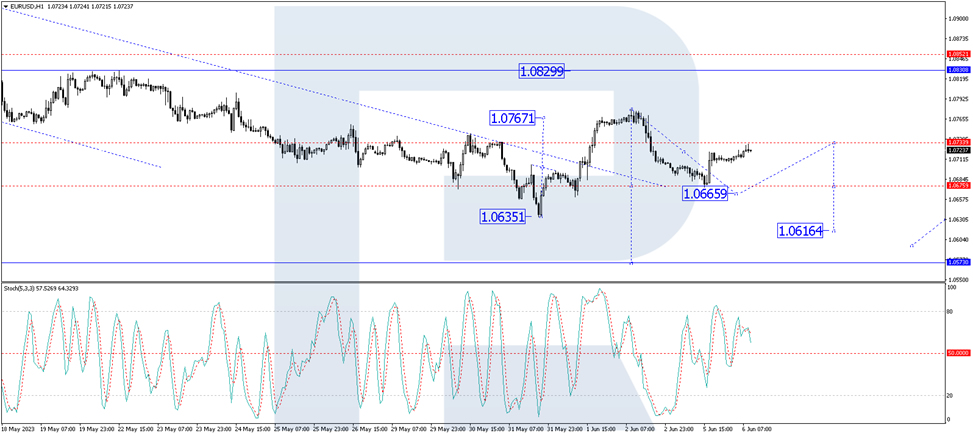
On the 1-hour chart (H1), EUR/USD is forming a downward wave structure towards 1.0666. Upon reaching this level, a corrective move towards 1.0700 may occur, followed by a drop to 1.0616. From this point, the bearish trend could persist down to 1.0573. This technical scenario is validated by the Stochastic oscillator. Its signal line is currently near the 50 level and could break lower, potentially declining to 20.
USD/JPY Mid-Day Outlook
Daily Pivots: (S1) 139.07; (P) 139.76; (R1) 140.27; More...
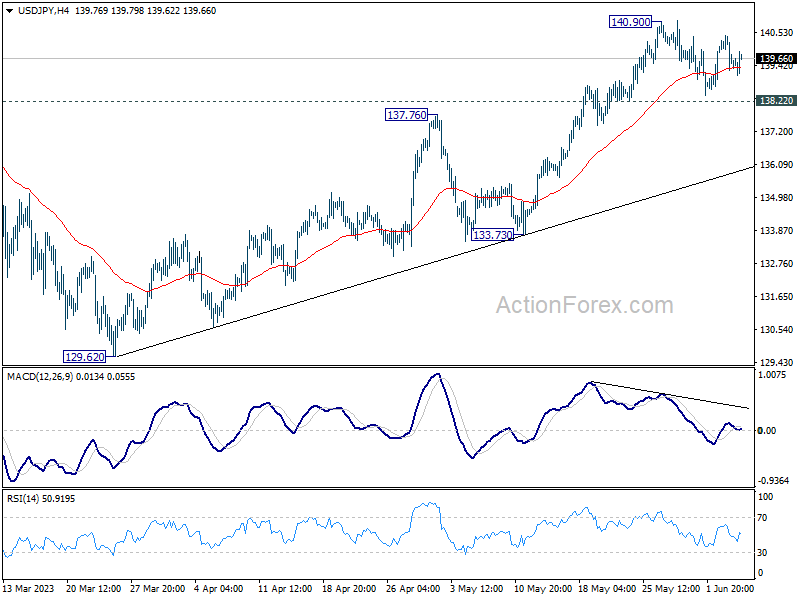
USD/JPY is still extending the consolidation from 140.90 and intraday bias stays neutral. Further rally is expected as long as 138.22 minor support holds. On the upside, break of 140.90 will resume larger rise from 127.20 to 142.48 fibonacci level. However, considering bearish divergence condition in 4 hour MACD, break of 138.22 will confirm short term topping, and turn bias back to the downside for 55 D EMA (now at 136.35).
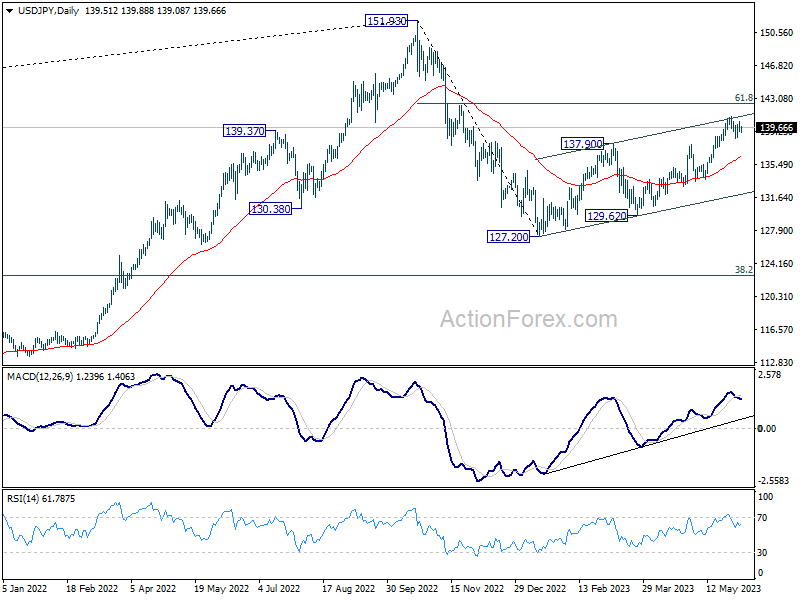
In the bigger picture, rise from 127.20 is seen as the second leg of the corrective pattern from 151.93 high. Stronger rally would be seen to 61.8% retracement of 151.93 to 127.20 at 136.34. Sustained break there will pave the way back to retest 151.93. On the downside, however, break of 133.73 support will argue that the pattern could have started the third leg through 127.20 low.
USD/CHF Mid-Day Outlook
Daily Pivots: (S1) 0.9037; (P) 0.9078; (R1) 0.9105; More...
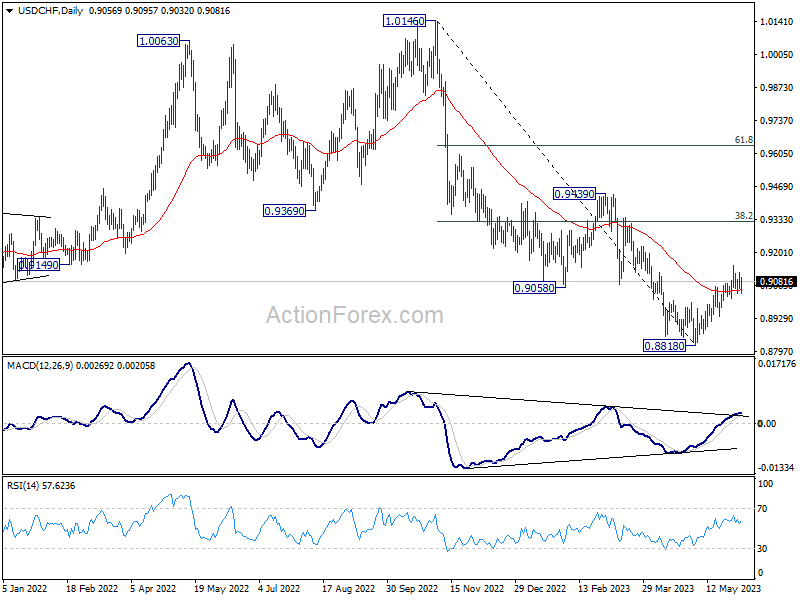
USD/CHF is staying in consolidation from 0.9146 and intraday bias remains neutral. Further rally is expected with 0.9013 support intact. . Rise from 0.8818 short term bottom is seen as correcting whole down trend from 1.0146. Above 0.9146 will target 38.2% retracement of 1.0146 to 0.8818 at 0.9325. On the downside, however, break of 0.9013 will turn bias back to the downside for retesting 0.8818 low instead.
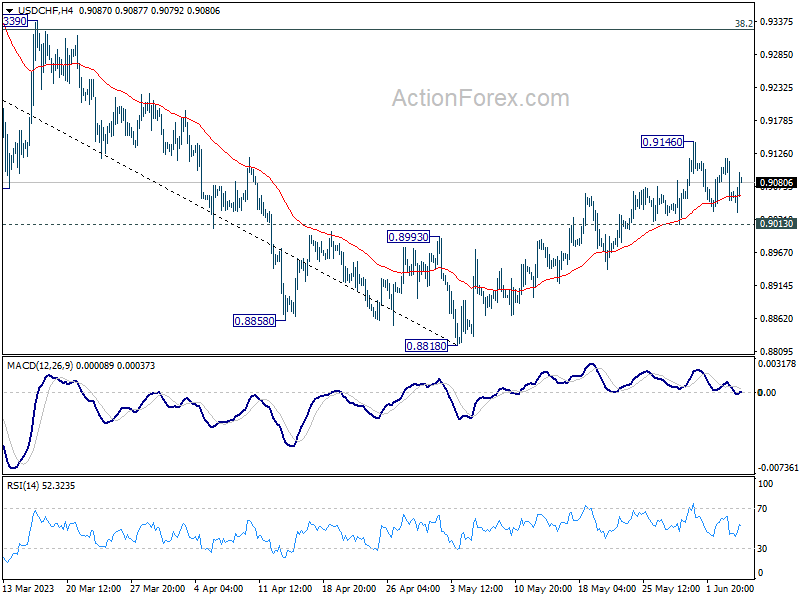
In the bigger picture, fall from 1.1046 (2022 high) is seen as a leg in the long term range pattern from 1.0342 (2016 high), which might have completed at 0.8818 already, just ahead of 0.8756 long term support. Sustained trading above 0.9058 support turned resistance should confirm medium term bottoming. Further break of 0.9439 resistance will confirm bullish trend reversal.