Sample Category Title
USD/CAD Weekly Outlook
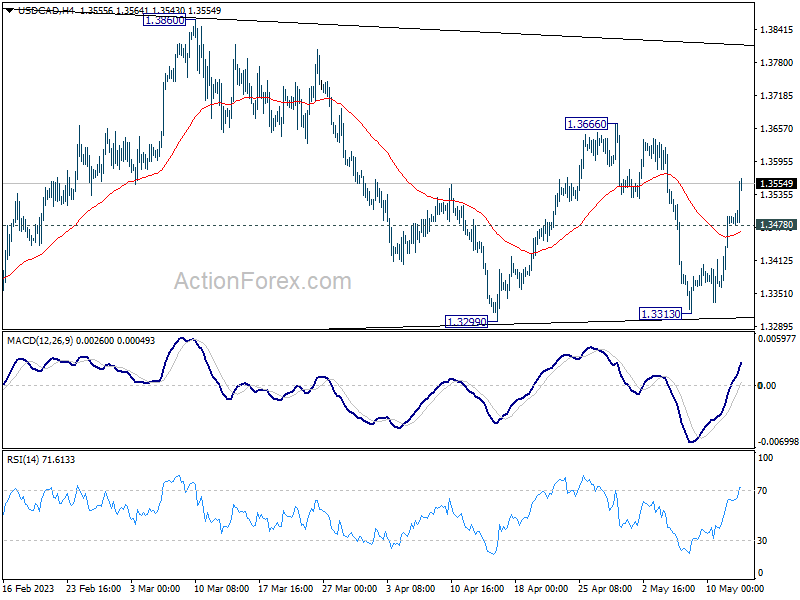
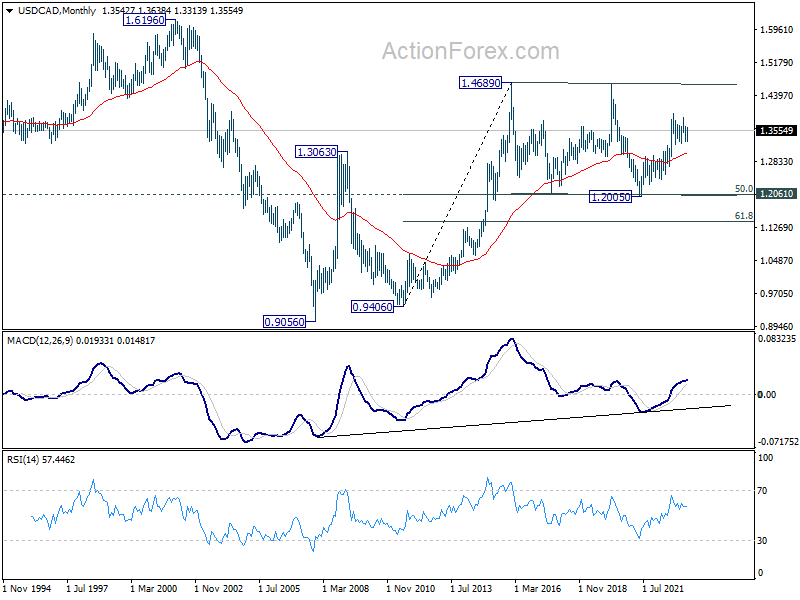
USD/CAD rebounded strongly ahead of 1.3299 support, after hitting 55 W EMA. The development suggests that it's possibly in another leg inside the triangle pattern from 1.3976. Initial bias is now mildly on the upside for 1.3666 resistance. Break there will target 1.3860 resistance next. On the downside, though, below 1.3478 minor support will turn intraday bias neutral instead.
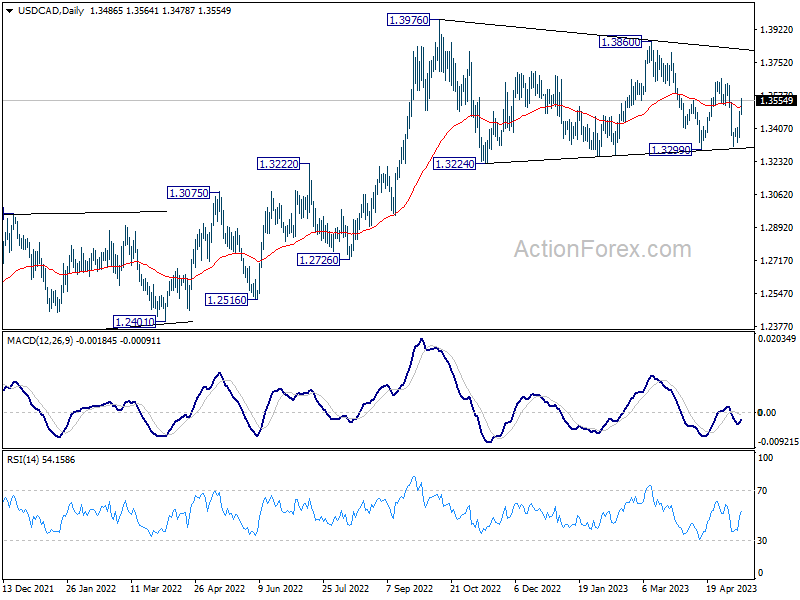
In the bigger picture, as long as 55 W EMA (now at 1.3321) holds, up trend from 1.2005 (2021 low) is still in favor to resume through 1.3976 at a later stage. However, sustained trading below the EMA and 38.2% retracement of 1.2005 to 1.3976 at 1.3233 will raise the chance of bearish reversal. Deeper should then be seen to 61.8% retracement at 1.2758 next.
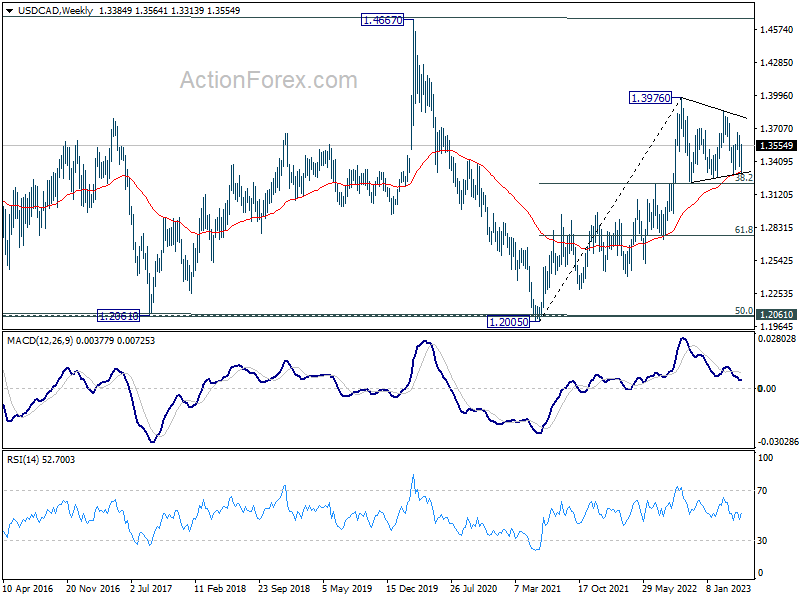
In the longer term picture, price actions from 1.4689 (2016 high) are seen as a consolidation pattern only, which might have completed at 1.2005. That is, up trend from 0.9506 (2007 low) is expected to resume at a later stage. This will remain the favored case as 55 M EMA (now at 1.3031) holds.
GBP/JPY Weekly Outlook
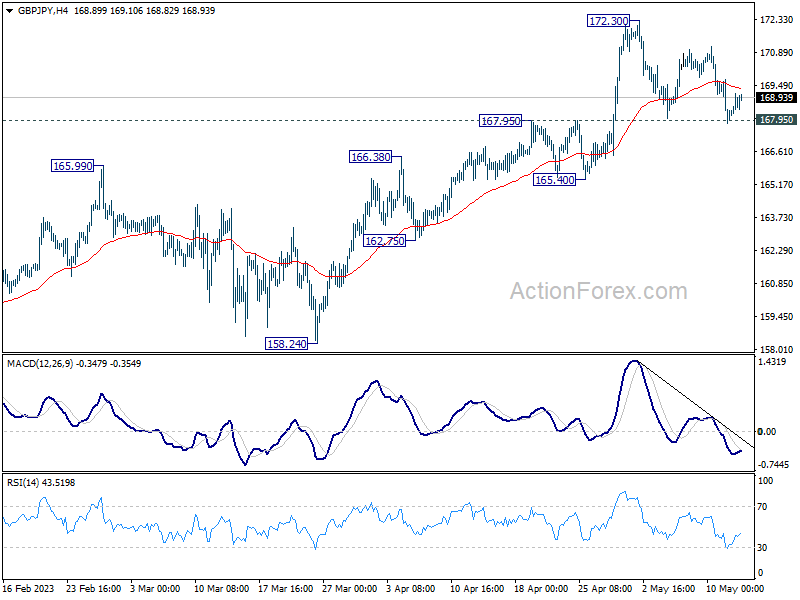
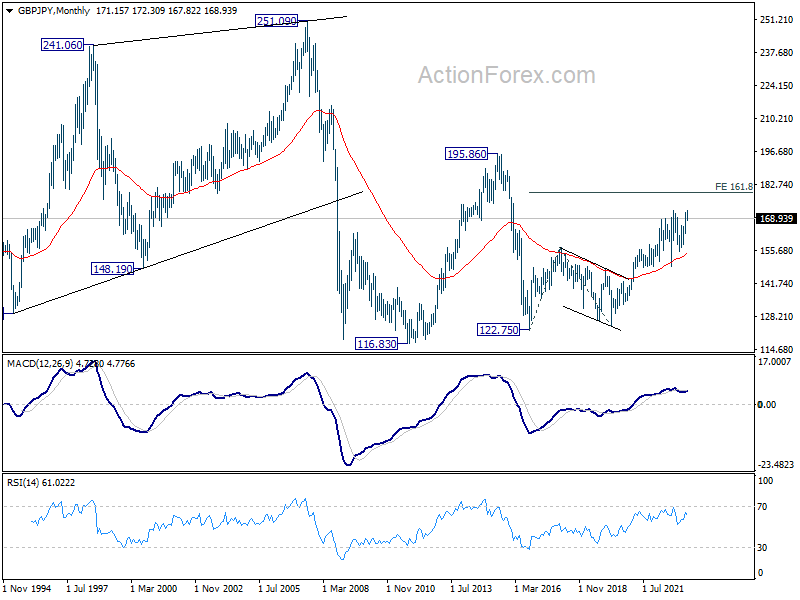
GBP/JPY is still holding on to 167.95 resistance turned support despite last week's decline. Initial bias remains neutral this week first. On the upside, break of 172.30 will resume larger up trend to 100% projection of 148.93 to 172.11 from 155.33 at 178.51. Nevertheless, firm break of 167.95 should confirm short term topping, and turn bias back to the downside for deeper pull back to 165.40 support and possible below instead.
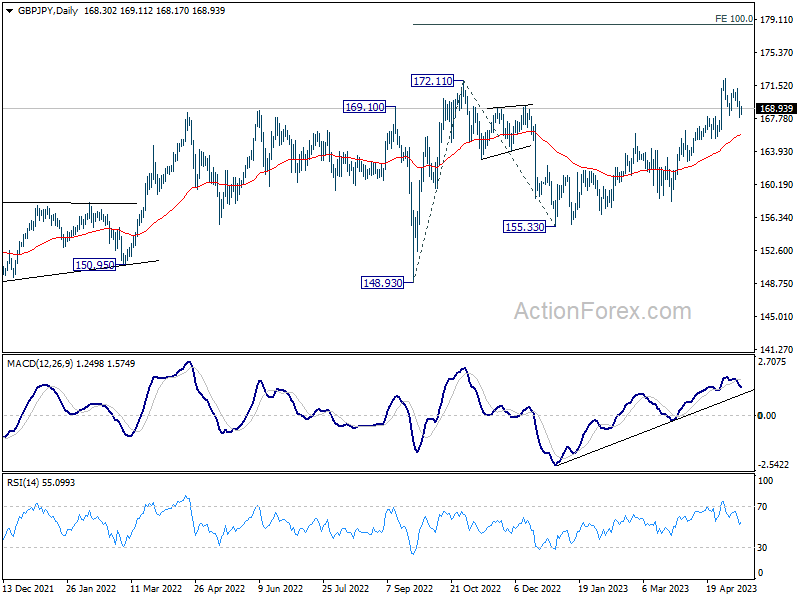
In the bigger picture, focus stays on 172.11 resistance (2022 high). Decisive break there will resume whole up trend from 123.94 (2020 low). Next target will be 161.8% projection of 122.75 (2016 low) to 156.59 (2018 high) from 123.94 at 178.69. Nevertheless, firm break of 165.40 support will indicate rejection by 172.11 and extend the corrective pattern from there with another falling leg.
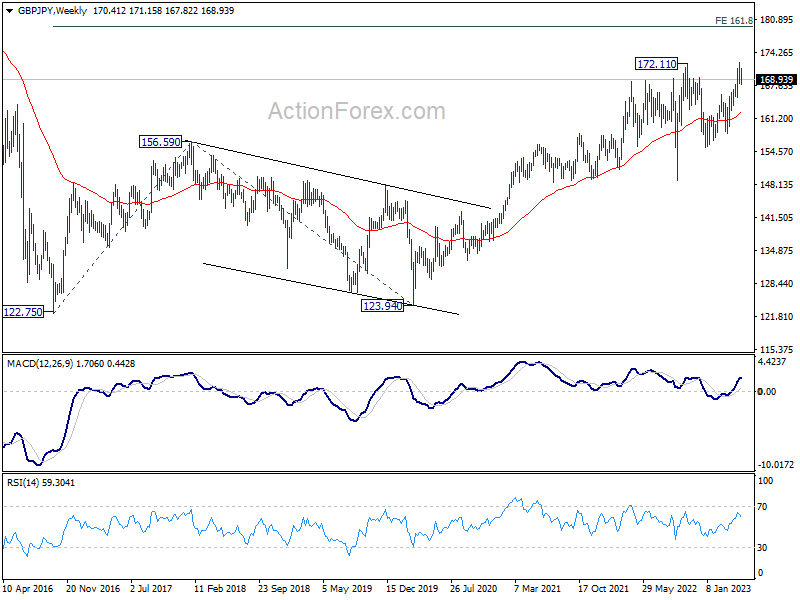
In the longer term picture, as long as 55 M EMA (now at 154.40) holds, rise from 122.75 (2016 low) could still extend higher at a later stage to 195.86 (2015 high).
EUR/JPY Weekly Outlook
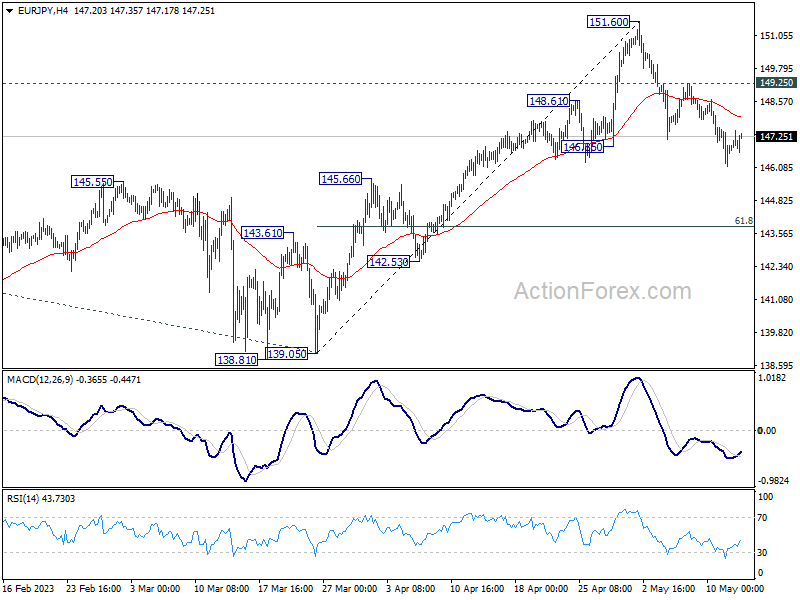
EUR/JPY's decline indicates that 151.60 is already a short term top. Further fall is in favor this week as long as 149.25 resistance holds. Sustained trading below 55 D EMA (now at 145.81 will bring deeper pull back to 61.8% retracement of 139.05 to 151.60 at 143.84. On the upside, though, firm break of 149.25 will turn bias back to the upside for retesting 151.60 high instead.
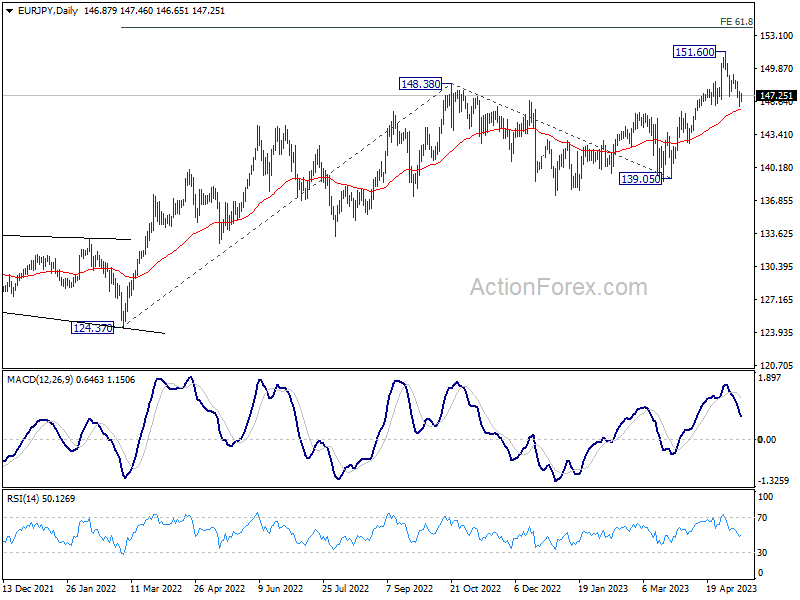
In the bigger picture, rise from 114.42 (2020 low) is in progress. Next target is 61.8% projection of 124.37 to 148.38 from 138.81 at 153.64. Sustained break there will pave the way to 100% projection at 162.82. For now, medium term outlook will remain bullish as long as 139.05 support holds, even in case of deep pull back.
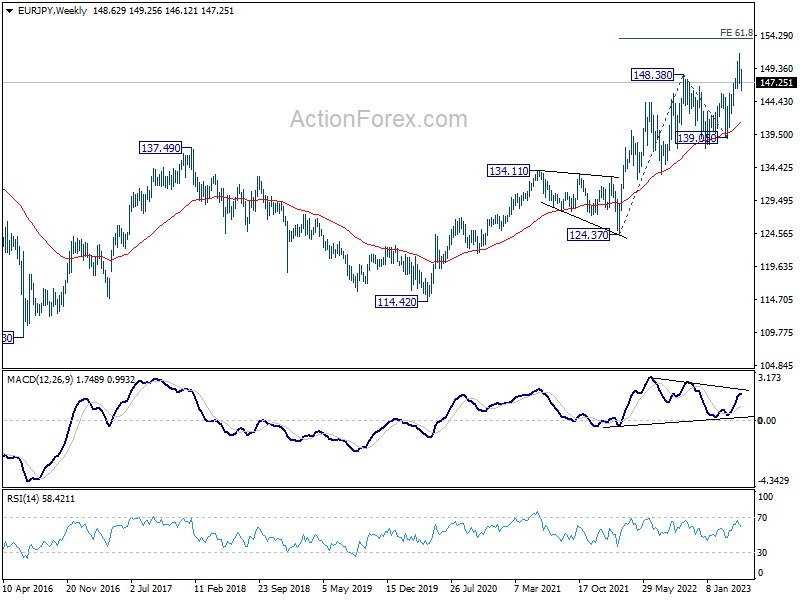
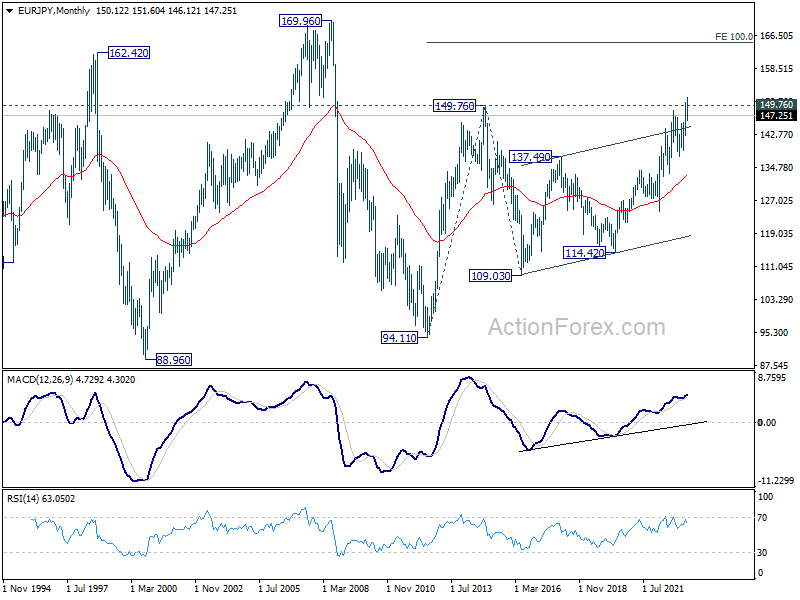
In the long term picture, break of 149.76 (2014 high) argues that whole up trend form 94.11 (2012 low) is resuming. Sustained trading above 149.76 will pave the way to 100% projection of 94.11 to 149.76 from 109.03 at 164.68, which is close to 169.96 (2008 high).
EUR/GBP Weekly Outlook
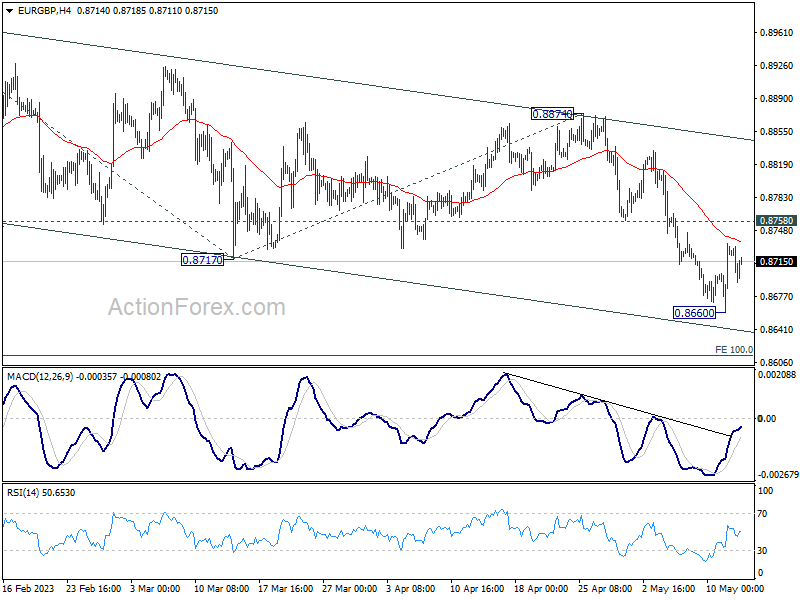
EUR/GBP dived through 0.8717 support to resume the whole decline form 0.8977. But a temporary low was formed after hitting 0.8660. Initial bias remains neutral this week first. On the downside, break of 0.8660 will resume recent decline to 100% projection of 0.8977 to 0.8717 from 0.8874 at 0.8614. Nevertheless, break of 0.8758 minor resistance will turn bias back to the upside for stronger rebound.
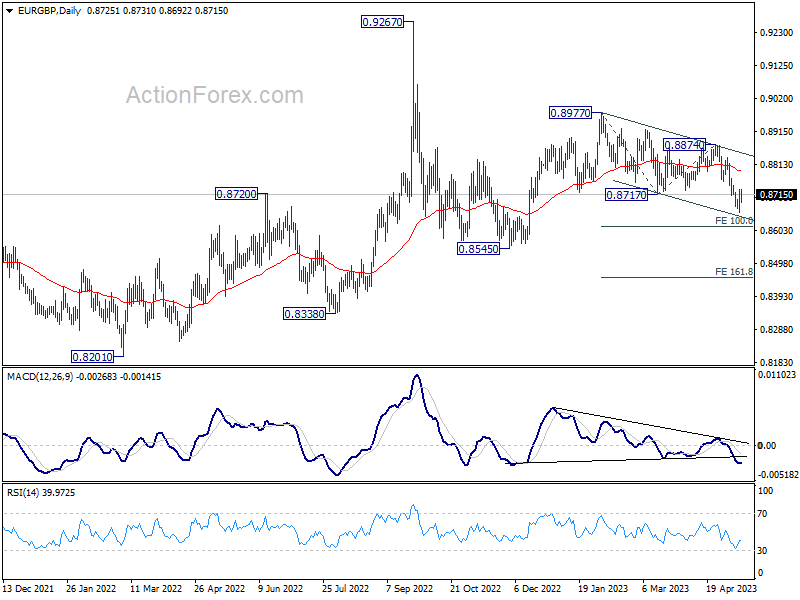
In the bigger picture, current development argues that whole decline from 0.9267 (2022 high) is still in progress. This is part of the long term range pattern from 0.9499 (2020 high). Deeper fall would be seen through 0.8545 support. his will now remain the favored case as long as 0.8874 resistance holds.
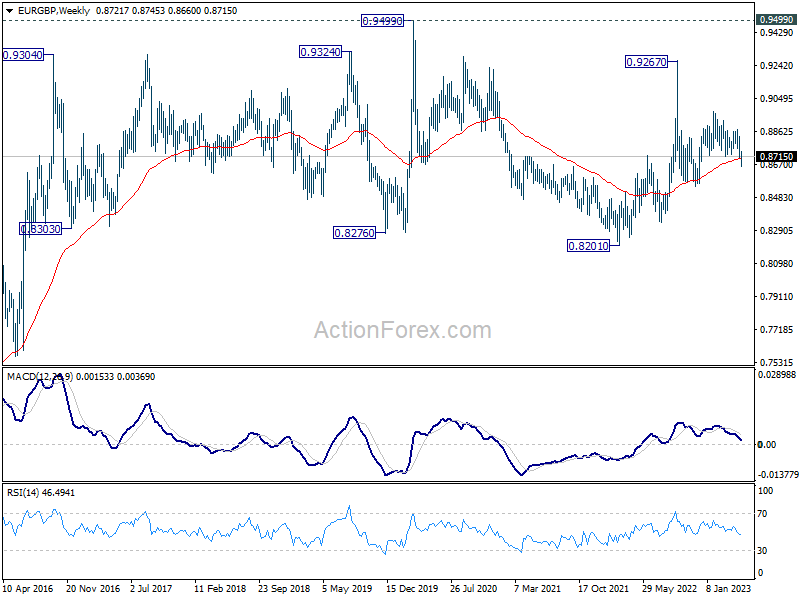
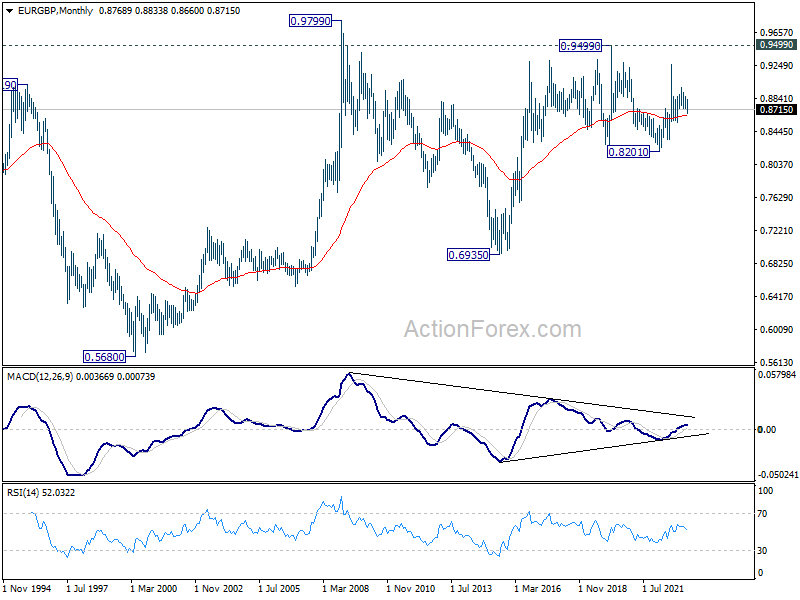
In the long term picture, long term range pattern is extending. But rise from 0.6935 (2015 low) is expected to extend at a later stage, to 0.9799 (2009 high).
EUR/AUD Weekly Outlook
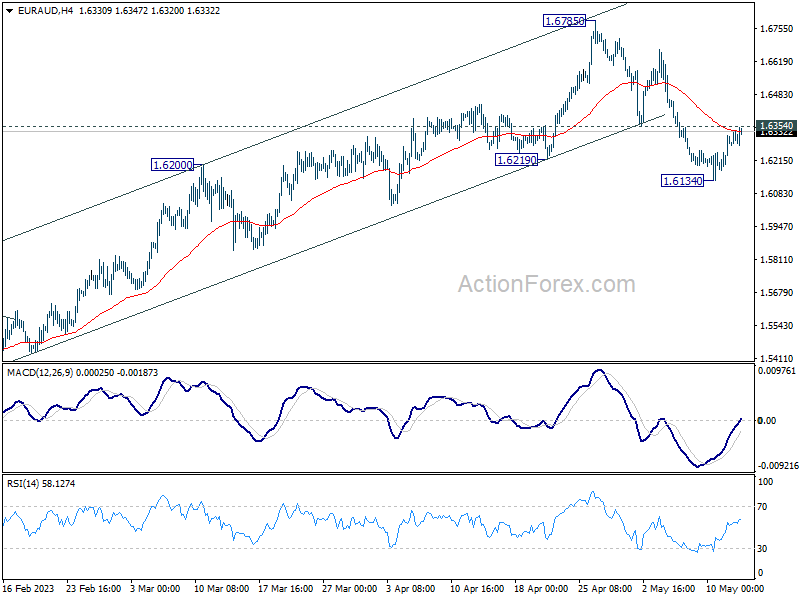
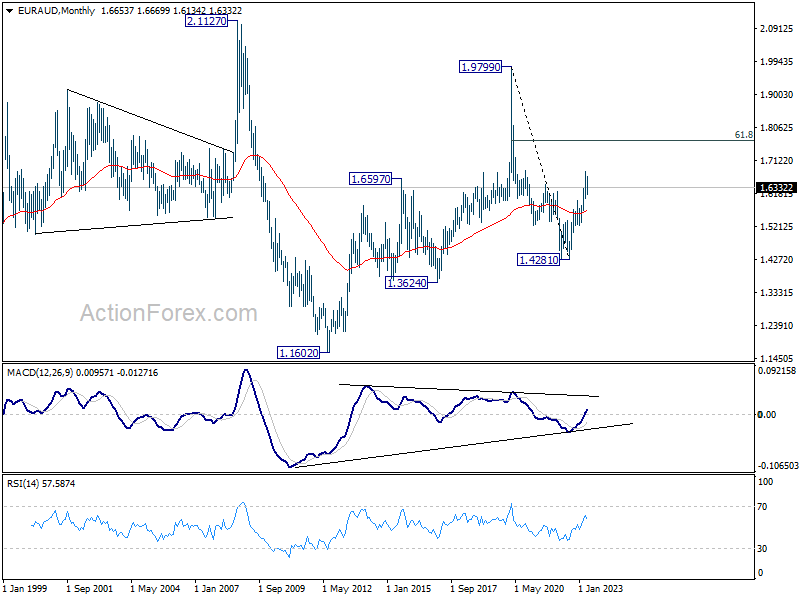
EUR/AUD's fall from 1.6785 resumed and hit as low as 1.6134 last week. But the cross then recovered after drawing support from 55 D EMA (now at 1.6201). Initial bias remains neutral this week first. Considering bearish divergence condition in D MACD, fall from 1.6785 might be a correction to whole up trend from 1.4281. Break of 1.6134 will target 38.2 retracement of 1.4281 to 1.6785 at 1.5828, which is inside 1.5254/5976 support zone. Nevertheless, sustained break of 1.6354 minor resistance will turn bias back to the upside for retesting 1.6785 high instead.
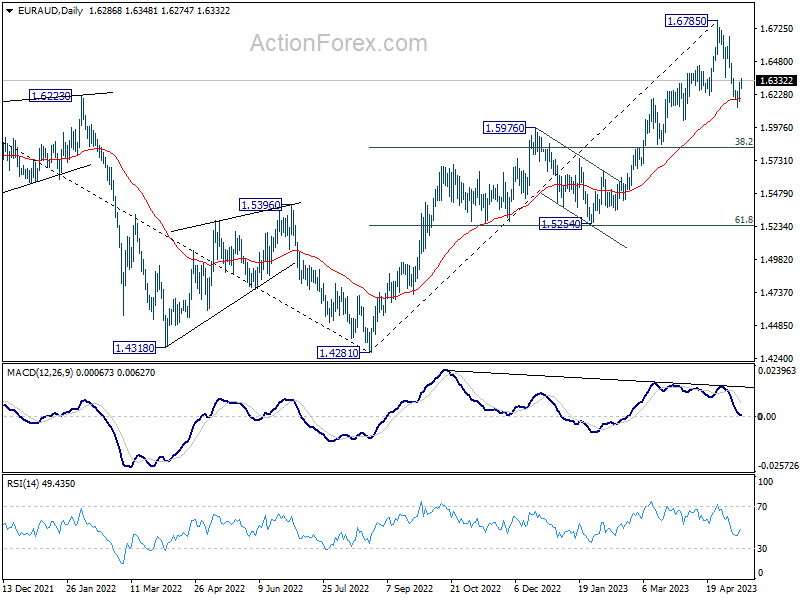
In the bigger picture, whole down trend from 1.9799 (2020 high) should have completed at 1.4281 (2022 low). Further rise should be seen to 61.8% retracement of 1.9799 to 1.4281 at 1.7691 next. For now, outlook will stay bullish as long as 1.5976 resistance turned support holds, even in case of deep pull back.
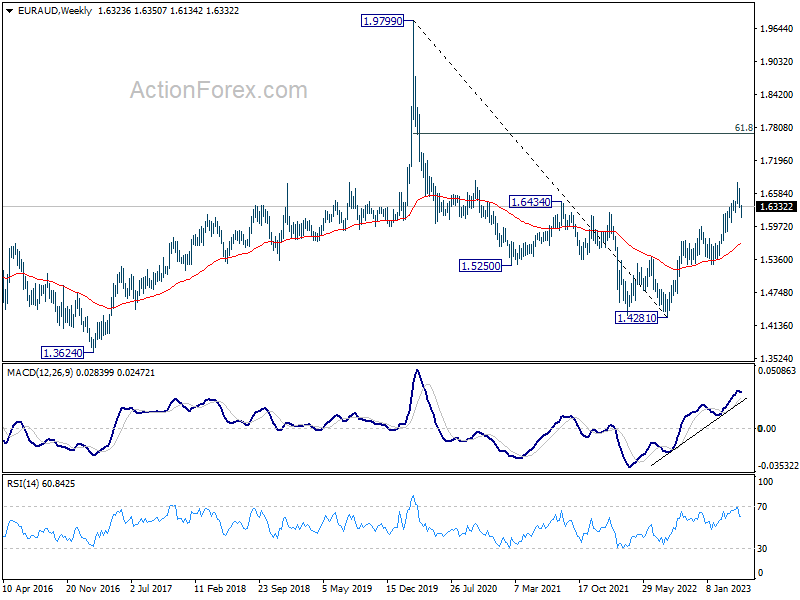
In the longer term picture, it's still early to decide if rise from 1.4281 is resuming whole up trend from 1.1602 (2012 low). Attention will be paid on the structure on the current rally to make an assessment later.
EUR/CHF Weekly Outlook
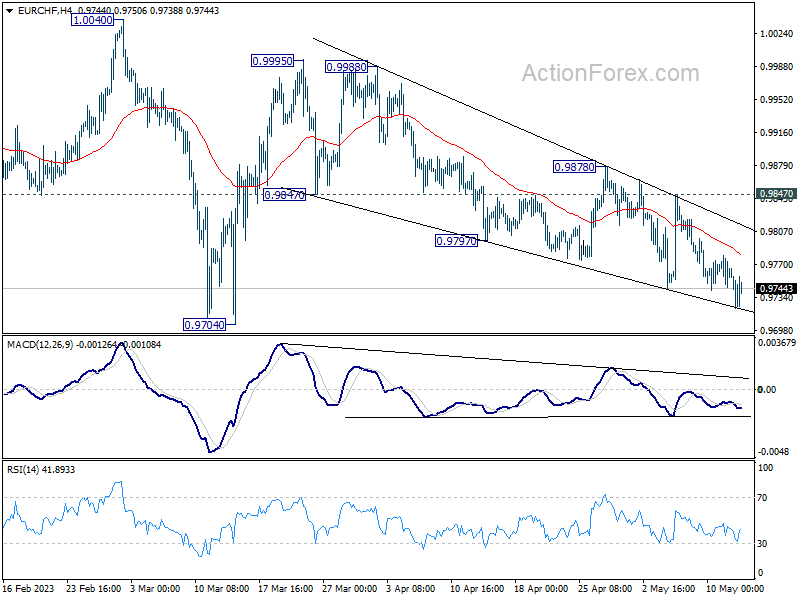
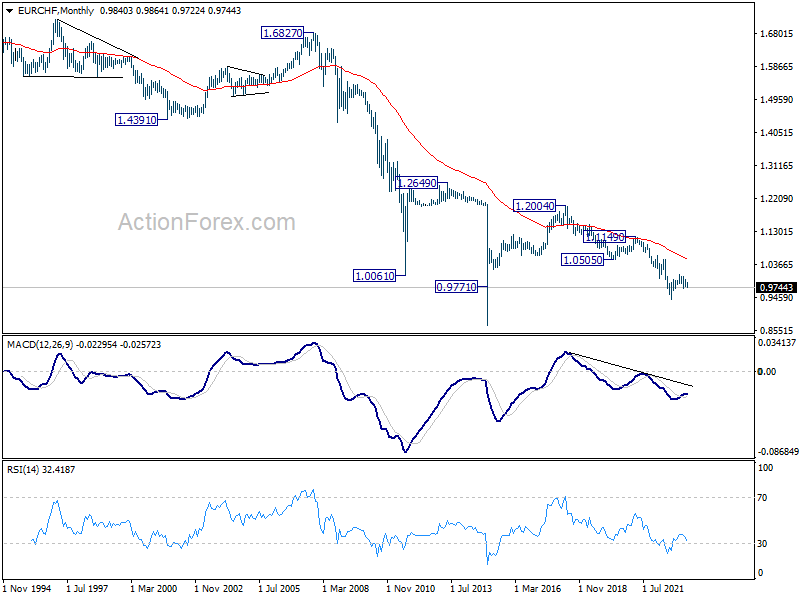
EUR/CHF's choppy decline from 0.9995 extended lower last week. Initial bias is now on the downside this week for 0.9074 support. Strong support should be seen there to bring rebound. Break of 0.9847 will argue that the fall has completed and turn bias back to the downside. However, firm break of 0.9704 will resume the whole decline from 1.0095 to 61.8% retracement of 0.9407 to 1.0095 at 0.9670.
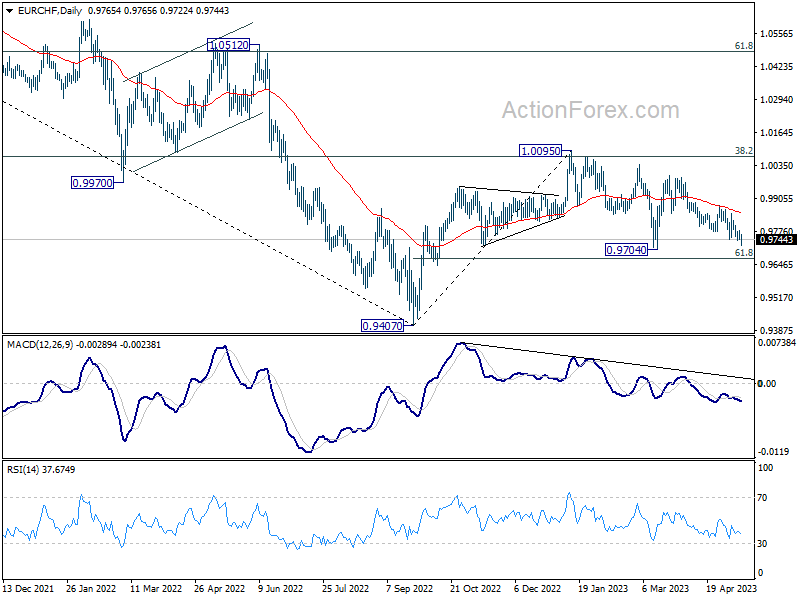
In the bigger picture, prior rejection by 38.2% retracement of 1.1149 to 0.9407 at 1.0072 suggests that medium term outlook is staying bearish. The pair is also capped below 55 W EMA (now at 0.9963). Down trend from 1.2004 is not completed yet and is in favor to resume through 0.9407 at a later stage. However, decisive break of 1.0095 resistance will raise the chance of bullish trend reversal. Rise from 0.9407 should then target 1.0505 cluster resistance (2020 low at 1.0505, 61.8% retracement of 1.1149 to 0.9407 at 1.1484).
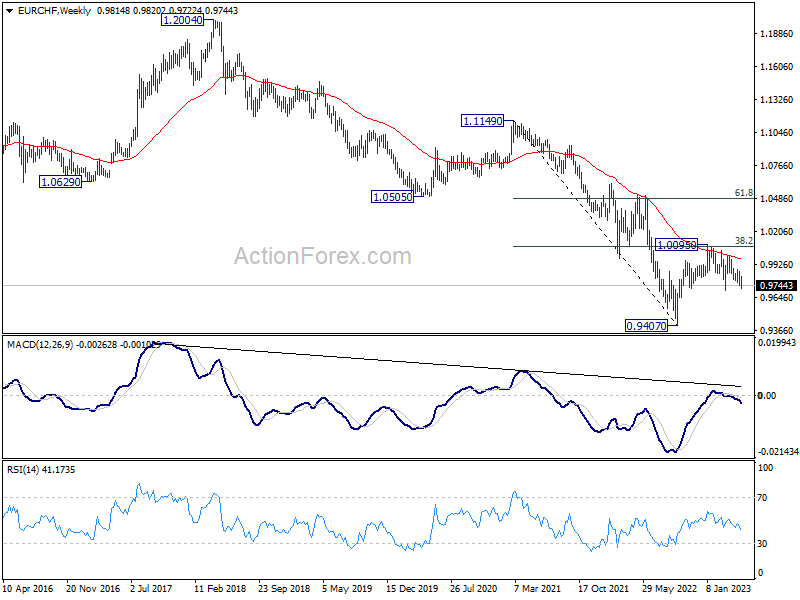
In the long term picture, it's still way too early too call for bullish trend reversal with upside capped well below 55 M EMA (now at 1.0515) and 1.0505 support turned resistance (2020 low). The multi-decade down trend could still continue.
Summary 5/15 – 5/19
Monday, May 15, 2023
| GMT | Ccy | Events | Consensus | Previous |
|---|---|---|---|---|
| 22:30 | NZD | Business NZ PSI Apr | 54.4 | |
| 23:50 | JPY | PPI Y/Y Apr | 5.60% | 7.20% |
| 06:30 | CHF | Producer and Import Prices M/M Apr | -0.10% | 0.20% |
| 06:30 | CHF | Producer and Import Prices Y/Y Apr | 1.10% | 2.10% |
| 09:00 | EUR | EU Economic Forecasts | ||
| 09:00 | EUR | Eurozone Industrial Production M/M Mar | -1.20% | 1.50% |
| 12:15 | CAD | Housing Starts Y/Y Apr | 214K | |
| 12:30 | CAD | Wholesale Sales M/M Mar | 0.20% | -1.70% |
| 12:30 | USD | Empire State Manufacturing Index May | -1.9 | 10.8 |
| GMT | Ccy | Events | |
|---|---|---|---|
| 22:30 | NZD | Business NZ PSI Apr | |
| Forecast: | Previous: 54.4 | ||
| 23:50 | JPY | PPI Y/Y Apr | |
| Forecast: 5.60% | Previous: 7.20% | ||
| 06:30 | CHF | Producer and Import Prices M/M Apr | |
| Forecast: -0.10% | Previous: 0.20% | ||
| 06:30 | CHF | Producer and Import Prices Y/Y Apr | |
| Forecast: 1.10% | Previous: 2.10% | ||
| 09:00 | EUR | EU Economic Forecasts | |
| Forecast: | Previous: | ||
| 09:00 | EUR | Eurozone Industrial Production M/M Mar | |
| Forecast: -1.20% | Previous: 1.50% | ||
| 12:15 | CAD | Housing Starts Y/Y Apr | |
| Forecast: | Previous: 214K | ||
| 12:30 | CAD | Wholesale Sales M/M Mar | |
| Forecast: 0.20% | Previous: -1.70% | ||
| 12:30 | USD | Empire State Manufacturing Index May | |
| Forecast: -1.9 | Previous: 10.8 | ||
Tuesday, May 16, 2023
| GMT | Ccy | Events | Consensus | Previous |
|---|---|---|---|---|
| 01:30 | AUD | RBA Meeting Minutes | ||
| 02:00 | CNY | Industrial Production Y/Y Apr | 10.10% | 3.90% |
| 02:00 | CNY | Fixed Asset Investment YTD Y/Y Apr | 5.20% | 5.10% |
| 02:00 | CNY | Retail Sales Y/Y Apr | 20.10% | 10.60% |
| 06:00 | GBP | Claimant Count Change Apr | 31.2K | 28.2K |
| 06:00 | GBP | ILO Unemployment Rate (3M) Mar | 3.80% | 3.80% |
| 06:00 | GBP | Average Earnings Including Bonus 3M/Y Mar | 5.10% | 5.90% |
| 06:00 | GBP | Average Earnings Excluding Bonus 3M/Y Mar | 6.80% | 6.60% |
| 06:00 | GBP | Claimant Count Rate Apr | 3.90% | |
| 09:00 | EUR | Eurozone Trade Balance (EUR) Mar | 5.6B | -0.1B |
| 09:00 | EUR | Eurozone GDP Q/Q Q1 P | 0.10% | 0.10% |
| 09:00 | EUR | Germany ZEW Economic Sentiment May | -5 | 4.1 |
| 09:00 | EUR | Germany ZEW Current Situation May | -35.3 | -32.5 |
| 09:00 | EUR | Eurozone ZEW Economic Sentiment May | 2.3 | 6.4 |
| 09:00 | EUR | Eurozone Employment Change Q/Q Q1 P | 0.30% | 0.30% |
| 12:30 | CAD | Manufacturing Sales M/M Mar | -3.60% | |
| 12:30 | CAD | CPI M/M Apr | 0.90% | 0.50% |
| 12:30 | CAD | CPI Y/Y Apr | 4.30% | |
| 12:30 | CAD | CPI Median Y/Y Apr | 4.60% | |
| 12:30 | CAD | CPI Trimmed Y/Y Apr | 4.40% | |
| 12:30 | CAD | CPI Common Y/Y Apr | 5.90% | |
| 12:30 | USD | Retail Sales M/M Apr | 0.70% | -0.60% |
| 12:30 | USD | Retail Sales ex Autos M/M Apr | 0.30% | -0.40% |
| 13:15 | USD | Industrial Production M/M Apr | 0.00% | 0.40% |
| 13:15 | USD | Capacity Utilization Apr | 79.70% | 79.80% |
| 14:00 | USD | Business Inventories Mar | 0.10% | 0.20% |
| 14:00 | USD | NAHB Housing Market Index May | 45 | 45 |
| 23:50 | JPY | GDP Annualized Q1 P | 0.20% | 0.10% |
| 23:50 | JPY | GDP Deflator Y/Y Q1 P | 2.00% | 1.20% |
| GMT | Ccy | Events | |
|---|---|---|---|
| 01:30 | AUD | RBA Meeting Minutes | |
| Forecast: | Previous: | ||
| 02:00 | CNY | Industrial Production Y/Y Apr | |
| Forecast: 10.10% | Previous: 3.90% | ||
| 02:00 | CNY | Fixed Asset Investment YTD Y/Y Apr | |
| Forecast: 5.20% | Previous: 5.10% | ||
| 02:00 | CNY | Retail Sales Y/Y Apr | |
| Forecast: 20.10% | Previous: 10.60% | ||
| 06:00 | GBP | Claimant Count Change Apr | |
| Forecast: 31.2K | Previous: 28.2K | ||
| 06:00 | GBP | ILO Unemployment Rate (3M) Mar | |
| Forecast: 3.80% | Previous: 3.80% | ||
| 06:00 | GBP | Average Earnings Including Bonus 3M/Y Mar | |
| Forecast: 5.10% | Previous: 5.90% | ||
| 06:00 | GBP | Average Earnings Excluding Bonus 3M/Y Mar | |
| Forecast: 6.80% | Previous: 6.60% | ||
| 06:00 | GBP | Claimant Count Rate Apr | |
| Forecast: | Previous: 3.90% | ||
| 09:00 | EUR | Eurozone Trade Balance (EUR) Mar | |
| Forecast: 5.6B | Previous: -0.1B | ||
| 09:00 | EUR | Eurozone GDP Q/Q Q1 P | |
| Forecast: 0.10% | Previous: 0.10% | ||
| 09:00 | EUR | Germany ZEW Economic Sentiment May | |
| Forecast: -5 | Previous: 4.1 | ||
| 09:00 | EUR | Germany ZEW Current Situation May | |
| Forecast: -35.3 | Previous: -32.5 | ||
| 09:00 | EUR | Eurozone ZEW Economic Sentiment May | |
| Forecast: 2.3 | Previous: 6.4 | ||
| 09:00 | EUR | Eurozone Employment Change Q/Q Q1 P | |
| Forecast: 0.30% | Previous: 0.30% | ||
| 12:30 | CAD | Manufacturing Sales M/M Mar | |
| Forecast: | Previous: -3.60% | ||
| 12:30 | CAD | CPI M/M Apr | |
| Forecast: 0.90% | Previous: 0.50% | ||
| 12:30 | CAD | CPI Y/Y Apr | |
| Forecast: | Previous: 4.30% | ||
| 12:30 | CAD | CPI Median Y/Y Apr | |
| Forecast: | Previous: 4.60% | ||
| 12:30 | CAD | CPI Trimmed Y/Y Apr | |
| Forecast: | Previous: 4.40% | ||
| 12:30 | CAD | CPI Common Y/Y Apr | |
| Forecast: | Previous: 5.90% | ||
| 12:30 | USD | Retail Sales M/M Apr | |
| Forecast: 0.70% | Previous: -0.60% | ||
| 12:30 | USD | Retail Sales ex Autos M/M Apr | |
| Forecast: 0.30% | Previous: -0.40% | ||
| 13:15 | USD | Industrial Production M/M Apr | |
| Forecast: 0.00% | Previous: 0.40% | ||
| 13:15 | USD | Capacity Utilization Apr | |
| Forecast: 79.70% | Previous: 79.80% | ||
| 14:00 | USD | Business Inventories Mar | |
| Forecast: 0.10% | Previous: 0.20% | ||
| 14:00 | USD | NAHB Housing Market Index May | |
| Forecast: 45 | Previous: 45 | ||
| 23:50 | JPY | GDP Annualized Q1 P | |
| Forecast: 0.20% | Previous: 0.10% | ||
| 23:50 | JPY | GDP Deflator Y/Y Q1 P | |
| Forecast: 2.00% | Previous: 1.20% | ||
Wednesday, May 17, 2023
| GMT | Ccy | Events | Consensus | Previous |
|---|---|---|---|---|
| 00:30 | AUD | Westpac Leading Index M/M Apr | -0.01% | |
| 01:30 | AUD | Wage Price Index Q/Q Q1 | 0.90% | 0.80% |
| 04:30 | JPY | Industrial Production M/M Mar F | 0.80% | 0.80% |
| 08:00 | EUR | Italy Trade Balance (EUR) Mar | 2.50B | 2.11B |
| 09:00 | EUR | Eurozone CPI Y/Y Apr F | 7.00% | 7.00% |
| 09:00 | EUR | Eurozone CPI Core Y/Y Apr F | 5.60% | 5.60% |
| 12:30 | USD | Housing Starts Apr | 1.40M | 1.42M |
| 12:30 | USD | Building Permits Apr | 1.44M | 1.43M |
| 14:30 | USD | Crude Oil Inventories | 3.0M | |
| 22:45 | NZD | PPI Input Q/Q Q1 | 0.50% | |
| 22:45 | NZD | PPI Output Q/Q Q1 | 0.90% | |
| 23:50 | JPY | Trade Balance (JPY) Apr | -1.08T | -1.21T |
| GMT | Ccy | Events | |
|---|---|---|---|
| 00:30 | AUD | Westpac Leading Index M/M Apr | |
| Forecast: | Previous: -0.01% | ||
| 01:30 | AUD | Wage Price Index Q/Q Q1 | |
| Forecast: 0.90% | Previous: 0.80% | ||
| 04:30 | JPY | Industrial Production M/M Mar F | |
| Forecast: 0.80% | Previous: 0.80% | ||
| 08:00 | EUR | Italy Trade Balance (EUR) Mar | |
| Forecast: 2.50B | Previous: 2.11B | ||
| 09:00 | EUR | Eurozone CPI Y/Y Apr F | |
| Forecast: 7.00% | Previous: 7.00% | ||
| 09:00 | EUR | Eurozone CPI Core Y/Y Apr F | |
| Forecast: 5.60% | Previous: 5.60% | ||
| 12:30 | USD | Housing Starts Apr | |
| Forecast: 1.40M | Previous: 1.42M | ||
| 12:30 | USD | Building Permits Apr | |
| Forecast: 1.44M | Previous: 1.43M | ||
| 14:30 | USD | Crude Oil Inventories | |
| Forecast: | Previous: 3.0M | ||
| 22:45 | NZD | PPI Input Q/Q Q1 | |
| Forecast: | Previous: 0.50% | ||
| 22:45 | NZD | PPI Output Q/Q Q1 | |
| Forecast: | Previous: 0.90% | ||
| 23:50 | JPY | Trade Balance (JPY) Apr | |
| Forecast: -1.08T | Previous: -1.21T | ||
Thursday, May 18, 2023
| GMT | Ccy | Events | Consensus | Previous |
|---|---|---|---|---|
| 01:30 | AUD | Employment Change Apr | 25K | 53K |
| 01:30 | AUD | Unemployment Rate Apr | 3.50% | 3.50% |
| 12:30 | CAD | New Housing Price Index M/M Apr | 0.00% | |
| 12:30 | USD | Initial Jobless Claims (May 12) | 260K | 264K |
| 12:30 | USD | Philadelphia Fed Survey May | -20 | -31.3 |
| 14:00 | USD | Existing Home Sales Apr | 4.35M | 4.44M |
| 14:30 | USD | Natural Gas Storage | 78B | |
| 22:45 | NZD | Trade Balance (NZD) Apr | -1273M | |
| 23:01 | GBP | GfK Consumer Confidence May | -27 | -30 |
| 23:30 | JPY | National CPI Y/Y Apr | 3.20% | |
| 23:30 | JPY | National CPI Core Y/Y Apr | 3.40% | 3.10% |
| 23:30 | JPY | National CPI Core-core Y/Y Apr | 3.80% |
| GMT | Ccy | Events | |
|---|---|---|---|
| 01:30 | AUD | Employment Change Apr | |
| Forecast: 25K | Previous: 53K | ||
| 01:30 | AUD | Unemployment Rate Apr | |
| Forecast: 3.50% | Previous: 3.50% | ||
| 12:30 | CAD | New Housing Price Index M/M Apr | |
| Forecast: | Previous: 0.00% | ||
| 12:30 | USD | Initial Jobless Claims (May 12) | |
| Forecast: 260K | Previous: 264K | ||
| 12:30 | USD | Philadelphia Fed Survey May | |
| Forecast: -20 | Previous: -31.3 | ||
| 14:00 | USD | Existing Home Sales Apr | |
| Forecast: 4.35M | Previous: 4.44M | ||
| 14:30 | USD | Natural Gas Storage | |
| Forecast: | Previous: 78B | ||
| 22:45 | NZD | Trade Balance (NZD) Apr | |
| Forecast: | Previous: -1273M | ||
| 23:01 | GBP | GfK Consumer Confidence May | |
| Forecast: -27 | Previous: -30 | ||
| 23:30 | JPY | National CPI Y/Y Apr | |
| Forecast: | Previous: 3.20% | ||
| 23:30 | JPY | National CPI Core Y/Y Apr | |
| Forecast: 3.40% | Previous: 3.10% | ||
| 23:30 | JPY | National CPI Core-core Y/Y Apr | |
| Forecast: | Previous: 3.80% | ||
Friday, May 19, 2023
| GMT | Ccy | Events | Consensus | Previous |
|---|---|---|---|---|
| 04:30 | JPY | Tertiary Industry Index M/M Mar | -0.10% | 0.70% |
| 06:00 | EUR | Germany PPI M/M Apr | -2.60% | |
| 06:00 | EUR | Germany PPI Y/Y Apr | 7.50% | |
| 08:00 | EUR | ECB Economic Bulletin | ||
| 12:30 | CAD | Retail Sales M/M Mar | -0.20% | |
| 12:30 | CAD | Retail Sales ex Autos M/M Mar | -0.70% |
| GMT | Ccy | Events | |
|---|---|---|---|
| 04:30 | JPY | Tertiary Industry Index M/M Mar | |
| Forecast: -0.10% | Previous: 0.70% | ||
| 06:00 | EUR | Germany PPI M/M Apr | |
| Forecast: | Previous: -2.60% | ||
| 06:00 | EUR | Germany PPI Y/Y Apr | |
| Forecast: | Previous: 7.50% | ||
| 08:00 | EUR | ECB Economic Bulletin | |
| Forecast: | Previous: | ||
| 12:30 | CAD | Retail Sales M/M Mar | |
| Forecast: | Previous: -0.20% | ||
| 12:30 | CAD | Retail Sales ex Autos M/M Mar | |
| Forecast: | Previous: -0.70% | ||
Weekly Economic & Financial Commentary: Will FOMC Really Cut Rates in Second Half of the Year?
Summary
United States: Inroads Slowly Being Made on the Inflation Fight
- Inflation remains uncomfortably high in the U.S. In April, the CPI rose 0.4% on both a headline and core basis, keeping the core running at a 5.1% three-month annualized rate. However, details pointed to price growth easing ahead, while the Producer Price Index and NFIB small business survey also suggested more meaningful disinflation is on its way. Consumers aren't so sure.
- Next week: Retail Sales (Tue), Existing Home Sales (Tue), LEI (Thu)
International: Bank of England Hikes Rates, Mixed Q1 Growth Trends in the U.K.
- The Bank of England (BoE) raised its Bank Rate by 25 bps to 4.50%, signaling it will keep a close eye on inflation dynamics this year. In addition, GDP data revealed the U.K. economy expanded 0.1% quarter-over-quarter in Q1. Household consumption was notably flat over the quarter, investment was significantly stronger than expected and the services sector faced mixed performance.
- Next week: China Activity (Tue), Japan GDP & CPI (Wed/Fri), Bank of Mexico Rate Decision (Thu)
Interest Rate Watch: Will the FOMC Really Cut Rates in the Second Half of the Year?
- The bond market is currently priced for 75 bps of Fed easing by the end of the year. One interpretation of that pricing is a 25% probability of 300 bps worth of easing coupled with a 75% probability of no easing. The FOMC could conceivably cut by 300 bps if something "bad" happens.
Credit Market Insights: Running a Tight Ship
- The Fed's latest Senior Loan Officer Opinion Survey showed a broad-based tightening in lending standards over Q1. Expectations for worsening credit quality were joined by a reduced risk tolerance and concerns about banks' funding costs and liquidity positions as reasons for tightening.
Topic of the Week: Year-Ahead Expectations Sour for Older Consumers
The results of the New York Fed's Survey of Consumer Expectations were a mixed bag, with consumers reporting declining short-term inflation expectations but rising longer-term expectations. The recent declines in one-year ahead rates seem to be partially offset by the trend increase in the short-term inflation expectations of consumers over the age of 60.
The Weekly Bottom Line: Inflation Continues to Cool in Earnest
U.S. Highlights
- Inflation eased modestly in April, with headline and core CPI both ticking down by 0.1 percentage points to 4.9% and 5.5% year-on-year respectively.
- The Federal Reserve’s Senior Loan Officer Opinion Survey showed that a higher share of commercial banks tightened credit conditions in April than January.
- A meeting between President Biden and Congressional leaders failed to yield any progress on negotiations to raise/suspend the debt limit.
Canadian Highlights
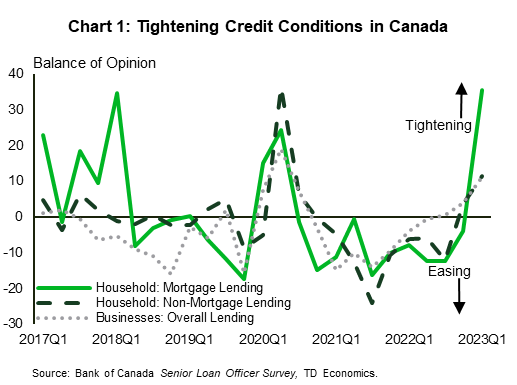
- Borrowing for households and businesses is getting tougher. The Bank of Canada Senior Loan Officer Survey highlights tightening credit conditions for households and business in the first quarter of the year. Notably, household mortgage lending has become less accessible.
- Transitory events including the PSAC workers strike and ongoing Alberta wildfires will throw curveballs into the next few GDP updates, but this will not affect the Bank of Canada’s monetary policy stance.
- Next week’s data-heavy calendar will be led by updates to April CPI, where we expect a cooling of headline inflation to 4.0% y/y with similar declines in various core measures.
U.S. - Inflation Continues to Cool in Earnest
On the heels of last week’s FOMC meeting, we were provided with a host of economic data this week to assess the Fed’s new wait-and-see approach, including April’s CPI report. In addition, we also received the second quarter Senior Loan Officer Opinion Survey (SLOOS) and had a meeting between President Biden and Congressional leadership as they attempt to find an agreement to raise the debt limit. Markets ended the week relatively unchanged, with the S&P 500 down 0.1% and the ten-year Treasury Yield down 4bps at 3.41% as of the time of writing.
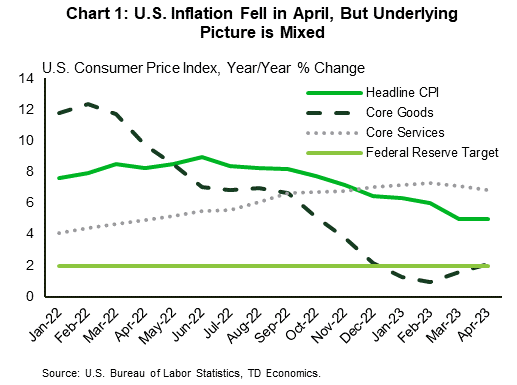
Inflation eased modestly in April, as headline inflation rose by 4.9% year-on-year, down modestly from 5% in March (Chart 1). Energy prices rose for the first time in three months as gasoline jumped by 3% month-on-month (m/m), and food prices were flat for a second consecutive month. Stripping out energy and food, core inflation ticked down to 5.5% y/y, having fluctuated between 5.5-5.6% y/y since January. While we did see shelter inflation decelerate for a second consecutive month, it still rose by 0.4% m/m. This in addition to the reacceleration in core goods inflation, worked to keep core inflation elevated. Although on aggregate this report had positive developments, it reiterated the fact that the path back to the Fed’s 2% target is unlikely to be a straight line.
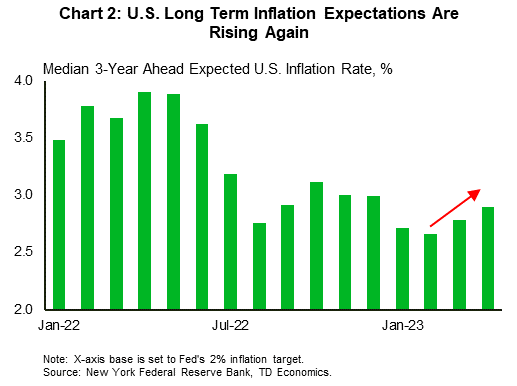
Of particular concern for the Fed is the potential for inflation expectations to become de-anchored. In the New York Fed’s Survey of Consumer Expectations this week, we saw three-year ahead inflation expectations rise for a second consecutive month to 2.9% in April (Chart 2). While this series has historically run slightly above the Fed’s 2% target, a sustained movement above 3% would be a concern for the FOMC.
Earlier in the week, we saw that U.S. commercial banks continued to tighten credit conditions in April in the Fed’s SLOOS. Commercial & industrial loans as well as commercial real estate (CRE) loans saw a higher net percentage of banks tightening credit standards than in January. Demand for these loans from businesses fell as a result, however household demand for consumer-facing loans (mortgages, auto, credit card, etc.) rose as credit remained relatively accessible. Further analysis of the SLOOS can be found here.
Lastly, in the Oval Office this week, President Biden met with Congressional leaders on Tuesday to attempt to find an agreement to raise/suspend the debt limit. Treasury Secretary Yellen warned last week that the Treasury could run out of funds by early June, thus the impetus to reach an agreement is elevated. However, no progress has been made in the negotiations so far.
Looking ahead to next week, we will get a fresh update on the U.S. consumer with April retail sales as well as existing home sales. With the unemployment rate back down to 3.4% consumers may still have some wind in their sails, but we expect that this will be short-lived as past rate hikes continue to filter through the economy.
Canada – New Information, Same Narrative
Canada quietly stood on the sidelines this week without any top-shelf macro updates on the economic calendar. Jittery market sentiment continues to be driven by contentious U.S debt limit discussions, turmoil in the banking sector, and more recently, the concern that tighter credit conditions could lead to excessive slowdown south of the border. In Canada, we received our own pulse check on credit conditions.
The Bank of Canada's (BoC) Senior Loan Officer Survey for the first quarter highlighted a significant tightening in mortgage lending conditions (Chart 1). Data availability restricts drawing comparisons to the '08–'09 financial crisis, but current readings suggest stronger headwinds against mortgage credit growth in the near-term. Non-mortgage household lending conditions also tightened, making credit less accessible to consumers. On the business side, overall lending conditions also tightened notably, but remain below the peak seen during the pandemic, and the previous high in 2016. Credit conditions in Canada are displaying differing characteristics to those in the U.S., where credit standards for businesses are tightening disproportionally compared to household credit.
Aside from this, a series of transient shocks over the last couple of months will throw kinks into forthcoming data, notably monthly GDP readings. Firstly, the federal PSAC workers strike that kept ~150,000 workers off the job for two weeks may have lopped two-tenths of a percent off of April GDP. This effect may have been partially counteracted by the Federal government's GST/HST credits that hit Canadians' accounts at the beginning of April.
The expected GDP boost for May as workers came back on the job, could now be weighed down somewhere to the tune of 0.2 percentage points (ppts) by to the ongoing Alberta wildfires. Alberta's oil & gas sector accounts for roughly five percent of national level GDP, and while conditions have improved, major oil producers had curtailed cumulative oil output by up to ~320,000 barrels per day (or almost 4% of national level production). The shut-ins are temporary but have been sustained long enough to have measurable effects.
In Statistics Canada's February GDP release, they noted that the Canadian economy likely contracted by 0.1% in March. This puts first quarter GDP tracking above-trend at around 2.5% annualized. Imposing net-drag effects from recent events, Q2 GDP will likely come in lower than the 0.7–1.0% annualized estimates that both we and the BoC have penciled in. However, this should give way to a growth rebound in Q3. All said, we do not see any effect on monetary policy as the Bank of Canada will likely look through the noise, instead focusing on the fight to bring inflation durably back to target.
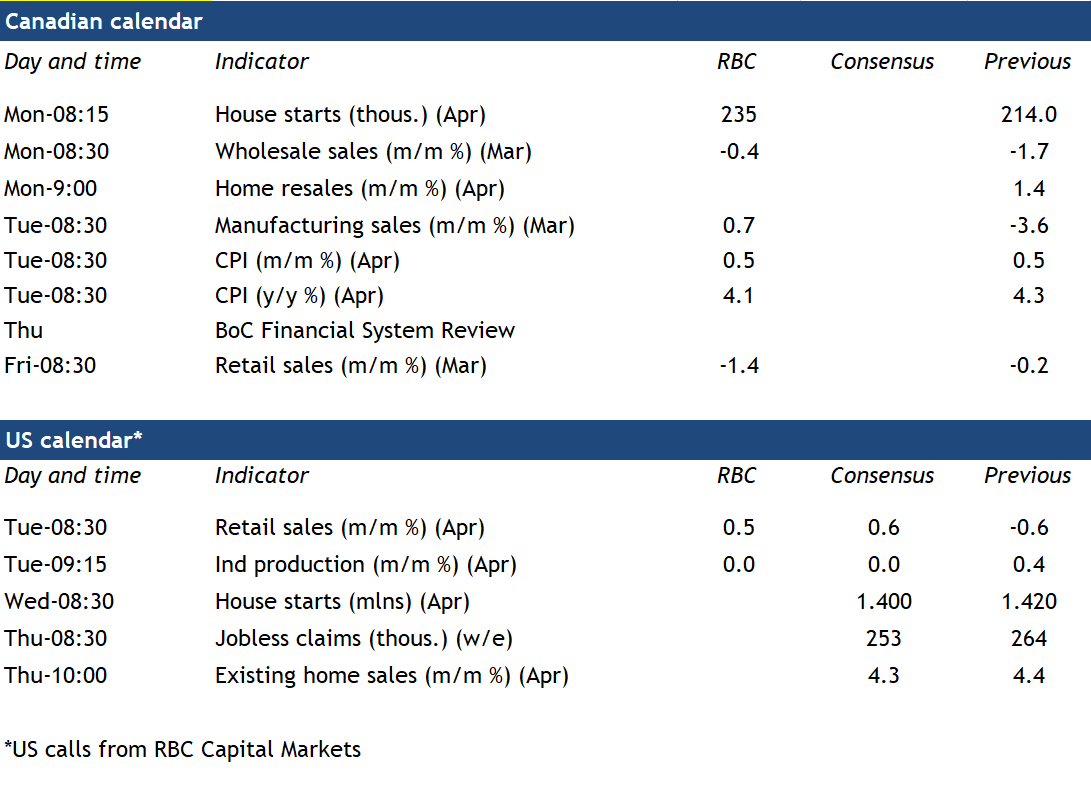
After a quiet week for data, next week features a lineup of heavy hitters. April's inflation release next week will be the lead off. We expect headline CPI to cool another 0.3 ppts to 4.0% y/y with broadly equivalent slowdowns across the suite of core measures (Chart 2). Also on tap, retail sales for March likely slowed, evidenced by our TD Spend data that showed consumers pumped the brakes on spending for the month. Lastly, we'll receive updates on April's housing starts and existing home sales.
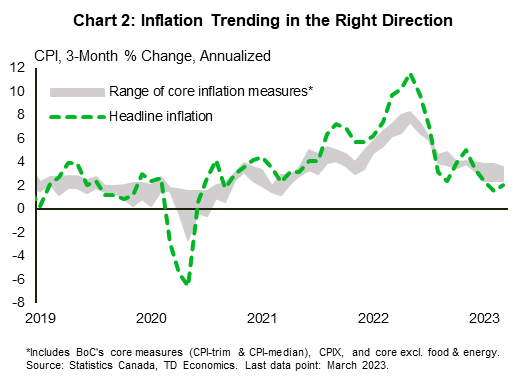
Canadian Inflation Likely to Ease Again
Canada’s April inflation reading likely ticked lower again. We expect to a 4.1% year-over-year rate from 4.3% in March. A 6% increase in gasoline prices from March suggests energy prices fell a little less. But grocery price growth has been slowing and we expect broader gradual softening in underlying inflation pressures to have continued.
With headline CPI moving in the right direction, all eyes will be on the Bank of Canada’s preferred measures of core inflation for signs that higher interest rates are slowing price growth. Year-over-year growth for the CPI trim, median, and the new ‘super core’ services ex-shelter measure introduced in the BoC’s last Monetary Policy Report should all slow substantially as large monthly increases in April a year ago fall out of the annual growth rates. More recent month-over-month core price increases have been running around a 3 ½% (annualized) rate. That’s still above the BoC’s 1% to 3% target range, but down sharply from peak levels last summer. The breadth of inflation pressures has narrowed. And early signs that the lagged impact of higher interest rates are weighing on economic growth suggest underlying inflation pressures should continue to ease. Early estimates are pointing to declines in Canadian wholesale and retail sales in March, with a 0.7% increase in manufacturing sales probably tied to a big surge in notoriously volatile aerospace sales.
The Bank of Canada is presently expected to sit on the sidelines for the remainder of 2023. Additional evidence of weaker price growth coupled with softening demand will affirm their present policy stance.
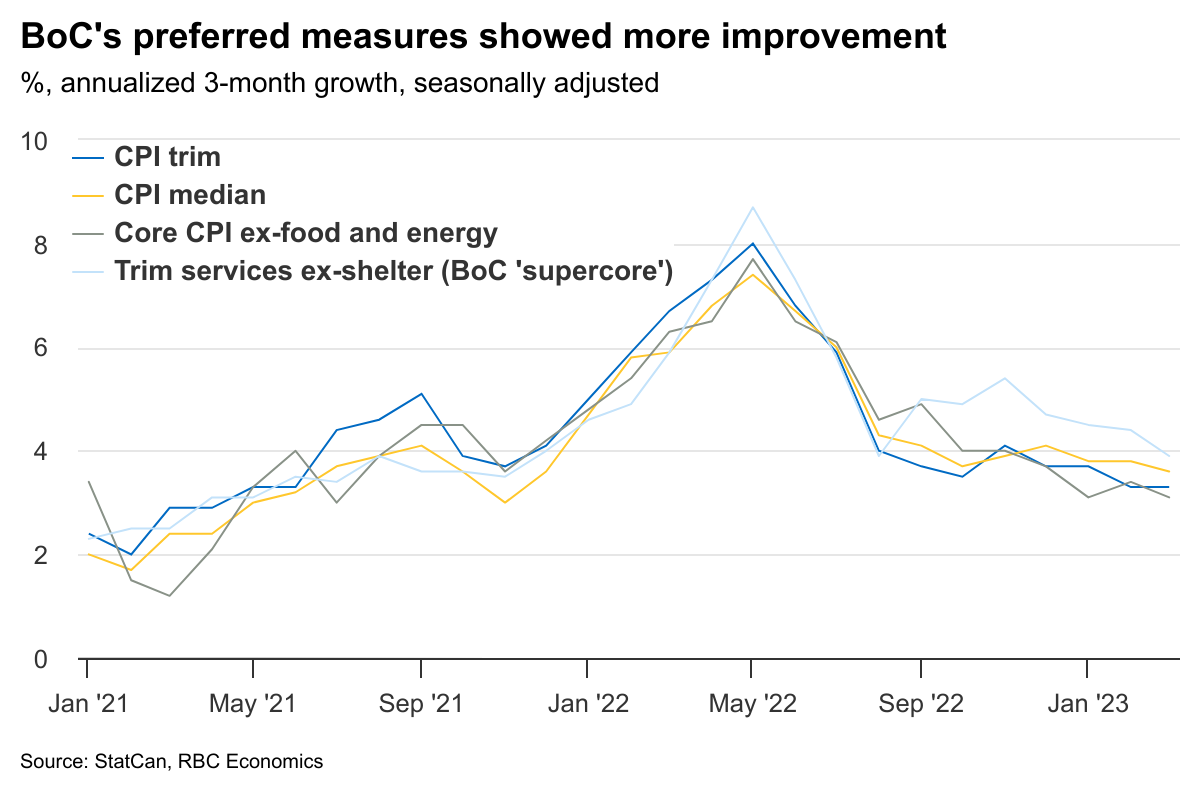
Week ahead data watch
The BoC’s Financial System Review (FSR) will be more closely watched than usual given the tightening credit standards in regional banks, and wobbly commercial real estate (CRE) markets. The BoC's Q1 Senior Loan Officer survey flagged some tightening in lending conditions, but not to the same extent as has been observed in the U.S.
Statistics Canada’s advance estimate indicated that March manufacturing sales rose 0.7% following a 3.7% pullback in February. Prices likely declined (led by a drop in petroleum & coal prices), implying a larger rise in volume terms. But most of the increase appears to have come from a surge in the often-volatile aerospace component.
Early estimates from Statistics Canada pointed to declines in March retail sales (-1.4%) and wholesale trade (-0.4%.) The former likely included a pullback in auto sales, with industry reports pointing to another decline in motor vehicle sales in April.
Canadian home resales probably ticked higher for a third straight month in April, according to early market reports. Prices likely also edged higher for a second straight month following a year of consecutive declines.
We expect the U.S. retail sales to tick up 0.5% in April, driven by an increase in unit auto sales. U.S. industrial production likely held steady in April, with a sharp decline in heating days resulting a lower output in the utility sector. Manufacturing output probably edged higher, but not by enough to fully reverse the 0.5% decline in the prior month.