Sample Category Title
Cliff Notes: Calm Returns to Markets
Key insights from the week that was.
Softer updates around the Australian consumer and inflation have strengthened the case for a pause at next week’s April RBA policy meeting. Global market sentiment meanwhile improved over the week as concerns over US and European banks eased.
Australian retail sales posted an as expected gain of 0.2% in February after a turbulent two months. The lift in nominal spending across department stores, clothing and food-related retail more than offset the flat result in household goods and weakness in ‘other retail’ items. Looking through recent volatility, it becomes clear the nominal retail trend is weakening, with sales down 1.5% on a rolling three-month basis. Should this subdued trend persist into March, nominal retail sales in Q1 are likely to be little changed from Q4; and, given the elevated rate of inflation amongst retail components, retail sales volumes are poised to contract materially in the quarter.
Following a 0.4% decline in January, the Monthly CPI Indicator surprised to the downside again in February, a modest 0.2% rise in the month lowering the annual rate of inflation from 7.4% to 6.8%, well below the consensus estimate of 7.2%. Compared to the average monthly increase of 0.9% over the last three months of 2022, a moderation in the pace of inflation has clearly materialised. At this stage, the deceleration in annual inflation between January and February looks to be relatively broad-based, with easing evident across food (6.8% vs. 7.4%); housing (9.9% vs. 10.4%); transportation (5.6% vs. 6.1%) and household contents/services (6.6% vs. 6.8%). The main surprise in the month came from holiday travel which notably fell 14.6% in February after a 7.2% decline in January. Consequently, annual inflation in the broader recreation category has more than halved over the last two months, from 14.4% to 6.4%.
As outlined by Chief Economist Bill Evans, the recent data flow complements earlier updates on the labour market and business confidence, putting forward a strong case for the RBA to pause at the April Board meeting. The RBA will also benefit from the fact that their meeting schedule has largely avoided the intense periods of uncertainty around the banking sector, with global sentiment having steadily improved over the course of this week (see below), allowing the Board to remain focussed on domestic developments. That said, we continue to expect the Q1 CPI release to report uncomfortably high underlying inflation, warranting a final 25bp rate hike at the May Board meeting. Policy should then remain on hold over the remainder of 2023 as inflation continues its gradual descent. 150bps of rate cuts are then expected through 2024 and 2025 to return policy to a near-neutral setting.
Offshore, data was of limited significance this week. In the US, the Dallas and Richmond Fed business surveys remained weak in March, while the trade deficit held wide in February. Another modest decline was also seen in S&P CoreLogic CS 20-city house prices in January (-0.4%), slowing the annual rate of growth from 4.6% to 2.6%. The volume of pending homes sales meanwhile surprised by holding up in February after January’s jump higher (respectively 0.8% and 8.1%); however, versus a year ago, they remain 21% lower. Notably, despite recent market volatility and lingering uncertainty over the banking sector, Conference Board consumer confidence improved slightly in March, remaining well above its lows of 2020-21 and 2022 but also a long way from prior peak levels. Expectations were the driving force in March, offsetting a small decline in current conditions. Arguably this is due to a combination of the robust health of the US labour market and a 10-year yield (and consequently 30-year mortgage rate) off peak levels. Note the main US data release for this week is still to come, with the February PCE data due this evening.
Over the week, FOMC members’ perspective on the outlook is unchanged, their focus remaining on the need for a sustained period of contractionary policy to quell inflation risks. Developments around the banking sector have generally been constructive, with Silicon Valley Bank bought by First Citizens Bank and the market increasingly of the view that, if necessary, authorities will provide further support. Market pricing for the FOMC is split, with a roughly 50% chance of another 25bp hike by the FOMC in May, but then three-to-four 25bp rate cuts priced by January 2024. Recognising the risks with regards to inflation but also the material credit tightening underway, we believe the prudent course for the FOMC is to remain on hold from May 2023 until March 2024 then cut back towards neutral through to mid-2025.
USD/JPY Recovery Could Fade Above 133.00
Key Highlights
- USD/JPY started a recovery wave above the 132.20 resistance.
- It broke a major bearish trend line with resistance near 131.20 on the 4-hours chart.
- GBP/USD rallied and traded to a new monthly high above 1.2340.
- EUR/USD is also gaining pace above the 1.0850 resistance zone.
USD/JPY Technical Analysis
The USD/JPY started a decent recovery wave from the 129.65 zone against the Japanese Yen. USD/JPY traded above the 130.50 and 131.20 levels to move into a positive zone.
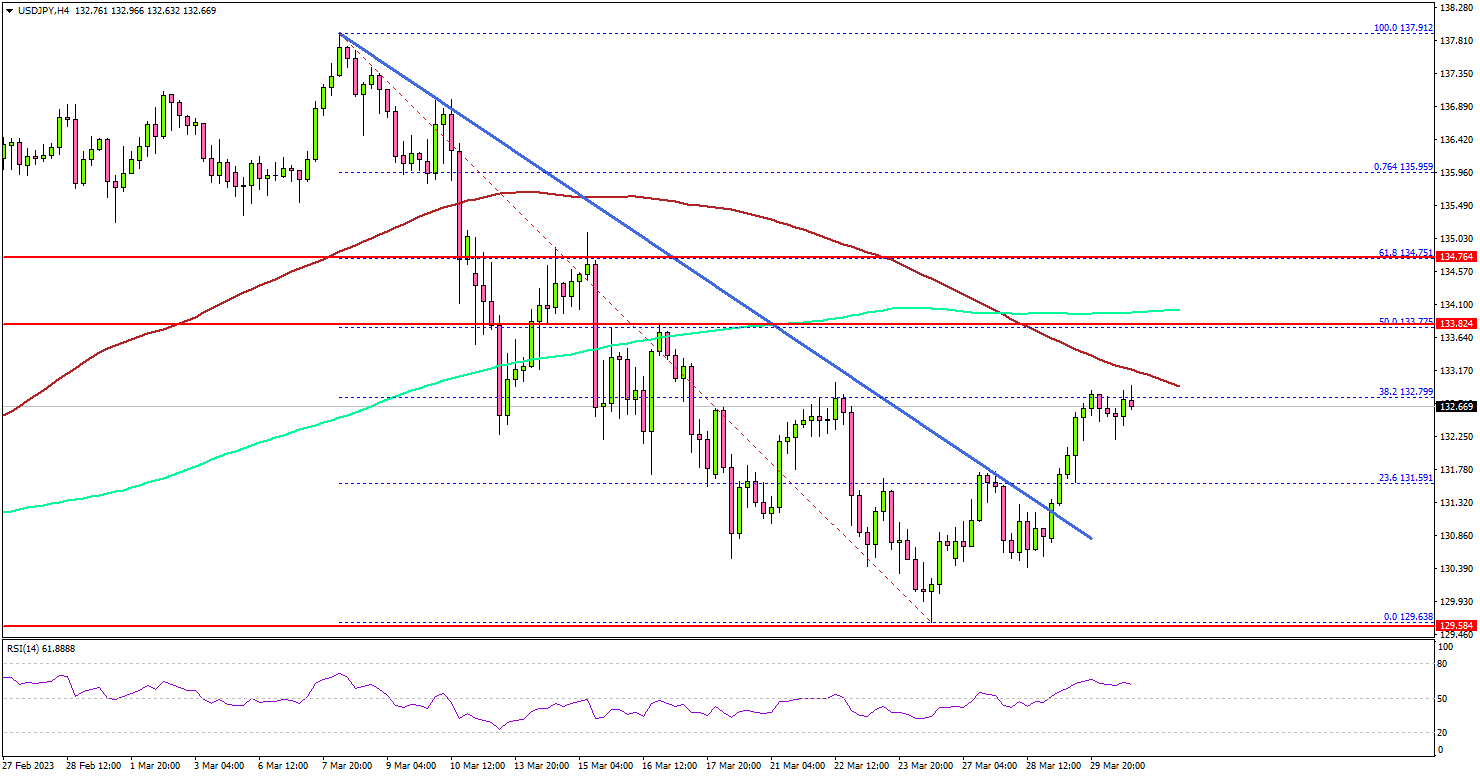
Looking at the 4-hours chart, the pair cleared a major bearish trend line with resistance near 131.20. The pair even tested the 132.80 resistance zone and traded close to the 100 simple moving average (red, 4-hours).
The first major resistance is near the 133.20 level. The next key resistance is near the 133.50 zone and the 200 simple moving average (green, 4-hours). It is close to the 50% Fib retracement level of the downward move from the 137.91 swing high to 129.63 low.
A clear move above the 133.50 resistance might send the pair towards the 134.50 zone. Any more gains might send the pair towards 135.00.
On the downside, an immediate support is near the 131.80. The next major support is near the 131.20 level, below which there is a risk of a move towards the 130.50 support.
Looking at GBP/USD, the pair gained pace above the 1.2350 resistance and even traded to a new monthly high.
Economic Releases
- UK GDP for Q4 2022 (QoQ) - Forecast 0%, versus 0% previous.
- Euro Zone CPI for March 2023 (YoY, Preliminary) - Forecast +7.1%, versus +8.5% previous.
- Euro Zone CPI for March 2023 (MoM, Preliminary) - Forecast +0.8%, versus +0.8% previous.
Gold Wave Analysis
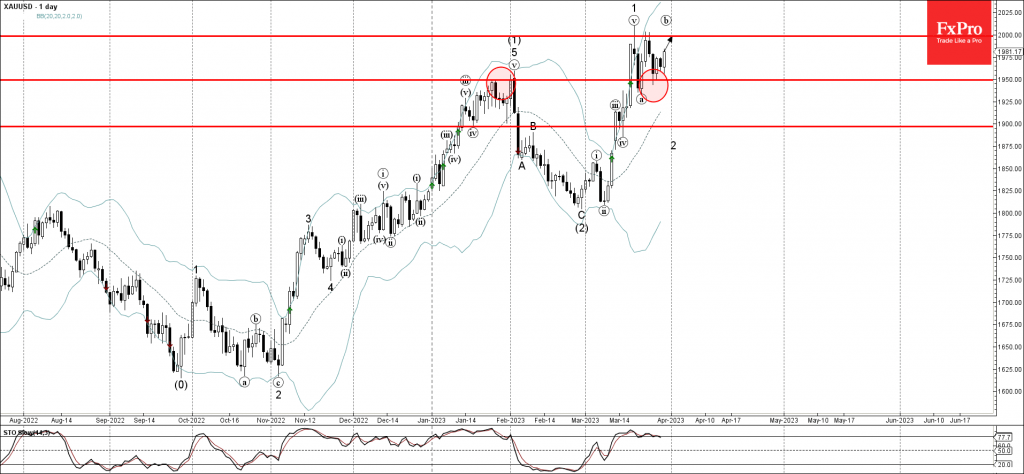
- Gold reversed from key support level 1950.00
- Likely to rise to resistance level 2000.00
Gold recently reversed up from the key support level 1950.00 (former strong resistance from January and February).
The upward reversal from the support level 1950.00 forms the 3rd consecutive upward reversal pattern Piercing Line – pointing toward the higher probability of further gains.
Given the clear uptrend Gold can then be expected to rise further toward the next round resistance level 2000.00 – from where the price is likely to correct down.
GBPUSD Wave Analysis
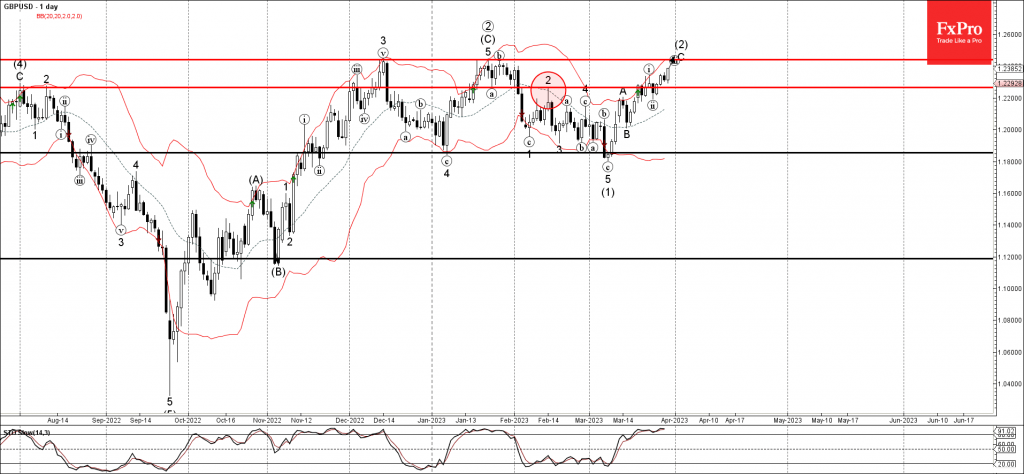
- GBPUSD broke resistance level 1.22664
- Likely to rise to resistance level 1.2440
GBPUSD rising after the pair broke above the resistance level 1.22664 (top of the previous correction 2 from the middle of February).
The breakout of the resistance level 1.22664 continues the active short-term impulse wave C, which belongs to the intermediate ABC correction (2) from the start of March.
Given the strong uptrend and the widespread dollar sales, GBPUSD currency pair can then be expected to rise further toward the next resistance level 1.2440 (monthly high from December and January and the target price for the completion of the active impulse wave C).
USDCAD Wave Analysis
- USDCAD under bearish pressure
- Likely to fall to support level 1.3400
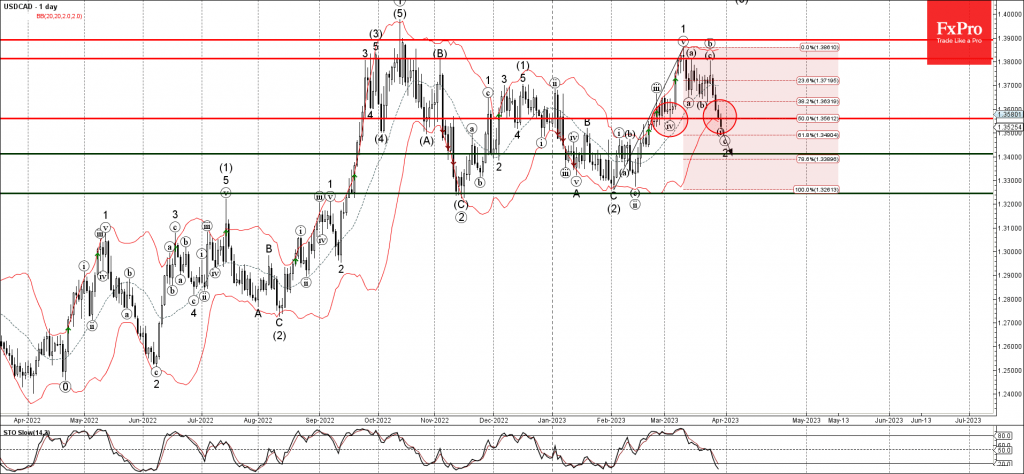
USDCAD currency pair under the bearish pressure after the price broke the key support level 1.3560 (low of the previous correction (iv)) intersecting with the 50% Fibonacci correction of the sharp upward impulse from February.
The breakout of the support level 1.3560 accelerated the active short-term upward impulse wave (c), which belongs to the ABC correction 2 from the start of this month.
USDCAD currency pair can then be expected to fall further toward the next support level 1.3400 (target price for the completion of the active impulse wave (c)).
UK 100 Cash Index Enters Challenging Area
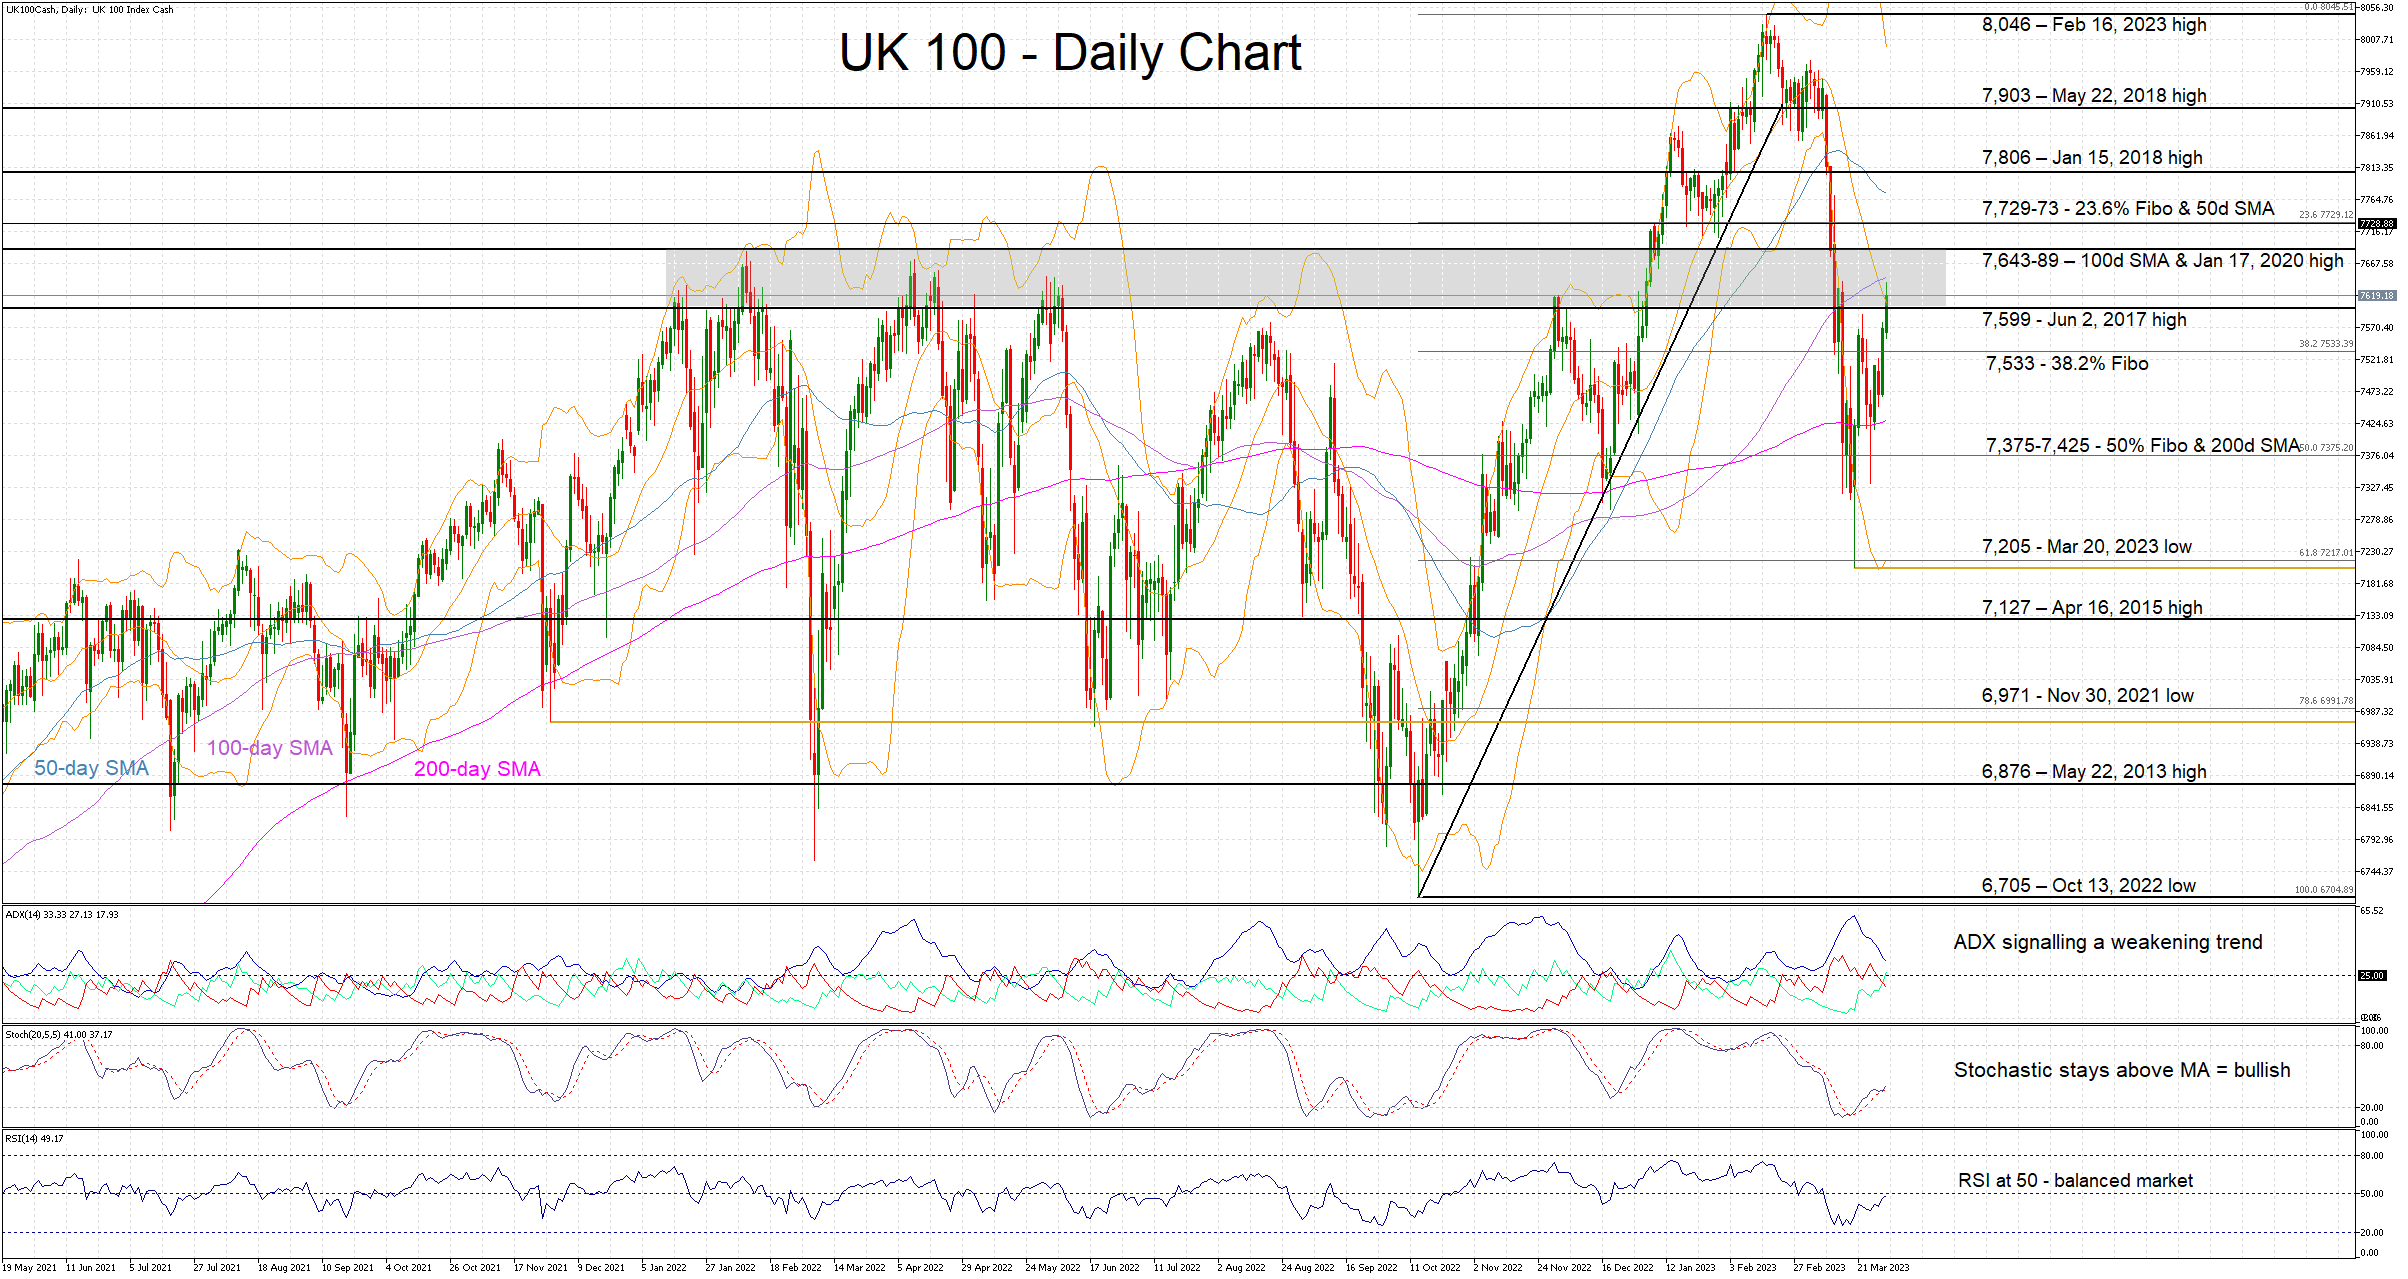
In line with the other main stock markets, the UK 100 cash index is continuing its recovery from the mid-March banking sector-induced dip. The index touched 7,205 on March 20 and it is now hovering just above the June 2, 2017 high of 7,599. It has entered a range that proved difficult for the bulls to overcome during 2022. The market has excellent memory regarding recent highs and hence UK 100 bulls should prepare for this new battle.
In the meantime, a common theme appears to be arising from the momentum indicators, potentially supporting the bulls' ambitions. The RSI is a tad below the 50-threshold, leaving the door open for another rally. In addition, the stochastic oscillator has managed to remain above its moving average, and it is now staging a bounce higher. This reaction is usually seen as an indication of bullish momentum in the market. The bulls, however, cannot take much encouragement from the Average Directional Movement Index (ADX) as this is dropping aggressively, signaling a weakening trending market.
The bulls would love a break above the 7,689 level set by the January 17, 2020 high, but they have to deal with the 100-day simple moving average (SMA) first. Even higher, the 23.6% Fibonacci retracement of the October 13, 2022 – February 16, 2023 uptrend and the 50-day SMA at the 7,729-7,773 range might trouble them.
On the other hand, should the bears manage to take over the market, they would aim for a retest of the 38.2% Fibonacci retracement at 7,533. The path then becomes trickier as the two heavyweights, the 50% Fibonacci retracement and the 200-day SMA are likely to prove stronger resistance points than currently envisaged by the bears.
To sum up, the UK 100 cash index has quickly recovered from the mid-March shock. But the 7,599-7,689 area would be the true test of the bulls' resolve.
European Stock Market Might Crash Soon
In today's article, we will be performing an interesting analytical experiment - Correlation!
To start, I have chosen a few indices that we will be observing. It's just like we're analyzing the flavors of different ice creams and predicting which ones will sell better based on their ingredients. In this case, the price action is the component we will adopt in order to determine the outcome. So, let's dive into the price action!
UK100
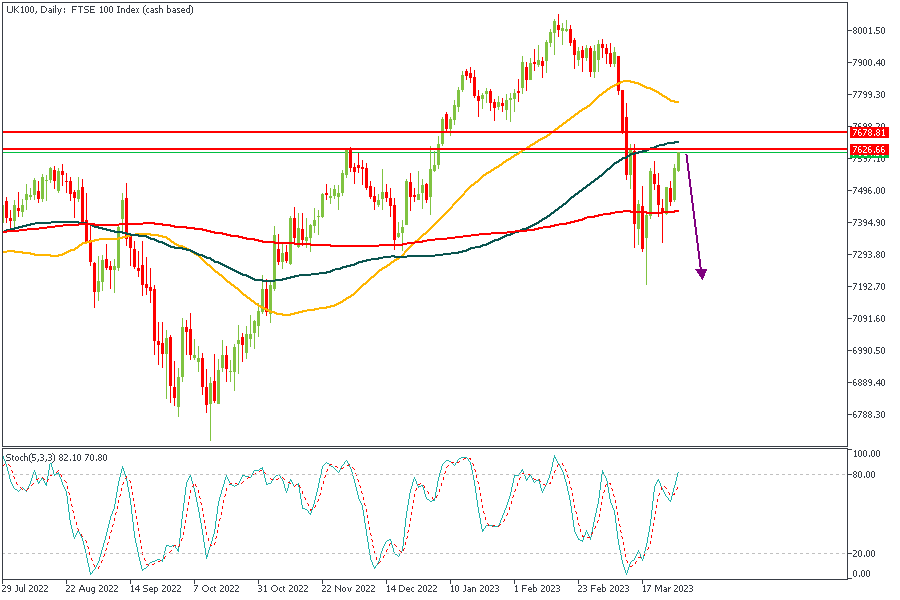
First on my list is UK100, and I'll be working on the Daily timeframe. Here we see price currently at a strong pivot zone acting as a resistance. The 100-Day MA also overlaps with this zone and adds extra confirmation to the possibility of a bearish rejection from the supply zone. The primary target would be the 200-Day MA. You notice the stochastics seems overbought too right? Cheers!
Analysts’ Expectations:
- Direction: Bearish
- Target: 7440.00
- Invalidation: 7708.97
EU50
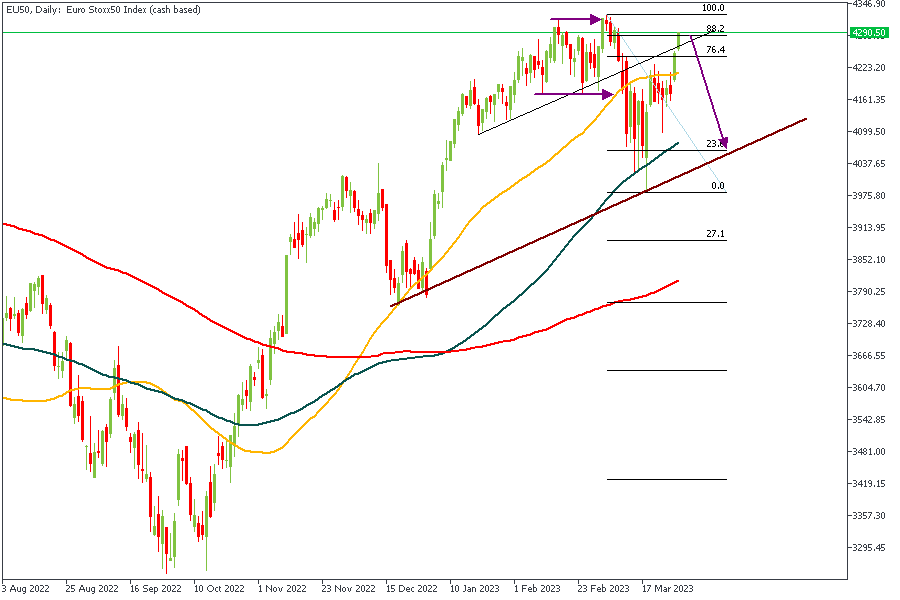
EU50 has created a classic AMD (Accumulation-Manipulation-Distribution) pattern. There has also been a break of the trendline that would act as the pivot in this case; thus making the current bullish move a mere retracement. There is also the confluence of the 88% Fibonacci retracement level, which leads me to believe that price may seek to return to the lower trendline for support.
Analysts’ Expectations:
- Direction: Bearish
- Target: 4082.5
- Invalidation: 4342.30
DE30
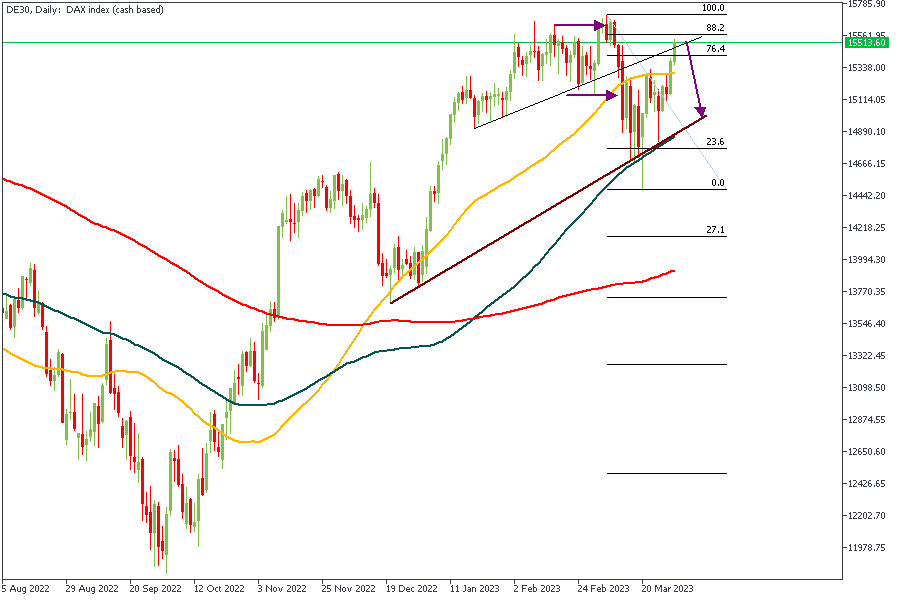
EU50 and DE30 seem to be members of the same book club. Do you see the resemblance in the price action? We have the same AMD pattern, the same Fibonacci retracement level, and the same trendline situation going on. All these simply affirm the likelihood of bearish price action in a short while.
Analysts’ Expectations:
- Direction: Bearish
- Target: 4084.63
- Invalidation: 4337.94
FR40
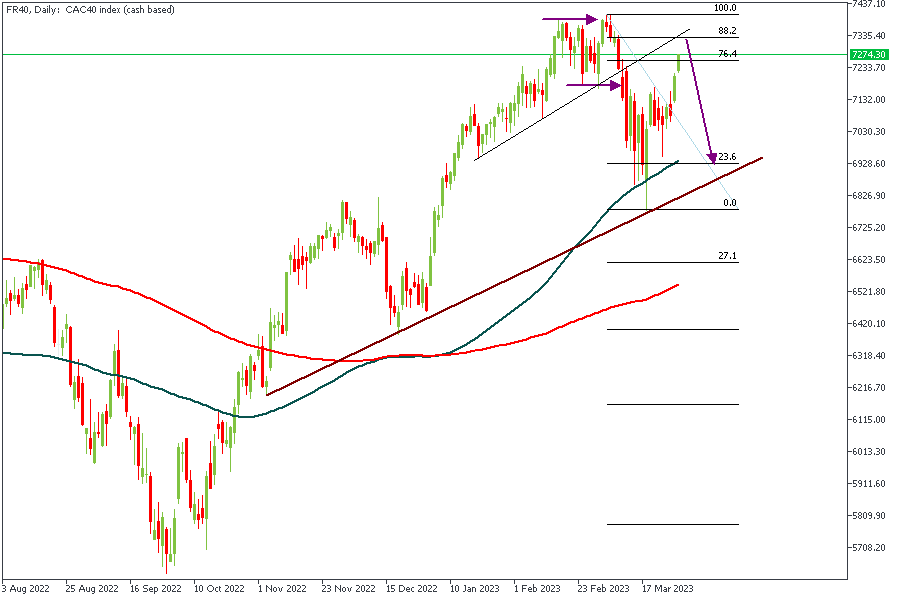
Alas! The book club has one more member here. The price action on FR40 at this point really needs not much explanation; in fact, you could simply refer to the analysis for EU50 or DE30, and you'd still be on point.
Analysts’ Expectations:
- Direction: Bearish
- Target: 6951.54
- Invalidation: 7426.28
CONCLUSION
The trading of CFDs comes at a risk. Thus, to succeed, you have to manage risks properly. To avoid costly mistakes while you look to trade these opportunities, be sure to do your due diligence and manage your risk appropriately.
Sunset Market Commentary
Markets
Today’s very first March inflation update – honor to the German North Rhine Westphalia region – set the tone for the start of European dealings. The regional figure printed softer than what was expected for the national number, suggesting a downward surprise. Soon after, Spanish inflation rose 1.1% M/M while markets expected a 1.6% M/M gain. The Spanish statistics agency didn’t provide much info yet, but said that energy prices fell in March. The Y/Y-figure nearly halved, from 6% to 3.1% , mainly due to a giant negative base effect stemming from last year’s surge in energy and road fuel prices after Russia invaded Ukraine. The combination of both triggered early buying in German Bunds, temporarily ending this week’s slide. The obvious reflex being that it provides an argument for the ECB not to aggressively push through with its flagged additional rate hikes. Markets initially easily looked past the fact that Spanish core CPI remained stubbornly high at 7.5% Y/Y (from 7.6% Y/Y). As more and more German States printed inflation numbers, it became clear that the story wouldn’t be as straightforward. German Bunds returned towards opening levels and currently trade even weaker as the overall German inflation number beat consensus! Headline German inflation accelerated to 1.1% M/M (vs 0.8% expected) with the Y/Y-figure falling somewhat less than hoped (from 9.3% Y/Y to 7.8% Y/Y). Belgian core inflation (see below) remains on an upward trend as well. German yields currently add 10.7 bps (2-yr) to 1 bp (30-yr). Money markets are again embracing two additional 25 bps rate hikes this year whereas this was only one last week around. Despite this ongoing repositioning, we still think it’s too conservative. German Bunds underperformed US Treasuries today with US yields gaining “only” 4 bps at the front end. The single currency benefited from the yield advantage with EUR/USD pushing for a test of the March high at 1.0930. It’s final resistance ahead of the YTD top at 1.1033. Positive risk momentum helped the single currency as well with main European indices adding another 1% to their rebound and US gauges opening 0.5% higher. The EuroStoxx50 is closing in on this year’s high at 4324.25. ECB board member Schnabel said yesterday after market close that European banks haven’t seen a general deposit outflow.
News Headlines
Belgian inflation rose by 0.57% to be 6.67% y/y in March. It’s the first yearly acceleration since prices started easing from their peak at 12.30% in October 2022. Food prices were a major contributor. By rising 17.02% (up from 16.12% last month), 3.12 ppts to the headline figure were added. Energy prices weighed heavily on the index, subtracting 1.49 ppts from the figure. On a yearly basis, energy prices dropped 10.11% y/y compared to 7.93% last month with especially gas prices recording a steep fall after surging in the same month last year (-45.6% y/y, -17.6% m/m). Core inflation continued to speed up, from 8.28% to 8.57%. Services inflation also rose further, from 6.96% to 7.06%, suggesting still wide-spread and strong underlying price pressures.
The Swiss KOF Economic Institute’s economic barometer fell marginally in March. The headline index lost 0.7 points in March from 98.9 (revised from 100.0). At 98.2, it printed just below its average value of 100. So the upward trend observed between November 2022 and last month came to a halt. The KOF Institute reported negative signals from the manufacturing, services and construction sectors. They are at least partly offset by positive developments in the indicator bundle reflecting Swiss exports. Other indicators included in the barometer were reported as little changed. In manufacturing and construction, the situation referring to employment and inventories is assessed more negatively than before, while new orders and intermediate goods have improved. The KOF Institute concludes that obstacles to production are still primarily due to recruitment problems in the labour market. EUR/CHF after the release trades little changed near 0.996. Recent financial turmoil also had only a temporary impact on the franc. In a broader perspective, the EUR/USD cross rate is holding a rather tight range near parity. The SNB at last week’s policy meeting, indicated that it is prepared to sell FX/buy the Swiss franc to support appropriate monetary conditions.
Dow Rises on Improved Risk Mode
The Dow Jones Index continues to benefit from fresh risk appetite as traders feel more comfortable on easing fears after collapse of two US banks.
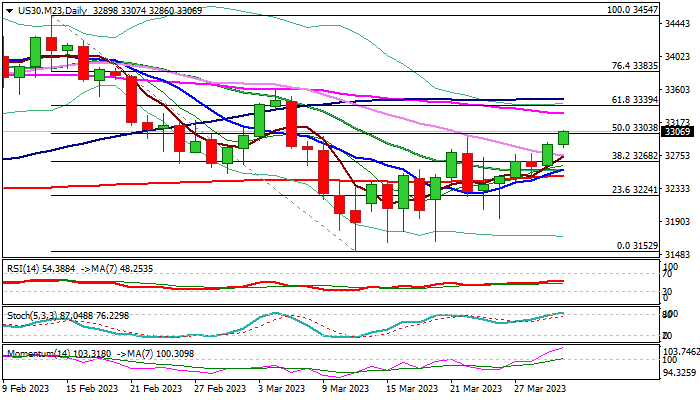
The price rose to three-week high in European trading on Thursday, in extension of 0.85% advance on Wednesday, marking 50% retracement of larger 34547/31529 fall.
Near-term action is underpinned by 10/200DMA golden cross and formation of 10/20DMA bull-cross and rising bullish momentum on daily chart.
Fresh advance needs close above cracked pivots at 32991/33038 (former top of Mar 22 / 50% retracement) to boost bullish signals and keep focus at 33289/33394 targets (55DMA / Fibo 61.8% of 34547/31529).
Investors await release of US PCE data on Friday, for more evidence on inflation, which will return to Fed’s focus after immediate threats from the recent bank turmoil eased.
Res: 32990; 33290; 33394; 33475
Sup: 32991; 32860; 32757; 32572