

Sample Category Title
EUR/JPY Daily Outlook
Daily Pivots: (S1) 143.55; (P) 144.32; (R1) 145.48; More....
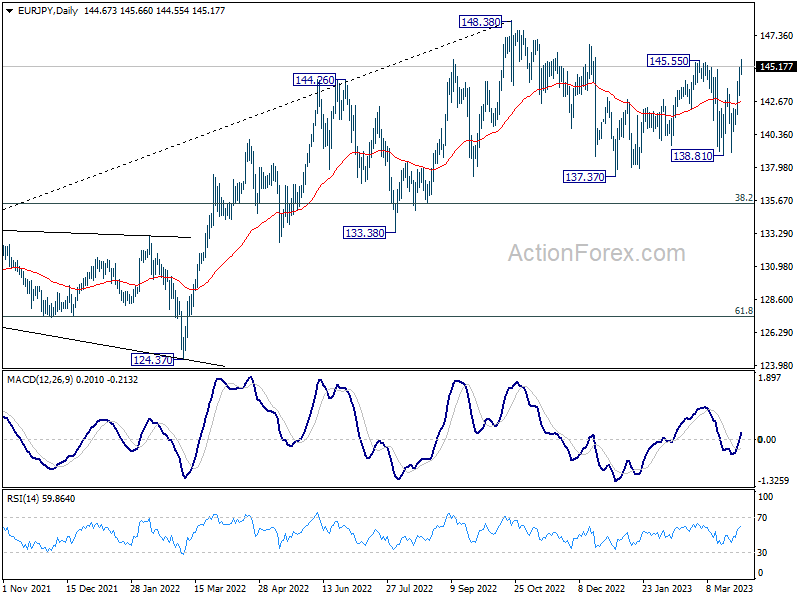
EUR/JPY's breach of 145.55 resistance suggests that whole rebound from1 37.37 is resuming. Intraday bias stays on the upside, and further rally would be seen to retest 148.38 high. On the downside, however, below 143.12 minor support will mix up the outlook again and turn intraday bias neutral.
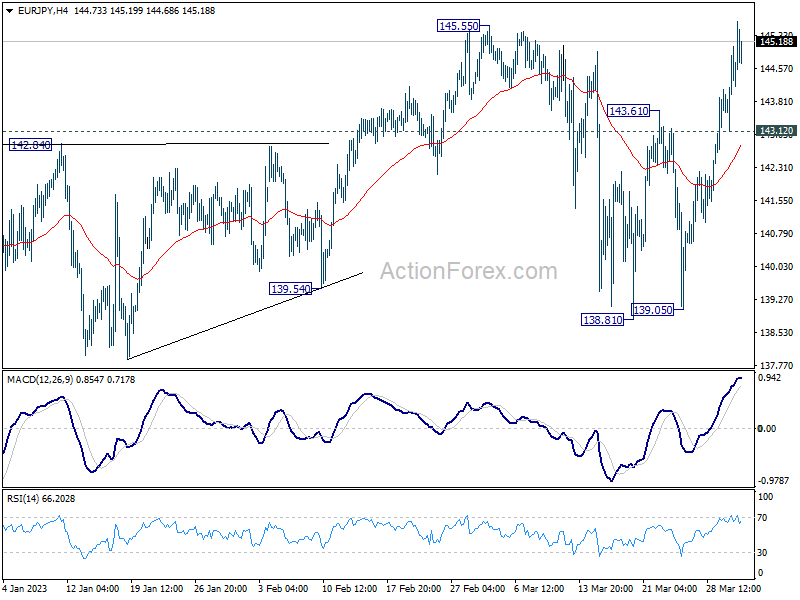
In the bigger picture, as long as 55 week EMA (now at 139.58) holds, larger up trend from 114.42 (2020 low) is still in progress for 149.76 long term resistance. However, sustained break of 55 week EMA will bring deeper fall to 38.2% retracement of 114.42 to 148.38 at 135.40. Decisive break there will raise the chance of trend reversal, and target 61.8% retracement at 127.39.
EUR/GBP Daily Outlook
Daily Pivots: (S1) 0.8780; (P) 0.8804; (R1) 0.8828; More...
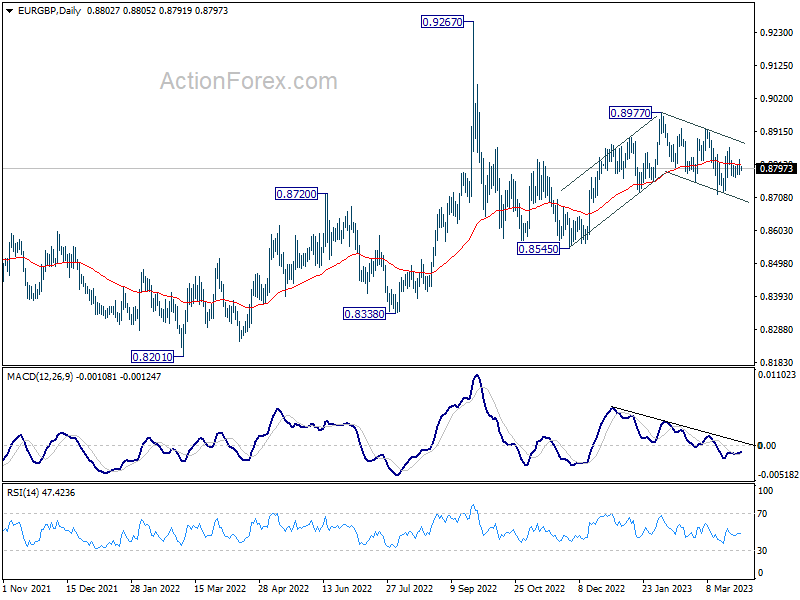
Intraday bias in EUR/GBP remains neutral at this point. Also, near term outlook is mixed. On the upside, break of 0.8864 will target 0.8924 resistance first. Firm break there should resume larger rise from 0.8545 through 0.8977 high. However, decisive break of 0.8717 support will resume the decline from 0.8977 instead.
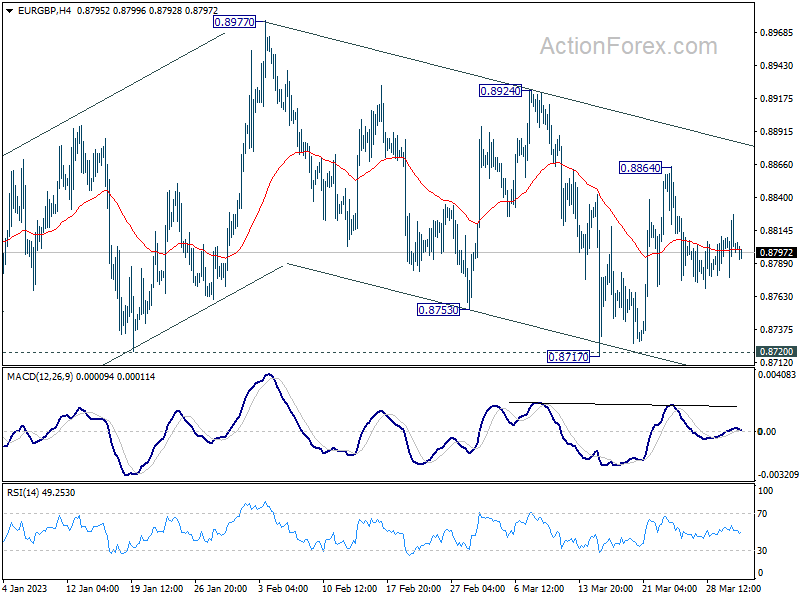
In the bigger picture, outlook remains rather mixed for now, except that price actions from 0.9267 (2022 high) are part of the long term range pattern from 0.9499 (2020 high). With 0.8720 support intact, rise from 0.8545 is in favor to continue through 0.8977. However, firm break of 0.8720 will argue that such rebound has completed, and open up deeper fall through this support level.
EUR/AUD Daily Outlook
Daily Pivots: (S1) 1.6156; (P) 1.6235; (R1) 1.6327; More...
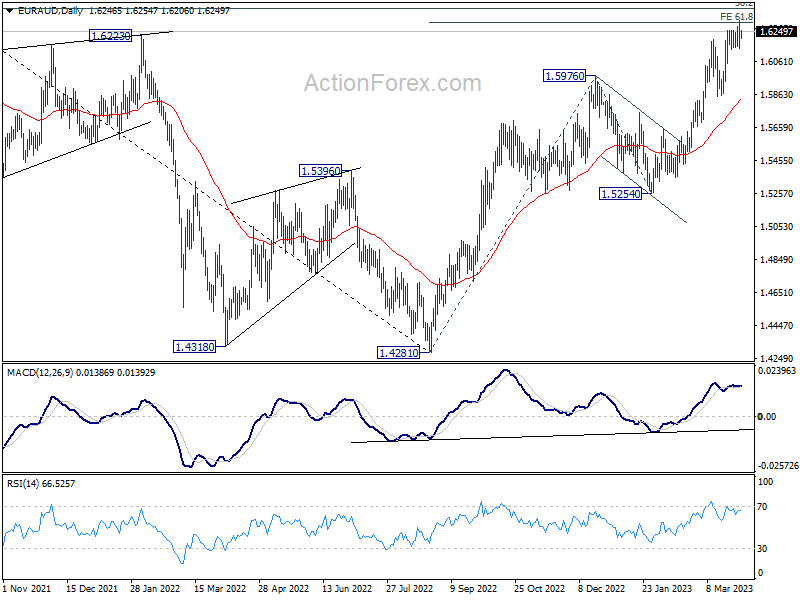
Immediate focus is now on 61.8% projection of 1.4281 to 1.5976 from 1.5254 at 1.6302 . Decisive break there will resume larger rally from 1.4281 to 1.6389 fibonacci level and then 1.6434 resistance. However, firm break of 1.6053 support will indicate rejection by 1.6302 and turn bias back to the downside for 1.5848 support.
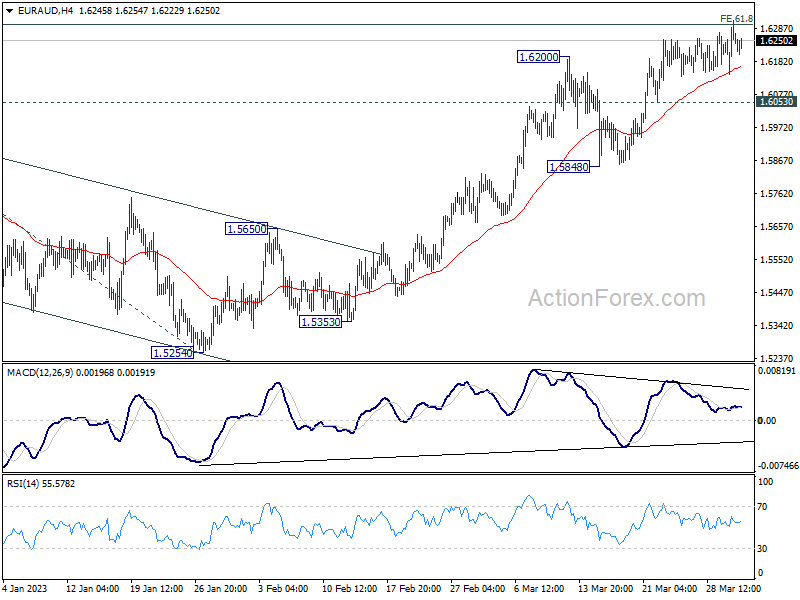
In the bigger picture, the strong support from 55 week EMA (now at 1.5404) is raising the chance of bullish trend reversal. Focus is now on 1.6434 cluster resistance (38.2% retracement of 1.9799 to 1.4281 at 1.6389). Sustained break there should confirm that whole down trend from 1.9799 (2020 high) has completed. Further rally should then be seen to 61.8% retracement at 1.7691. However, rejection by this cluster resistance will make medium term outlook neutral at best.
EUR/CHF Daily Outlook
Daily Pivots: (S1) 0.9937; (P) 0.9958; (R1) 0.9983; More...
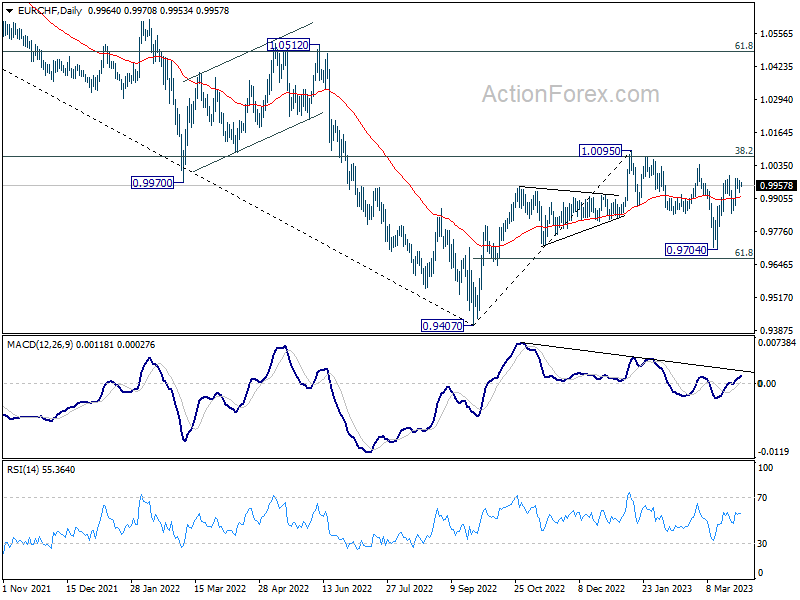
Intraday bias in EUR/CHF remains neutral and further rally is expected with 0.9837 support intact. On the upside, break of 0.9995 will affirm the case that correction from 1.0095 has completed at 0.9704. Further rally should be seen through 1.0040 to retest 1.0095 high. However, firm break of 0.9837 will dampen this bullish view and turn bias back to the downside for 0.9704 support instead.
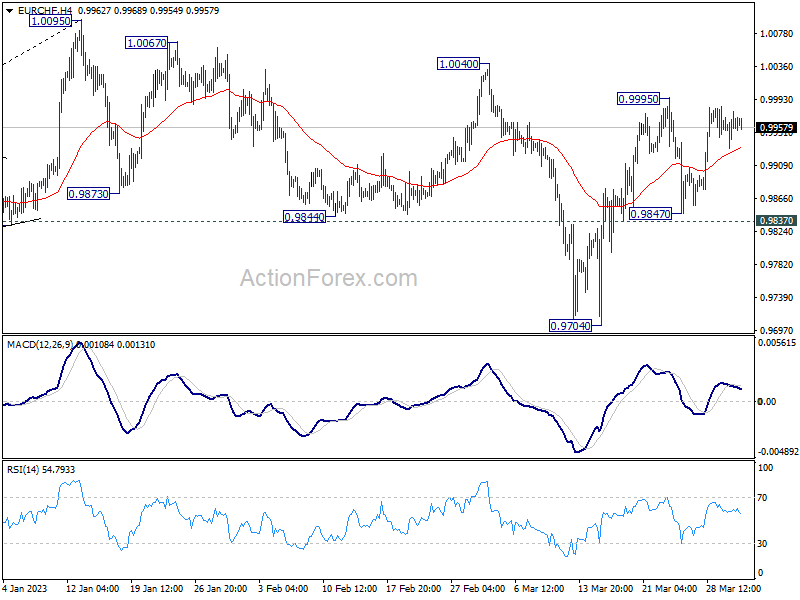
In the bigger picture, prior rejection by 55 week EMA (now at 1.1002) and 38.2% retracement of 1.1149 to 0.9407 at 1.0072 suggests that medium term outlook is staying bearish. That is, down trend from 1.2004 is not completed yet and is in favor to resume through 0.9407 at a later stage. However, decisive break of 1.0095 resistance will raise the chance of bullish trend reversal. Rise from 0.9407 should then target 1.0505 cluster resistance (2020 low at 1.0505, 61.8% retracement of 1.1149 to 0.9407 at 1.1484).
USD/CAD Daily Outlook
Daily Pivots: (S1) 1.3499; (P) 1.3540; (R1) 1.3564; More....
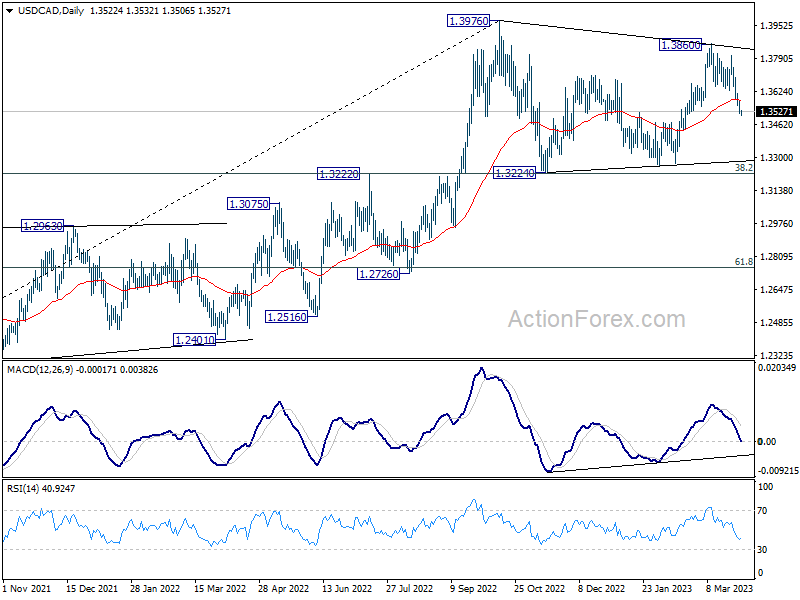
Intraday bias in USD/CAD stays on the downside at this point, and further decline is expected as long as 1.3650 support turned resistance holds. Currently decline from 1.3860 could be seen as the third leg of the corrective pattern from 1.3976, and would target 1.3224. But strong support should be seen around there to bring rebound.
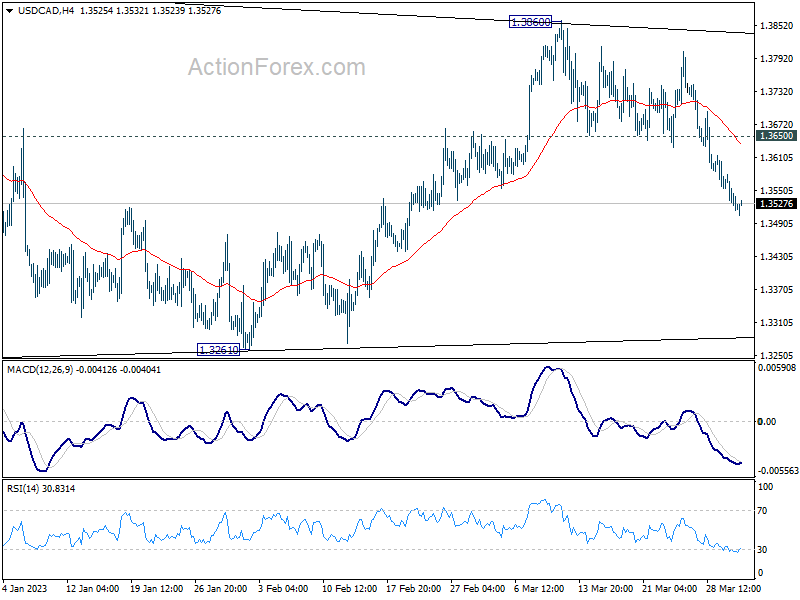
In the bigger picture, the up trend from 1.2005 (2021 low) is still in progress. Break of 1.3976 will confirm resumption and target 61.8% projection of 1.2401 to 1.3976 from 1.3261 at 1.4234. Firm break there will pave the way to long term resistance zone at 1.4667/89 (2016, 2020 highs). On the downside, sustained break of 55 week EMA (now at 1.3283) is needed to confirm medium term topping. Otherwise, outlook will remain bullish even in case of deep pull back.
AUD/USD Daily Report
Daily Pivots: (S1) 0.6677; (P) 0.6697; (R1) 0.6733; More...
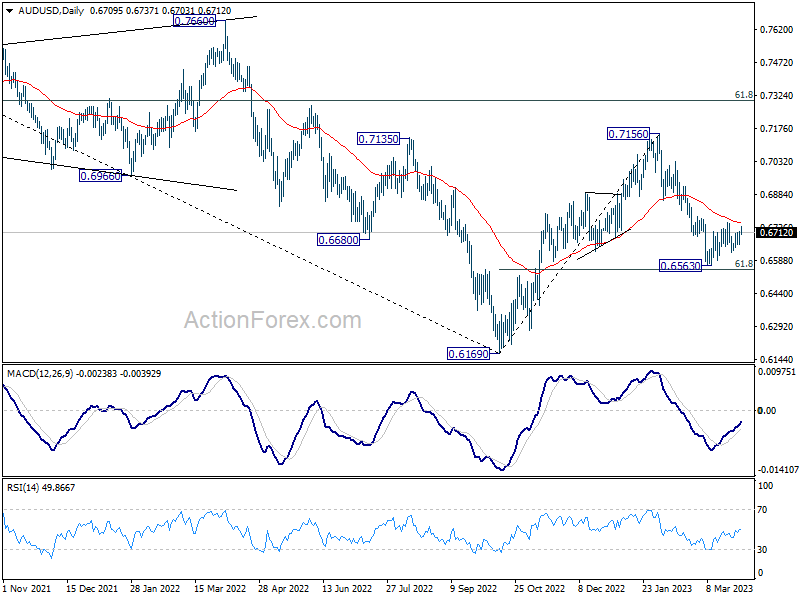
Intraday bias in AUD/USD stays neutral as range trading continues. Deeper decline is in favor as long as 0.6758 resistance holds. On the downside, decisive break of 0.6546 fibonacci level will carry larger bearish implication. On the upside, however, break of 0.6758 resistance will now be a strong signal of bullish reversal and turn bias back to the upside.
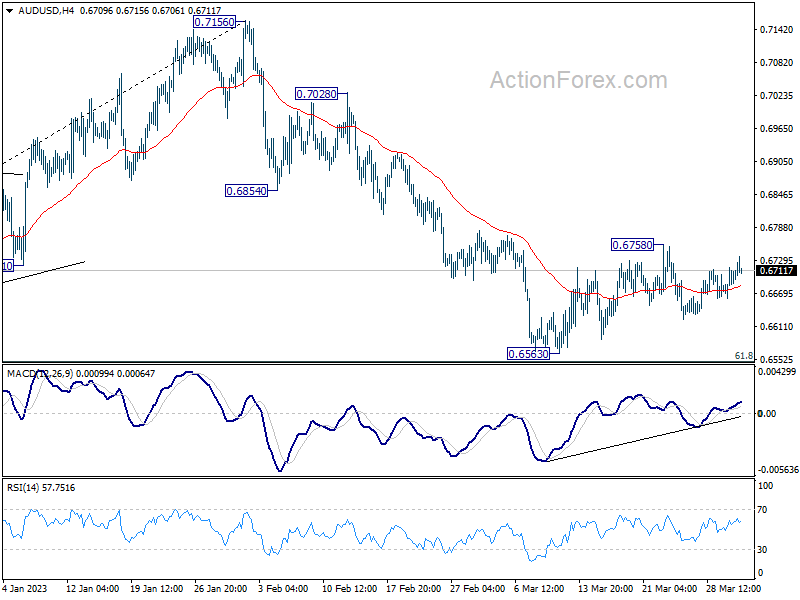
In the bigger picture, as long as 61.8% retracement of 0.6169 to 0.7156 at 0.6546 holds, the decline from 0.7156 is seen as a correction to rally from 0.6169 (2022 low) only. Another rise should still be seen through 0.7156 at a later stage. However, sustained break of 0.6546 will raise the chance of long term down trend resumption through 0.6169 low.
USD/JPY Daily Outlook
Daily Pivots: (S1) 132.28; (P) 132.62; (R1) 133.04; More...
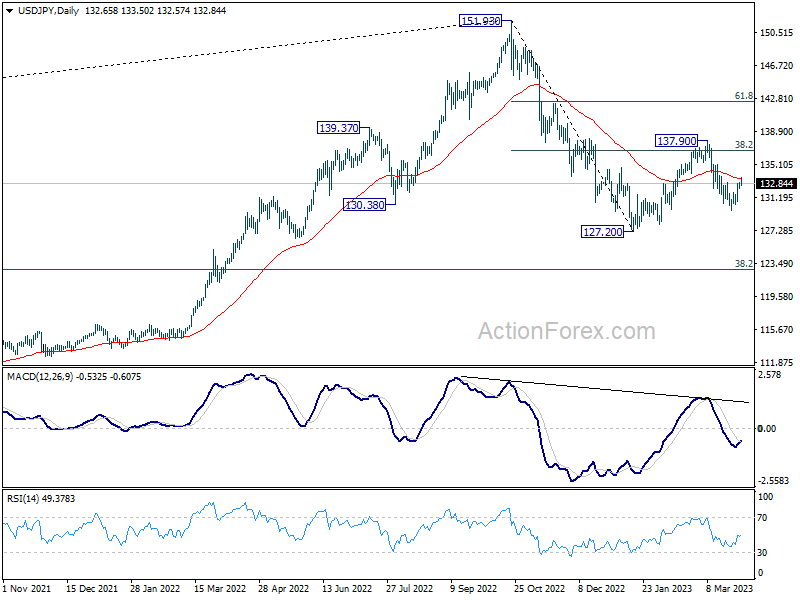
USD/JPY's break of 132.99 minor resistance argues that fall from 137.90 might have completed at 129.62. Rebound from there is seen as another leg of the corrective pattern from 127.20 low. Intraday bias is back on the upside for stronger rebound. On the downside, though, break of 129.62 will bring retest of 127.20 low.
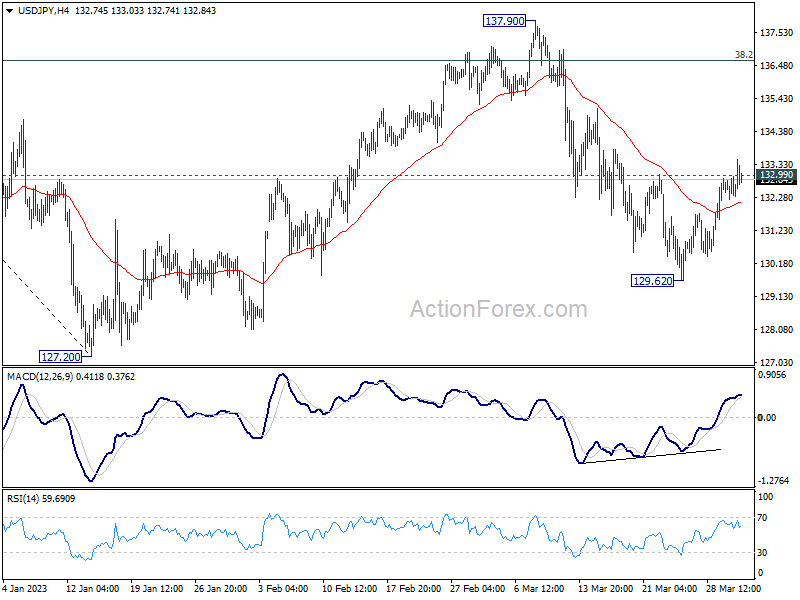
In the bigger picture, corrective pattern from 127.20 might be extending. But after all, down trend from 151.93 is expected to resume at a later stage. Break of 127.20 will resume this down trend and target 61.8% projection of 151.93 to 127.20 from 137.90 at 122.61. This will now be the favored case as long as 137.90 resistance holds.
USD/CHF Daily Outlook
Daily Pivots: (S1) 0.9107; (P) 0.9153; (R1) 0.9181; More...
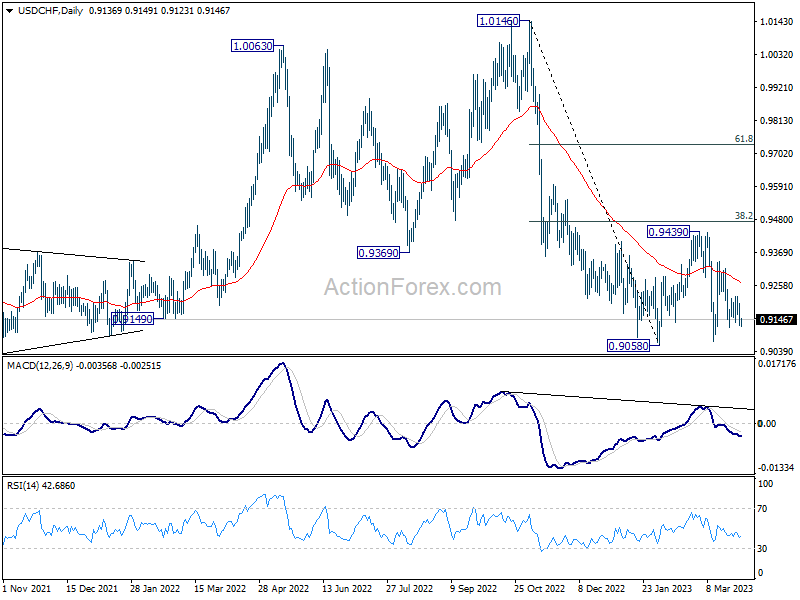
Intraday bias in USD/CHF remains neutral at this point as range trading is in progress. Corrective pattern from 0.9058 low is extending. Another rise cannot be ruled out, but upside should be limited by 0.9474 fibonacci level. On the downside, firm break of 0.9058 will resume larger down trend from 1.1046.
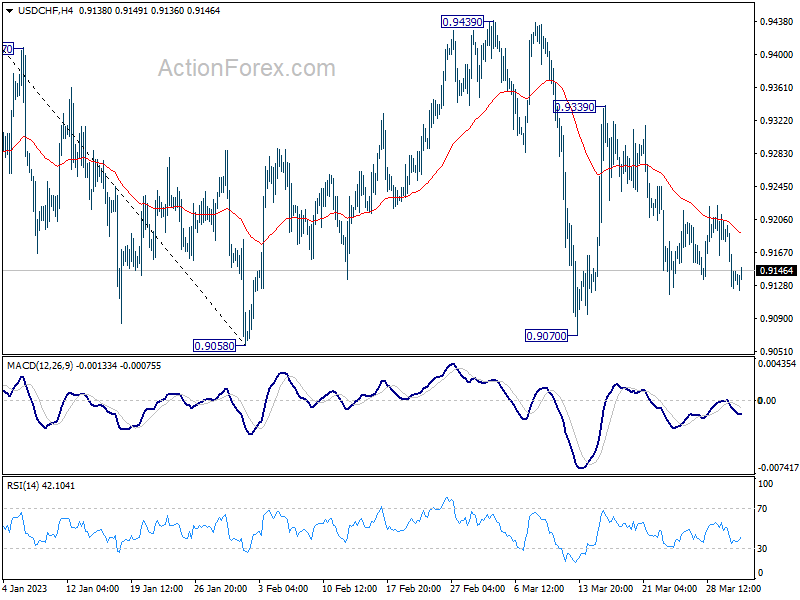
In the bigger picture, fall from 1.1046 (2022 high) should still be in progress with 38.2% retracement of 1.0146 to 0.9058 at 0.9474 intact. Prior rejection by 55 week EMA was a medium term bearish sign. Break of 0.9058 will resume such decline towards 0.8756 support (2021 low). But overall, this fall is still as a leg in the long term range pattern from 1.0342 (2016 high). So, downside should be contained by 0.8756 to bring reversal.
EUR/USD Daily Outlook
Daily Pivots: (S1) 1.0818; (P) 1.0845; (R1) 1.0872; More...
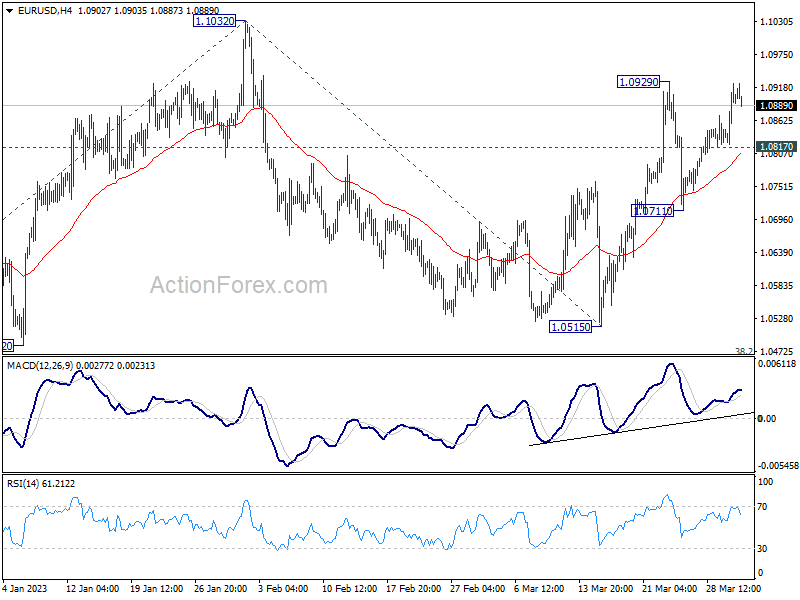
Focus remains on 1.0929 resistance in EUR/USD. Break there will resume the rally from 1.0515 to retest 1.1032 high. Decisive break there will resume larger up trend from 0.9534 to 1.1273 fibonacci level next. On the downside, though, break of 1.0711 will turn bias to the downside to extend the corrective pattern from 1.1032 with another decline.
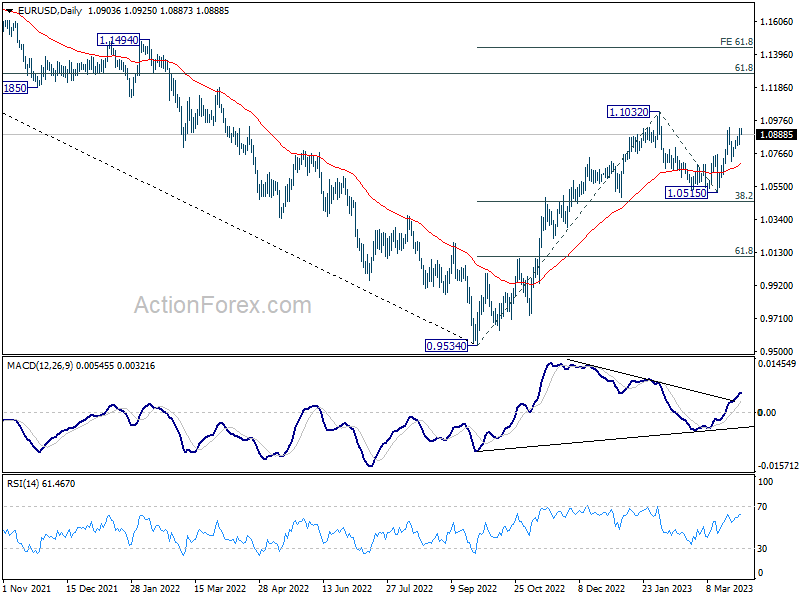
In the bigger picture, rise from 0.9534 (2022 low) is in progress with 38.2% retracement of 0.9534 to 1.1032 at 1.0460 intact. The strong support from 55 week EMA (now at 1.0623) was also a medium term bullish sign. Next target is 61.8% retracement of 1.2348 (2021 high) to 0.9534 at 1.1273. Sustained break there will solidify the case of bullish trend reversal and target 1.2348 resistance next (2021 high).
Euro Inflation Falls, But
First CPI figures from Spain and Germany confirmed that headline inflation in Europe eased by a big chunk in March, thanks to the base effect - as we now compare war months to war months.
Released yesterday, the German inflation fell from 9.3% to 7.8%, and inflation in Spain halved, from 6% to 3.1%.
Chic, but not enough.
When we filter out the energy and food prices – which exploded with the war – the inflation picture is not as optimistic. In fact, core inflation in Spain barely fell this month, from 7.6% to 7.5%.
And core inflation in the Eurozone is expected to rise to a fresh record high.
If the upside pressure in core inflation persists, no matter how fast we see the headline inflation fade, the European Central Bank (ECB) will stick to its guns to abate inflation and the euro will continue its journey higher.
The EURUSD will likely win over the 1.10 offers in the next few sessions, partly because the ECB hawks remain in charge of the market with the solid inflation, but also partly because the US dollar remains under a decent selling pressure.
The US dollar index is sitting at the low levels of the Silicon Valley Bank (SVB) collapse, and despite hawkish comments from Federal Reserve (Fed) officials – hinting at further rate hikes to tame inflation – the banking stress and soft economic data prevent the hawkish Fed pricing from taking effect.
Released yesterday, the US GDP data showed that the US economy grew 2.6% in Q4, slightly less than the 2.7% penciled in by analysts. Yet, the GDI – the gross domestic income – fell 1.1% during the same quarter, down from 2.8% printed in Q3. That was the largest decline since the pandemic.
Moreover, the US corporate profits fell 2% in Q4 – the most in the past two years – and the profit margins fell from around 15% to 14%.
As a result of soft economic data, the US 2-year yield stagnates a touch above the 4% mark – rejecting the further rate hike comments.
Soft yields continue giving support to stock indices despite warnings from the economic data front. The S&P500 will be closing the month with gains and Nasdaq 100 will step into the new quarter having stepped into the bull market.
Quarter in a nutshell
We had a quarter full of surprise and unexpected events.
We expected recession to show up, equities to fall and sovereign bonds to rally.
Instead, equities rallied, sovereign bonds fell until the SVB collapse and recession was … clearly not on the menu of the Q1.
Energy and commodities didn’t get the boost we expected from the Chinese reopening, and more importantly, money flew into money market funds with investors seeking higher returns with low-risk assets.
The technology stocks did the heavy lifting this quarter, as the Big Tech names like Apple, Microsoft and Google gained big. The FAANG stocks rallied almost 30% since the start of the year. That rally partly hid the bank selloff and saved the quarter for the S&P500. The S&P500 would be in the negative year-to-date, if Big Tech was not part of the game.
That, to me, means that the actual stock rally is certainly too sensitive to yields. If the yields push higher, due to an undesirably high inflation for example, we could see the recent equity gains crumble.
And the higher yields, which also boosts appetite for cash could be the next headache for banks, and for equities.
One last thing before we go
Today, the US will release the February PCE data – the Fed’s favourite gauge of inflation. Core inflation may have eased on a monthly basis but is expected to remain steady on a yearly basis around the 4.7% mark. A read in line with expectations, or ideally lower than expected could keep the Fed hawks at bay, and let the dollar further relax.
In the dollar-yen, we see the quarter end flows feed into a softer yen and a stronger dollar-yen. The pair is testing an important resistance zone, around 133, including the 50-DMA and the minor 23.6% Fibonacci retracement on October to January retreat.
With the softening Fed expectations, and increasingly pressure on Bank of Japan (BoJ) – to end its no-longer-adopted easy monetary policy under the new Governor Ueda, there is certainly not much positive potential in the dollar yen. The price rallies could be interesting top selling opportunities for a fall toward the 125/127 range.