Sample Category Title
WTI Futures Lose Ground Below Short-Term SMAs
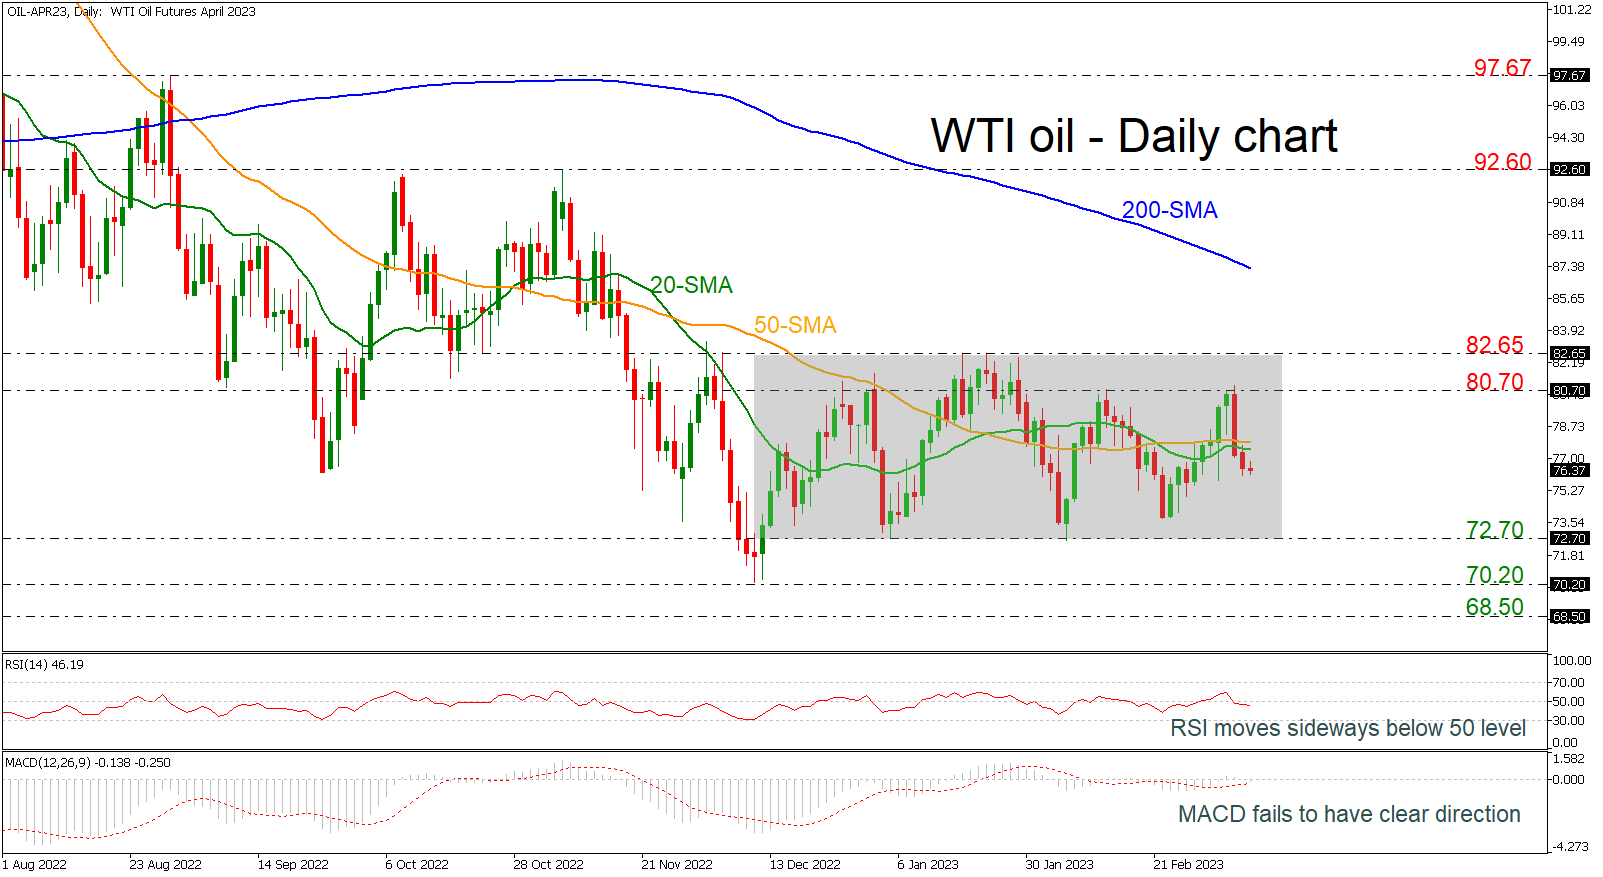
WTI crude oil futures are easing beneath the 20- and 50-day simple moving averages (SMAs), which are acting as a mid-level of the medium-term consolidation area of 72.70-82.65. The RSI is moving slightly lower below the neutral threshold of 50, while the MACD is losing momentum near its trigger and zero lines.
The market seems to be well supported by the lower boundary of the range at 72.70 and therefore only a decisively close below it would put traders in a more negative mode. If that floor is breached it would lead to a re-challenge of the 70.20 barrier, while below it the bears are eagerly waiting to take full control and drive towards a tougher barrier around 68.50.
Alternatively, if the bulls jump above the short-term SMAs, the spotlight will shift back to the 80.70 resistance and the upper band of the range at 85.65, a break of which would extend the upward move towards the 200-day SMA at 87.26. Above that, the door would open for the 95.60 top.
In brief, oil prices are expected to hold withing a sideways channel unless the price closes significantly below 72.70 or above 82.65.
ETHUSD Extends Retreat below 50-day SMA
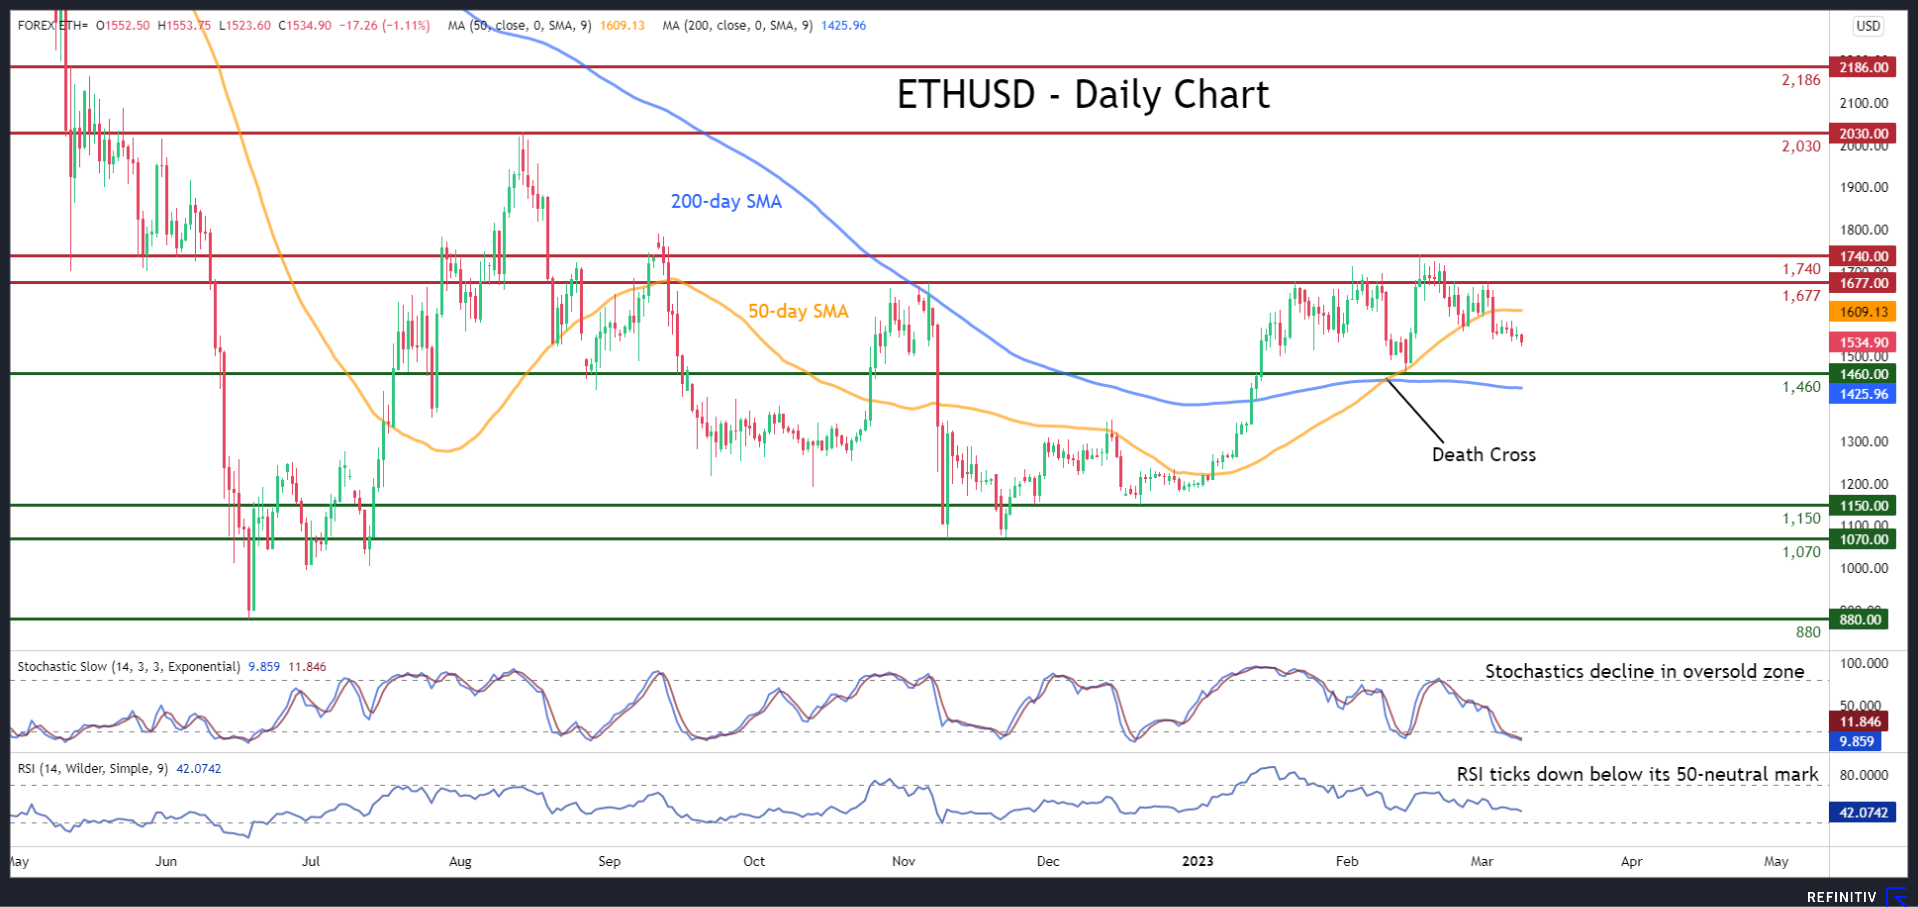
ETHUSD (Ethereum) has staged a significant rally since the beginning of the year, posting a fresh five-month high of 1,740 in mid-February. However, the digital asset has come under pressure lately, with the price crossing below its 50-day simple moving average (SMA) for the first time since January 4.
The momentum indicators currently suggest that the bearish forces are reigning supreme. Specifically, the stochastic oscillator is descending within its 20-oversold zone, while the RSI is ticking downwards below its 50-neutral mark.
To the downside, if selling pressures persist, initial support could be met at the recent low of 1,460. Sliding beneath that floor, the price could descend towards 1,150 or lower to test the November double-bottom region of 1,070. A break below the latter could open the door for the 2022 bottom of 880, which is also a two-year low.
Alternatively, should the price reverse higher, the 1,677 resistance zone, which also held strong in November, could act as the first resistance point. Conquering this barricade, the bulls may aim for the 2023 peak of 1,740 before the August high of 2,030 appears on the radar. Even higher, the 2,186 hurdle could prove to be a tough one for the price to overcome.
Overall, even though some oversold signals have emerged, ETHUSD keeps sloping downwards after violating the crucial 50-day SMA. For that bearish tone to reverse, the price needs to cross above the 1,740 ceiling.
USDCAD Tests a Make-or-Break Point
USDCAD skyrocketed in the wake of Powell’s hawkish rate hike comments, with the Bank of Canada adding more fuel to the rally on Thursday after saying that inflation may decelerate significantly in the middle of the year.
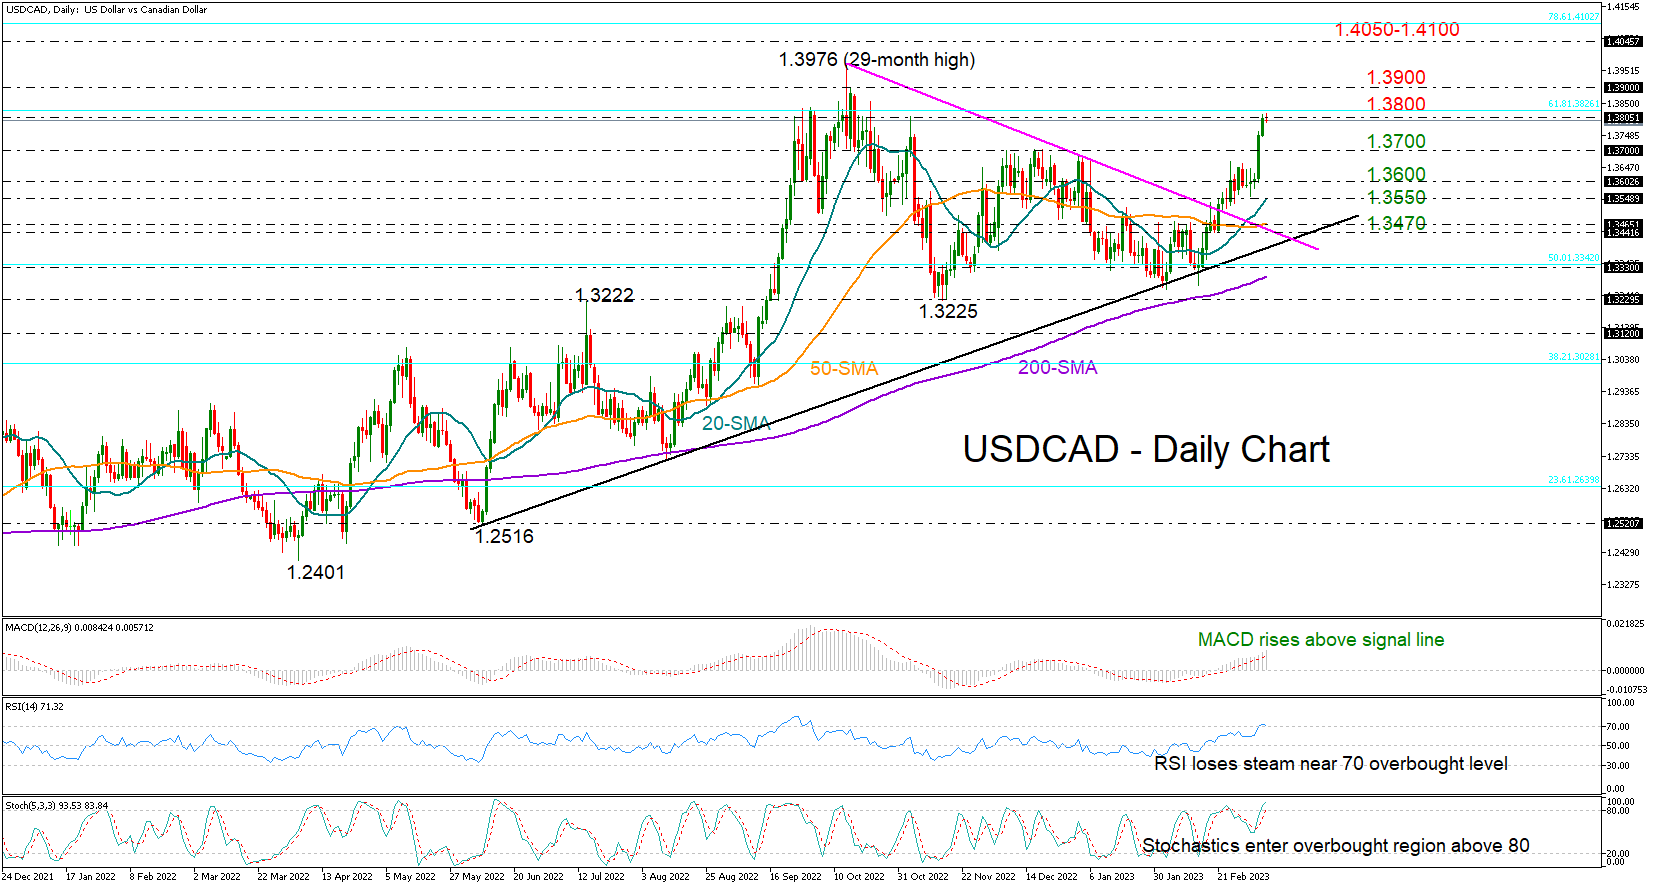
The pair rallied by 1.4% over the past two days to pause at a three-month high of 1.3816. This is where the uptrend from 2021 stalled last fall and a similar episode could play again as the RSI and the Stochastic oscillator flag overbought conditions. Yet, the indicators have not found a peak yet, while the MACD keeps trending upwards in the positive area, suggesting that there might be some extra bullish power in the market.
Strikingly, the 61.8% Fibonacci retracement of the 2020-2021 downtrend is also acting as resistance around 1.3800. Therefore, traders may wait for a clear close above that bar before they target the 1.3900 psychological level. If the uptrend resumes above October's 1.3976 top, resistance could next pop up somewhere between 1.4050 and the 78.6% Fibonacci of 1.4100.
In the bearish scenario, where the price gets rejected at 1.3800, the former resistance zone of 1.3700 may switch to a support area ahead of the 1.3600 number. The 20- and 50-day simple moving averages (SMAs) could next come into view at 1.3550 and 1.3470 respectively.
Summing up, USDCAD seems to be trading at a make-or-break point around 1.3800. A successful penetration higher would raise hopes for an uptrend resumption. Otherwise, the five-month-old consolidation phase could continue for longer.
GBP/JPY: Waiting for Growth in a Zigzag Pattern
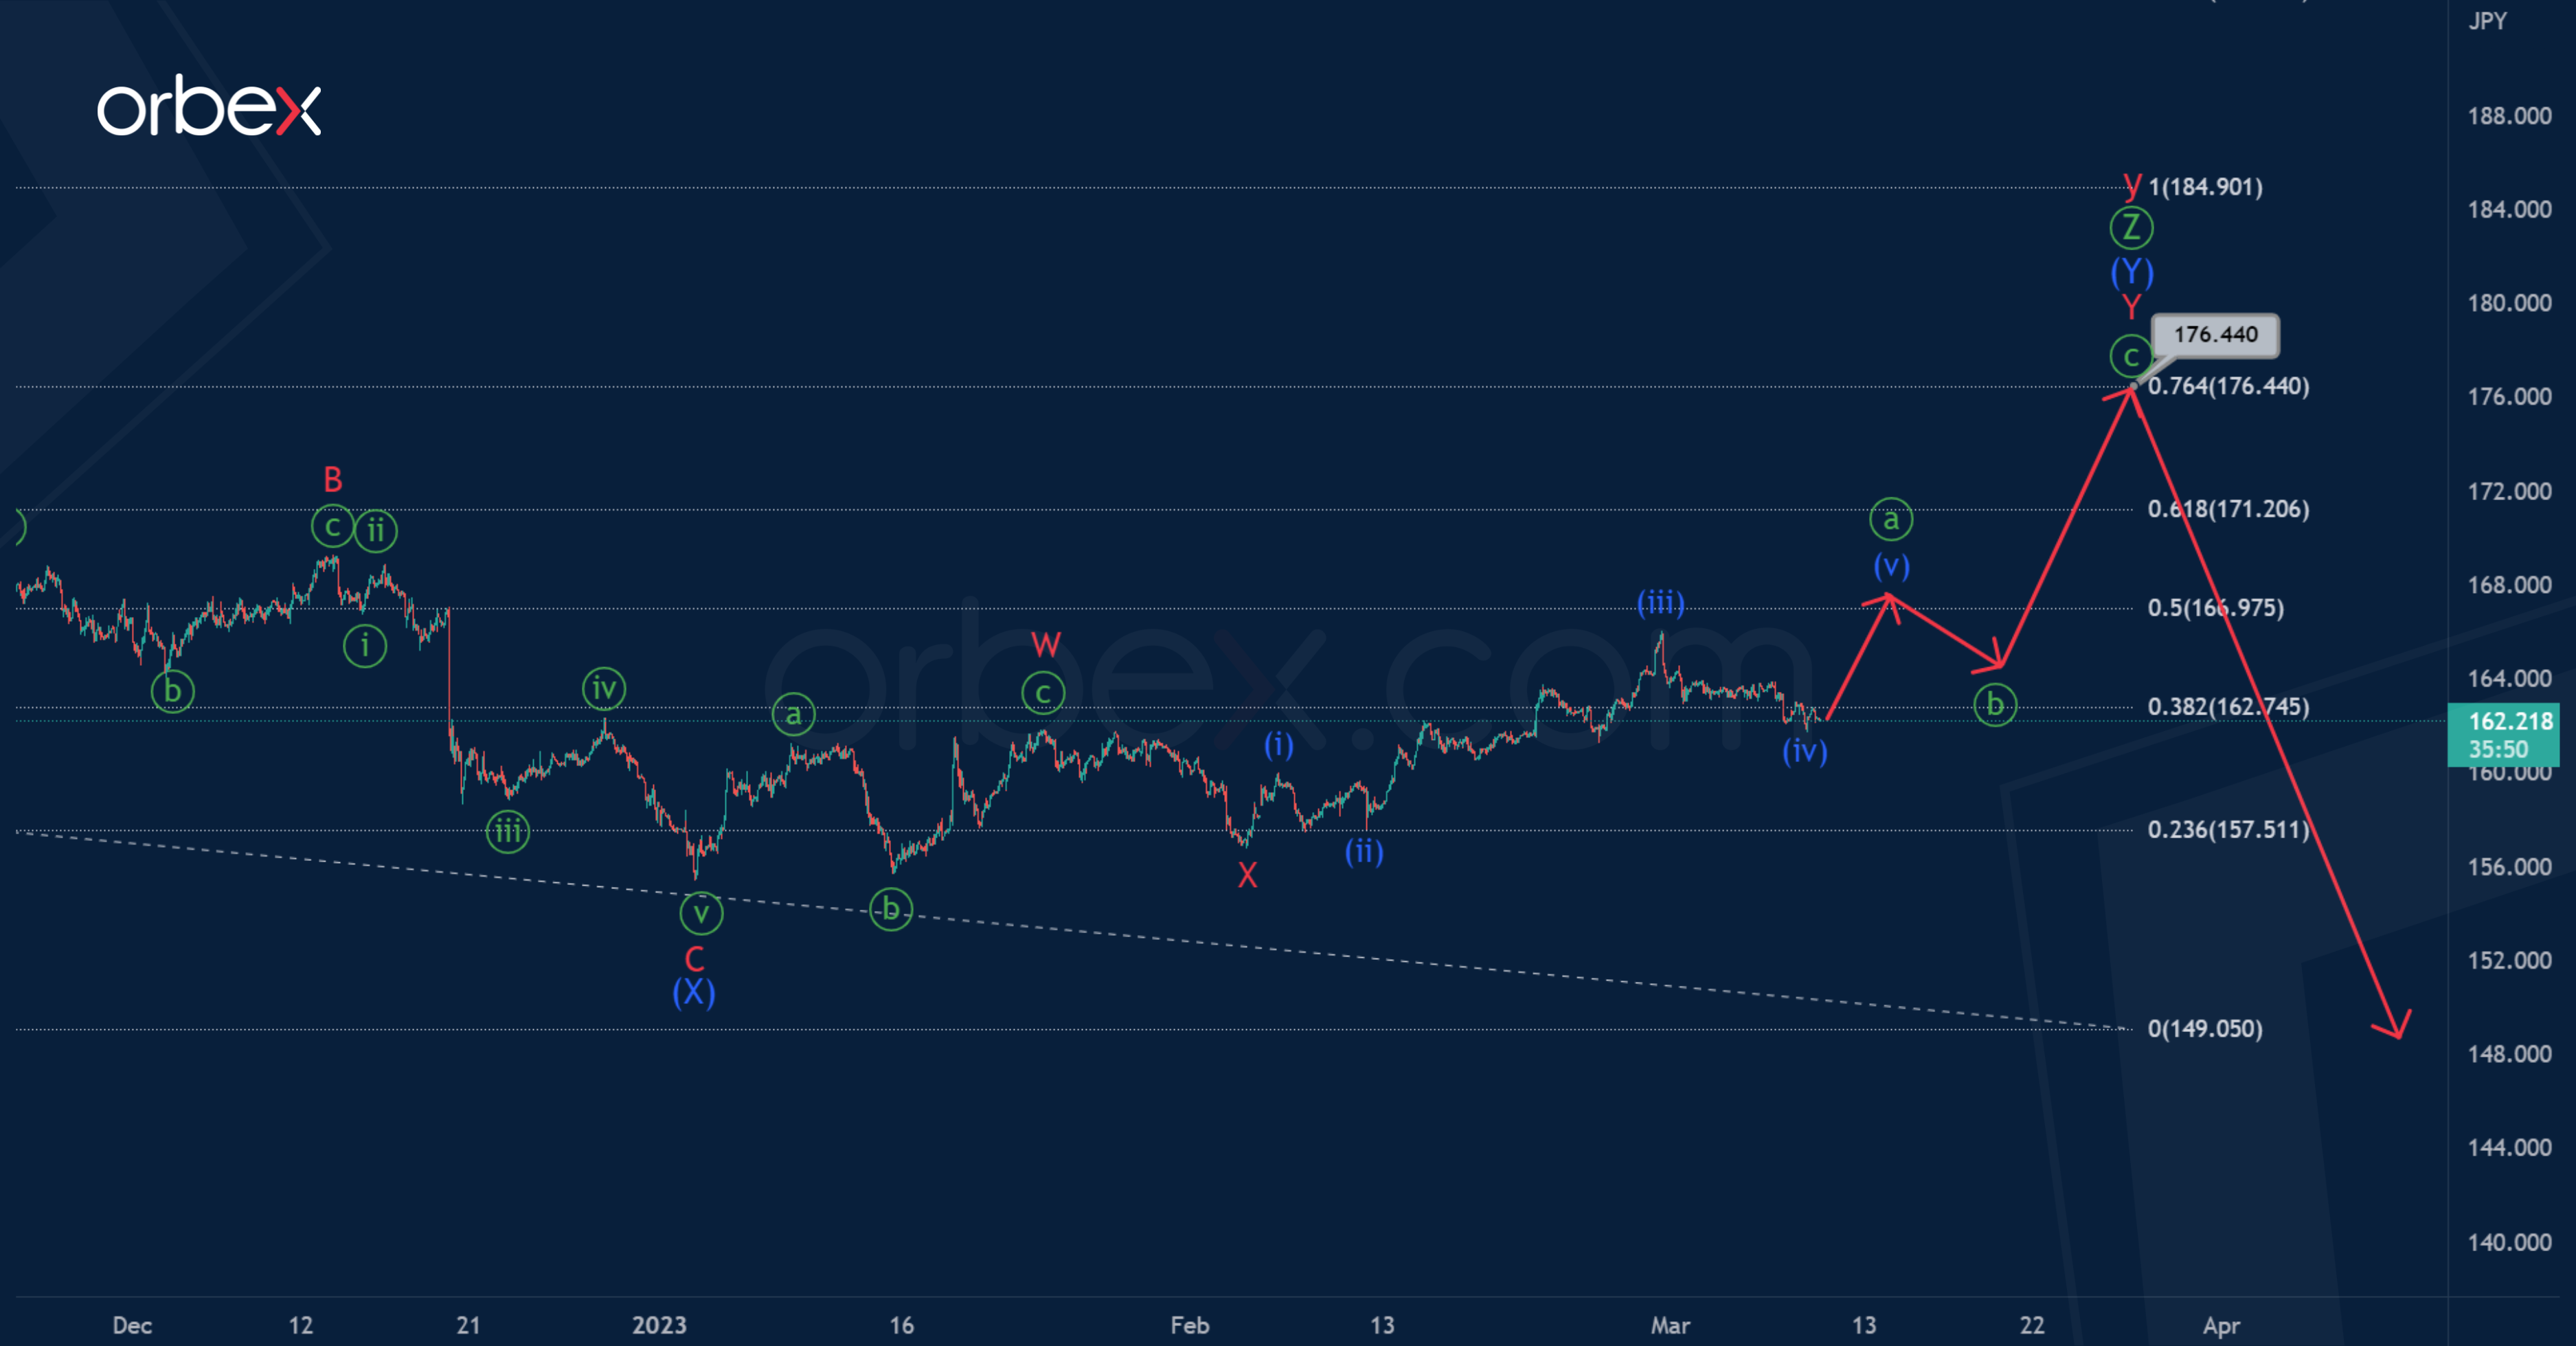
On the current chart for the GBPJPY pair, we see the final part of the triple zigzag Ⓦ-Ⓧ-Ⓨ-Ⓧ-Ⓩ inside a large wave y. As part of the triple zigzag, the last sub-wave Ⓩ is formed. It seems to take the form of a double zigzag (W)-(X)-(Y).
Perhaps two sub-waves (W) and (X) are completed. The last actionary wave (Y) is currently under development, it may take the form of a double zigzag W-X-Y. To complete this double zigzag , a minor sub-wave Y is needed.
The bulls are probably aiming at 176.44. At that level, wave (Y) will be at 76.4% of previous actionary wave (W).
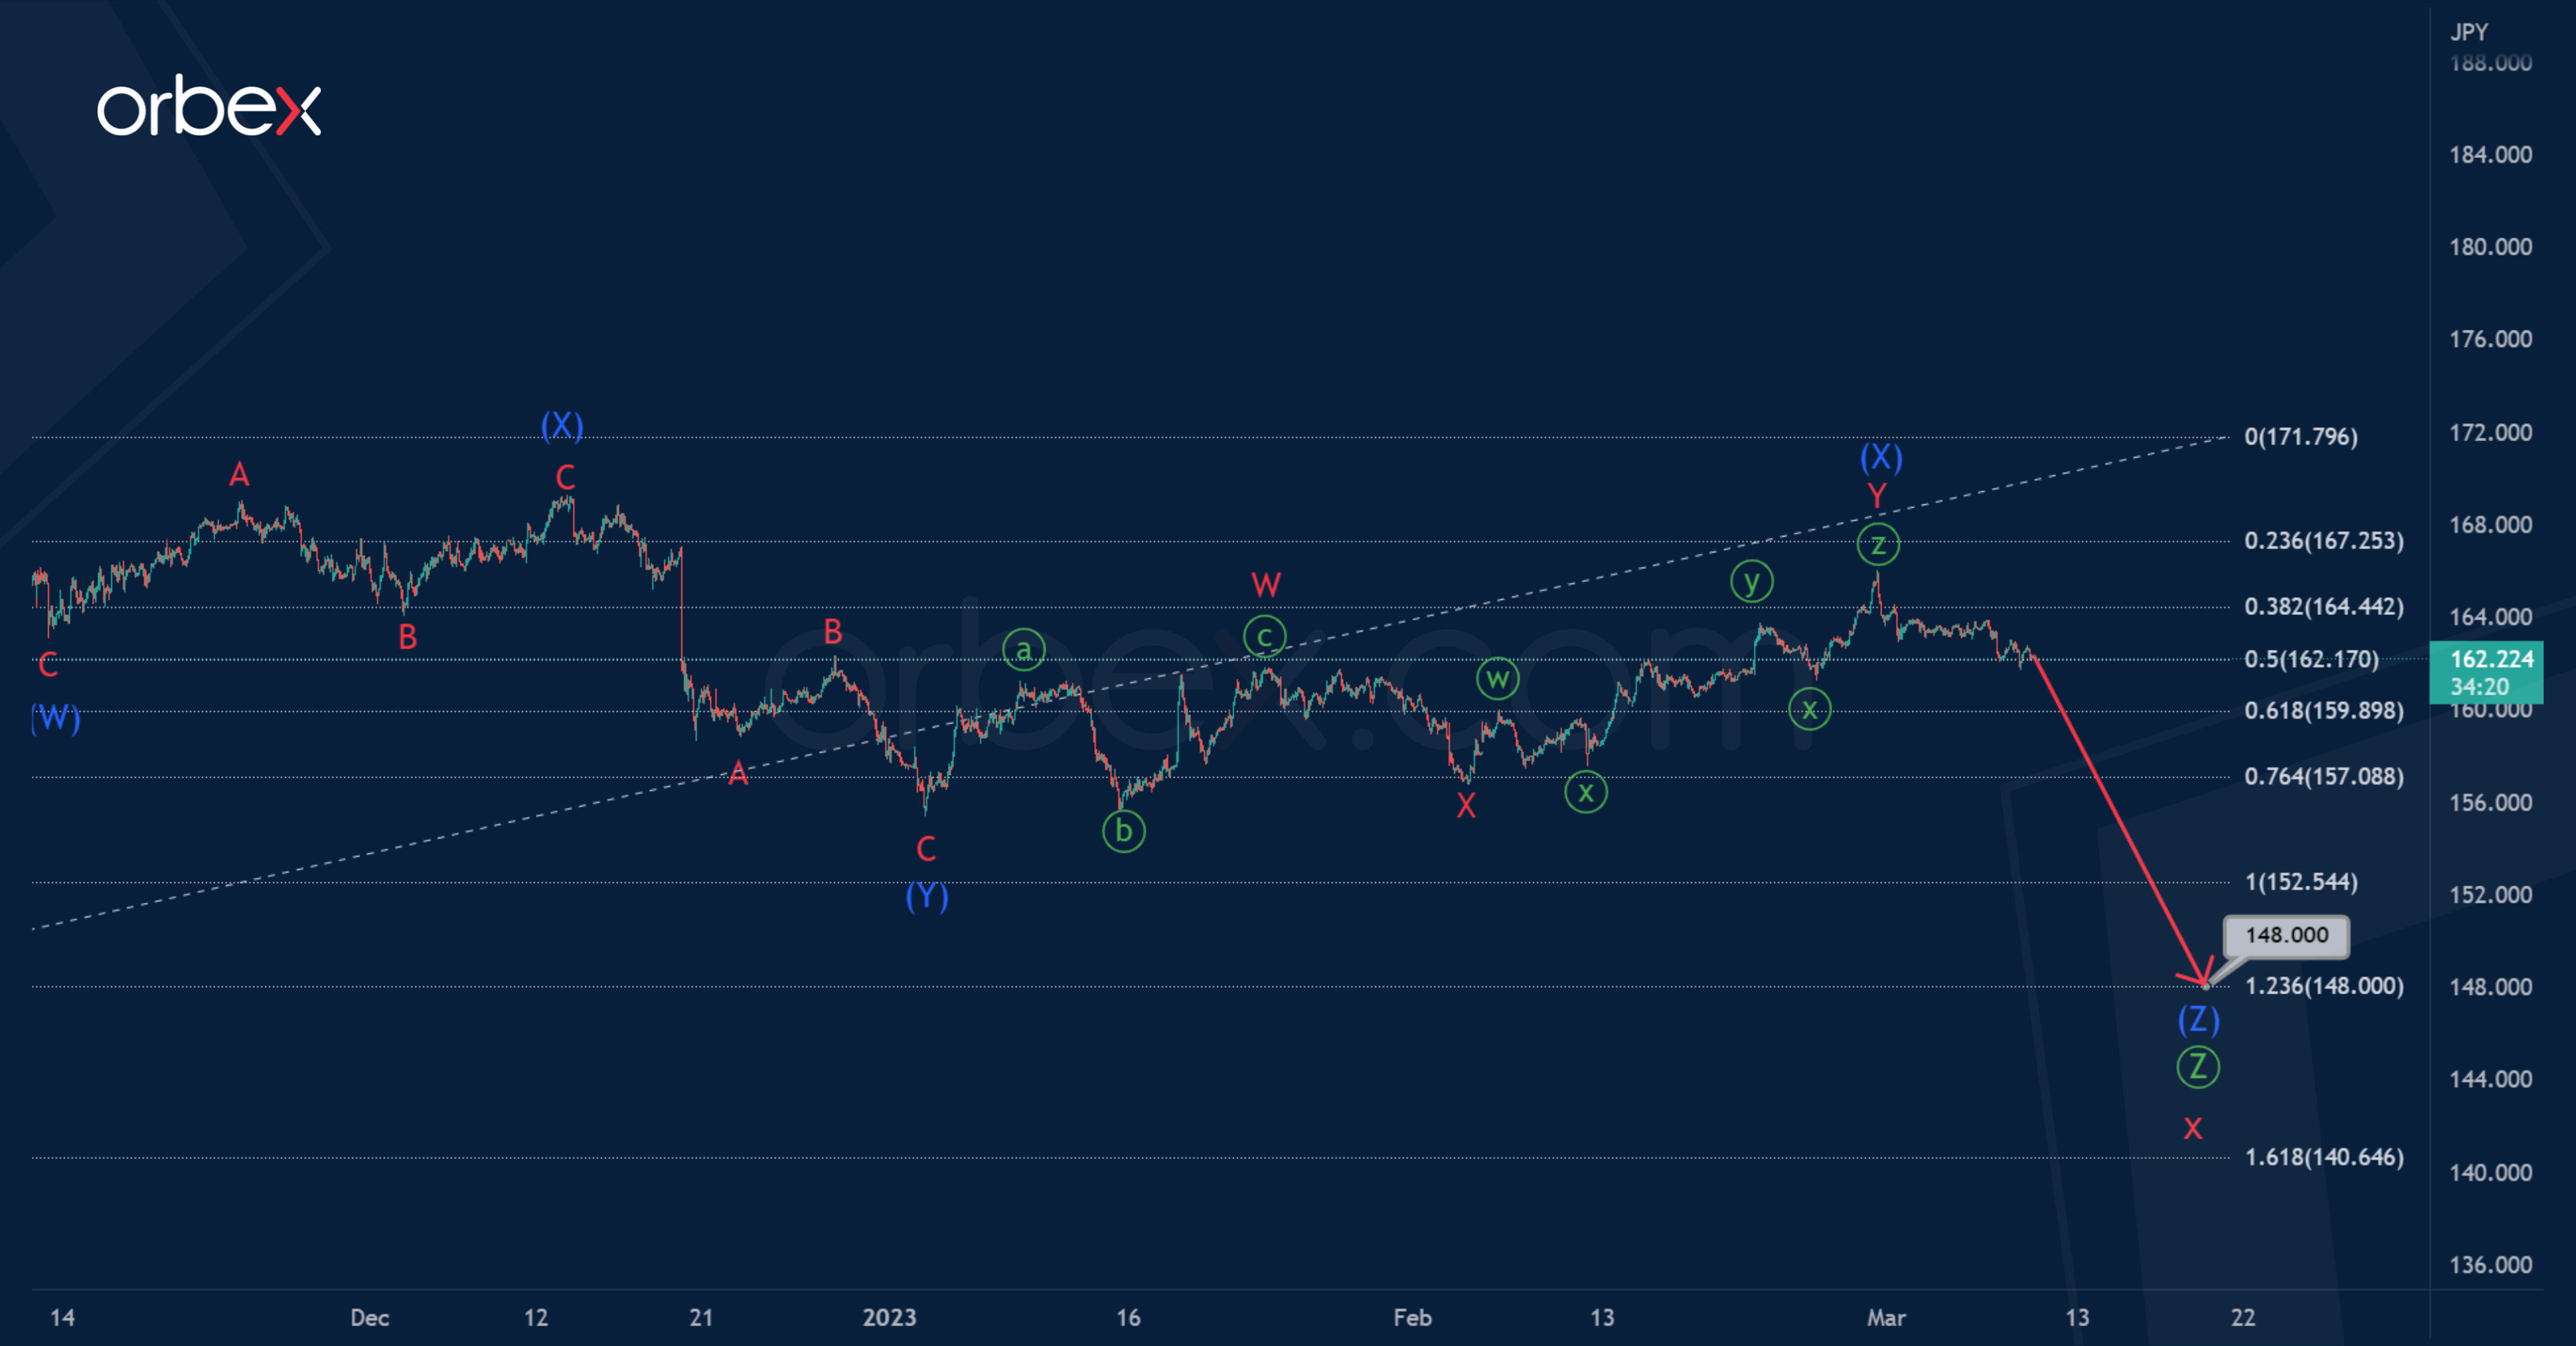
In the second scenario, a bearish intervening wave x is formed. It can end in the form of a triple zigzag, for the construction of which a final sub-wave Ⓩ is needed.
The current structure of the primary wave Ⓩ suggests an intermediate triple zigzag (W)-(X)-(Y)-(X)-(Z). The first four zigzag sub-waves have already been completed. In the next coming trading days, we are waiting for a drop in the sub-wave (Z) to 148.00.
At the specified level, wave Ⓩ will be at 123.6% of actionary wave Ⓨ.
GBP/JPY Daily Outlook
Daily Pivots: (S1) 161.94; (P) 162.47; (R1) 163.21; More...
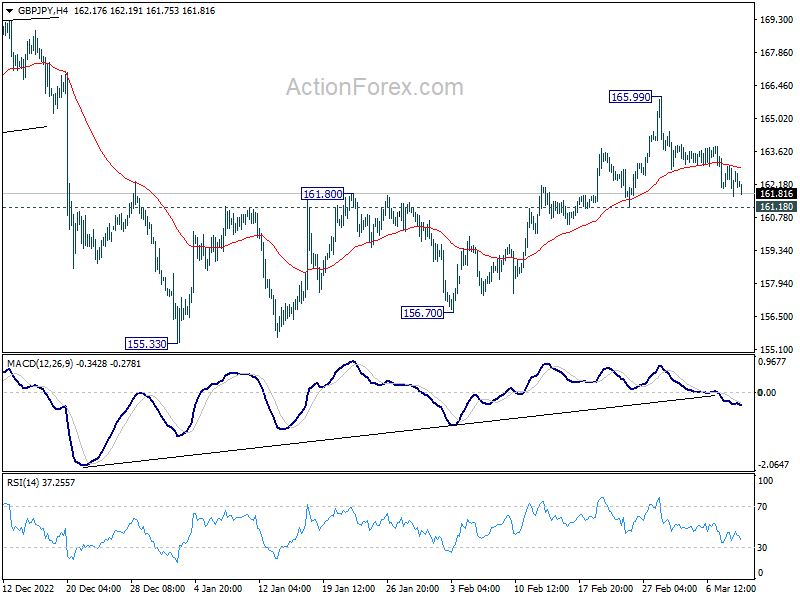
Intraday bias in GBP/JPY remains neutral and outlook is unchanged. Further rally is still expected as long as 161.18 support holds. As noted before, corrective fall from 172.11 should have completed at 155.33 already. Break of 165.99 will target 169.26 resistance first, and then 172.11 high. However, break of 161.18 support will dampen this view and turn bias to the downside for 156.70 support instead.
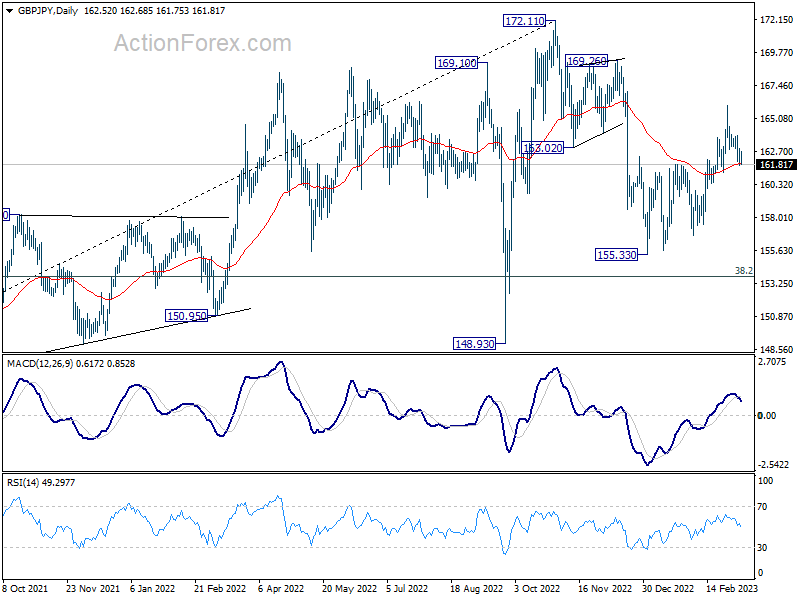
In the bigger picture, corrective decline from 172.11 medium term should have completed at 155.33. With 38.2% retracement of 123.94 (2020 low) to 172.11 (2022 high) at 153.70 intact, medium term bullishness is retained. That is, larger up trend from 123.94 (2020 low) is still in progress. Break of 172.11 high to resume such up trend is expected at a later stage.
EUR/JPY Daily Outlook
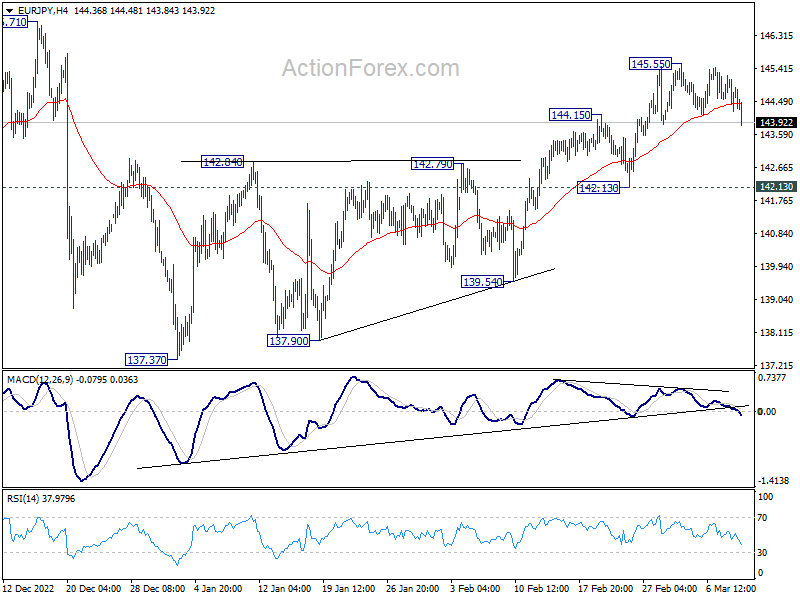
Daily Pivots: (S1) 144.29; (P) 144.77; (R1) 145.29; More....
Intraday bias in EUR/JPY stays neutral and outlook is unchanged. Further rally is expected as long as 142.13 support holds. Corrective fall from 148.38 has completed at 137.37 already. Break of 145.55 will resume the rise from 137.37 to 146.71 resistance and then 148.38 high.
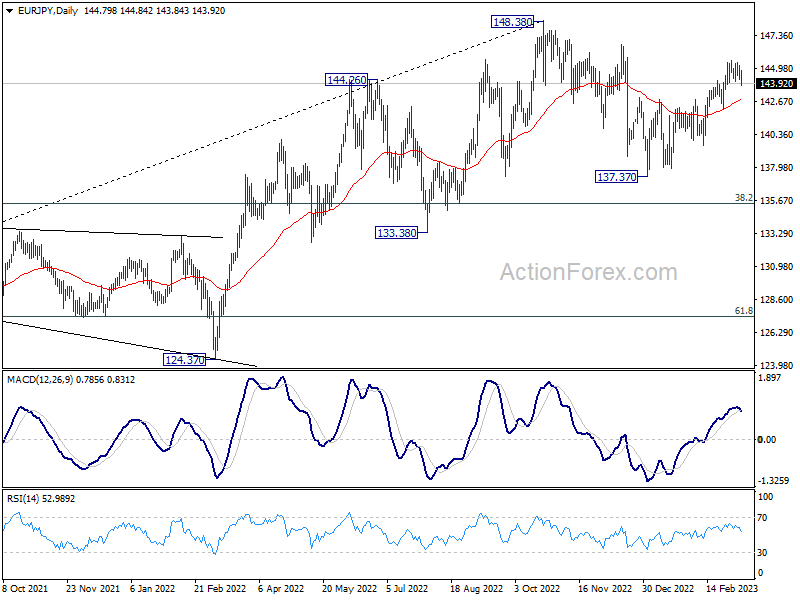
In the bigger picture, as long as 55 week EMA (now at 139.42) holds, larger up trend from 114.42 (2020 low) is still in progress for 149.76 long term resistance. However, firm break of 55 week EMA will bring deeper fall to 38.2% retracement of 114.42 to 148.38 at 135.40. Sustained break there will raise the chance of trend reversal, and target 61.8% retracement at 127.39.
EUR/GBP Daily Outlook
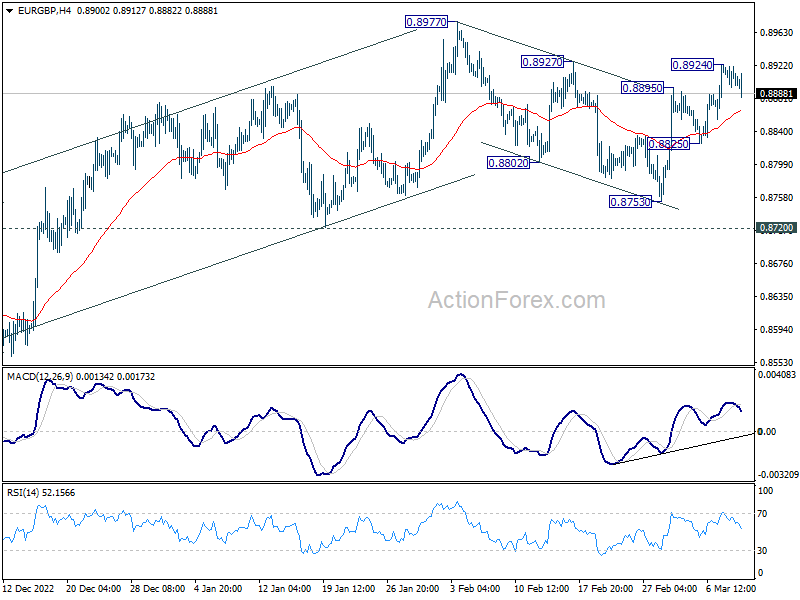
Daily Pivots: (S1) 0.8891; (P) 0.8907; (R1) 0.8917; More...
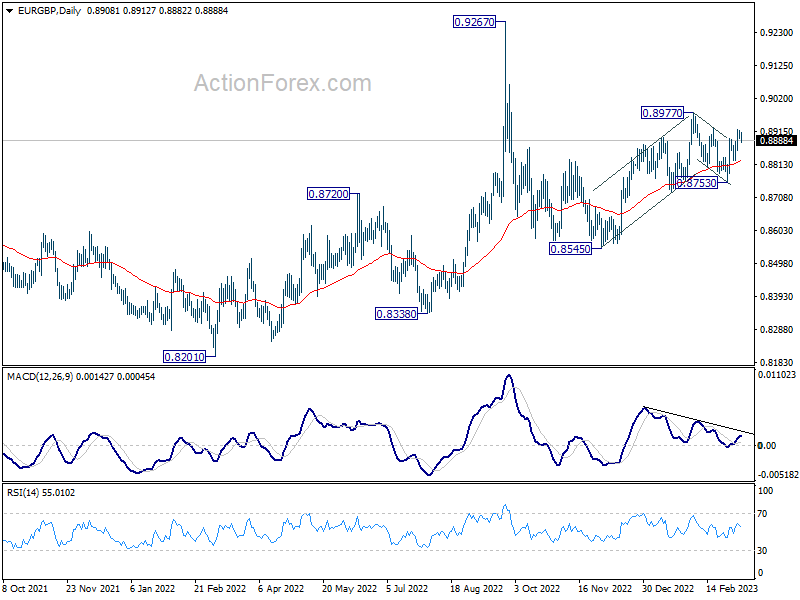
In the bigger picture, outlook is rather mixed for now, except that price actions from 0.9267 (2022 high) are part of the long term range pattern from 0.9499 (2020 high). With 0.8720 support intact, rise from 0.8545 is in favor to continue through 0.8977. However, firm break of 0.8720 will argue that such rebound has completed, and open up deeper fall through this support level.
EUR/AUD Daily Outlook
Daily Pivots: (S1) 1.5949; (P) 1.5991; (R1) 1.6043; More...
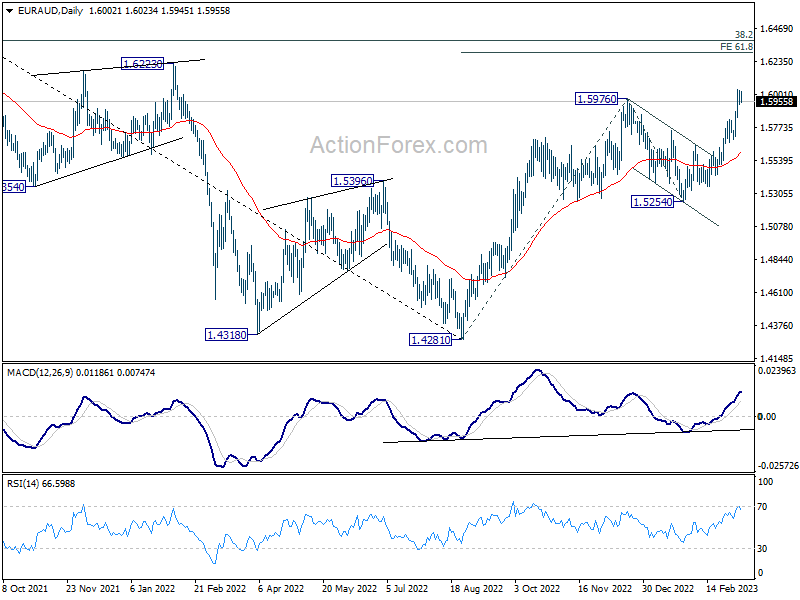
A temporary top is formed at 1.6040 in EUR/AUD and intraday bias is turned neutral for consolidations. Downside of retreat should be contained by 1.5826 resistance turned support to bring another rally. Above 1.6040 will resume the larger rally to 61.8% projection of 1.4281 to 1.5976 from 1.5254 at 1.6302.
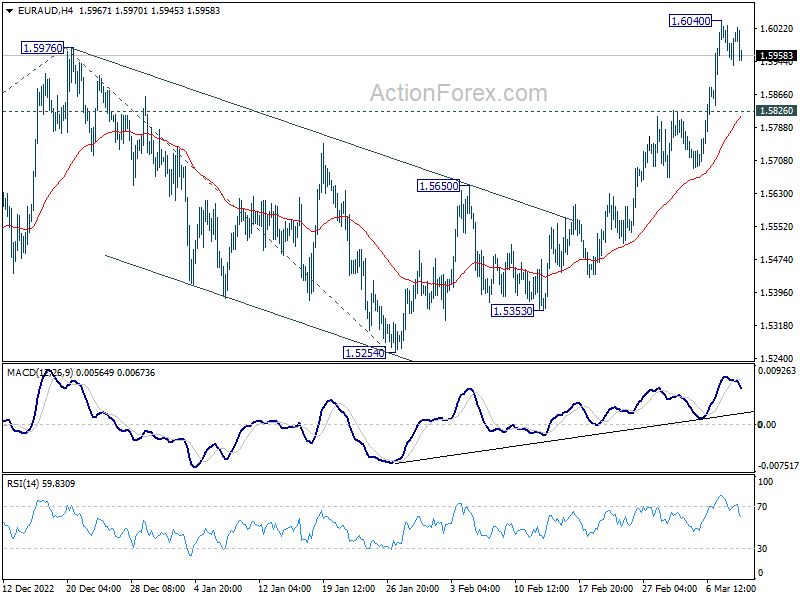
In the bigger picture, the strong support from 55 week EMA (now at 1.5396) is raising the chance of bullish trend reversal. On break of 1.5976, focus will be on 1.6434 cluster resistance (38.2% retracement of 1.9799 to 1.4281 at 1.6389). Sustained break there should confirm that whole down trend form 1.9799 (2020 high) has completed. However, rejection by this cluster resistance will make medium term outlook neutral at best.
EUR/CHF Daily Outlook
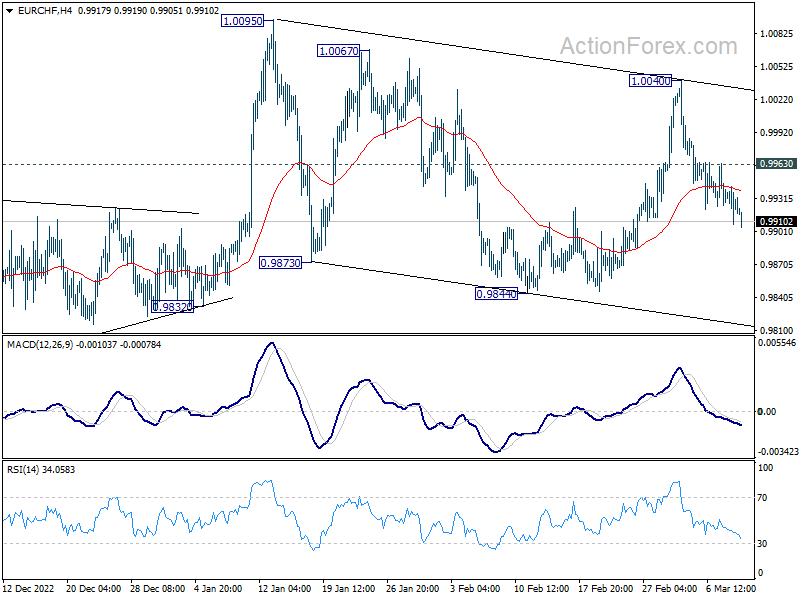
Daily Pivots: (S1) 0.9909; (P) 0.9927; (R1) 0.9943; More....
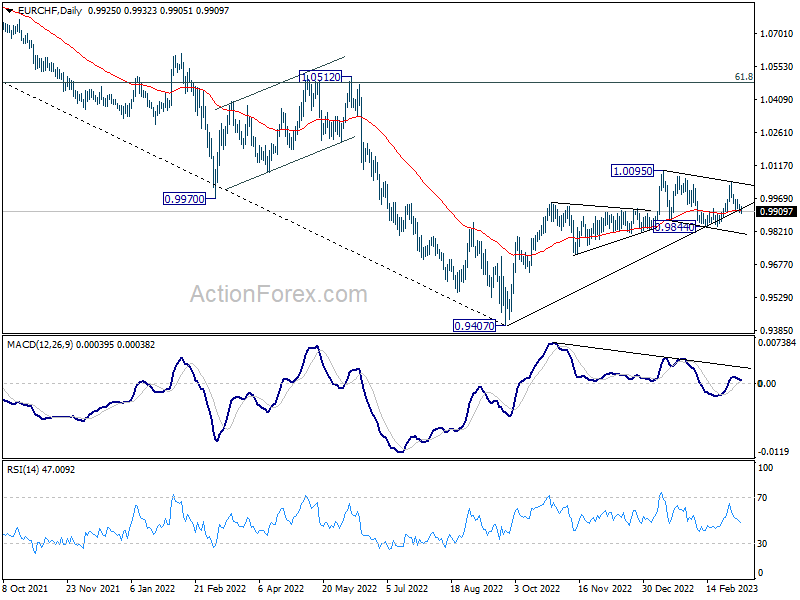
Intraday bias in EUR/CHF remains on the downside as fall from 1.0040 is in progress. Such decline is seen as another falling leg inside the corrective pattern from 1.0095. Deeper fall would be seen back to 0.9844 support. But downside should be contained by 0.9832 to bring rebound. On the upside, above 0.9963 minor resistance will turn bias back to the upside for 1.0040 resistance instead.
In the bigger picture, with 0.9832 support intact, rise from 0.9407 (2022 low) is still expected to continue. Break of 1.0095 and sustained trading above 55 week EMA (now at 1.0021) will be a medium term bullish signal, and bring further rally to 1.0505 cluster resistance (2020 low at 1.0505, 61.8% retracement of 1.1149 to 0.9407 at 1.1484). However, firm break of 0.9832 support will revive medium term bearishness and bring retest of 0.9407 low instead.
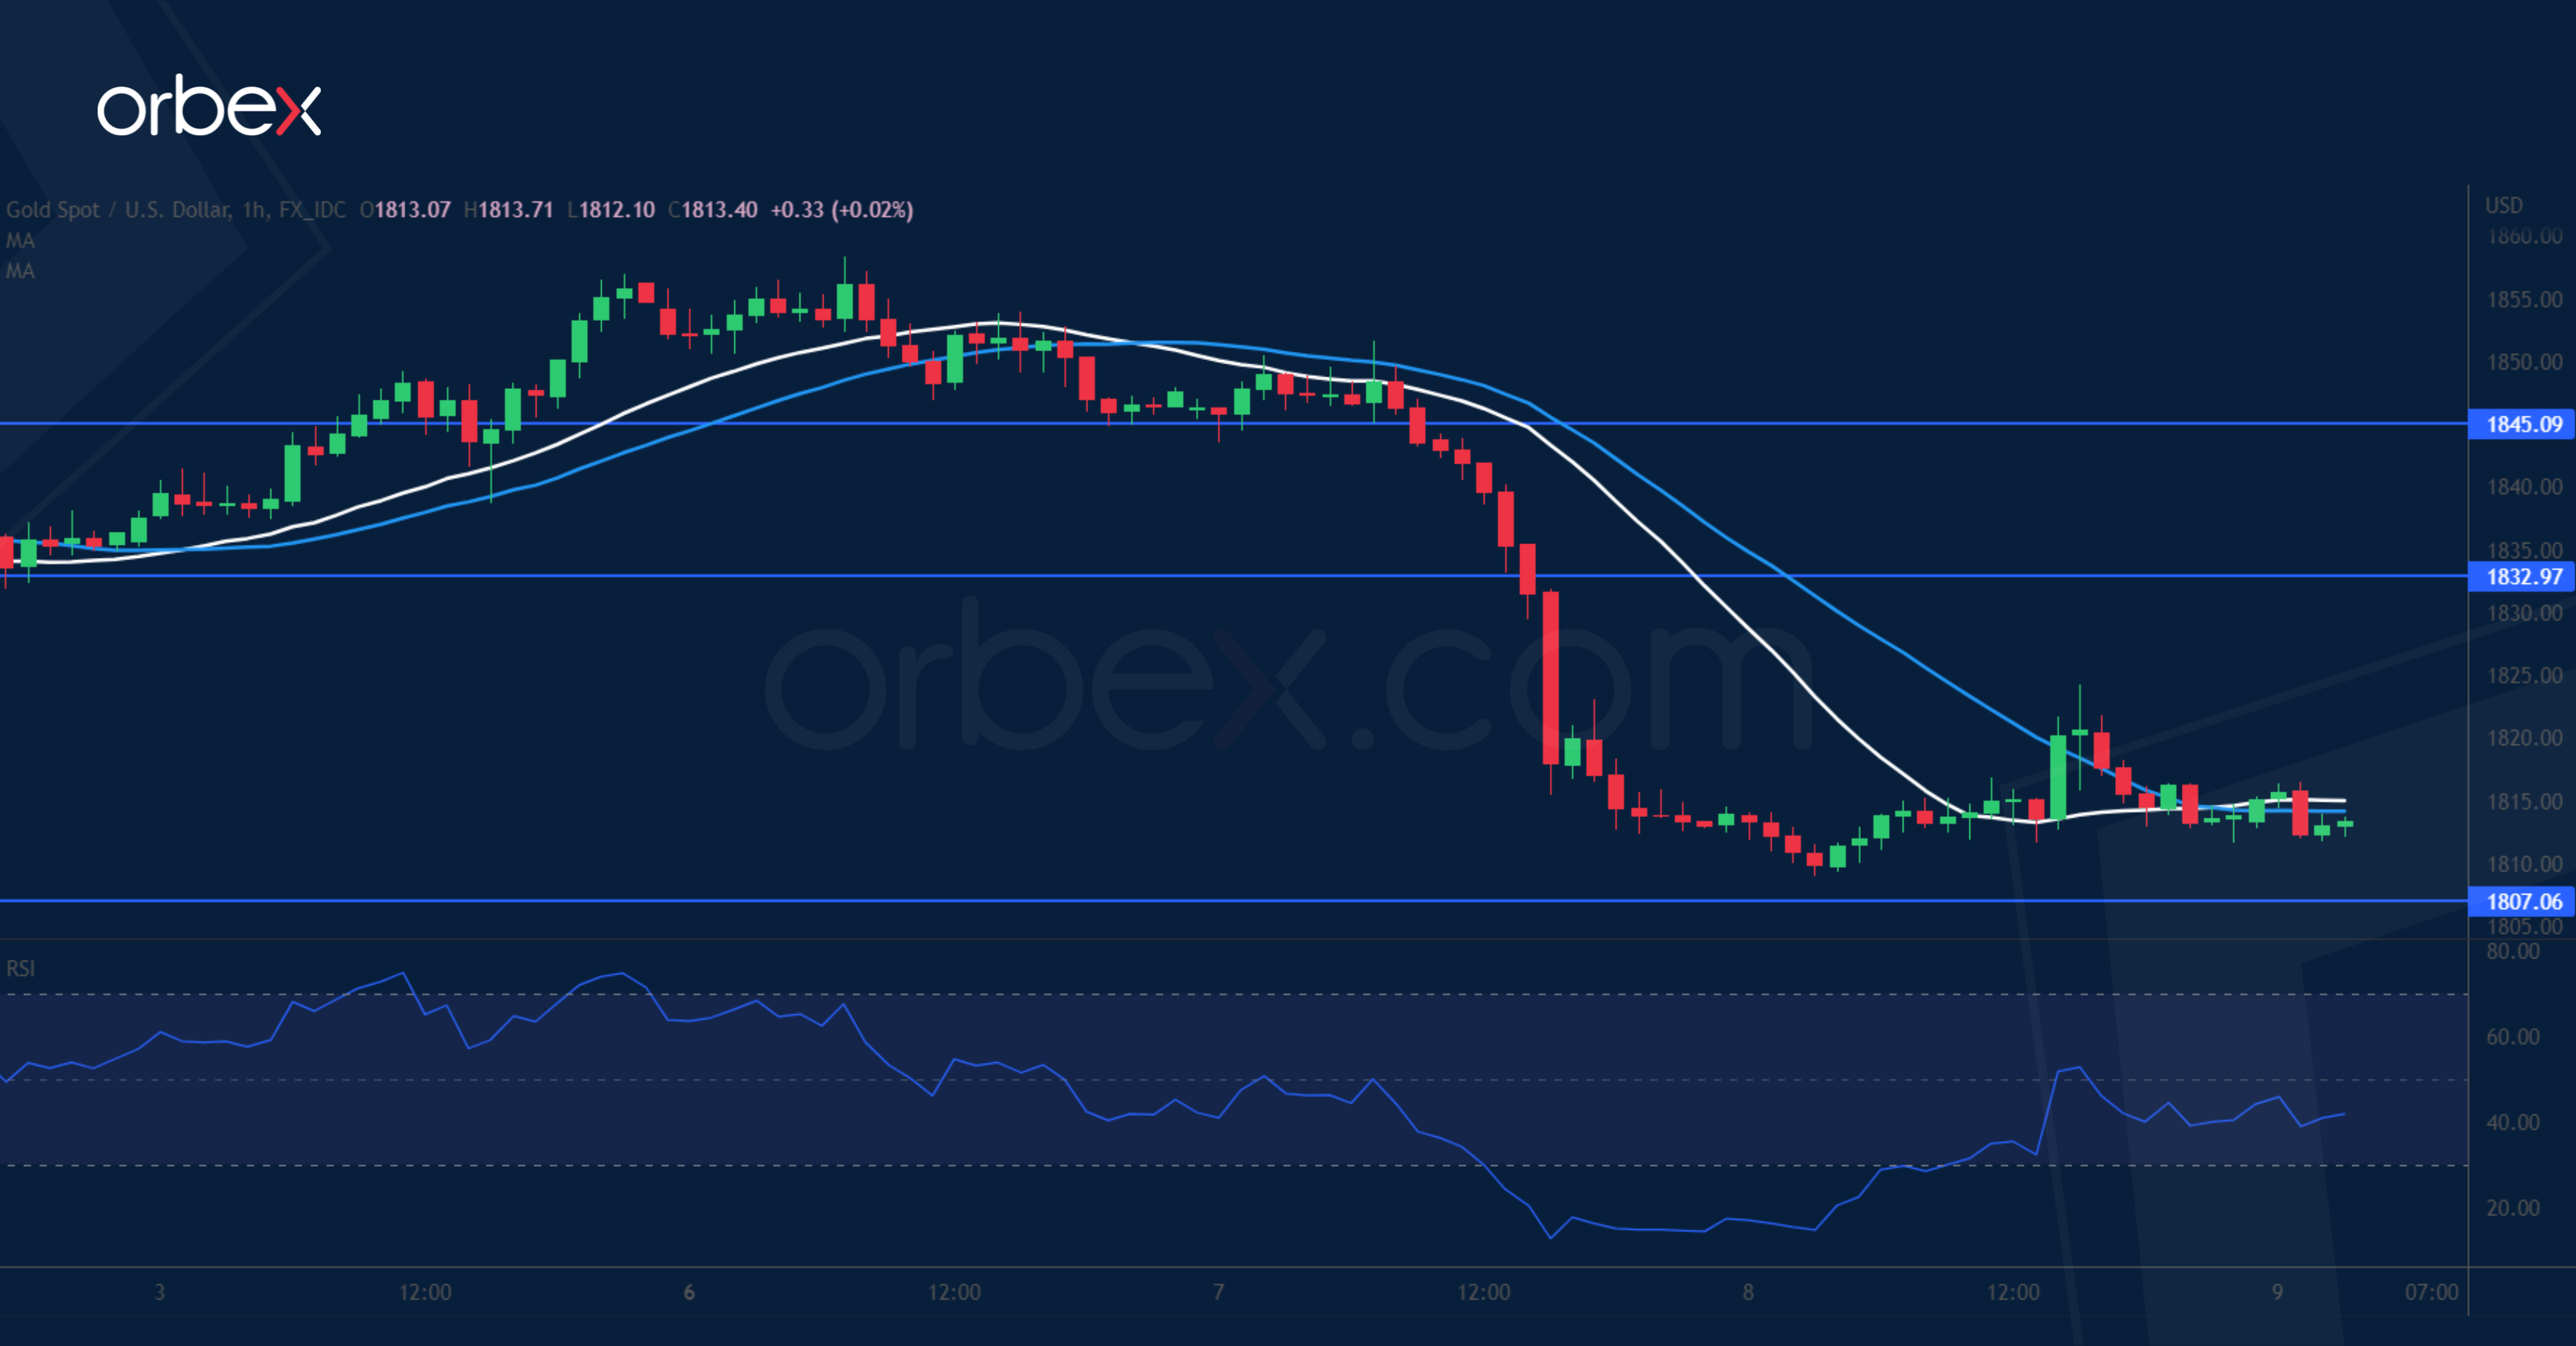
XAU/USD Grinds Major Support
Gold struggles as the dollar index trades near a three-month high following Powell’s hawkish testimony. The precious metal has given up all gains from its bounce earlier this month, putting the bulls on the defensive. As the price revisited the bottom at 1807, the RSI’s oversold condition attracted bargain hunters. But buyers must lift multiple hurdles before they could turn sentiment around. 1833 is the first resistance and the selling pressure may increase all the way to 1845. 1785 would be next in case of a bearish breakout.