Sample Category Title
China Opens to Recovery; Yuan Moves Up
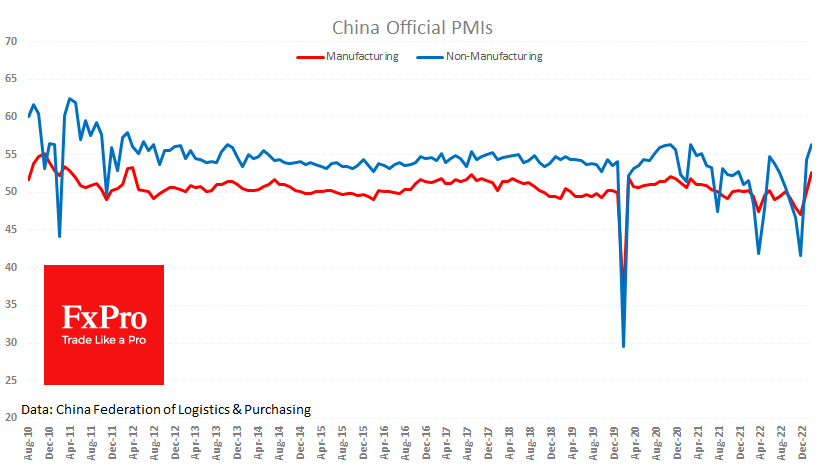
Lifting the lockdown and the end of the Lunar New Year celebrations led to a strong rebound in Chinese economic activity. The manufacturing PMI jumped to 52.6 in February from 50.1 the previous month, according to an official release from the CFLP. MarkIt’s manufacturing PMI (which conducts similar surveys worldwide) rose from 49.2 to 51.6 last month.
In both cases, we see a move from stagnation or a slight contraction to a growth rate that the official report has not seen since 2017. This can easily be explained by a low base, as the survey assesses the dynamics of the reporting month compared to the previous month.
The acceleration in the services sector is also impressive. The non-manufacturing PMI jumped to 56.3 in February, up from 54.4 in January. Growth in the services sector was the fastest since March 2021.
While China’s main challenge will be maintaining this growth rate, such a sharp turnaround surprised economists. They had expected a much smoother return to growth.
Markets have also underestimated China’s ‘vibrant’ reopening, with the renminbi up 1.4% against the dollar today, its strongest since late November.
The rise in the Yuan is important from a technical point of view, as it sets the USDCNH up for further declines. The pair’s rally in February from 6.70 to 6.99 appears to have been a corrective bounce from the October high of 7.35. Since the beginning of this week, the pair has fallen from the 61.8% Fibonacci retracement level and failed to reach the psychologically important 7.0 level, where it had a prolonged consolidation in December.
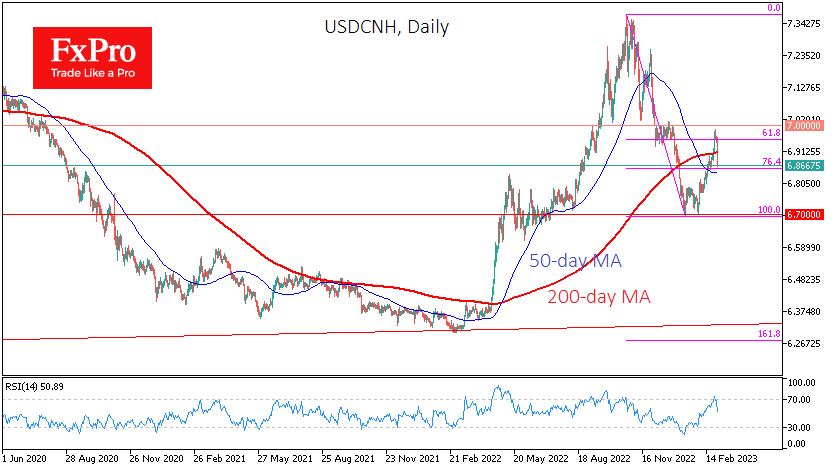
A complete realisation of the above formation implies that USDCNH would fall to 6.28-6.30. This is the crucial area of the cyclical lows of February last year and April 2018. In both cases, the USD/Yuan reversed to the upside on the back of cooling rhetoric from the US and European authorities towards China and an impressive revision of the country’s economic outlook. It would be premature to bet on a return of the renminbi to those heights. A return to 6.7, where the pair was a month ago, may be challenging for the renminbi bulls.
However, the 200 SMA indicates that it could change its trend, as we could see an abrupt move below this line today, which would be a strong sign that the USD buyers will capitulate from this critical level that the big banks are looking for. The Yuan is working very dutifully through the 200 SMA. Consolidation below 6.9 today (now 6.86) could repeat the situation in mid-2020 when such a breakout was a prologue for a big dip.
There is also a counterexample from February 2019, when a break of this support line led to a horizontal consolidation but not the trend reverse. Macroeconomic data and some dollar weakness in recent days suggest that the renminbi will continue to strengthen in the coming weeks and test 6.7 by the end of March, leaving the potential for a move lower.
ISM Manufacturing Index Posts Fourth Consecutive Contractionary Print Amid Challenging Conditions
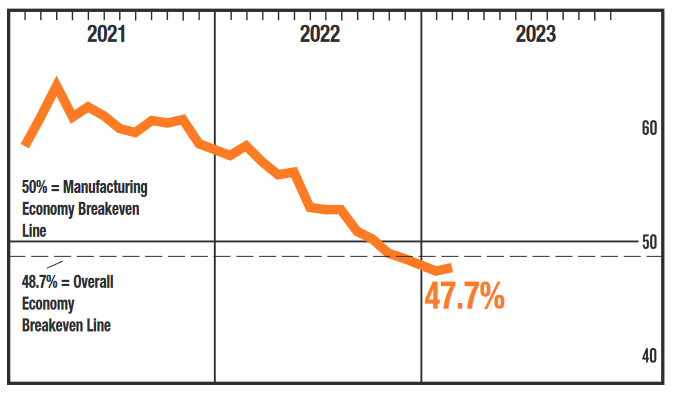
The February ISM manufacturing index registered 47.7, slightly below expectations calling for a 48.0 print. The index rose 0.3 percentage points (pp) from January's reading of 47.4.
New orders rose 4.5 pp to 47.0, while new export orders were relatively flat, rising slightly to 49.9.
The backlog of orders sub-index rose to 45.1, up 1.7 pp from January's 43.4 print.
The production index fell 0.7 pp to 47.3, extending its decline, while the employment index edged down 1.5 pp to 49.1.
The supplier deliveries sub-index fell to 45.2 from 45.6 in January. Meanwhile, the prices index rose a sharp 6.8 pp to 51.3 in February – indicating rising raw materials prices.
Only 4 of 18 manufacturing industries reported growth in February. The industries reporting growth are Apparel, Leather & Allied Products; Transportation Equipment; Petroleum & Coal Products; and Electrical Equipment, Appliances & Components.
Key Implications
As expected, the ISM manufacturing index showed the sector contracted in February. This really isn't all that surprising given the circumstances – a one-two punch of high interest rates and a rotation of consumer spending back to services. Looking at some of the details, the new orders subindex continues to show declining demand – albeit at a noticeably slower pace than in January.
Our recent work has highlighted the multitude of headwinds facing the manufacturing sector as 2023 rolls along. The confluence of higher rates, slowing demand in key trading partners, and consumers that have spent the last few years stocking up on stuff are making for a challenging medium-term landscape for goods producers. However, several factors such as pent-up auto demand, rising military spending, and large investments in the automotive and semiconductor space should help keep a floor under the manufacturing sector as it goes over the latest bump.
Fed Bostic wants rate at 5-5.25% until well into 2024
Atlanta Fed President Raphael Bostic said Fed should hike by 50bps to 5.00-5.25%, and hold it at that level until well into 2024. "We must determine when inflation is irrevocably moving lower," he wrote in an essay. "We're not there yet."
"That's why I think we need to raise the federal funds rate to between 5-5.25% and leave it there well into 2024. This will allow tighter policy to filter through the economy and ultimately bring aggregate supply and aggregate demand into better balance and thus lower inflation."
"If we are going to get inflation back in the range of our target, the breadth of inflation will have to narrow considerably," Bostic wrote. "When inflation is no longer top of mind, our mission will largely be accomplished. We are clearly not there yet. But I—and the Committee—are committed to doing all we can to ensure that we get there as soon as possible."
Fed Kashkari: Risk of under-tightening greater than over-tightening
Minneapolis Fed President Neel Kashkari he is "open-minded" on either a 25bps or a 50bps rate hike at the March meeting. But he also noted, "I think my colleagues agree with me that the risk of under-tightening is greater than the risk of over-tightening
Karikari also said, "what's more important is what we signal in the dot plot... At this point I haven't decided what my dot is, but I would lean towards continuing to push up my rate and policy path,"
"Given the data in the last month — the inflation report and strong jobs report — these are concerning data points suggesting we're not making progress as fast as we'd like," Kashakri said. "At same time we don't want to overreact."
Sunset Market Commentary
Markets
The 10-y Bund yield yesterday decisively cleared the key 2.55%/2.57% resistance on higher-than-expected French and Spanish CPI data. Today, German CPI only reinforced the case for further follow-through gains. German HICP also printed at a higher-than-expected 1.0% M/M and 9.3% Y/Y (9.2% in January), signalling upside risks also for the EMU-figure to be released tomorrow. German yields again add between 7 bps (5-y) and 5 bps (30-y). Markets ever more embrace the scenario that the ECB will (have to) raise its policy rate to 4.0% rather than 3.75%. Comments from ECB members Villeroy and Nagel at least didn’t contradict market pricing. Villeroy said that as core inflation continues to rise ‘no one can any longer deny that monetary policy can react and must react’. He also repeated that it is desirable for the ECB to reach its cycle terminal/peak rate by September. Buba president Nagel stated that the ‘the interest step announced for March will not be the last. Further significant interest rate steps might even be needed afterwards’. He also advocated an accelerated roll-off of the ECB balance sheet in July from €15bn to €20bn per month. The rise in US yields again lags the EMU, with US yields up by less than 2-4 bps across the curve, as investors await the outcome of the US manufacturing ISM after finishing this report. BoE governor Bailey in a speech kept a balanced tone. He indicated that further rate increases might be needed. However nothing has been decided yet. At the February policy meeting, the BoE indicated that rates might be raised further if it saw more evidence of persistent inflationary pressures. Better UK eco data of late already caused markets to position for an additional 75 bps of rate hikes. Bailey’s balanced comments apparently made investors ponder whether they have discounted enough tightening for now. Gilts outperformed Treasuries and Bund with yields easing up to 7 bps (2-y). Expectations for a prolonged period of tight monetary conditions (especially in the US and Europe) still don’t hurt the bid for risky assets in a profound way. Unexpectedly strong Chinese PMI’s this time supported equity resilience even as positive momentum ebbed as US traders joined. The Euro Stoxx 50 gains 0.3%. US indices open little changed. Cyclical commodities like copper gain on strong China PMIs/growth prospects. Energy prices (Brent oil $83 p/b, gas) hardly gain.
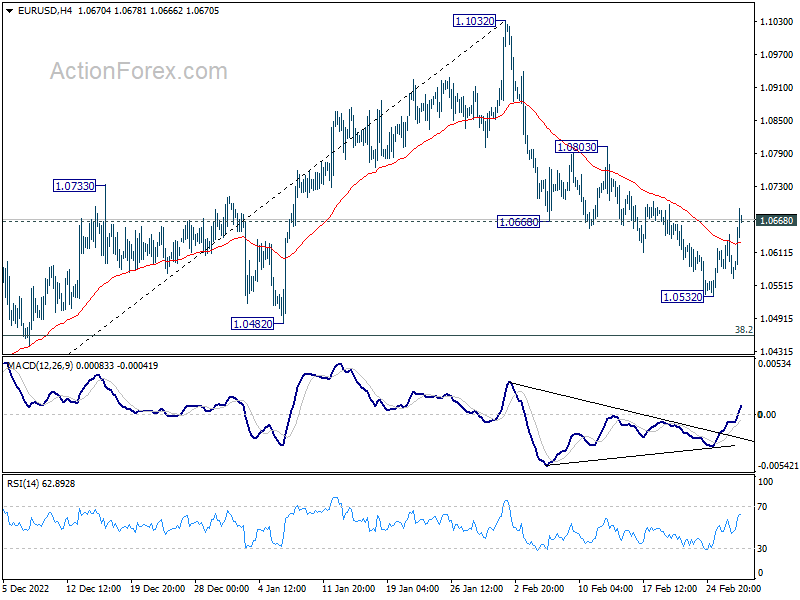
A higher interest rate differential combined with ongoing (European) equity market resilience favour the likes of the euro over the US dollar. EUR/USD rebounded from 1.0575 this morning to currently 1.0675. A break above EUR/USD 1.0803 would call off the euro correction/USD rebound. DXY also drifts lower to currently 104.30. Balanced comments of BoE’s Bailey and lower UK yields obviously disappointed sterling bulls. EUR/GBP jumped sharply from the 0.88 area this morning to currently trade near 0.8885.
News Headlines
Bank of England figures showed that mortgage approvals fell to 39.6k (from 40.5k) in January, the lowest level since June 2020. Apart from the Covid-pandemic, it’s the lowest monthly number since January 2009. Weaker mortgage approvals stem for the rapid rise in interest rates and the drop in disposable income during the current cost-of-living crisis. First-time buyers have to spend around 45% of their pay check to mortgage payments (assuming rate of 5.5%), which is a level that prevailed ahead of the financial crisis. Earlier today, the Nationwide Building Society reported a 0.5% M/M decline in nationwide house prices (-1.1% Y/Y, first negative number since December 2012). Today’s data reinforce the view of a shaky UK housing market.
The Czech manufacturing PMI fell from 44.6 to 44.3 in January. Details showed another monthly fall in output and a steeper contraction in new orders. Domestic and foreign client demand continued to contract amid pressure on spending from energy costs, inflation and economic uncertainty. The outlook for the next 12 months remains subdued. Inflationary pressures softened notably as rates of increase in input costs and selling prices eased to the slowest since September 2020 and February 2021, respectively. The Polish manufacturing PMI rose from 47.5 to 48.5. New orders and production continued to decline, but a slower rate while cost inflation shifted down notably.
US ISM manufacturing ticked up to 47.7, corresponds to -0.3% annualized GDP contraction
US ISM Manufacturing PMI rose from 47.4 to 47.7 in February, below expectation of 47.9. Looking at some details, new orders rose from 42.5 to 47.0. Production dropped from 48.0 to 47.3. Employment dropped from 50.6 to 49.1. Prices jumped from 44.5 to 51.3.
ISM said: "This is the fourth month of slow contraction and continuation of a downward trend that began in June 2022...
"The past relationship between the Manufacturing PMI and the overall economy indicates that the February reading (47.7 percent) corresponds to a change of minus-0.3 percent in real gross domestic product (GDP) on an annualized basis."
EUR/USD Mid-Day Outlook
Daily Pivots: (S1) 1.0552; (P) 1.0598; (R1) 1.0623; More...
EUR/USD's break of 1.0668 support turned resistance argues that corrective decline from 1.1032 has completed with three waves down to 1.0532 already. Intraday bias is back on the upside for 1.0803 resistance first. Firm break there will pave the way to retest 1.1032 high. For now, risk will stay mildly on the upside as long as 1.0532 support holds, in case of retreat.
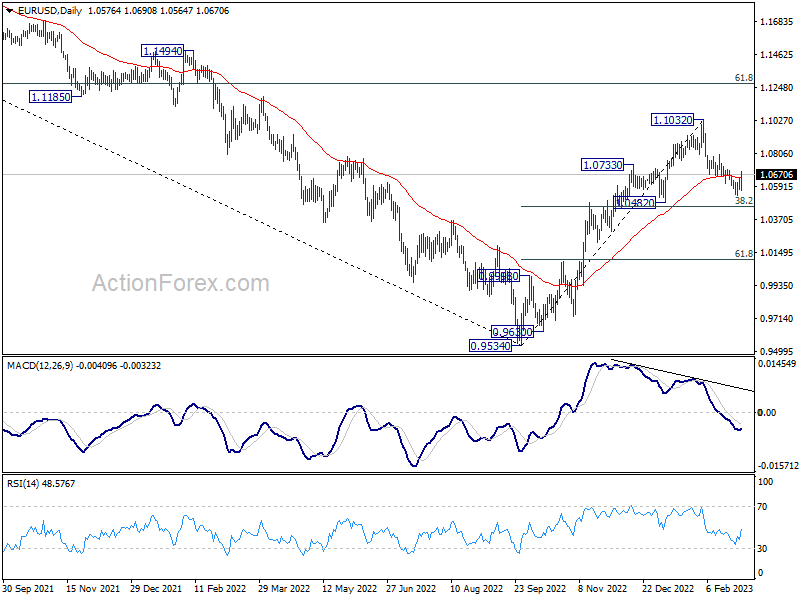
In the bigger picture, as long as 1.0482 support holds, rise from 0.9534 (2022 low) should continue to 61.8% retracement of 1.2348 (2021 high) to 0.9534 at 1.1273. However, sustained break of 1.0482 will bring deeper fall to 61.8% retracement of 0.9534 to 1.1032 at 1.0106, even as a corrective pull back.
GBP/USD Mid-Day Outlook
Daily Pivots: (S1) 1.1980; (P) 1.2061; (R1) 1.2106; More...
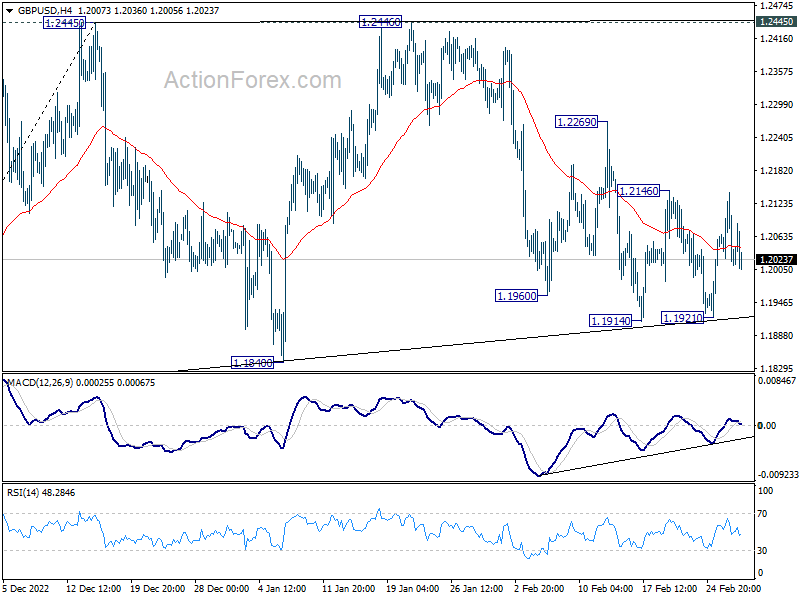
GBP/USD is still bounded in range of 1.1913/2146 despite this week's volatility. Intraday bias remains neutral for the moment. On the downside, break of 1.1914 will resume the decline from 1.2446 for 1.1840 support and possibly below. On the upside, break of 1.2146 resistance will turn bias back to the upside for further rebound to 1.2269 and above.
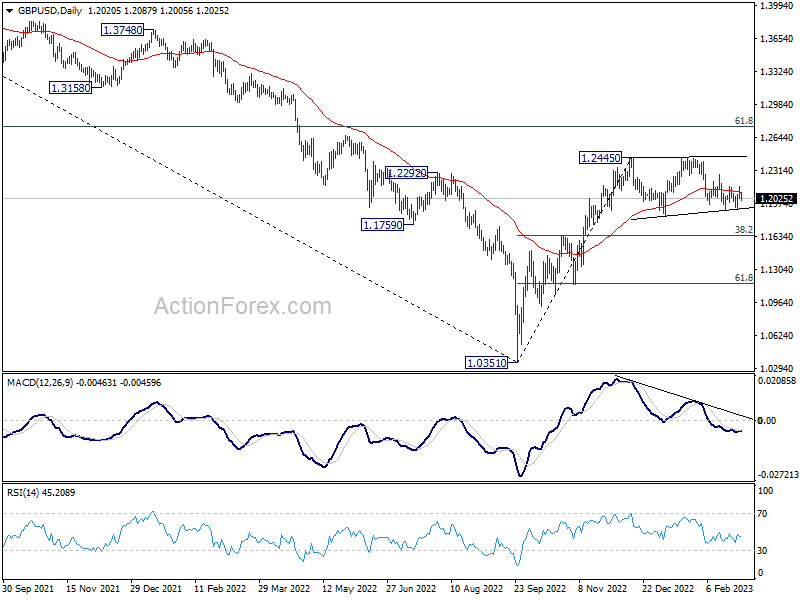
In the bigger picture,as long as 1.1840 support holds, rise from 1.0351 medium term bottom (2022 low) should still continue to 61.8% retracement of 1.4248 (2021 high) to 1.0351 at 1.2759. However, decisive break of 1.1840 will complete a double top pattern (1.2445, 1.2446) after rejection by 55 week EMA (now at 1.2251). Deeper decline should be seen back to 38.2% retracement of 1.0351 to 1.2445 at 1.1645.
USD/CHF Mid-Day Outlook
Daily Pivots: (S1) 0.9368; (P) 0.9396; (R1) 0.9449; More...
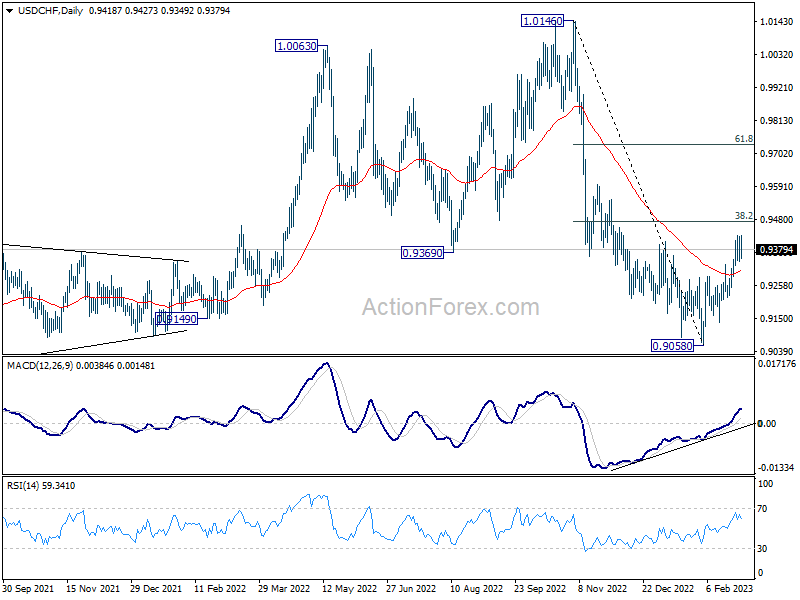
USD/CHF is staying in consolidation below 0.9428 temporary top and intraday bias remains neutral. Break of 0.9428 will resume the rebound from 0.9058. But strong resistance could be seen at 38.2% retracement of 1.0146 to 0.9058 at 0.9474 to limit upside. Break of 0.9289 resistance turned support will indicate completion of the rebound and turn bias back to the downside. However, decisive break of 0.9474 will carry larger bullish implications and target 61.8% retracement at 0.9730.
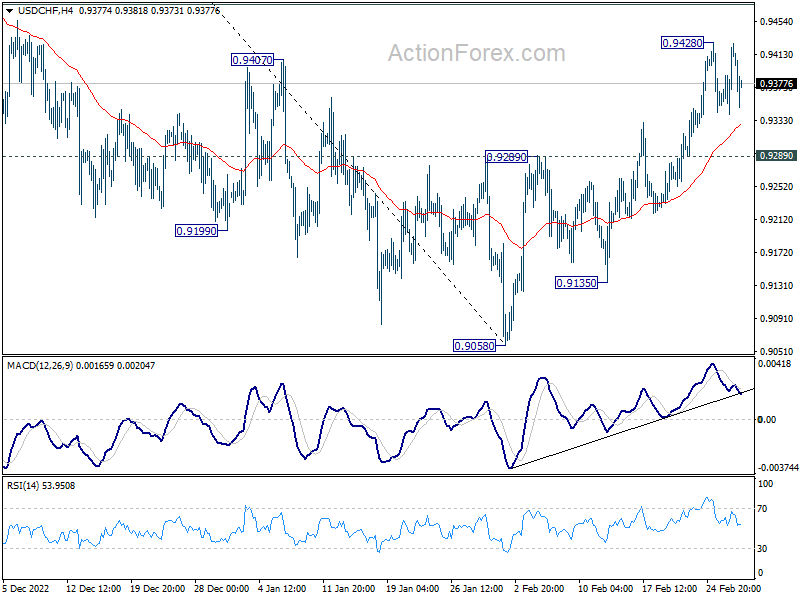
In the bigger picture, decline from 1.0146 is seen as part of a long term sideway pattern. As long as 38.2% retracement of 1.0146 to 0.9058 at 0.9474 holds, another fall is in favor through 0.9058. However, sustained trading above 0.9474 will indicate that the medium term trend has reversed, and open up further rally to 61.8% retracement at 0.9730 and above.