Sample Category Title
USD/JPY Mid-Day Outlook
Daily Pivots: (S1) 130.13; (P) 131.42; (R1) 132.36; More...
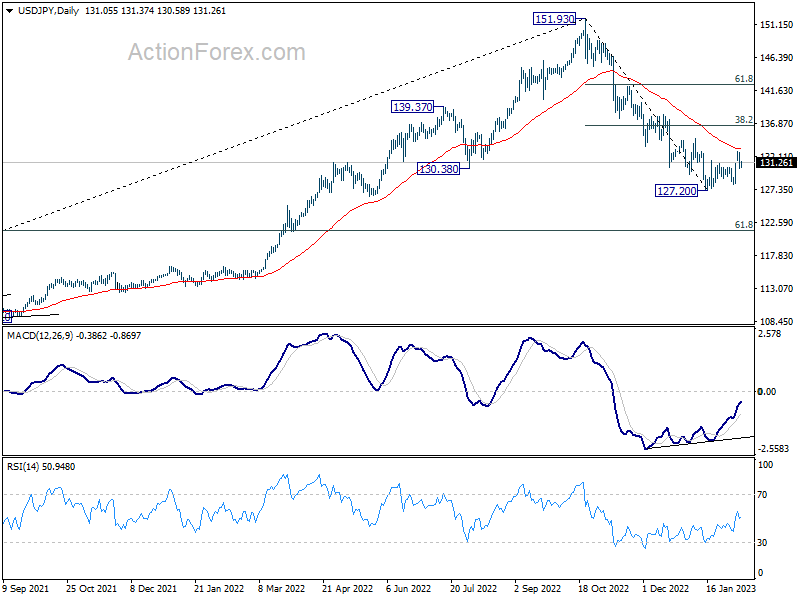
Outlook in USD/JPY remains unchanged and intraday bias stays neutral. Further rally is still mildly in favor. On the upside, above 132.89 will resume the rebound from 127.20 short term bottom to 38.2% retracement of 151.93 to 127.20 at 136.64. Nevertheless, sustained break of 4 hour 55 EMA (now at 130.50) will bring retest of 127.20 low.
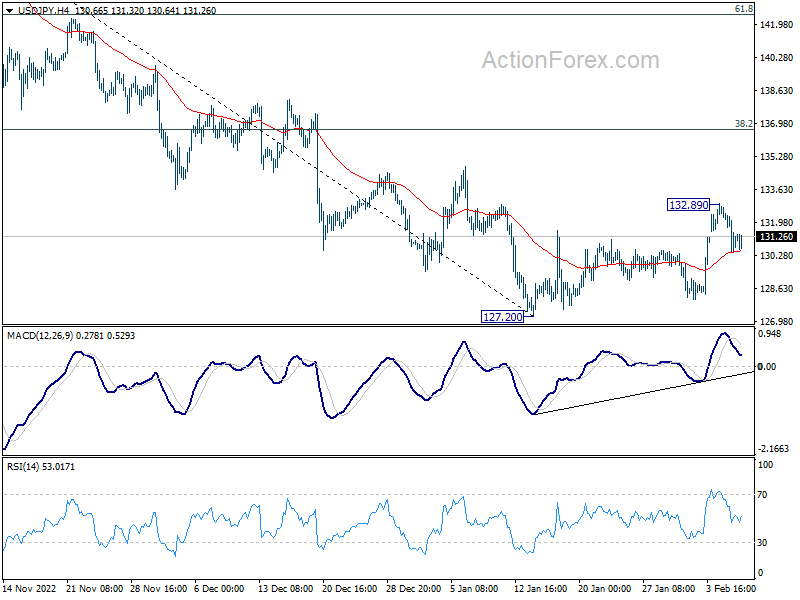
In the bigger picture, prior of 55 week EMA (now at 131.39) raises the chance of medium term bearish reversal, but that's not confirmed yet. Strong rebound from current level, followed by sustained break of 38.2% retracement of 151.93 to 127.20 at 136.64 will argue that price actions from 151.93 is merely a corrective pattern. However, rejection by 136.64 will solidify medium term bearishness for 61.8% retracement of 102.58 to 151.93 at 121.43 and 38.2% retracement of 75.56 to 151.93 at 122.75.
GBP/USD Mid-Day Outlook
Daily Pivots: (S1) 1.1975; (P) 1.2035; (R1) 1.2109; More...
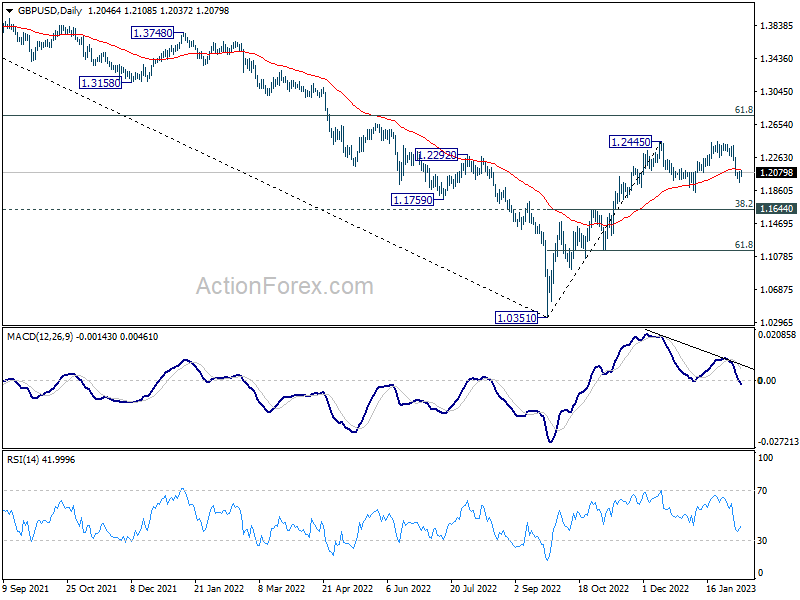
Intraday bias in GBP/USD remains neutral for the moment. Fall from 1.2446, as the third leg of the corrective pattern from 1.2445, could still extend lower. Below 1.1960 will target 1.1840 support and possibly below. But downside should be contained by 38.2% retracement of 1.0351 to 1.2445 at 1.1645 to bring rebound. On the upside, firm break of 4 hour 55 EMA (now at 1.2189) will bring retest of 1.2445/6.
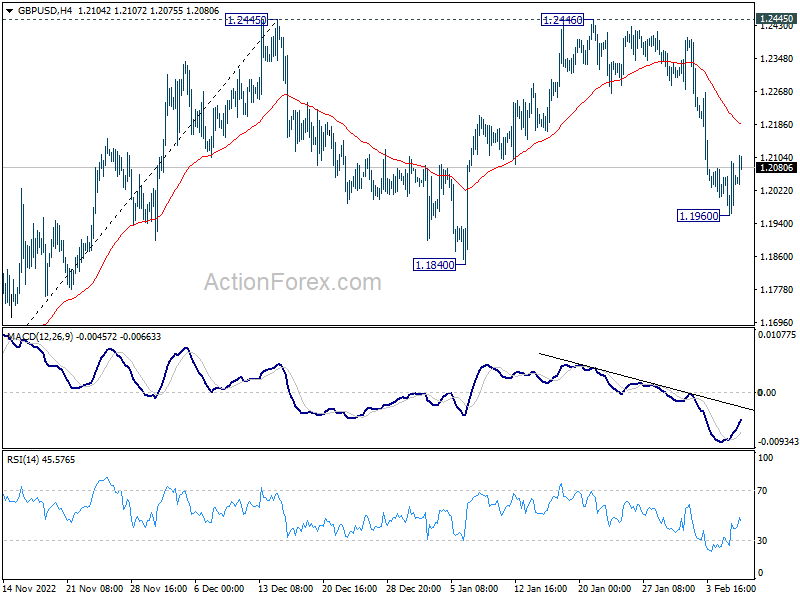
In the bigger picture, rise from 1.0351 medium term bottom is at least correcting whole down trend from 1.4248 (2021 high). Further rise is expected as long as 1.1644 resistance turned support holds. Next target is 61.8% retracement of 1.4248 to 1.0351 at 1.2759. Sustained break there will pave the way back to 1.4248.
Markets Tread Water in Slow Day, Sterling Recovering
The markets are quiet today with a light economic calendar and slow news flows. European majors are generally higher, in particular with Sterling and Euro paring some earlier losses. Commodity currencies turned softer, but Yen is the weaker one. Dollar is mixed in between. Trading could remain subdued till Friday when UK GDP and Canadian job data are released.
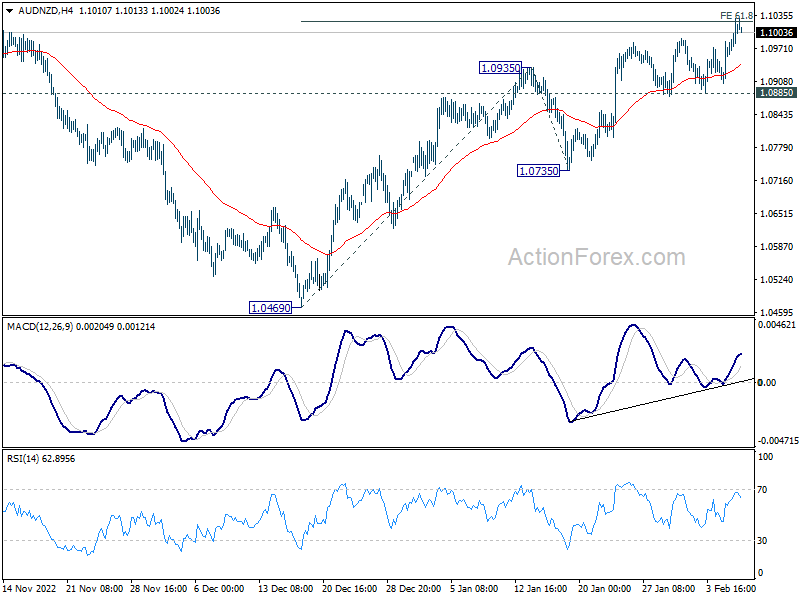
Technically, AUD/NZD resumed near term rally from 1.0469 as supported by the hawkish RBA rate hike. It's now pressing 61.8% projection of 1.0469 to 1.0935 from 1.0735 at 1.1023. Sustained break there could prompt upside acceleration to 100% projection at 1.1201. However, rejection by 1.1023, followed by break of 1.0885 will argue that the rebound has completed, and bring deeper fall to 1.0735 support and possibly below.
In Europe, at the time of writing, FTSE is up 0.66%. DAX is up 0.81%. CAC is up 0.47%. Germany 10-year yield is up 0.31 at 2.374. Earlier in Asia, Nikkei dropped -0.29%. Hong Kong HSI dropped -0.07%. China Shanghai SSE dropped -0.49%. Singapore Strait Times rose 0.23%. Japan 10-year JGB yield rose 0.0015 to 0.497.
More upside still in favor in sluggish ethereum and bitcoin
Crytocurrencies have been rather sluggish since the near term rebound lost momentum in late January. Yet, for now, there is no clear sign of a bearish reversal.
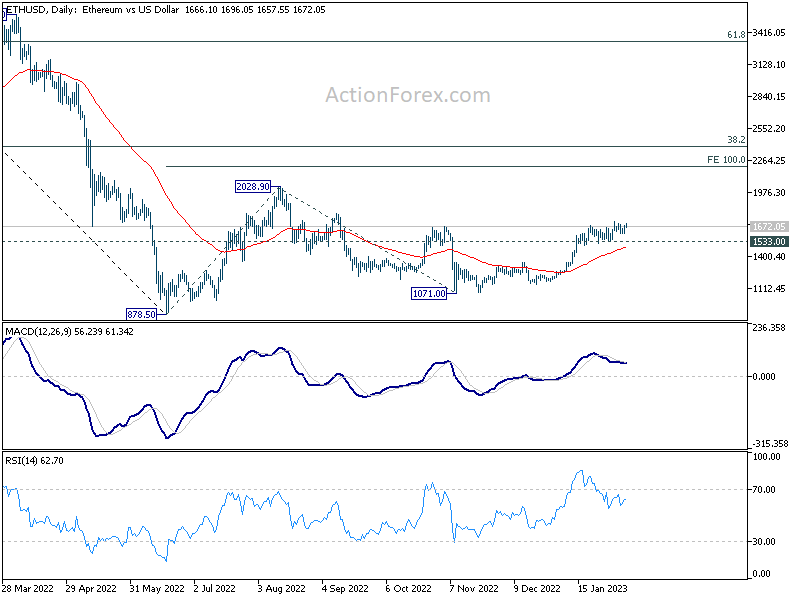
For Ethereum, further rally is expected as long as 1533 support holds. Current rise from 1071 is seen as the third leg of the pattern from 878.5. It might eventually turn out too be a sideway consolidation pattern. But stronger raise to 2028.9 resistance could be seen, or even further to 100% projection of 878.5 to 2028.9 from 1071.0 at 2221.4. But of course, break of 1533.0 will indicate short term topping. Further break of 55 day EMA would pave the way back to 1071 or even to 878.5.
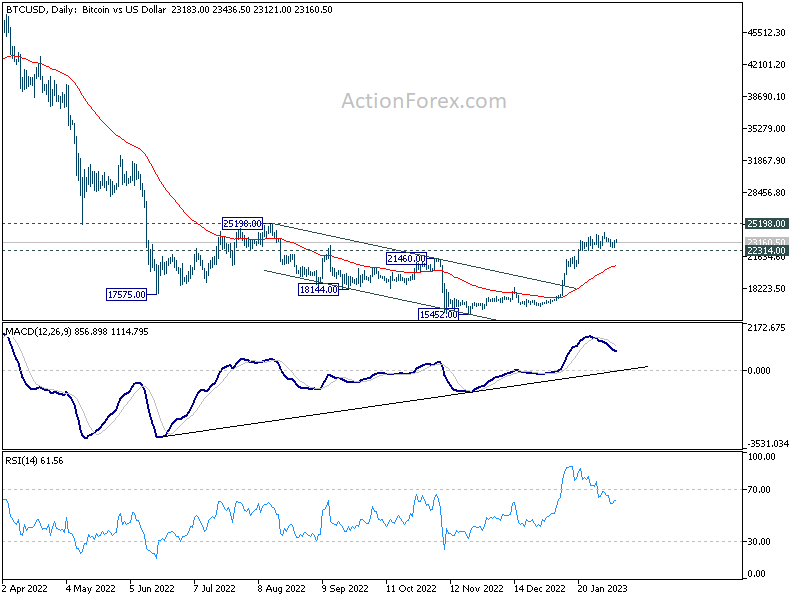
As for Bitcoin, further rally is expected as long as 22314 resistance support holds. Rise from 15452 would target 25198. Strong resistance might be seen there to cap upside, at least on first attempt. On the downside, break of 22314 support will suggest short term topping and bring pull back to 55 day EMA.
WTI crude oil staying bearish despite strong rebound
WTI crude oil rebounded strongly yesterday, as lifted by news of outage of an oil export terminal after the earthquake in Turkey. But upside is capped below 55 day EMA, and far below 82.31 resistance.
For the near term, further decline is expected as long as 82.31 resistance holds. Price actions from 94.25 could be developing into a terminal triangle pattern, as the fifth wave of the whole down trend from 131.82.
If that's the case, WTI should continue to lose downside momentum in the next decline, as reflected in persistent bullish condition in daily MACD. The end point of the down trend could be somewhere around 61.8% projection of 124.12 to 76.61 from 94.25 at 64.88, and 62.90 long term support.
GBP/USD Mid-Day Outlook
Daily Pivots: (S1) 1.1975; (P) 1.2035; (R1) 1.2109; More...
Intraday bias in GBP/USD remains neutral for the moment. Fall from 1.2446, as the third leg of the corrective pattern from 1.2445, could still extend lower. Below 1.1960 will target 1.1840 support and possibly below. But downside should be contained by 38.2% retracement of 1.0351 to 1.2445 at 1.1645 to bring rebound. On the upside, firm break of 4 hour 55 EMA (now at 1.2189) will bring retest of 1.2445/6.
In the bigger picture, rise from 1.0351 medium term bottom is at least correcting whole down trend from 1.4248 (2021 high). Further rise is expected as long as 1.1644 resistance turned support holds. Next target is 61.8% retracement of 1.4248 to 1.0351 at 1.2759. Sustained break there will pave the way back to 1.4248.
Economic Indicators Update
| GMT | Ccy | Events | Actual | Forecast | Previous | Revised |
|---|---|---|---|---|---|---|
| 23:50 | JPY | Bank Lending Y/Y Jan | 3.10% | 2.60% | 2.70% | |
| 23:50 | JPY | Current Account (JPY) Dec | 1.18T | 1.25T | 1.92T | |
| 05:00 | JPY | Eco Watchers Survey: Current Jan | 48.5 | 48.1 | 47.9 | |
| 15:00 | USD | Wholesale Inventories Dec F | 0.10% | 0.10% | ||
| 15:30 | USD | Crude Oil Inventories | 2.0M | 4.1M |
GBP/USD Punches Past 1.21, Bailey Up Next
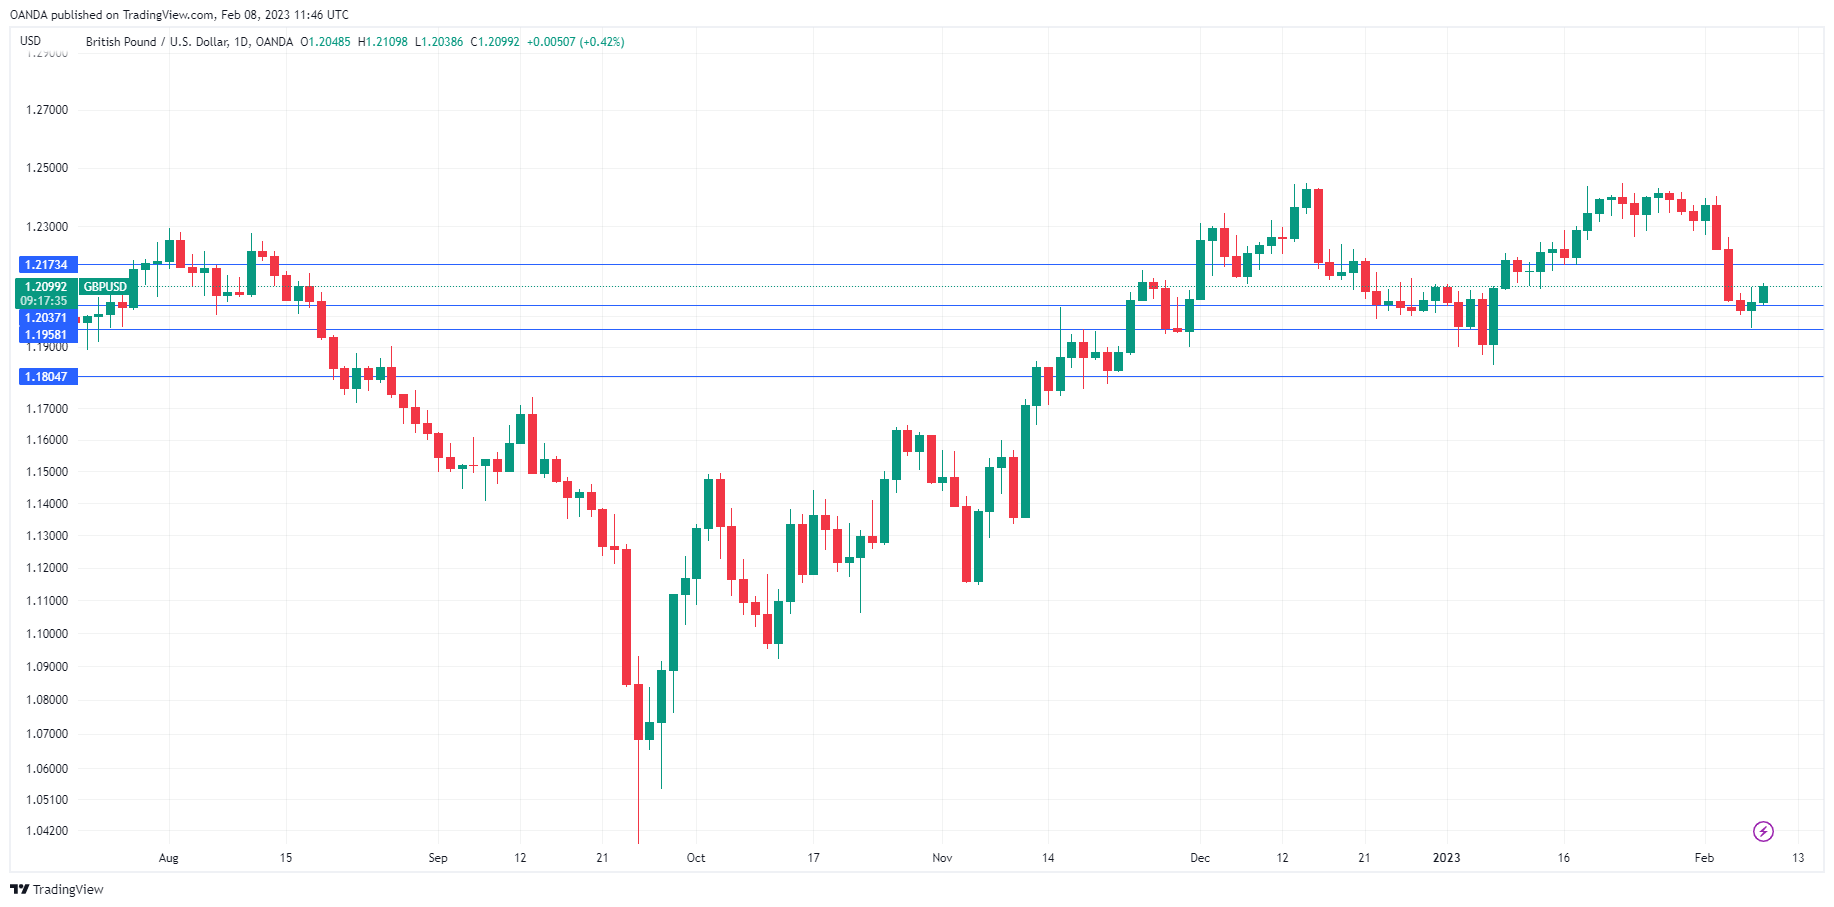
The British pound is in positive territory on Wednesday. In the European session, GBP/USD is trading at 1.2107, up 0.47%. The pound is recovering from a nasty slide of almost 400 points, in which it dropped below the 1.20 line for the first time since Jan. 23.
Powell goes easy on the markets
The equity markets were nervous ahead of Fed Chair Powell’s remarks at an event in Washington on Tuesday. There was concern that Powell would push back against the recent rally and deliver a hawkish message, especially after the sizzling nonfarm employment report last week. Powell decided not to chastise the markets and essentially reiterated what we heard at last week’s meeting. That message is that inflation is moving lower but needs to fall much further and further rate hikes are likely needed. Powell has said more than once that the Fed policy will not be swayed by one or two economic reports, and he held true to that view by not shifting his stance due to the hot employment release. Equity markets responded positively to Powell’s message while the US dollar was slightly lower against most of the majors.
How much further will the Fed tighten? The markets have revised upwards their forecast for the terminal rate to 5.1%, up from below 5% before the NFP report. Fed Bank of Minneapolis President Neel Kashkari said on Tuesday that he expects rates to peak at 5.4%, and a Citigroup note warned that rates could go as high as 6%. The markets are still expecting a rate cut late in the year, despite Powell stating at the FOMC meeting that there were no plans to lower rates.
There are no releases out of the UK today. BoE Governor Bailey will be in the spotlight on Thursday, as he testifies at the Treasury Committee Hearings. The BoE raised rates by 0.50% last week and the markets will be all ears, looking for clues as to what the central bank has planned for the next meeting on March 23.
GBP/USD Technical
- 1.1958 and 1.1804 are providing support
- There is resistance at 1.2035 and 1.2173
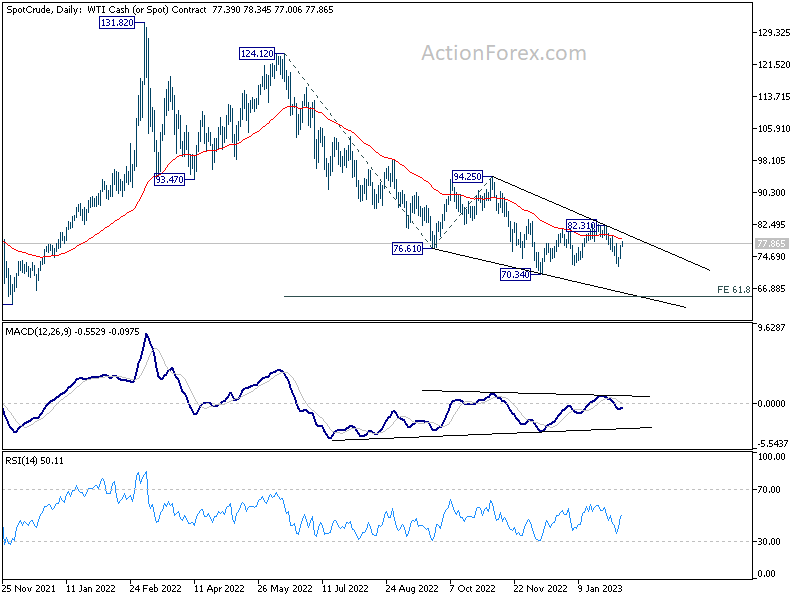
WTI crude oil staying bearish despite strong rebound
WTI crude oil rebounded strongly yesterday, as lifted by news of outage of an oil export terminal after the earthquake in Turkey. But upside is capped below 55 day EMA, and far below 82.31 resistance.
For the near term, further decline is expected as long as 82.31 resistance holds. Price actions from 94.25 could be developing into a terminal triangle pattern, as the fifth wave of the whole down trend from 131.82.
If that's the case, WTI should continue to lose downside momentum in the next decline, as reflected in persistent bullish condition in daily MACD. The end point of the down trend could be somewhere around 61.8% projection of 124.12 to 76.61 from 94.25 at 64.88, and 62.90 long term support.
More upside still in favor in sluggish ethereum and bitcoin
Crytocurrencies have been rather sluggish since the near term rebound lost momentum in late January. Yet, for now, there is no clear sign of a bearish reversal.
For Ethereum, further rally is expected as long as 1533 support holds. Current rise from 1071 is seen as the third leg of the pattern from 878.5. It might eventually turn out too be a sideway consolidation pattern. But stronger raise to 2028.9 resistance could be seen, or even further to 100% projection of 878.5 to 2028.9 from 1071.0 at 2221.4. But of course, break of 1533.0 will indicate short term topping. Further break of 55 day EMA would pave the way back to 1071 or even to 878.5.
As for Bitcoin, further rally is expected as long as 22314 resistance support holds. Rise from 15452 would target 25198. Strong resistance might be seen there to cap upside, at least on first attempt. On the downside, break of 22314 support will suggest short term topping and bring pull back to 55 day EMA.
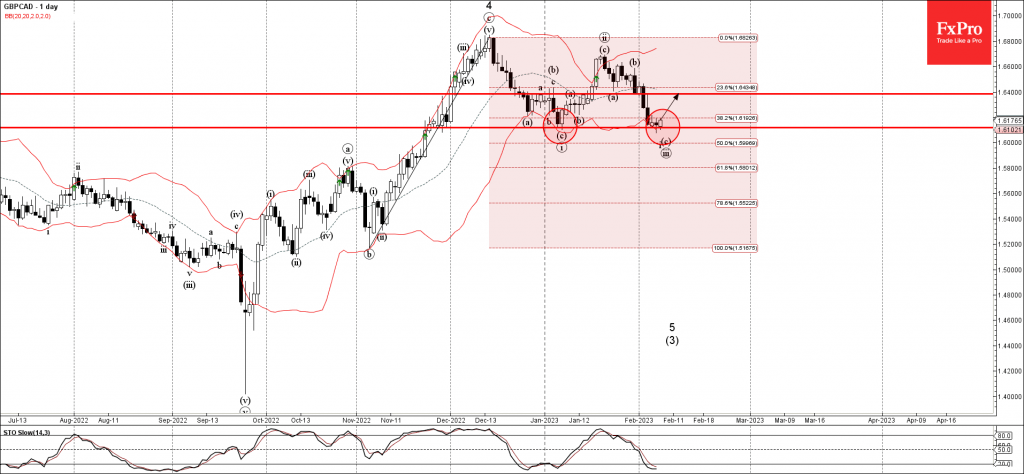
GBPCAD Wave Analysis
- GBPCAD reversed from support level 1.6120
- Likely to rise to resistance level 1.6400
GBPCAD currency pair earlier reversed up from the key support level 1.6120, which stopped the previous minor impulse wave (i) at the start of last month.
The upward reversal from the support level 1.6120 stopped the previous minor impulse wave (iii), which belongs to wave 5 from December.
Given the oversold daily Stochastic, GBPCAD can be expected to rise further toward the next resistance level 1.6400.
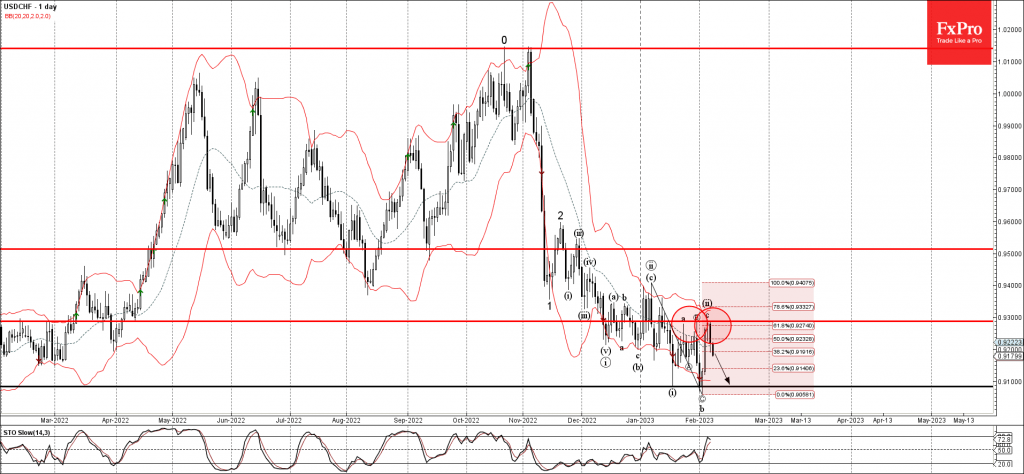
USDCHF Wave Analysis
- USDCHF reversed from resistance level 0.92865
- Likely to fall to support level 0.9100
USDCHF continues to fall after the price reversed down from the resistance level 0.92865, which stopped the previous waves (a), (b).
The resistance level 0.92865 was further strengthened by the upper daily Bollinger Band and by the 61.8% Fibonacci retracement of the previous downer impulse from last month.
Given the clear daily downtrend, USDCHF can be expected to fall further toward the next support level 0.9100.
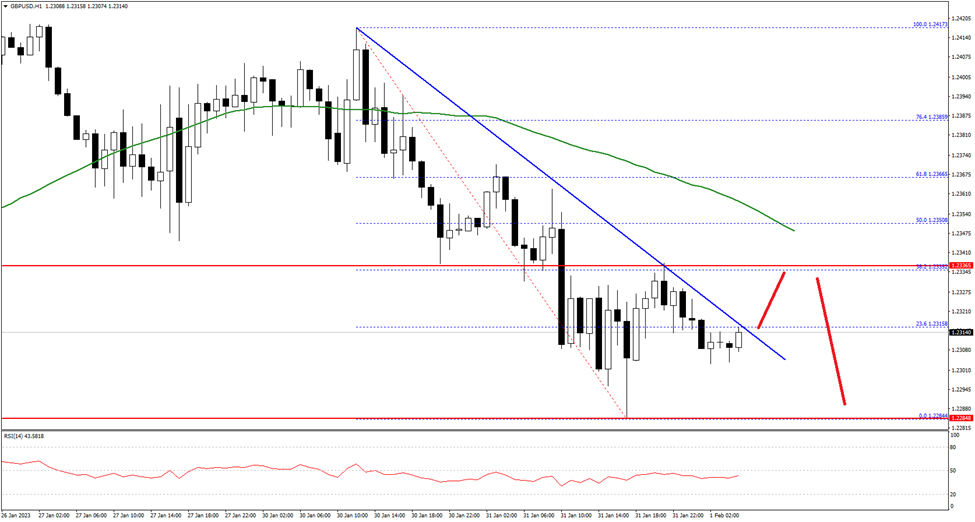
GBP/USD Pair Moved into a Short-term Bearish Zone Below 1.2365
The British Pound started a bearish reaction from the 1.2420 resistance zone against the US Dollar. The GBP/USD pair declined below the 1.2365 level to move into a short-term bearish zone.
There was a close below the 1.2350 level and the 50 hourly simple moving average. It is now consolidating near the 1.2315 level, with an immediate resistance at 1.2320 and a connecting bearish trend line on the hourly chart.
The first major resistance is near the 1.2350 level. If there is a clear upside break above the 1.2350 resistance, the pair could rise steadily towards the 1.2400 level in the near term. The next major resistance sits near 1.2420 on FXOpen.
On the downside, the first major support is near the 1.2300 level. The main support is forming near the 1.2285 level. A break below the 1.2285 support could push the pair towards the 1.2240 support.
USDJPY Returns to Losses; Fragile Below 50-SMA
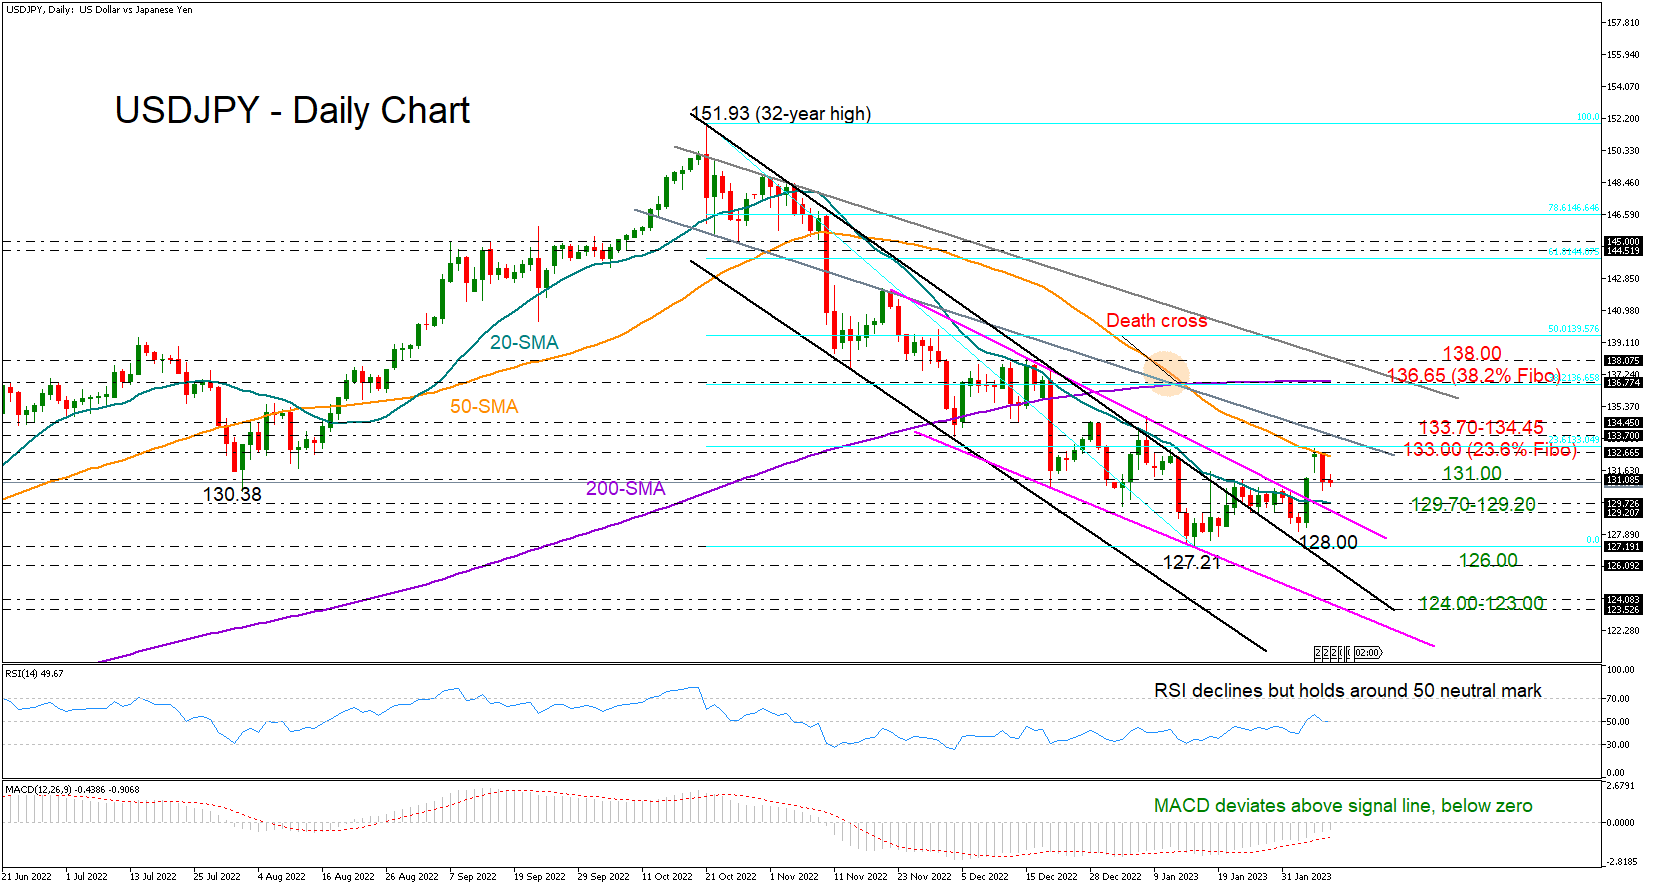
USDJPY closed Monday’s positive gap by rapidly falling to 131.00 on Tuesday after hitting a wall near the 50-day simple moving average (SMA) at 133.60.
Another leg down would ruin the bull’s efforts for a trend reversal, but the pair could still maintain the soft ascent from 127.21 if it pivots within the 129.70-129.20 region represented by the 20-day SMA and the surface of the shorter-term bearish channel respectively. If not, the sell-off may continue towards the previous low of 127.21, while lower, some consolidation may occur near 126.00 before the way clears towards the channel’s lower boundary currently seen within the 124.00-123.50 area.
The technical indicators, however, have yet to confirm a bearish bias. Despite the latest downturn in the price, the RSI managed to hold above its 50 neutral mark, whilst the MACD has barely been affected, gradually extending its recovery within the negative zone.
Nevertheless, the 50-day SMA and the 133.00 zone, where the 23.6% Fibonacci retracement of the 151.93-127.21 downleg is placed, will pose a threat to upside movements in the short term. Buyers would also like to see a higher high above the 133.70-134.45 area before boosting the price up to the 200-day SMA and the 38.2% Fibonacci level of 136.65.
In brief, the sideways move in USDJPY may continue in the coming sessions as buying interest looks conditional. The pair will need to stay above its 20-day SMA to sustain hopes for a bullish trend reversal, though only a rally above 134.45 would confirm that case.