Sample Category Title
Another Hawkish Speech Goes Unheard
Another hawkish speech from the Federal Reserve (Fed) Chair Jerome Powell turned into a risk rally yesterday. Equities gained, and the bond yields fell.
Yet, yesterday’s speech from the Fed Chair Powell was hawkish. He said that the Fed may hike the rates more than what’s priced in if the jobs market remains unexpectedly strong.
He said that disinflation is at the early stages and that the ride will probably be ‘bumpy’.
He had said last week that the Fed needs ‘substantially more evidence’ to declare victory over inflation.
But in vain. Investors focused on the fact that he appeared just as hawkish as he has always been, that he didn’t promise a 50bp hike at next meeting, and that he said that the Fed won’t actively shrink its balance sheet for at least a few years.
The S&P 500 still eased when Powell said they need ‘substantial evidence’ that inflation slowed, but finally, the index erased gains and ended the session by 1.30% higher. Nasdaq jumped more than 2%. The US 2-year yield eased – as if Powell hasn’t said that the rates will go higher than people anticipate.
And the US dollar jumped, interestingly. The dollar index shortly spiked above its 50-DMA, but rapidly came below this level.
If investors are not convinced by what Powell says, they could be easily convinced if next week’s inflation data in the US came with a bad surprise.
Until then, no one can guarantee how sustainable the latest gains are.
Good news, bad news
There are good and bad news on the wire.
The bad news is that Dell announced it will lay off 6650 workers, and Zoom will let go around 15% of its workforce, which is around 1300 workers. Together it’s nearly 8000 more jobs lost in the tech space.
The good news is, it will probably not impact the US jobs data – as tech layoffs have been very loud in media but very timid when it comes to their impact on jobs data.
The other goods news is that half of the S&P500 companies already reported earnings, and earnings per share fell 2.8% so far. This is well below the 3.3% decline expected by analysts. It justifies a part of the correction.
But fundamentally, we can tell that the tech companies are not flourishing just by looking at the number of people they let go.
And well, the US yield curve remains well inverted, warning that recession is still on the cards.
In the FX
Yesterday’s rally in the US dollar is challenging the latest trends and dynamics.
The EURUSD tipped a toe below its latest bullish trend base, and below its 50-DMA yesterday, and the pair is just at the edge of bullish trend again this morning, with no guarantee that it won’t slide further.
Cable rebounded before hitting its 200-DMA, at 1.1950, and is back above the 1.20 mark this morning.
The British National Institute of Economic and Social Research said that the UK may avoid recession this year. But they are the only ones being this optimistic… and even they think that millions could be unable to pay their bills, a weird way of avoiding recession…
But happily, for energy investors, Jeremy hunt said yesterday, as a response to record profit announced by BP, that they will not increase windfall tax on oil and gas companies.
BP share's price jumped nearly 8% to above our mid-term 500p target.
Crude oil jumped more than 4% as API revealed a 2-mio-barrel decline in US stockpiles. But gasoline inventories jumped more than 5 mio barrels during the same week. That could limit the upside potential triggered by data.
In precious metals, gold is better bid for the third session, even though US President Joe Biden’s State of the Union speech went without gaffes or personal remarks which could’ve escalate tensions with China or Russia.
The size of the bullish move in gold could however remain capped by the strength of the US dollar. A thick layer of offers is seen into the $1900 level.
More Fed Speakers on the Wires
Market movers today
Three voting FOMC members are scheduled to speak today starting with John Williams at 15:15 CET at a Wall Street Journal event, followed by Kashkari and Waller in the evening. Also Bostic of the Atlanta Fed, who is not currently a voting member, will speak 16:00 CET.
For Sweden, we will get data on household consumption, production and industrial orders in December. However, we already know that GDP declined 0.6% q/q in Q4 and that retail sales dropped 1.8% m/m in December, so there will not be much new information ahead of the Riksbank announcement Thursday.
The Polish central bank is expected to leave rates unchanged at today's meeting.
The 60 second overview
Market sentiment: Yesterday was a mixed day in the global stock market despite US indices closing higher. In general, January rally in risky asset classes seems to have lost some steam in February. We think such caution may be warranted since there is still a risk that the improved growth outlook backfires if underlying inflation pressures become protracted and central banks are forced to more aggressive tightening. Without sufficient demand adjustment and tightening of financial conditions there is a risk that businesses' pricing power remains strong and that wage pressures do not cool off.
Fed: Fed Chairman Powell's speech yesterday gave little new information. We think markets were likely expecting a clear hawkish shift by Powell as a response to last Friday's burning hot US labour market data, but these expectations did not materialise. That being said, Powell was not dovish and emphasized that if we continue to get strong labour market and inflation prints, the Fed may need to do more. In separate comments, Fed's Kashkari said the Fed should likely have to raise rates to 5.4% given the strong labour market. In our view, investors' focus should now be on data releases instead of individual speeches since Fed has clearly communicated their data dependent approach. The next potential market mover is US CPI next Tuesday.
German economy: German industrial production showed some weakness at the end of 2022, declining 3.1% m/m in December. Weakness was not driven by the car sector, which continued to recover amid easing supply bottlenecks, but there was a big decline in intermediate goods production (incl. chemicals, which are particularly exposed to higher energy costs). Overall, it seems industry had a small negative contribution (-0.7% q/q) to GDP growth in Q4. Although business surveys have turned the corner, weakening order books still set the scene for a continued weak industry performance in Q1, before Chinese demand probably starts to provide some tailwind for exports.
FI: Long-dated US Treasury yields climbed higher on the back of hawkish comments from Fed Chairman Powell, that monetary policy needs to be tightened further in order to rein in inflation given the very strong labour market. However, this morning we are seeing a modest decline in Treasury yields in Asian trading.
The Schatz ASW-spread tightened significantly on the back of the announcement from the ECB that government deposits would be remunerated at €str-20bp as of May 1. There is no deadline for the new set-up. This removes the expectations that the ECB would remunerate 0% on government deposits in the short-term horizon.
FX: EUR/USD continued to slide yesterday and dropped below 1.07. Further rise in US interest rates weighed on the pair. EUR/NOK rose to a new cycle high, while EUR/SEK reversed slightly lower.
Credit: Yesterday, credit markets continued on a slight negative note ahead of Jerome Powell's expected hawkish speak. Both CDS indices were marginally wider with iTraxx Main (+0.2bp) at 75.4bp, while iTraxx Crossover (+2.5bp) closed at 397.6bp.
Nordic macro
December consumption indicator and production value index (PVI) are released this morning (08.00 CET). Plunging retail sales (-8.0 % yoy) most likely signal a risk for a new low in the consumption indicator. As is well known, most fundamental factors were quite negative for consumers in December. PVI is likely to take a leg down as suggested by falling new orders as well as PMI and manufacturing confidence data.
Technical Outlook and Review
USD/JPY:
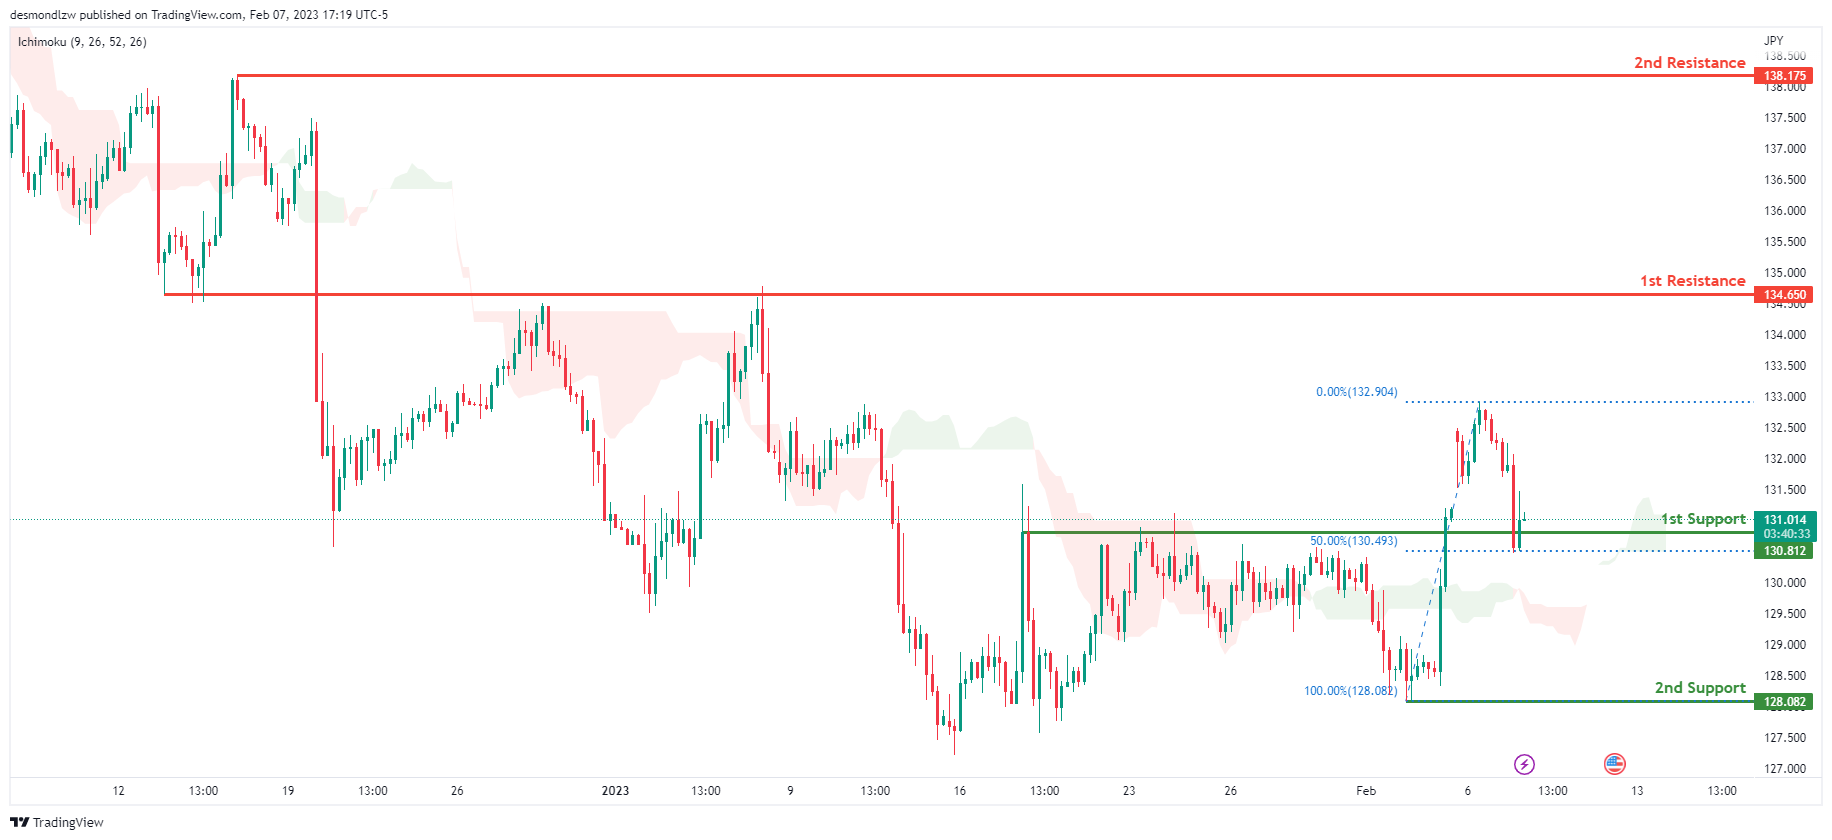
Looking at the H4 chart, my overall bias for USDJPY is bullish due to the current price crossing above the Ichimoku cloud, indicating a bullish market. If this bullish momentum continues, expect the price to possibly continue heading towards the 1st resistance at 134.632, where the overlap resistance is. In an alternate scenario, price could possibly head back down to retest the 1st support at 130.812, where the overlap support and 50% Fibonacci line is.
Areas of consideration:
- H4 time frame, 1st resistance at 134.632
- H4 time frame, 1st support at 130.812
DXY:
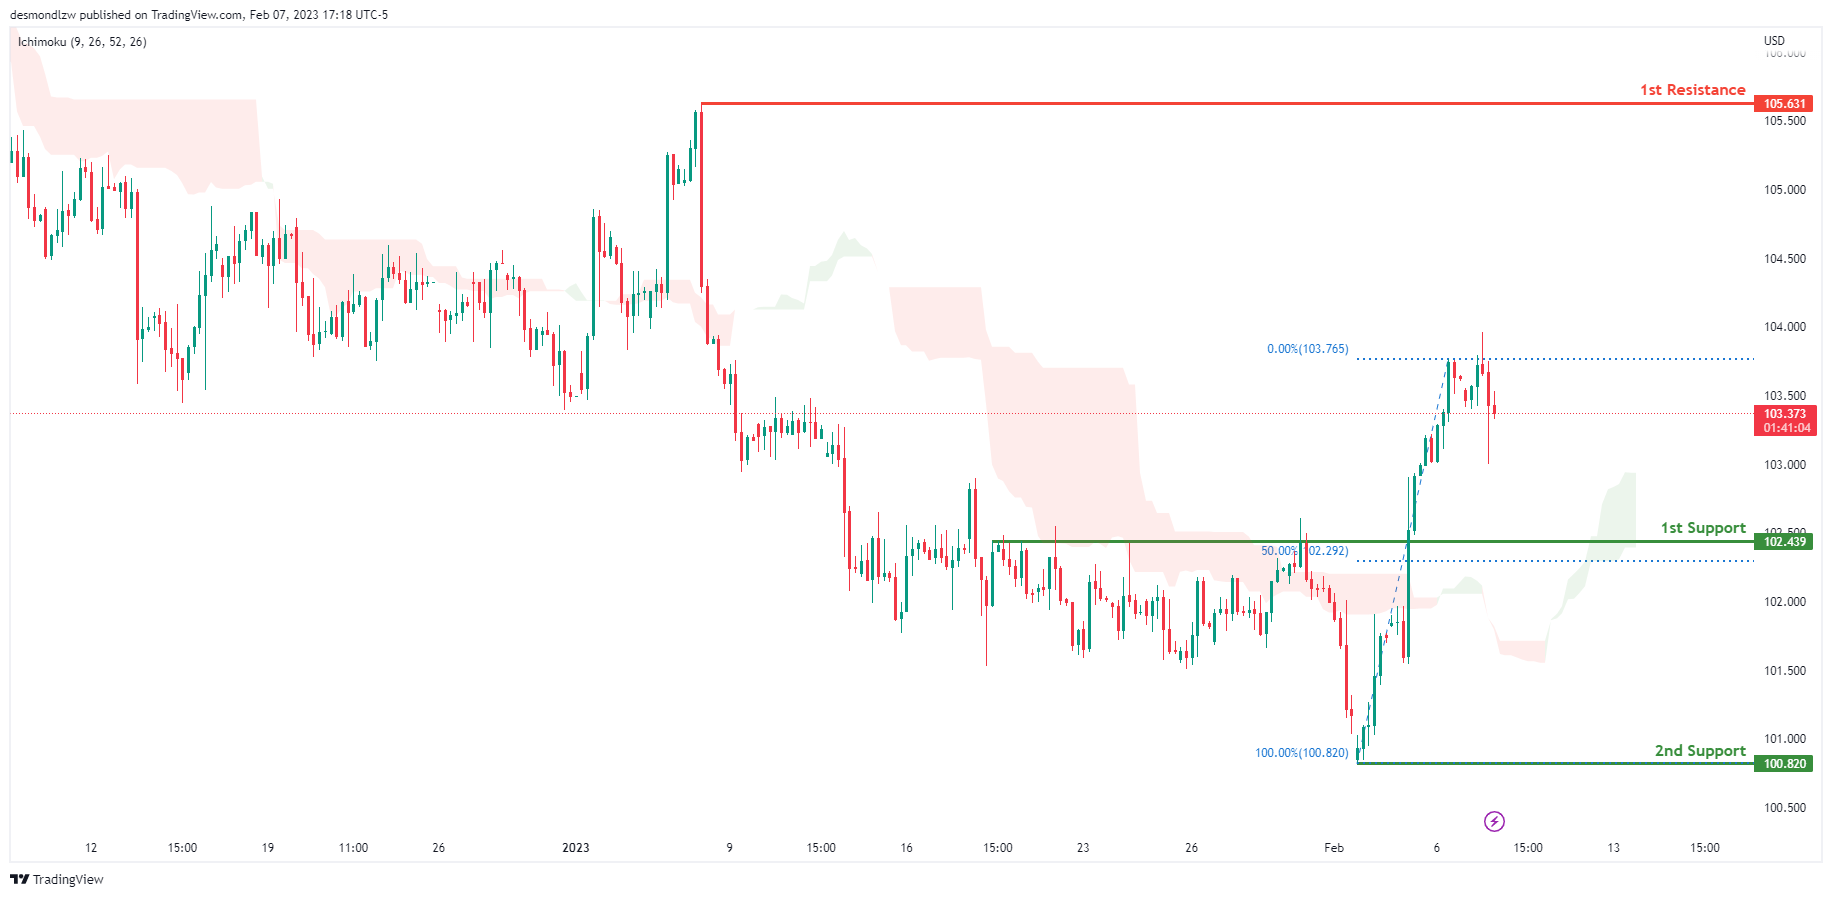
Looking at the H4 chart, my overall bias for DXY is bullish due to the current price crossing above the Ichimoku cloud, indicating a bullish market. If this bullish momentum continues, expect the price to possibly continue heading towards the 1st resistance at 105.631, where the previous swing high is. In an alternative scenario, price could head back down to retest the 1st support at 102.439, where the 50% Fibonacci line and overlap support is.
Areas of consideration:
- H4 time frame, 1st resistance at 103.463
- H4 time frame, 1st support at 99.241
EUR/USD:
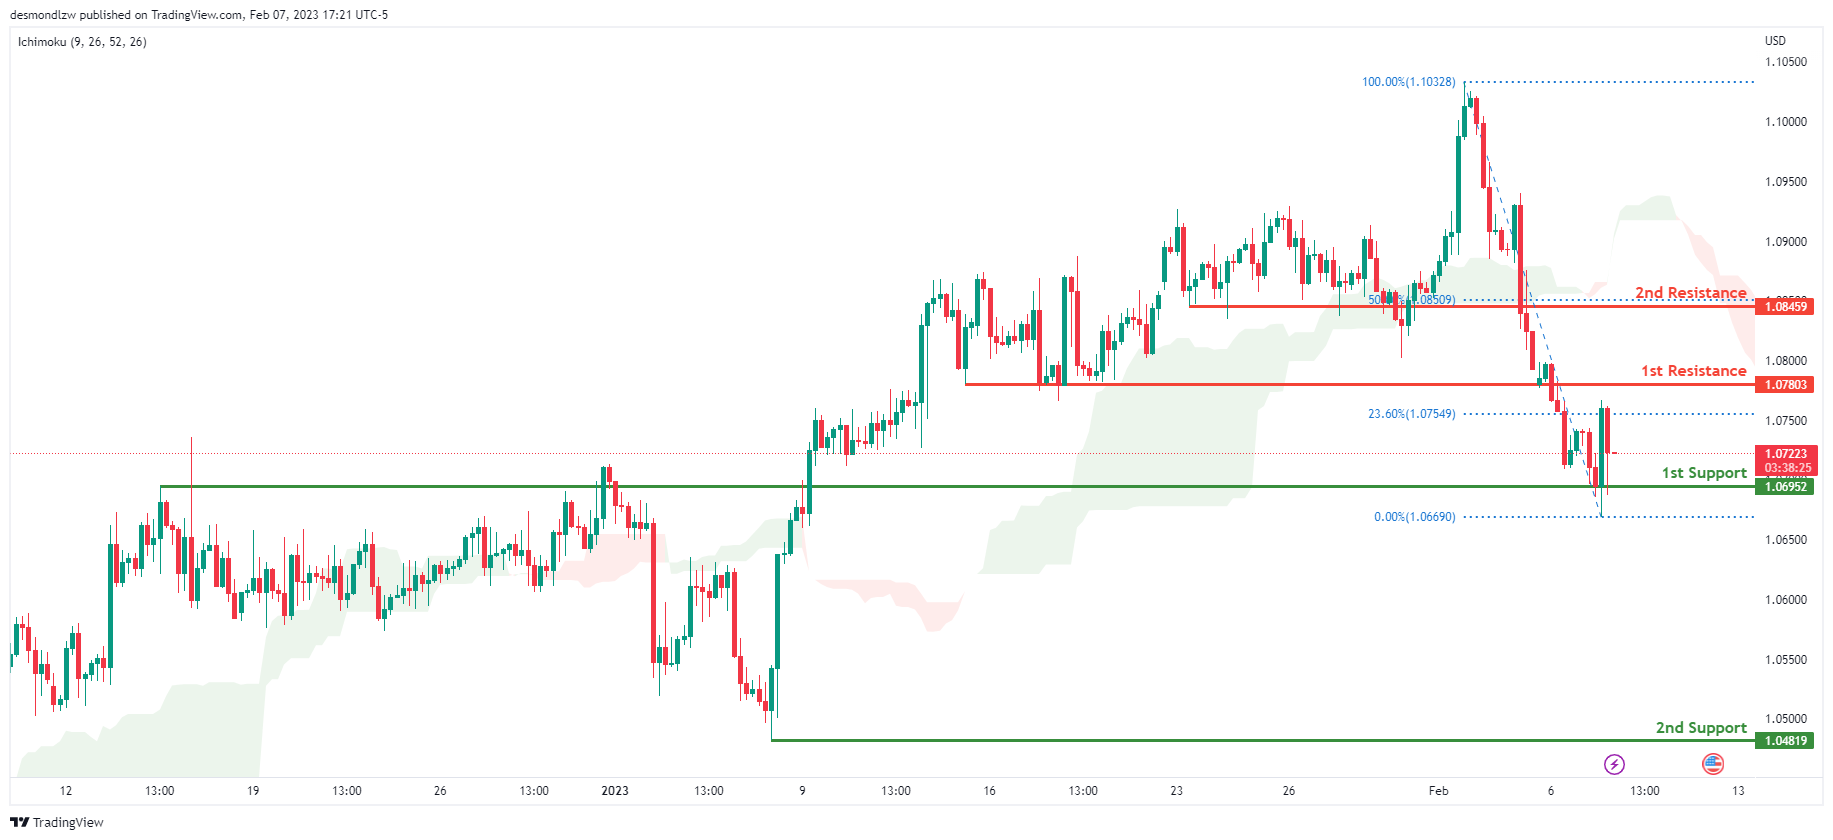
Looking at the H4 chart, my overall bias for EURUSD is bearish due to the current price crossing below the Ichimoku cloud, indicating a bearish market structure. If this bearish momentum continues, expect the price to possibly continue heading towards the 1st support at 1.06952, where the overlap support is. In an alternate scenario, price could possibly head back up to retest the 1st resistance at 1.07803, where the overlap resistance and 23.6% Fibonacci line is.
Areas of consideration :
- H4 1st resistance at 1.07803
- H4 1st support at 1.06952
GBP/USD:
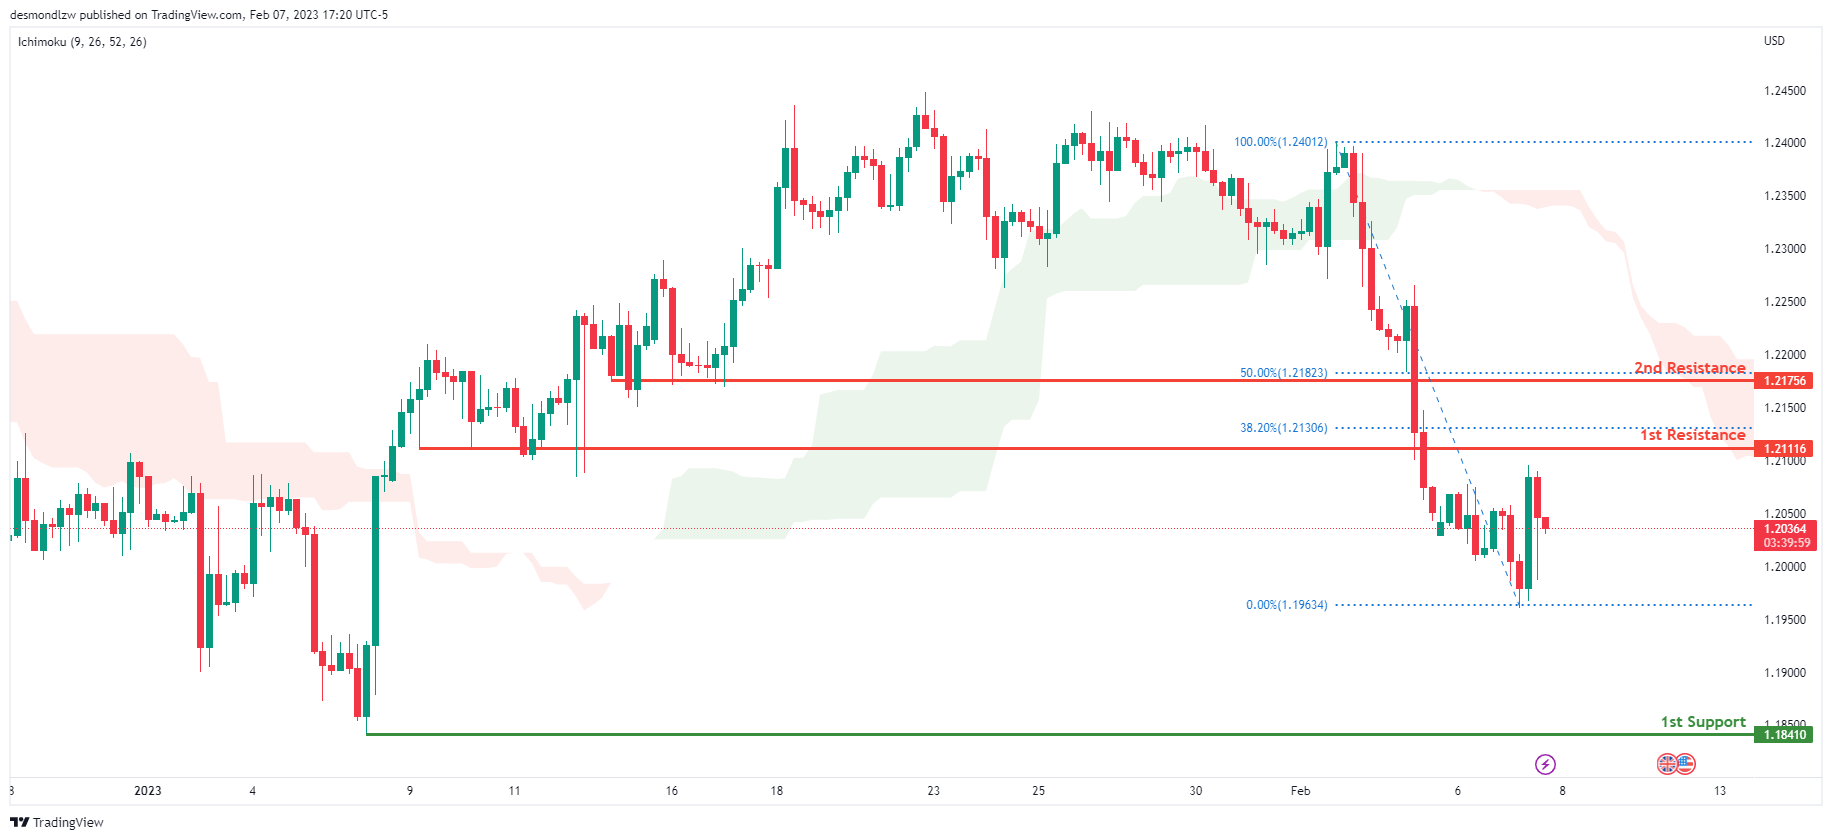
Looking at the H4 chart, my overall bias for GBPUSD is bearish due to the current price crossing below the Ichimoku cloud, indicating a bearish market. If this bearish momentum continues, expect the price to possibly continue to head towards the 1st support at 1.18410, where the previous swing low is. In an alternate scenario, price could head back up to retest the 1st resistance line at 1.21116 where the overlap resistance and 38.2% Fibonacci line is.
Areas of consideration:
- H4 1st resistance at 1.21116
- H4 1st support at 1.18410
USD/CHF:
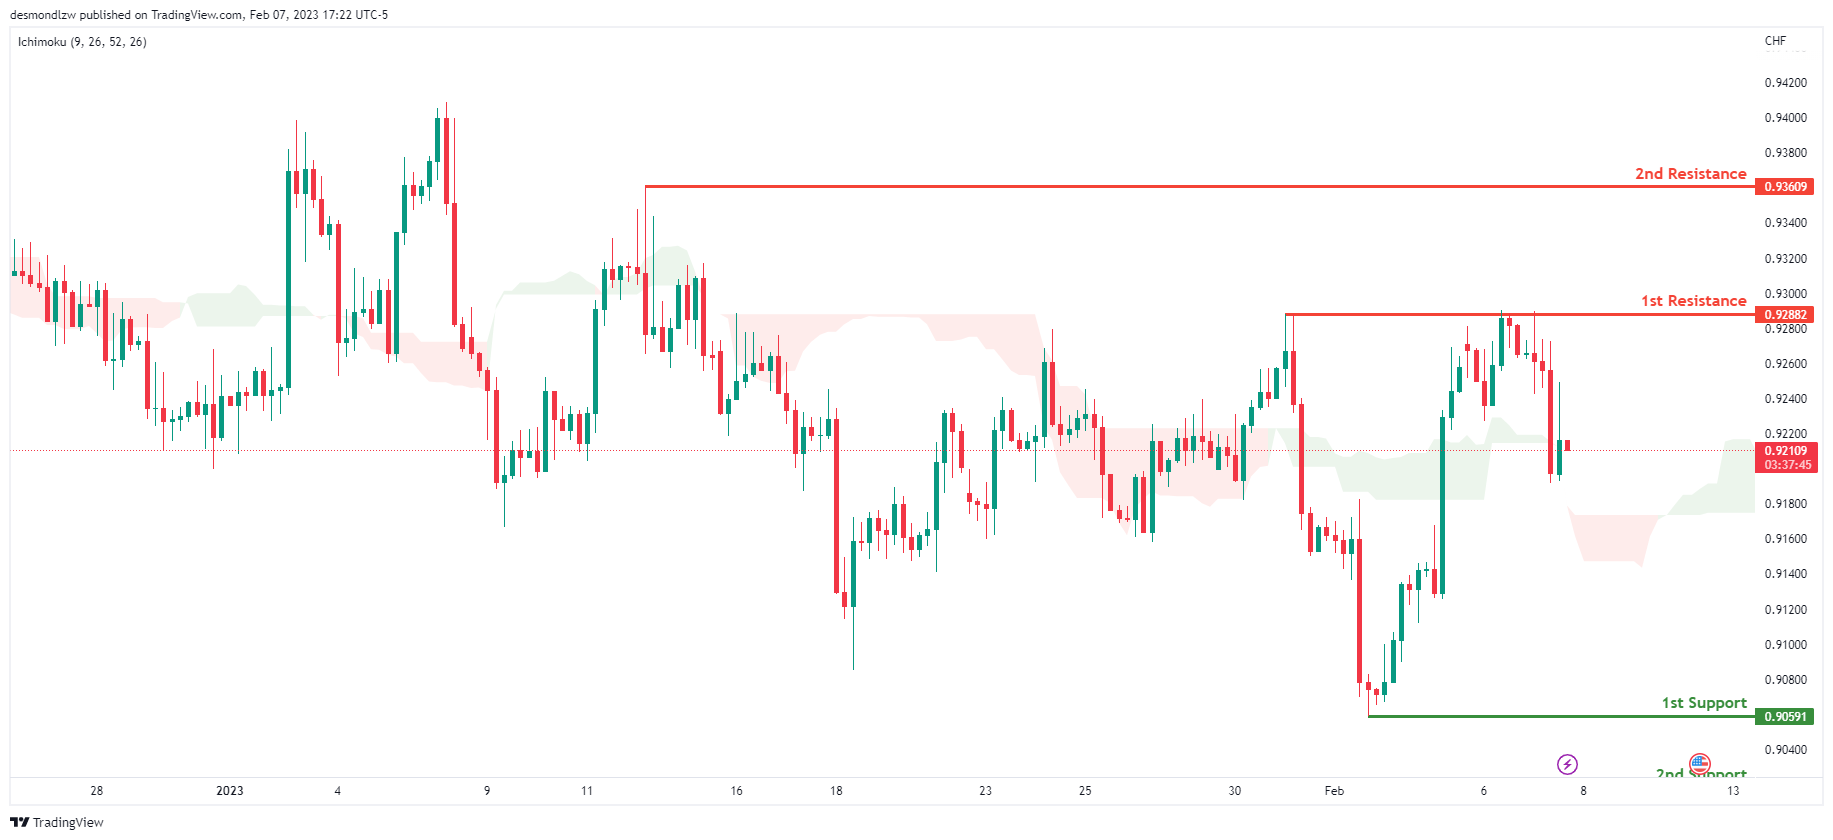
Looking at the H4 chart, my overall bias for USDCHF is bullish due to the current price being above the Ichimoku cloud, indicating a bullish market. If the current bullish trend continues, expect the price to possibly break the 1st resistance at 0.92882, where the previous swing high is, before heading towards the 2nd resistance at 0.93609 where the intermediate high is. In an alternative scenario, price could possibly head back down to retest the 1st support at 0.90591, where the recent swing low is.
Areas of consideration
- H4 1st support at 0.90591
- H4 1st resistance at 0.92882
- H4 2nd resistance at 0.93609
XAU/USD (GOLD):
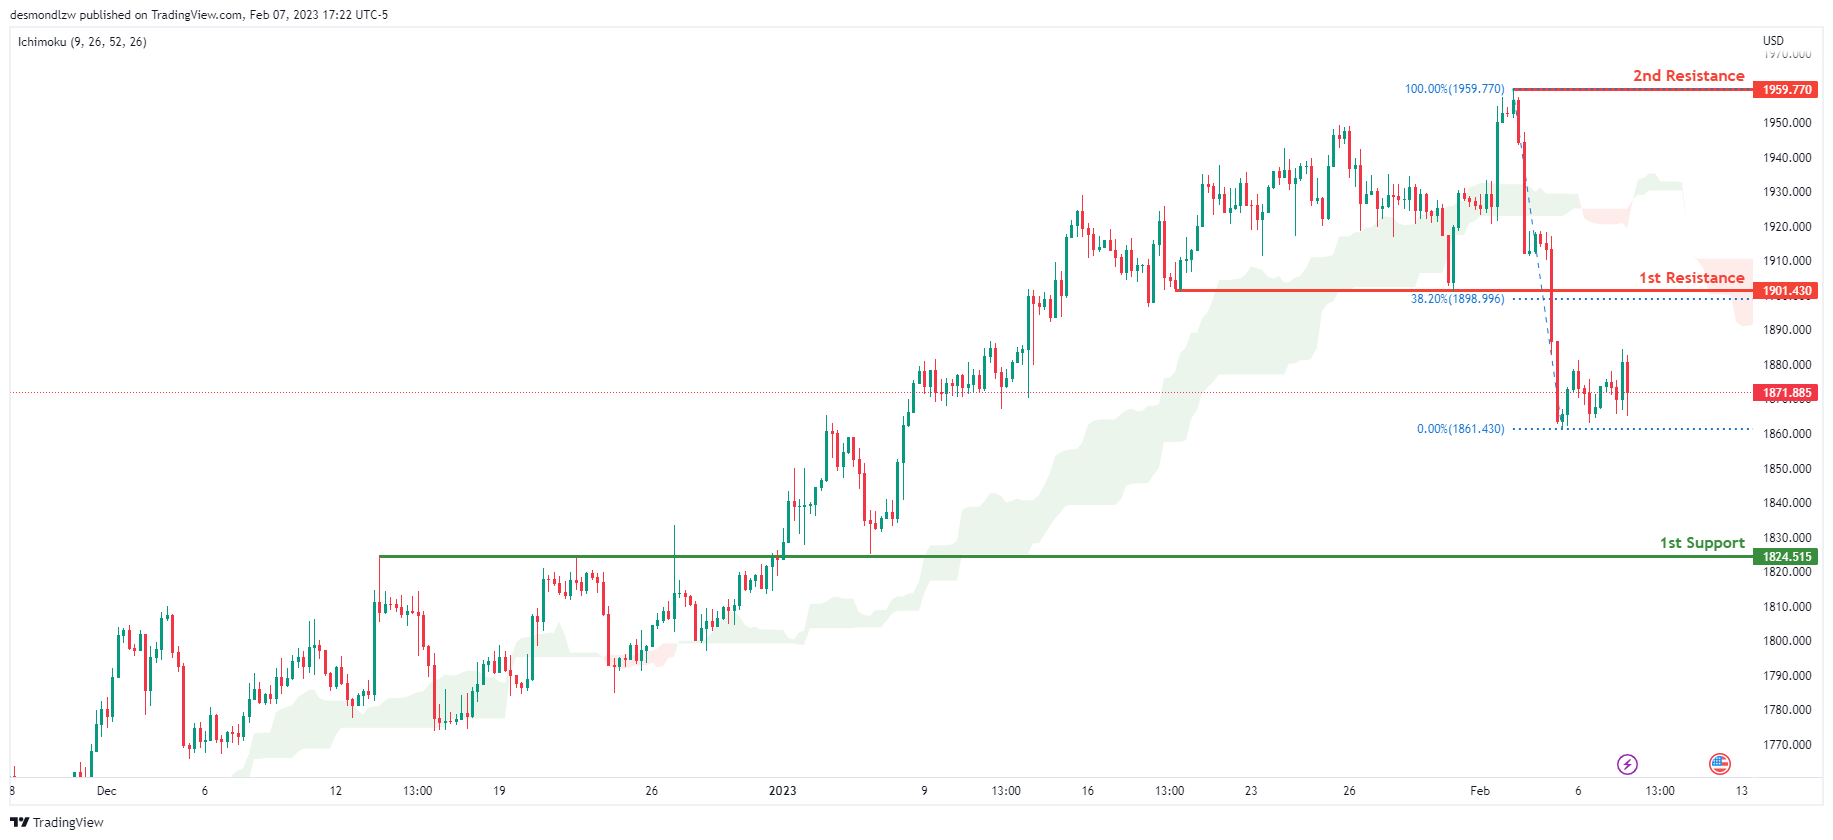
Looking at the H4 chart, my overall bias for XAUUSD is bearish due to the current price being below the Ichimoku cloud, indicating a bearish market. If this bearish momentum continues, expect the price to possibly continue heading towards the 1st support at 1824.515 where the overlap support is. In an alternative scenario, price could possibly head back up to retest the 1st resistance at 1901.430, where the overlap resistance and 38.2% Fibonacci line is.
Areas of consideration:
- H4 time frame, 1st resistance at 1901.430
- H4 time frame, 1st support at 1824.515
AUD/USD:
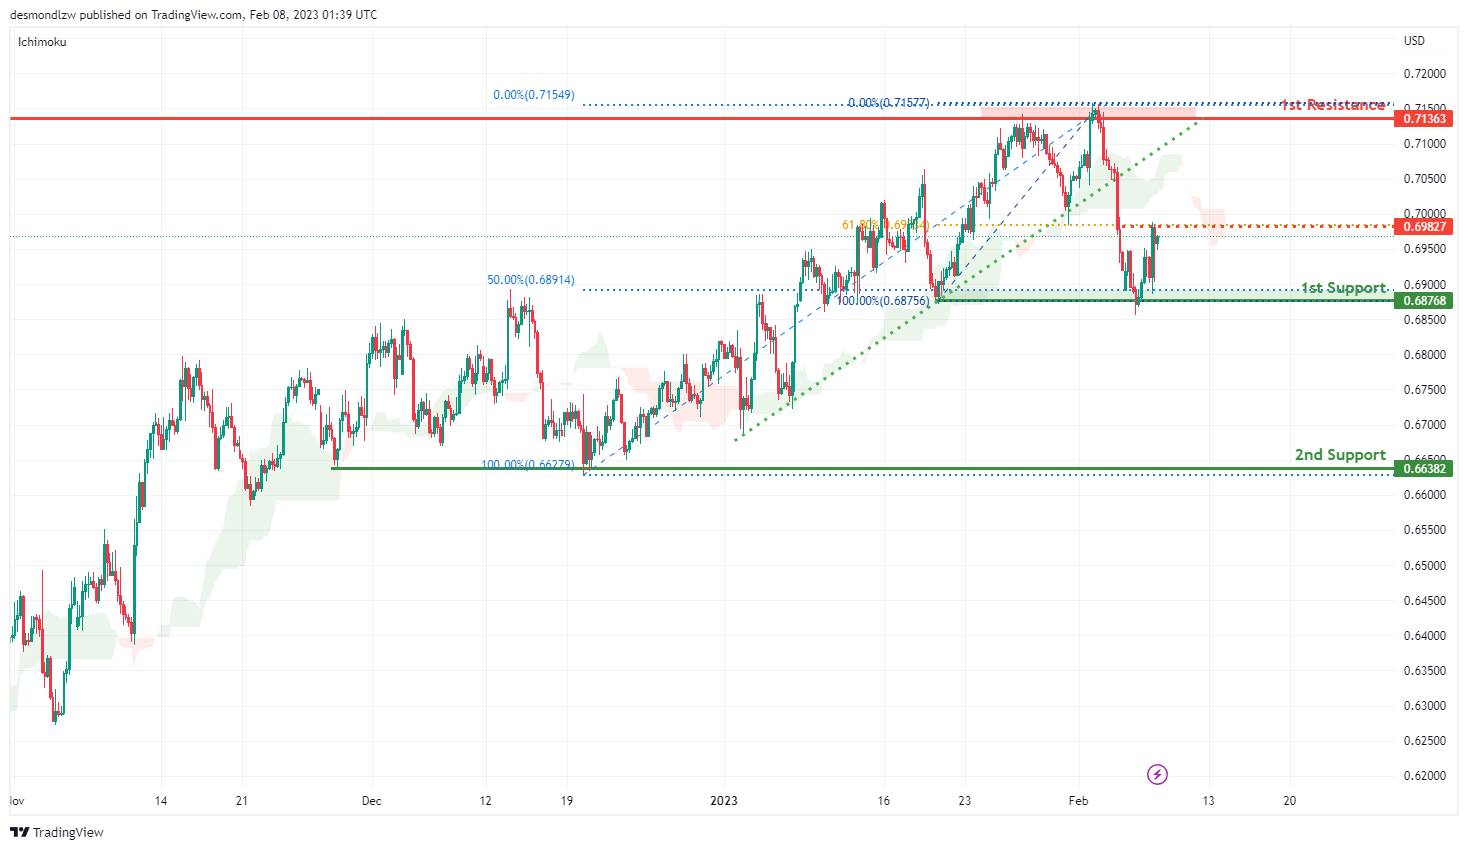
Looking at the H4 chart, my overall bias for AUDUSD is bearish due to the current price is below the Ichimoku cloud, and the ascending trend line has been broken, indicating a change of market structure.
The 1st support is at 0.68768 which in line with the 50% Fibonacci retracement. The 2nd support is at 0.66382 which is the overlap and recent swing low.
In an alternate scenario, the price could possibly go back up towards the 1st resistance level at 0.71363 which is the recent swing high. There is an intermediate resistance at 0.69827 which is inline with 61.8% Fibonacci retracement.
Areas of consideration
- H4. 1st resistance at 0.71363
- H4. intermediate resistance at 0.69827
- H4, 1st support at 0.68768
- H4, 2nd support at 0.66382
NZD/USD:
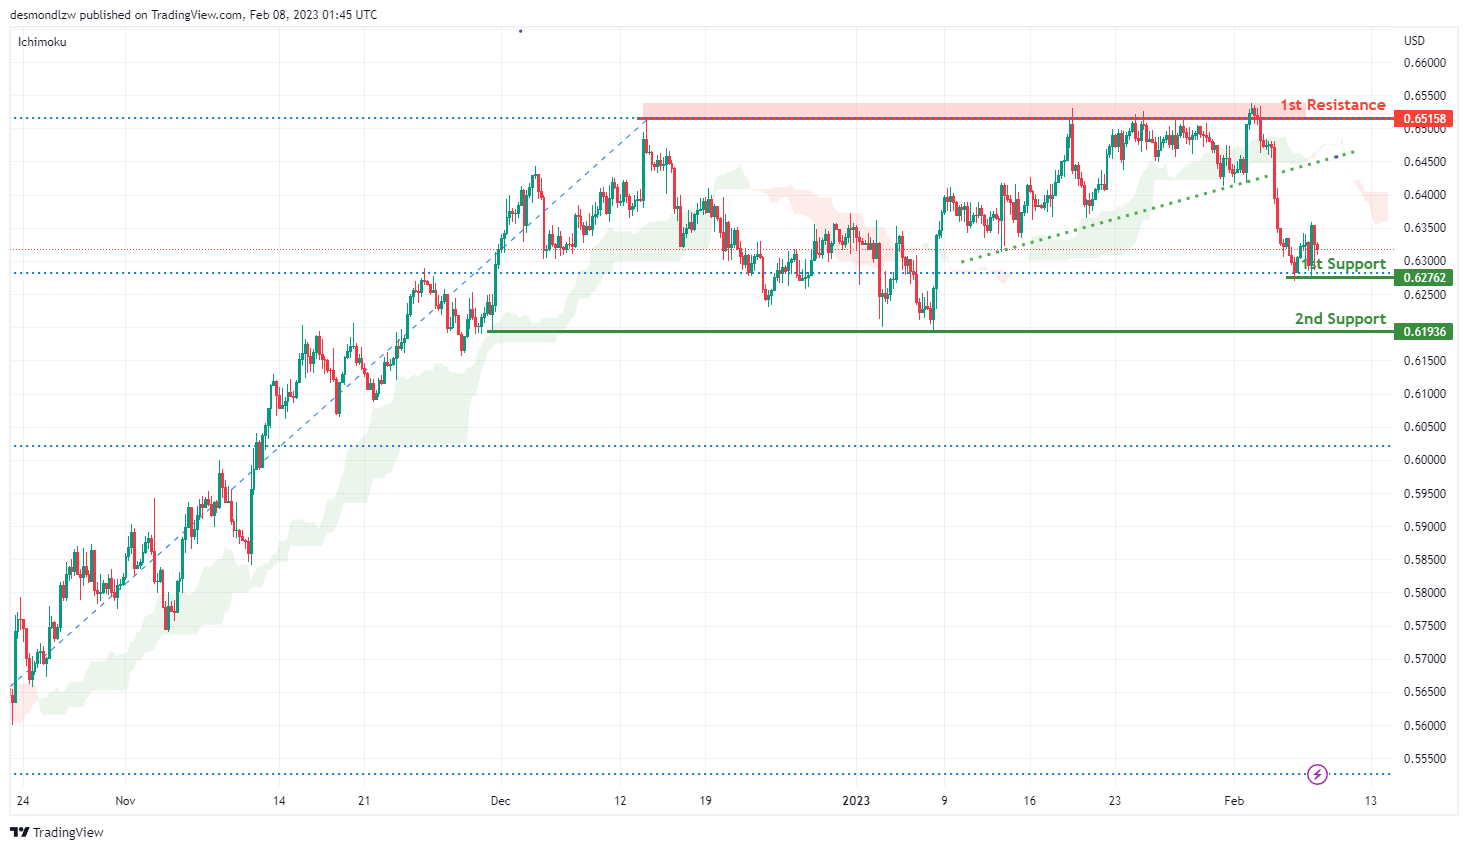
Looking at the H4 chart, my overall bias for NZDUSD is bearish, as the current price is below the Ichimoku Cloud, and the ascending trend line has been broken, indicating a change of market structure. Expecting the price go down towards the 1st support at 0.62762 which is the recent overlap swing low. It is also inline with 23.6% Fibonacci retracement. The 2nd support is at 0.61936.
In an alternate scenario, price could possibly up towards the 1st resistance level at 0.65158 which is the recent overlap swing high.
Areas of consideration:
- H4 time frame, 1st resistance at 0.65158
- H4 time frame, 1st support at 0.62762
- H4 time frame, 2nd support at 0.61936
USD/CAD:
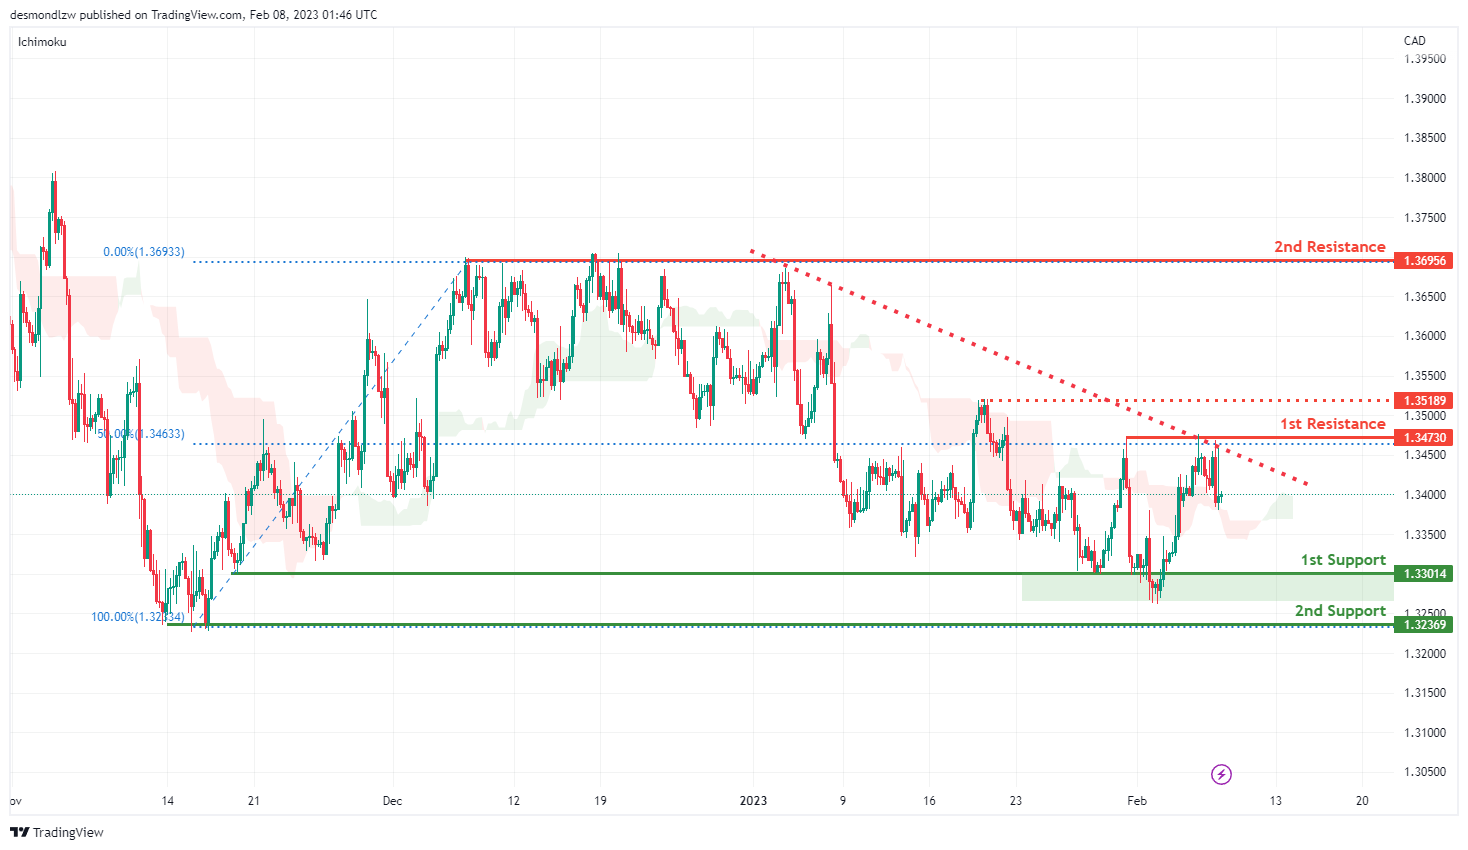
Looking at the H4 chart, my overall bias for USDCAD is bearish , as there is a descending trend line. Expecting the current price is head down towards the 1st support at 1.33014. The 2nd support is at 1.32369 which is the previous swing low.
In an alternative scenario, the price could possibly head up to the 1st resistance at 1.34730 which is the recent swing high and also in line with the 50% Fibonacci retracement. The 2nd resistance is at 1.36933 which the previous swing high.
Areas of consideration:
- H4 time frame, 2nd resistance at 1.36933
- H4 time frame, 1st resistance at 1.34730
- H4 time frame, 1st support at 1.33014
- H4 time frame, 2nd support at 1.32369
OIL:
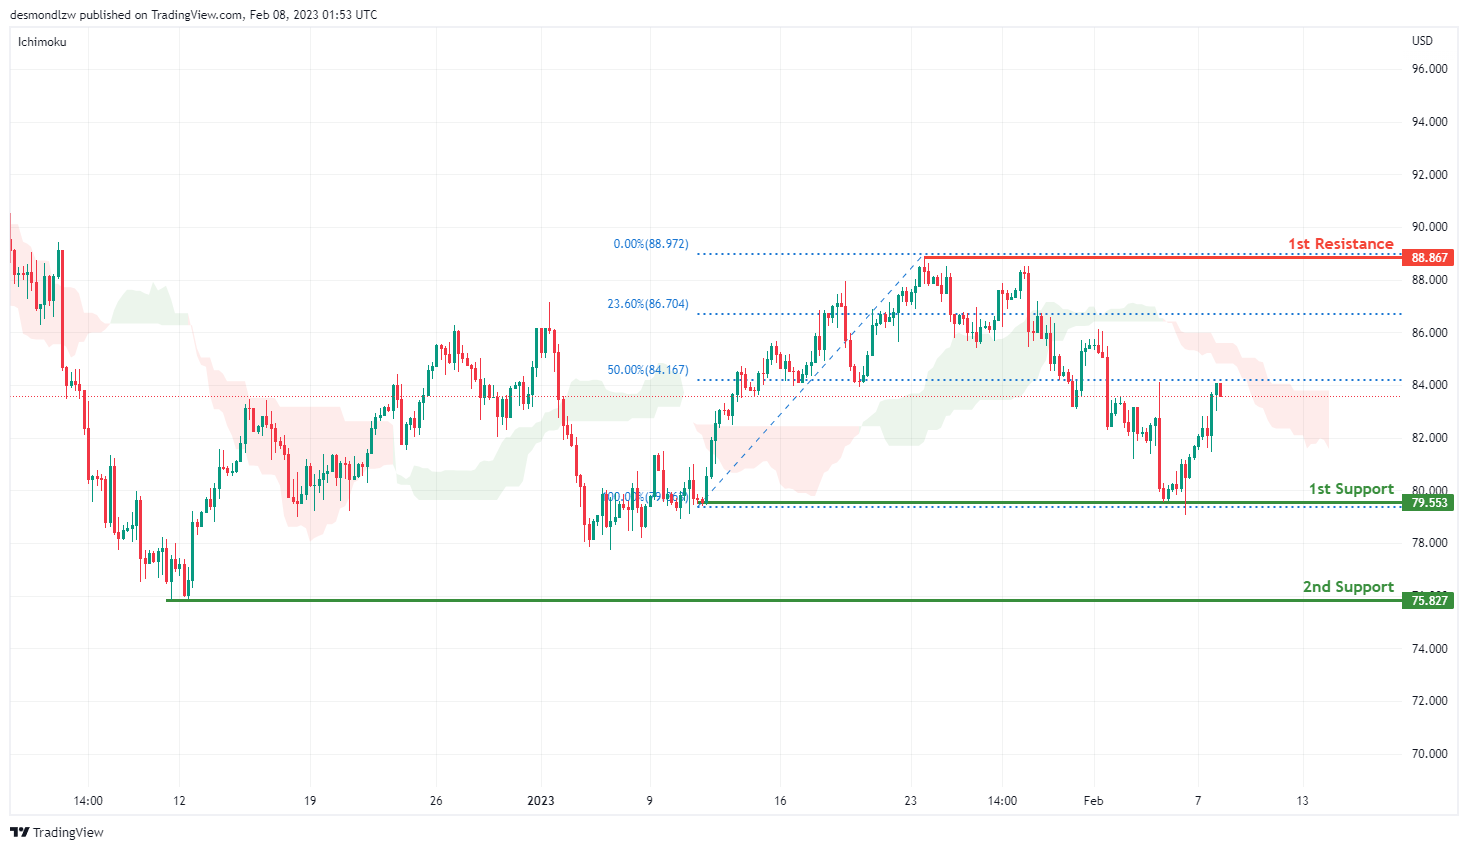
Looking at the H4 chart, my overall bias for BOC is bearish.as the current price is below the Ichimoku cloud, Expecting the price head down towards the 1st support level at 79.553 which is an overlap support, before it heads down to the 2nd support at 75.827 which is the recent swing low.
In an alternate scenario, the price could possibly head up towards the 1st resistance level at 88.867 which is the recent swing high.
Areas of consideration:
- H4 time frame, 1st resistance at 88.867
- H4 time frame,1st support at 77.836
- H4 time frame, 2nd support at 75.827
Dow Jones Industrial Average:
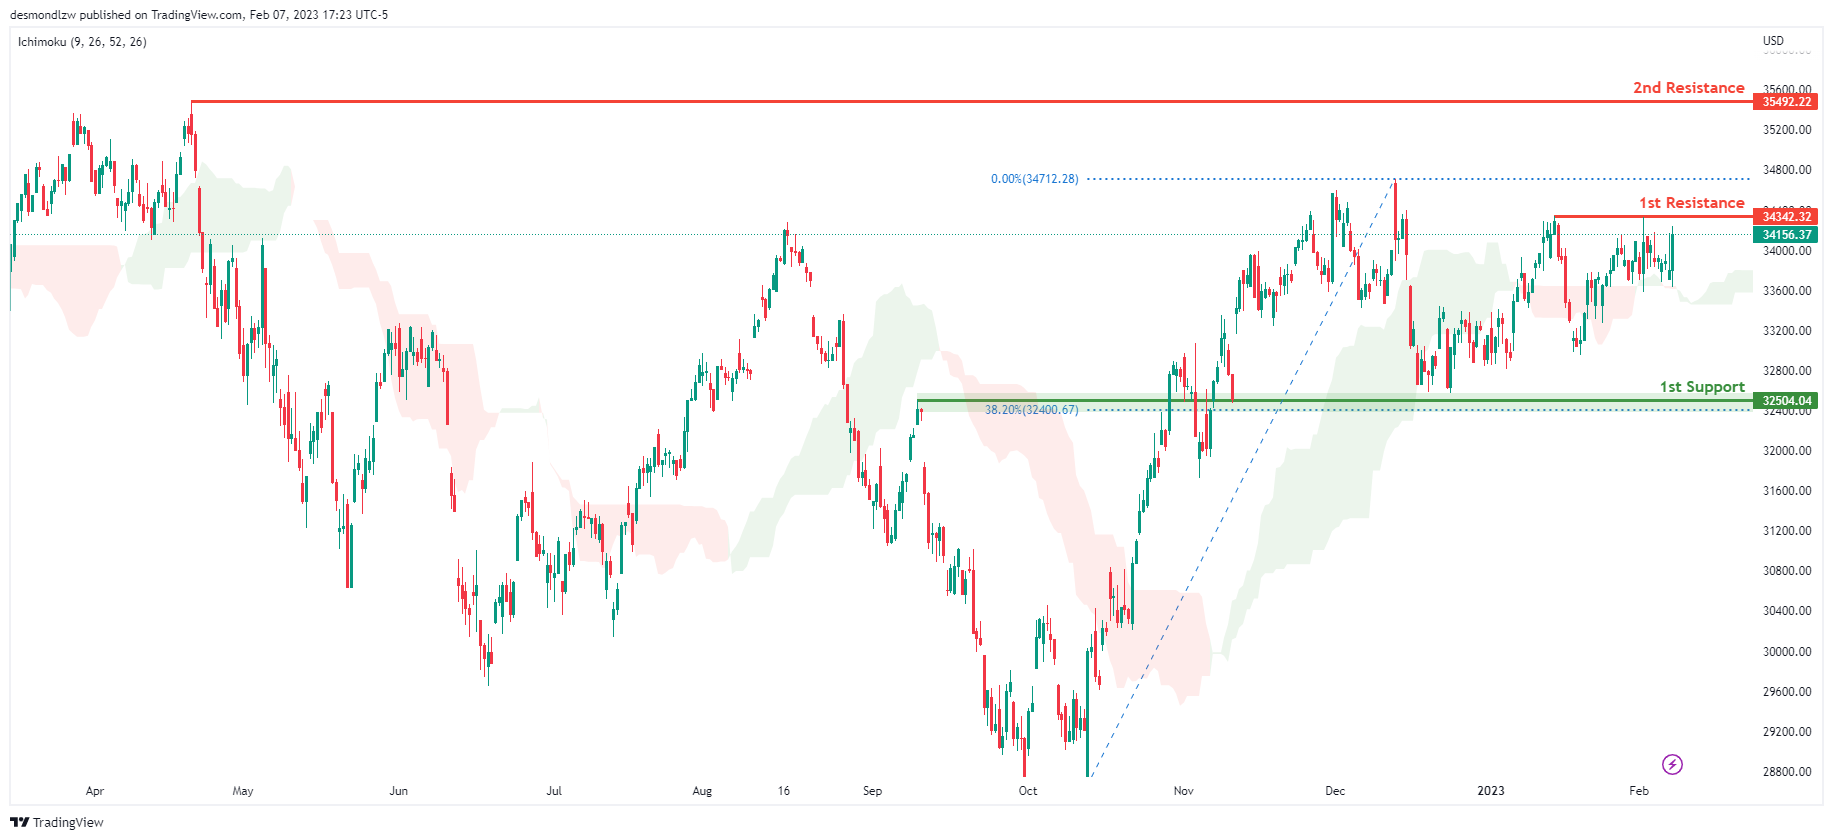
On the H4 chart, the overall bias for DJI is bullish. To add confluence to this, the price is crossing above the Ichimoku cloud which indicates a bullish market. If this bullish momentum continues, expect the price to possibly continue heading towards the 1st resistance line at 34342.32, where the recent swing high is. In an alternative scenario, price could possibly head back down towards the 1st support at 32581.97, slightly above where the 38.2% Fibonacci line is.
Areas of consideration:
- H4 time frame, 1st support at 32581.97
- H4 time frame, 1st Resistance at 34342.32
DAX:
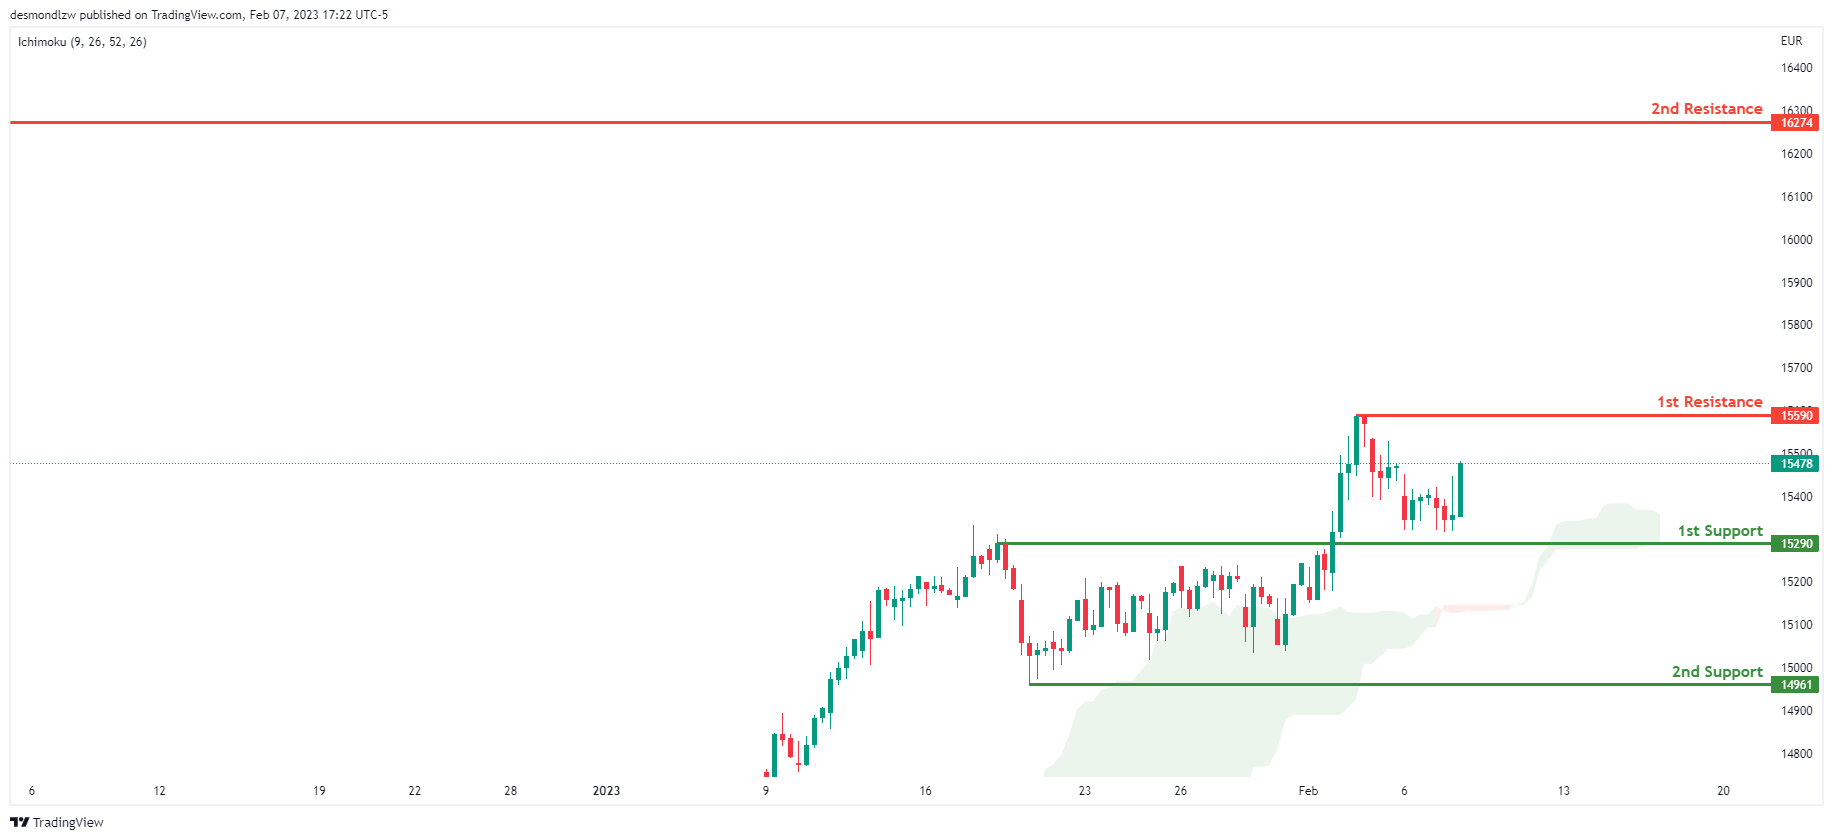
Looking at the H4 chart, my overall bias for DAX is bullish due to the current price crossing above the Ichimoku cloud, indicating a bullish market. If this bullish momentum continues, expect the price to possibly head towards the 1st resistance line at 15590, where the recent high is. In an alternative scenario, price could possibly head down to retest the 1st support at 15290, where the overlap support is.
Areas of consideration:
- H4 time frame, 1st resistance is at 15590
- H4 time frame, 1st support is at 15290
ETHUSD:
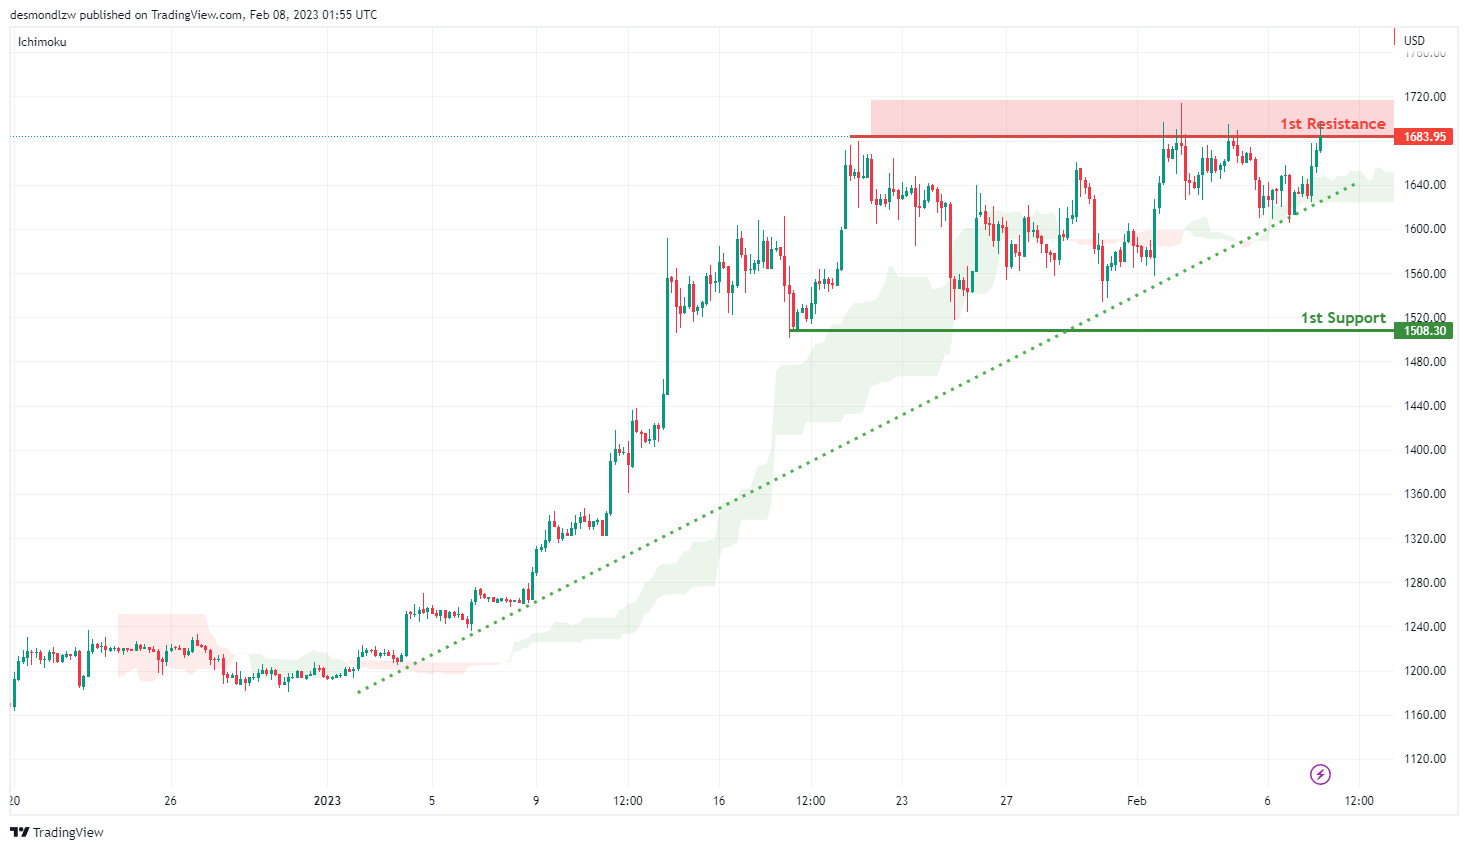
Looking at the H4 chart, my overall bias for ETHUSD is slightly bullish, the strong ascending trend line has been created. Expecting the price to break the 1st resistance line at 1683.95 which is the recent swing high, before it heads towards the 2nd resistance 1784.57.
In an alternate scenario, the price may break the support line and go down to the 1st support at 1508.30 which is the recent swing low.
Areas of consideration:
- H4 time frame, 2nd resistance of 1784.57
- H4 time frame, 1st resistance of 1683.95
- H4 time frame, 1st support at 1508.30
BTCUSD:
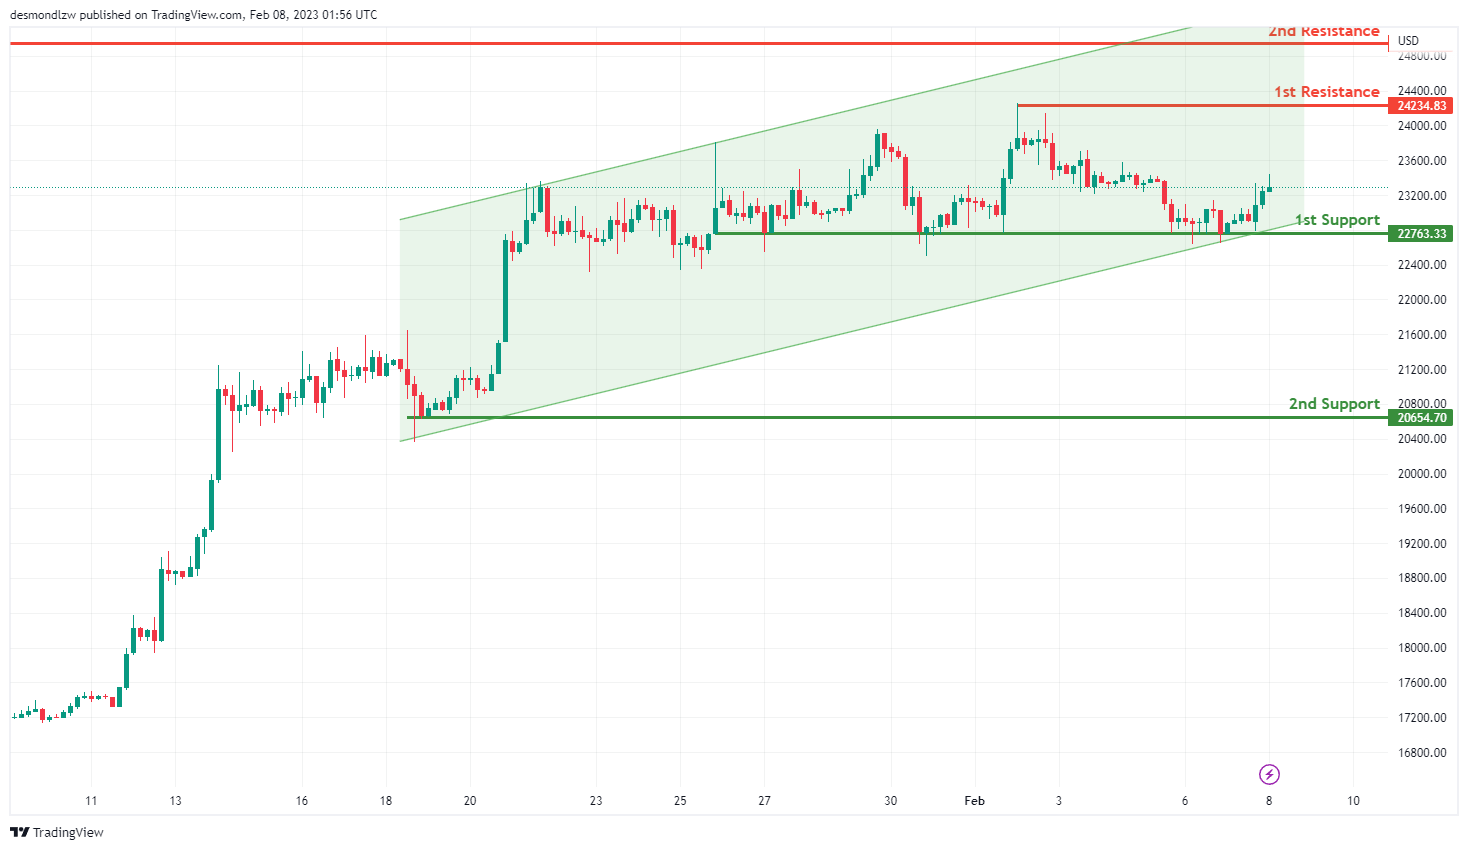
Looking at the H4 chart, my overall bias for BTCUSD is bullish. An ascending channel was created, expecting the price to break the 1st resistance line at 24234.83 which is the recent overlap resistance, before heading towards the 2nd resistance at 24942.70 which is the previous swing high.
In an alternative scenario, the price could possibly head down to the 1st support at 22763.33 which is the overlap support.
Areas of consideration:
H4 time frame, 2nd resistance 24942.70
H4 time frame, 1st resistance 24234.83
H4 time frame, 1st support at 22763.33
S&P 500:
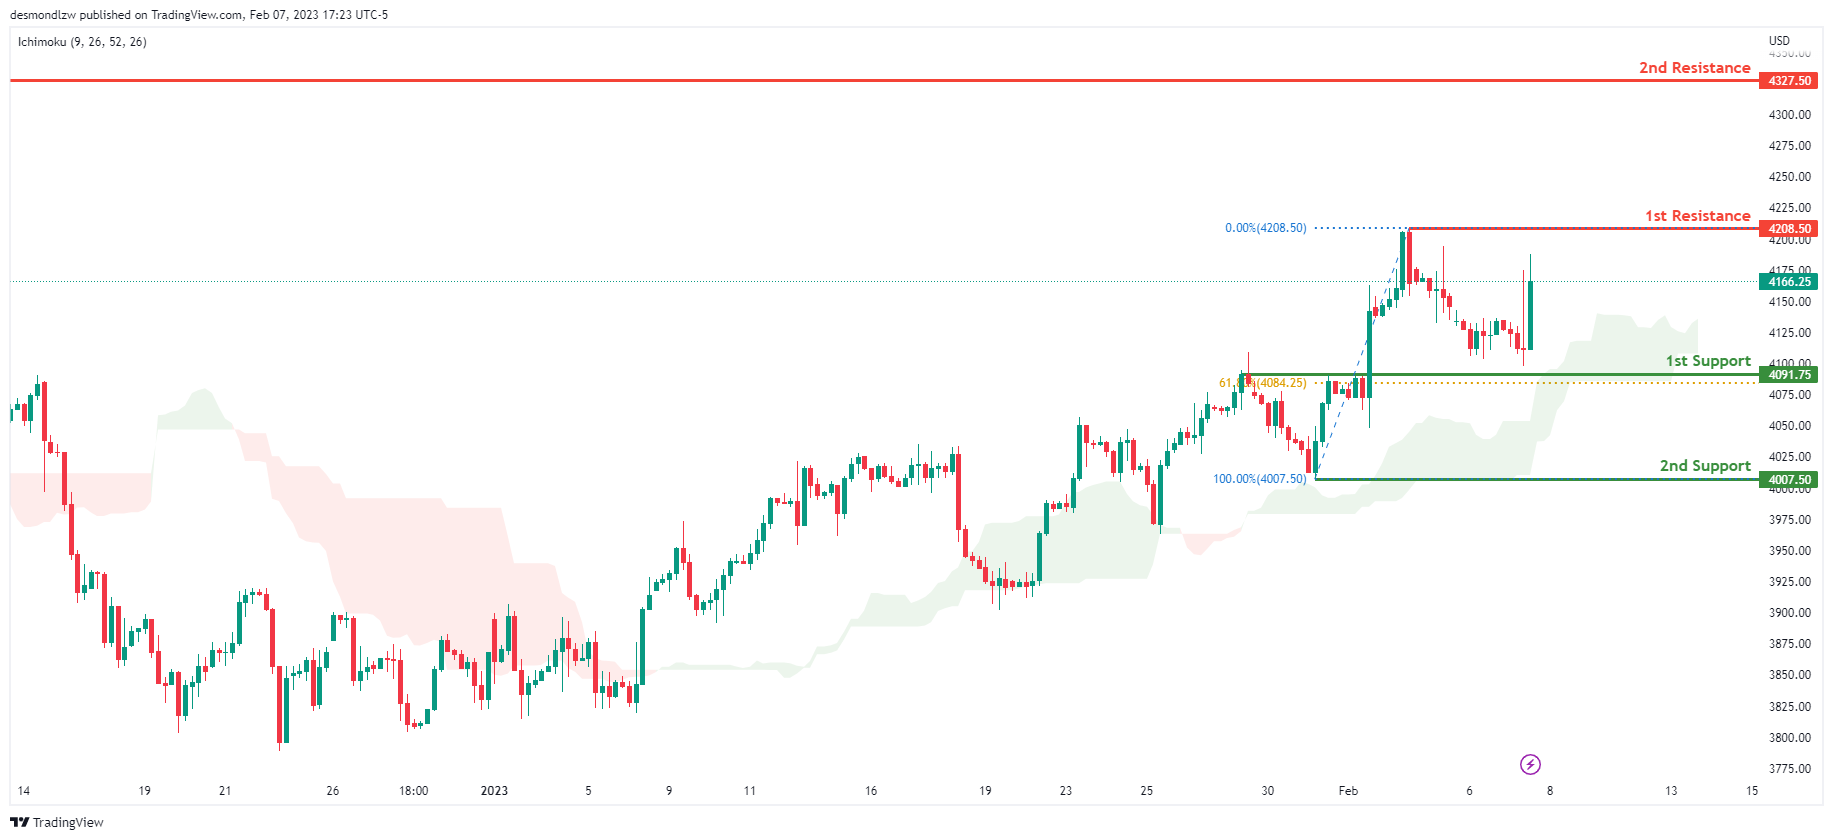
Looking at the H4 chart, my overall bias for S&P500 is bullish due to the current price being above the Ichimoku cloud, indicating a bullish market. If this bullish momentum continues, expect the price to possibly break the 1st resistance at 4208.50, where the recent swing high is., before heading towards the 2nd resistance at 4327.50 where the previous swing high is, In an alternative scenario, price could possibly head back down to retest the 1st support at 4091.75, where the 50% Fibonacci line is.
Areas of consideration:
- H4 time frame, 1st support at 4091.75
- H4 time frame, 1st resistance at 4208.50
- H4 time frame, 2nd resistance at 4327.50
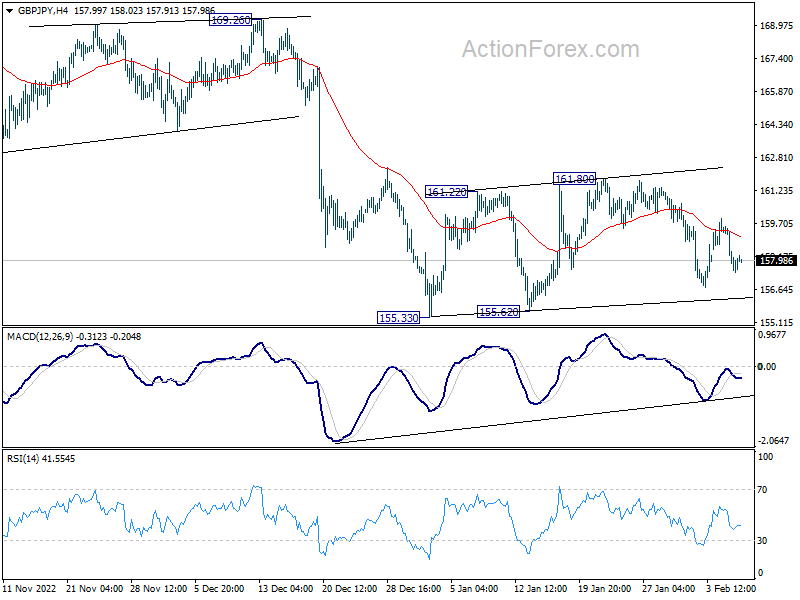
GBP/JPY Daily Outlook
Daily Pivots: (S1) 157.05; (P) 158.32; (R1) 159.19; More...
Intraday bias in GBP/JPY stays neutral and outlook is unchanged. On the downside, break of 155.33 low will resume the fall form 172.11 to 153.70 fibonacci level next. On the upside, sustained trading above 55 day EMA (now at 161.42) will turn bias to the upside, for stronger rise back to 169.26/172.11 resistance zone.
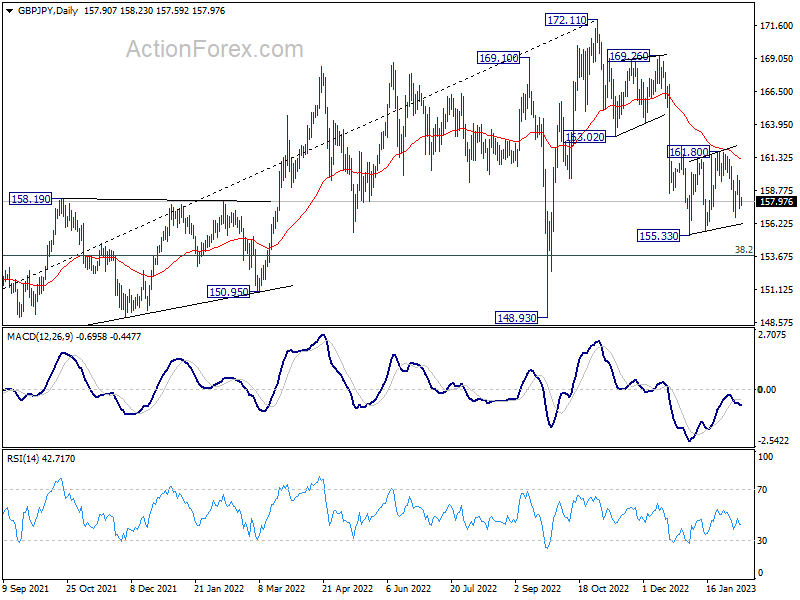
In the bigger picture, as long as 163.02 support turned resistance holds, decline from 172.11 medium term top is expected to continue to 38.2% retracement of 123.94 to 172.11 at 153.70. Sustained break there will raise the change of trend reversal and target 61.8% retracement at 142.34. Nevertheless, break of 163.02 support turned resistance will argue that the decline has completed, and retain medium term bullishness.
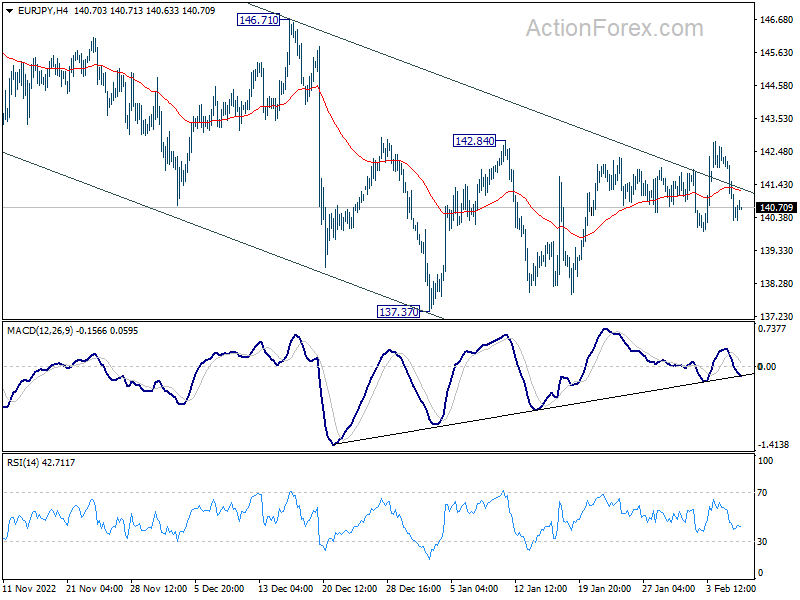
EUR/JPY Daily Outlook
Daily Pivots: (S1) 139.83; (P) 141.08; (R1) 141.88; More....
Outlook in EUR/JPY remains unchanged and intraday bias stays neutral. On the upside, decisive break of 142.84 will argue that the correction from 148.38 has completed at 137.37 already. Further rise would be seen to 146.71 resistance next. On the downside, firm break of 155.33 will resume the whole decline from 148.38 to 135.40 fibonacci level.
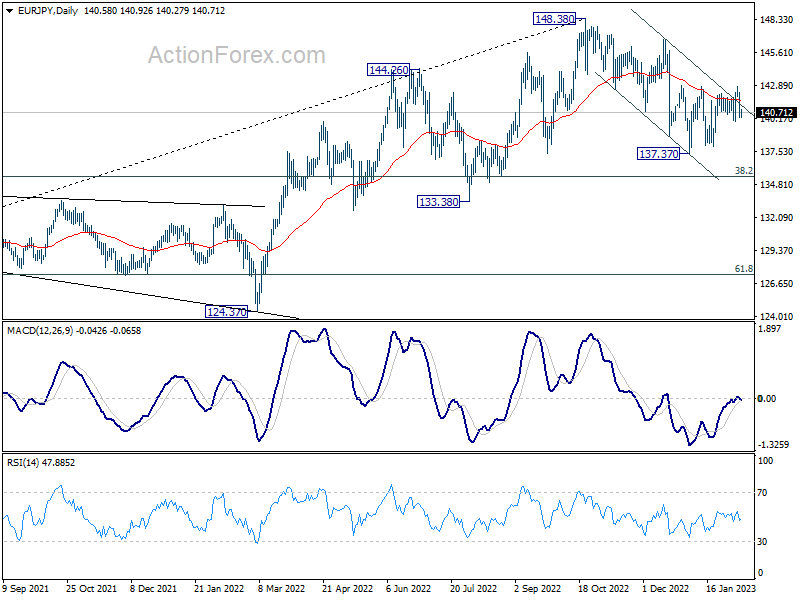
In the bigger picture, as long as 55 week EMA (now at 138.82) holds, larger up trend from 114.42 (2020 low) is still in progress for 149.76 long term resistance. However, firm break of 55 week EMA will bring deeper fall to 38.2% retracement of 114.42 to 148.38 at 135.40. Sustained break there will raise the chance of trend reversal, and target 61.8% retracement at 127.39.
EUR/GBP Daily Outlook
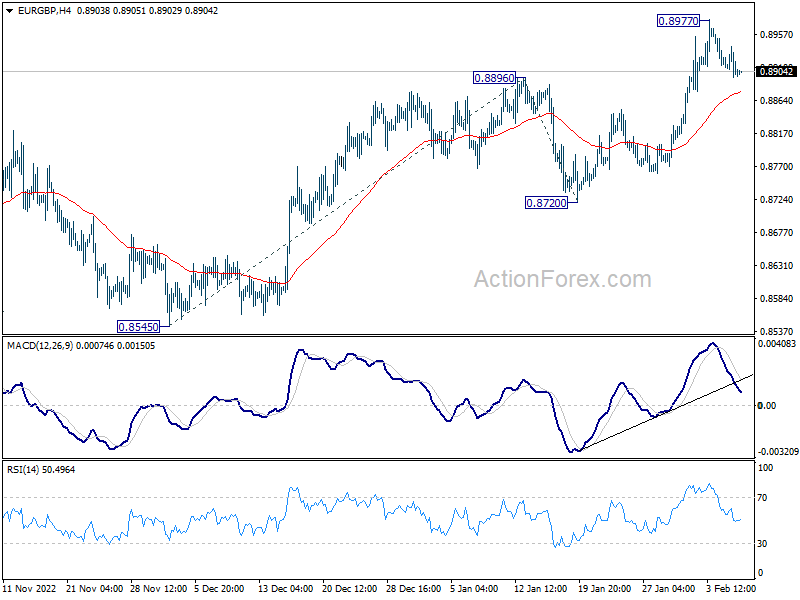
Daily Pivots: (S1) 0.8888; (P) 0.8914; (R1) 0.8931; More...
Intraday bias in EUR/GBP remains neutral at this point. Outlook stays bullish as long as 0.8270 support holds. On the upside, break of 0.8977 will resume whole rise from 0.8545 to 100% projection of 61.8% projection of 0.8545 to 0.8896 from 0.8720 at 0.9071.
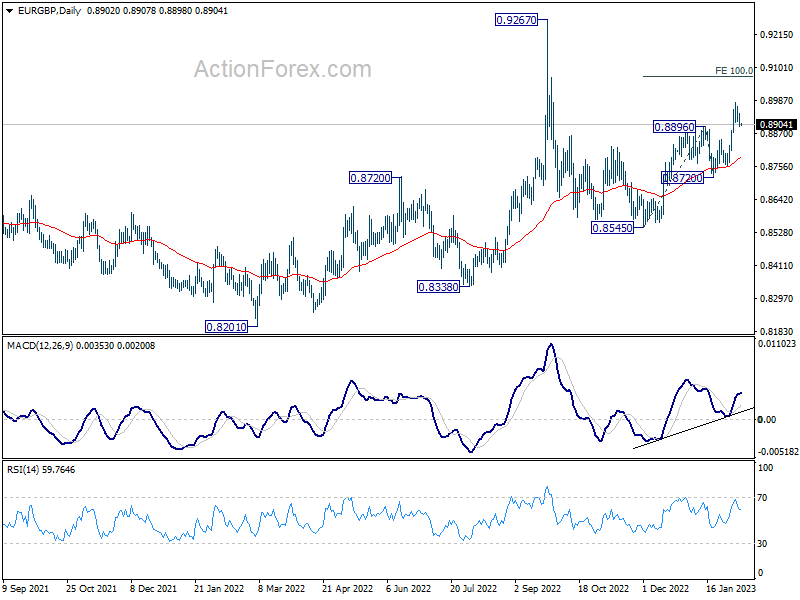
In the bigger picture, the notable support from 55 day EMA (now at 0.8780) retains near term bullishness. Break of 0.8896 should target 0.9267 (2022 high) and possibly above, to resume whole up trend from 0.8201 (2022 low). However, break of 0.8270 support and sustained trading below 55 day EMA will set the stage for 0.8545 and below.
EUR/AUD Daily Outlook
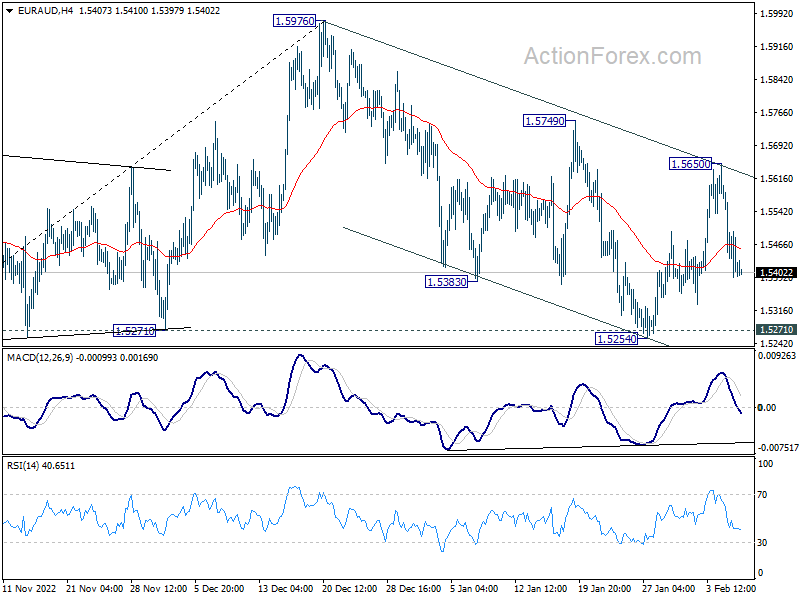
Daily Pivots: (S1) 1.5344; (P) 1.5465; (R1) 1.5537; More...
Intraday bias in EUR/AUD is back on the downside with break of 4 hour 55 EMA. Deeper fall would be seen back to retest 1.5254/71. Firm break there will carry larger bearish implication and resume the fall from 1.5976. On the upside, above 1.5650 will resume the rebound to 1.5749 resistance.
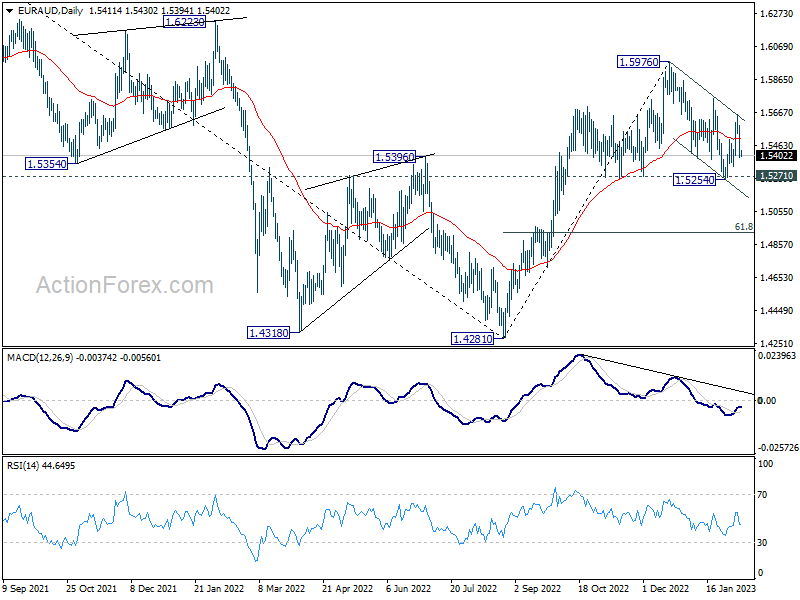
In the bigger picture, it's still early to confirm if rise from 1.4281 represents bullish trend reversal. But as long as 1.5271 support holds, such rally is in favor to continue. Break of 1.5976 will target 1.6434 key resistance next. On the other hand, firm break of 1.5271 will retain medium term bearishness instead.
EUR/CHF Daily Outlook
Daily Pivots: (S1) 0.9855; (P) 0.9907; (R1) 0.9941; More....
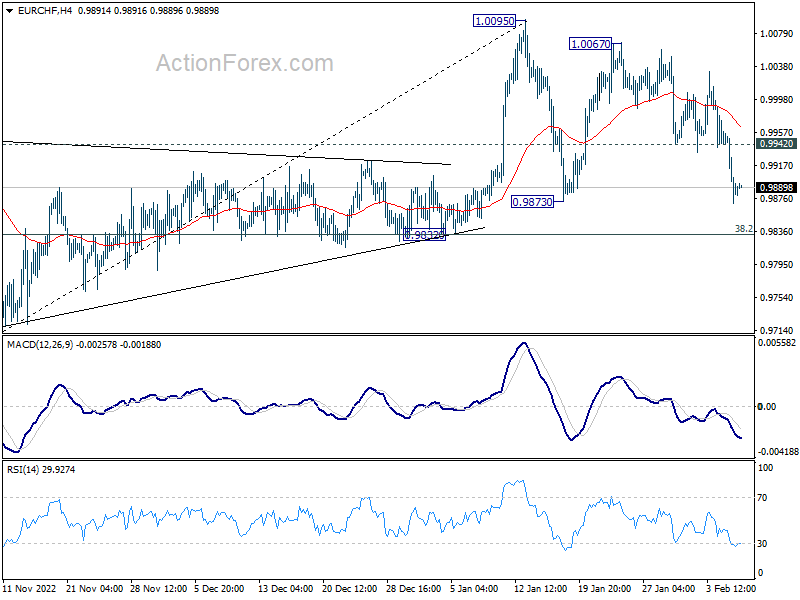
EUR/CHF dips to as low as 0.9870 as corrective pattern from 1.0095 extends. Deeper fall could still be seen but downside should be contained by 38.2% retracement of 0.9407 to 1.0095 at 0.9832 to bring rebound. On the upside, break of 0.9942 minor resistance will turn bias back to the upside for retesting 1.0067.95 resistance zone.
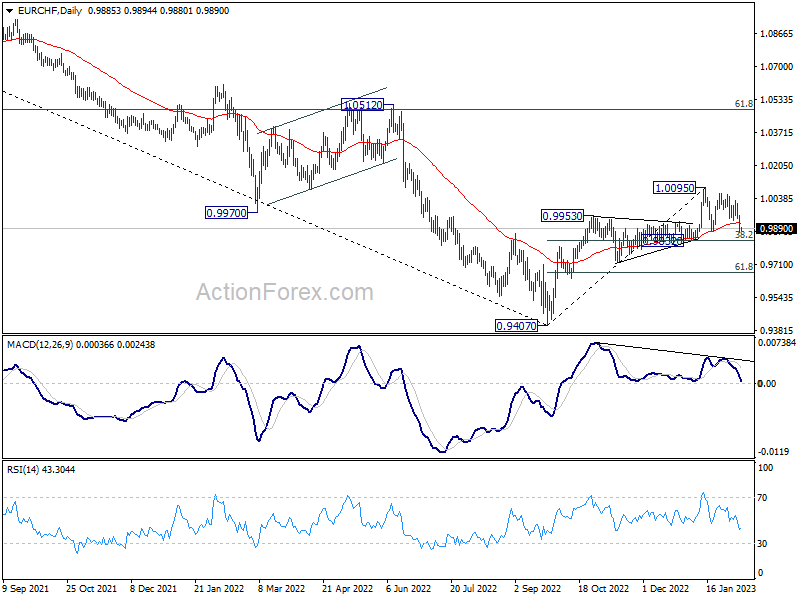
In the bigger picture, the initial rejection by 55 week EMA (now at 1.0039) mixed up the outlook. On the upside, sustained trading above 55 week EMA will raise the chance of bullish trend reversal. Rise from 0.9407 should then target 1.0505 cluster resistance (2020 low at 1.0505, 61.8% retracement of 1.1149 to 0.9407 at 1.1484). However, firm break of 0.9832 support will revive medium term bearishness and bring retest of 0.9407 low instead.
USD/CAD Daily Outlook
Daily Pivots: (S1) 1.3362; (P) 1.3416; (R1) 1.3451; More....
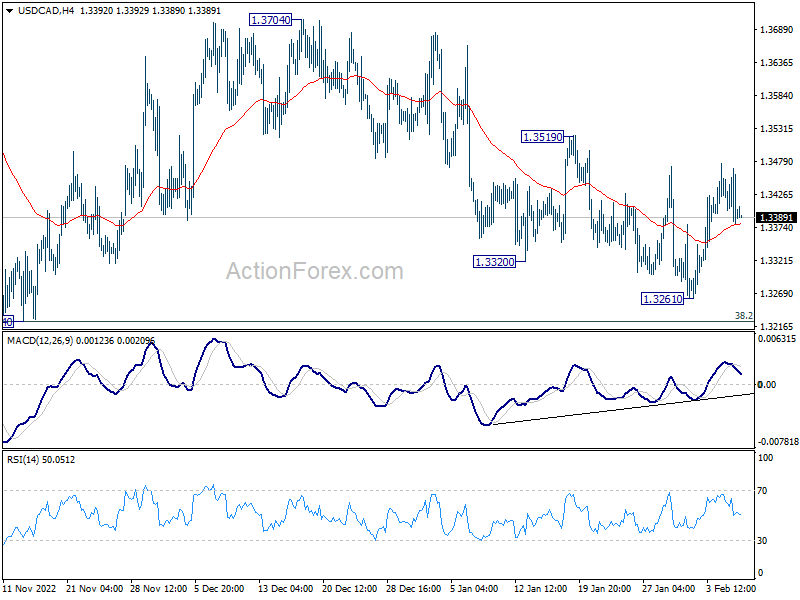
Intraday bias in USD/CAD remains neutral at this point. While the choppy fall from 1.3704 might still extend lower, strong support is expected to 1.3224 key support to bring rebound. On the upside, above 1.3519 minor resistance will confirm short term bottoming, and turn intraday bias back to the upside for retesting 1.3704 resistance. However, decisive break of 1.3224 would carry larger bearish implication.
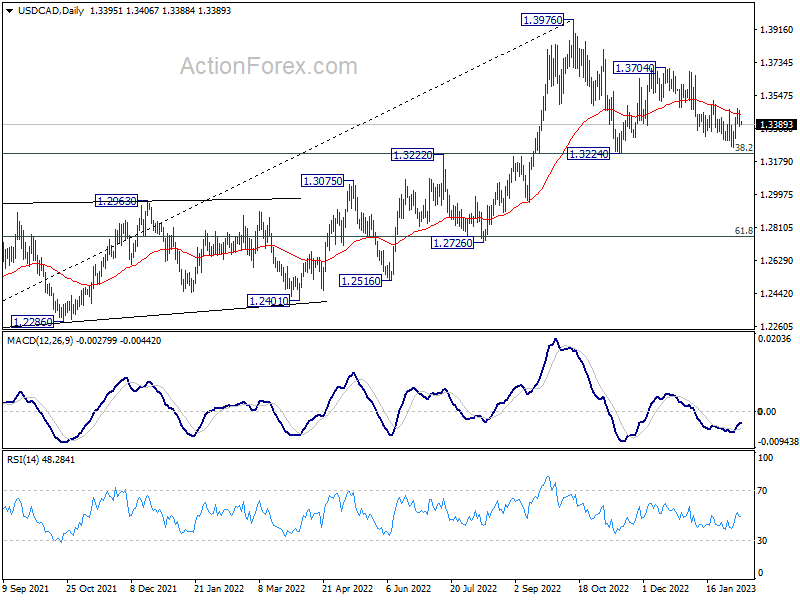
In the bigger picture, as long as 1.3222 cluster support (38.2% retracement of 1.2005 to 1.3976 at 1.3223) holds, larger up trend from 1.2005 (2021 low) is still expected to resume through 1.3976 high at a later stage. However, firm break of 1.3222/3 will indicate that the trend might have reversed. Deeper fall would be seen to next cluster support at 1.2726 (61.8% retracement at 1.2758).
AUD/USD Daily Report
Daily Pivots: (S1) 0.6898; (P) 0.6943; (R1) 0.7004; More...
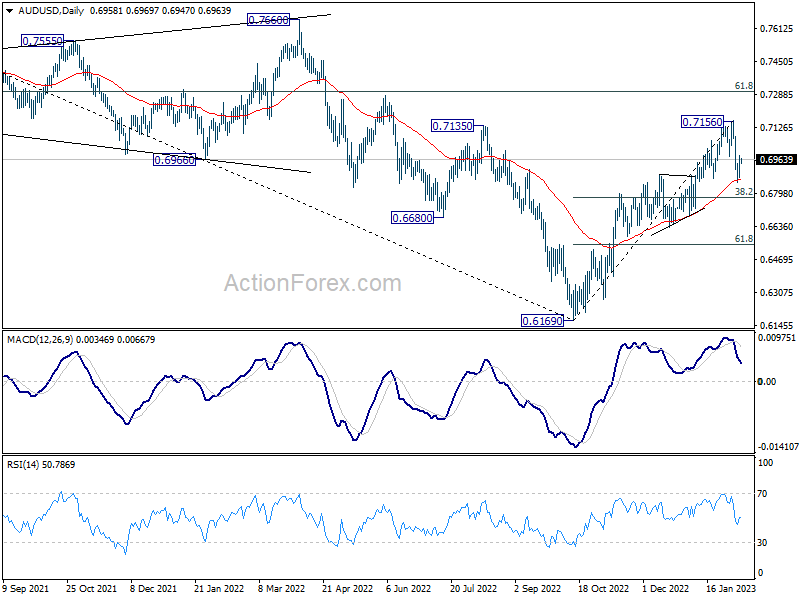
Intraday bias in AUD/USD remains neutral for the moment. Correction from 0.7156 could still extend lower. But downside should be contained by 38.2% retracement of 0.6169 to 0.7156 at 0.6779 to bring rebound. On the upside, sustained break of 4 hour 55 EMA (now at 0.7000) will bring retest of 0.7156 high.
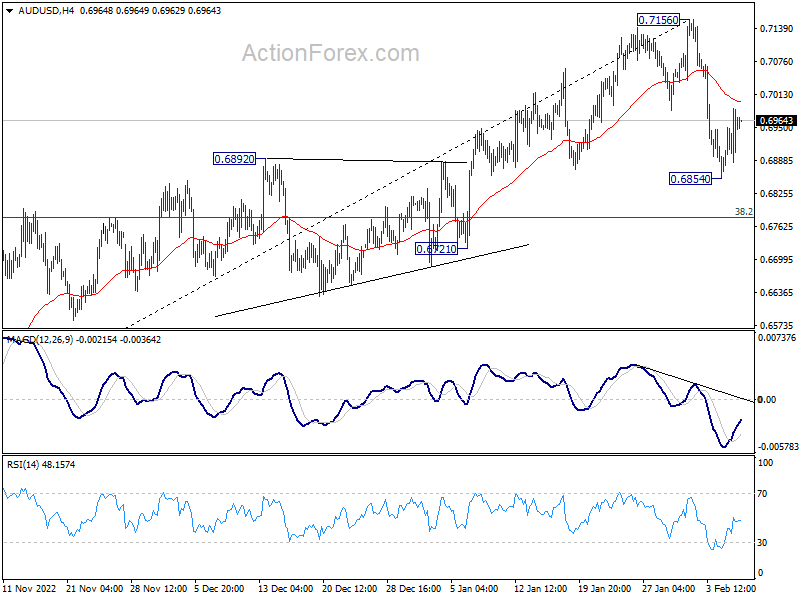
In the bigger picture, corrective decline from 0.8006 (2021 high) should have completed with three waves down to 0.6169 (2022 low). Further rally should be seen to 61.8% retracement of 0.8006 to 0.6169 at 0.7304. Sustained break there will pave the way to retest 0.8006. This will now remain the favored case as long as 0.6721 support holds.