

Sample Category Title
USD/JPY Daily Outlook
Daily Pivots: (S1) 130.13; (P) 131.42; (R1) 132.36; More...
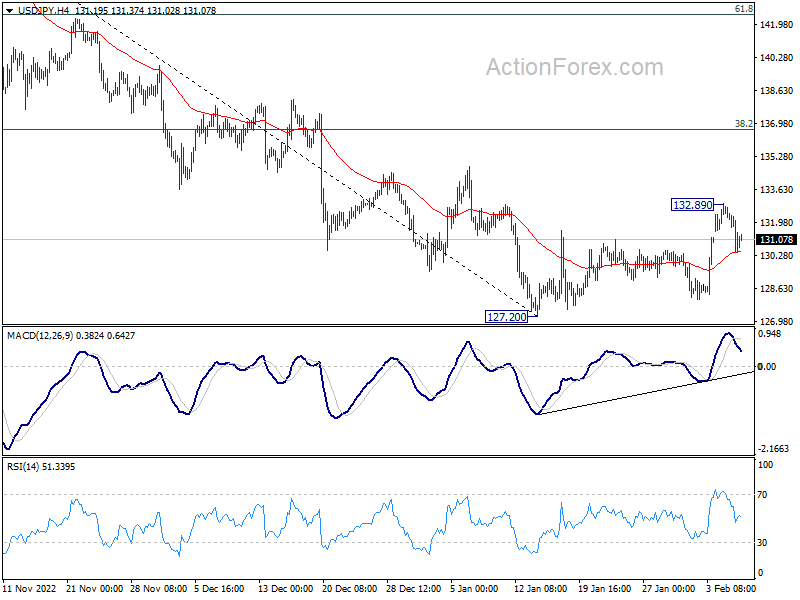
Intraday bias in USD/JPY remains neutral for the moment, and further rally is still mildly in favor. On the upside, above 132.89 will resume the rebound from 127.20 short term bottom to 38.2% retracement of 151.93 to 127.20 at 136.64. Nevertheless, sustained break of 4 hour 55 EMA (now at 130.50) will bring retest of 127.20 low.
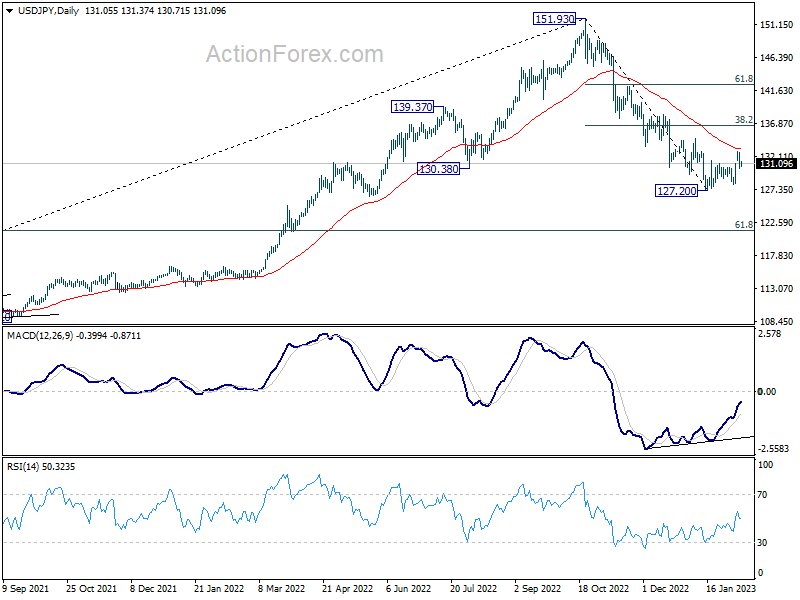
In the bigger picture, prior of 55 week EMA (now at 131.39) raises the chance of medium term bearish reversal, but that's not confirmed yet. Strong rebound from current level, followed by sustained break of 38.2% retracement of 151.93 to 127.20 at 136.64 will argue that price actions from 151.93 is merely a corrective pattern. However, rejection by 136.64 will solidify medium term bearishness for 61.8% retracement of 102.58 to 151.93 at 121.43 and 38.2% retracement of 75.56 to 151.93 at 122.75.
USD/CHF Daily Outlook
Daily Pivots: (S1) 0.9178; (P) 0.9234; (R1) 0.9276; More...
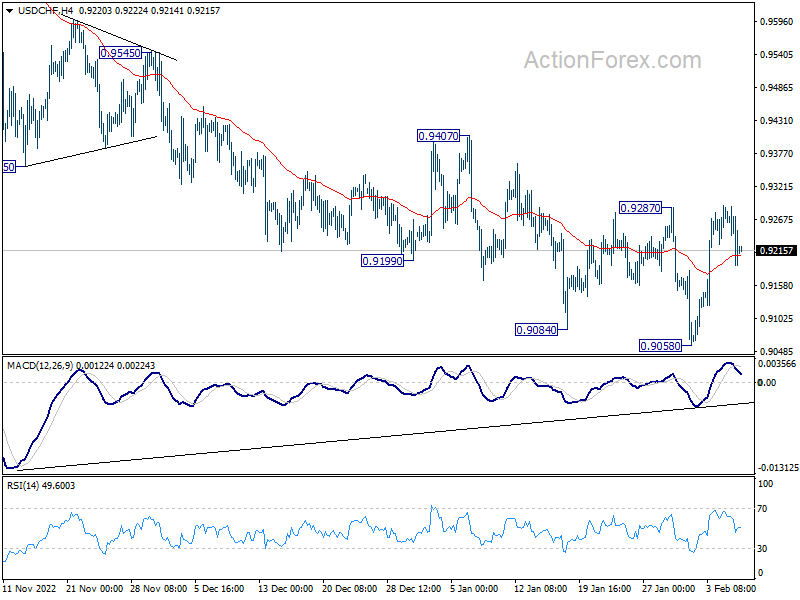
Intraday bias in USD/CHF remains neutral at this point. On the upside, firm break of 0.9287 resistance will confirm short term bottoming at 0.9058, and bring stronger rise to 0.9407 resistance. On the downside, however, sustained break of 0.9058 will resume larger decline from 1.0146 instead.
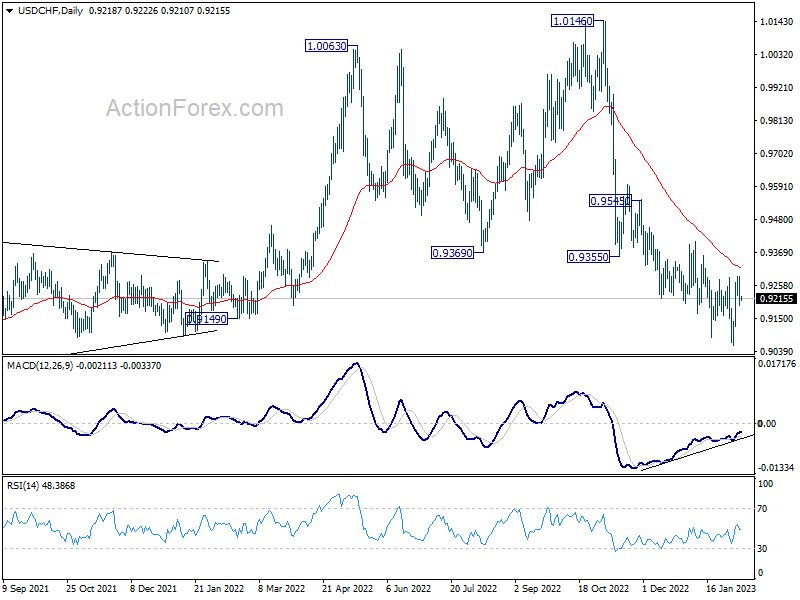
In the bigger picture, rise from 0.8756 (2021 low) has completed at 1.0146, well ahead of 1.0342 long term resistance (2016 high). Based on current downside momentum, fall from 1.0146 should be a medium term down trend itself. Next target is a test on 0.8756 low. Strong support should be seen there to bring rebound. Still, further decline will now be expected as long as 0.9407 resistance holds, in any case.
GBP/USD Daily Outlook
Daily Pivots: (S1) 1.1975; (P) 1.2035; (R1) 1.2109; More...
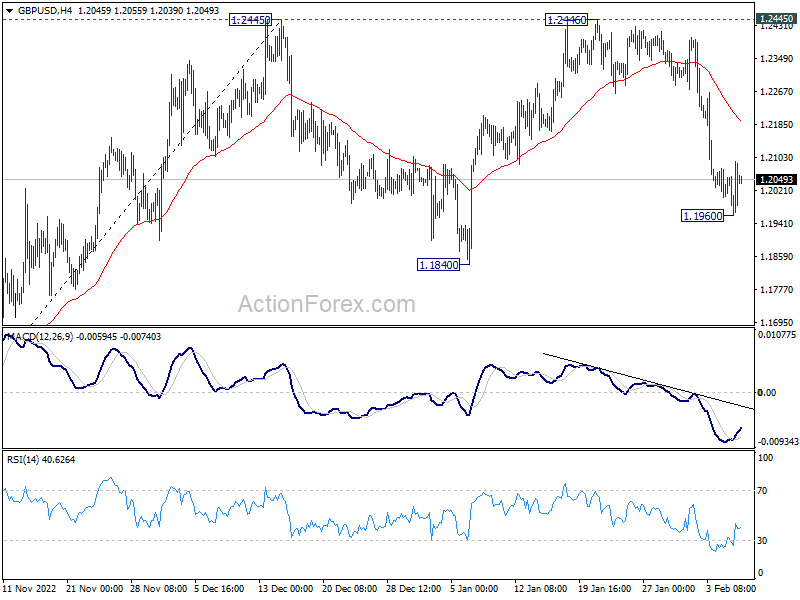
Intraday bias in GBP/USD is turned neutral with 4 hour MACD crossed above signal line. Fall from 1.2446, as the third leg of the corrective pattern from 1.2445, could still extend lower. Below 1.1960 will target 1.1840 support and possibly below. But downside should be contained by 38.2% retracement of 1.0351 to 1.2445 at 1.1645 to bring rebound. On the upside, firm break of 4 hour 55 EMA (now at 1.2192) will bring retest of 1.2445/6.
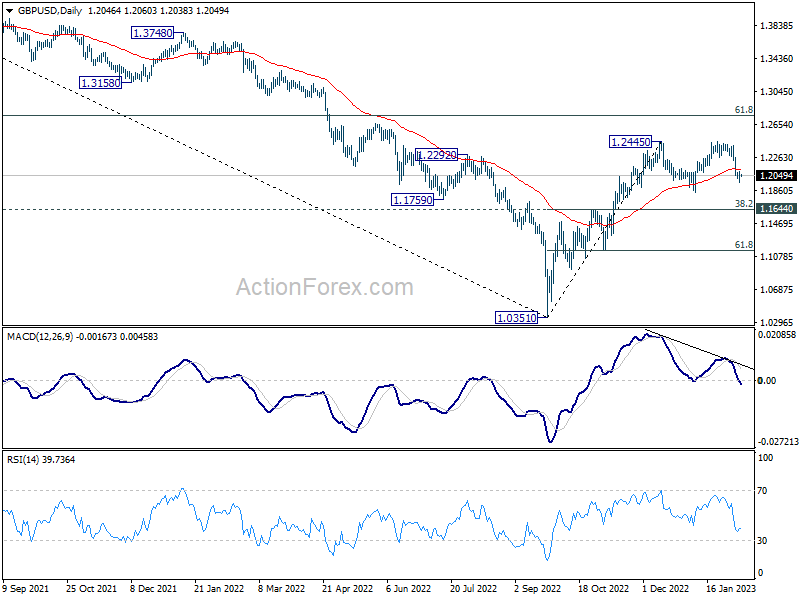
In the bigger picture, rise from 1.0351 medium term bottom is at least correcting whole down trend from 1.4248 (2021 high). Further rise is expected as long as 1.1644 resistance turned support holds. Next target is 61.8% retracement of 1.4248 to 1.0351 at 1.2759. Sustained break there will pave the way back to 1.4248.
EUR/USD Daily Outlook
Daily Pivots: (S1) 1.0676; (P) 1.0721; (R1) 1.0773; More...
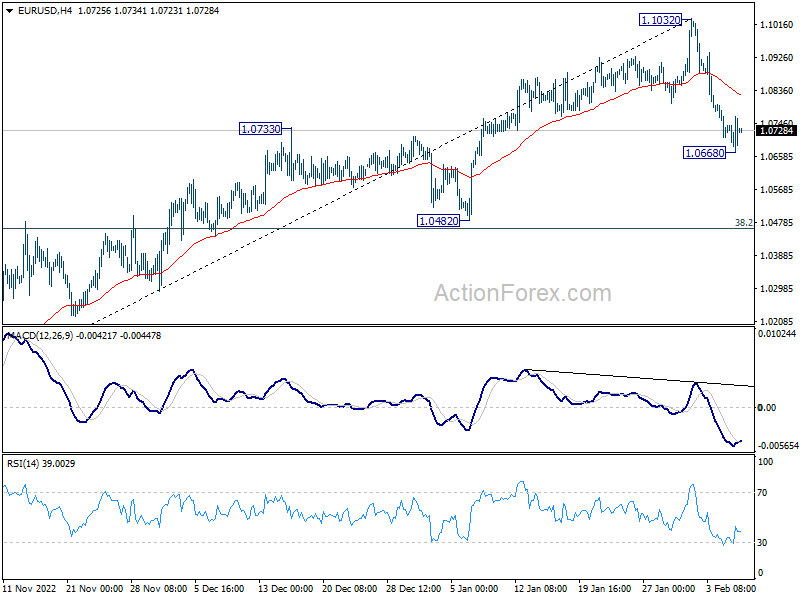
Intraday bias in EUR/USD is turned neutral with 4 hour MACD crossed above signal line, and some consolidations could be seen. Correction from 1.1032 short term top could still extend lower. Break of 1.0668 will target 38.2% retracement of 0.9534 to 1.1032 at 1.0463. Nevertheless, firm break of 4 hour 55 EMA (now at 1.0822) will bring retest of 1.1032 high instead.
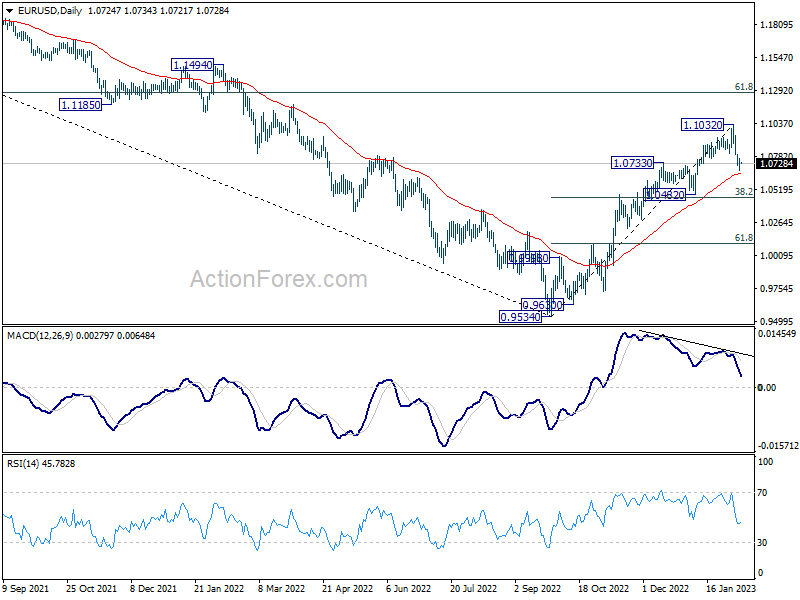
In the bigger picture, current development suggests that the rally from 0.9534 low (2022 low) is a medium term up trend rather than a correction. Further rise is in favor to 61.8% retracement of 1.2348 (2021 high) to 0.9534 at 1.1273 next. This will remain the favored case as long as 1.0482 support holds.
Dollar Turned Softer after Fed Powell, Euro and Sterling Staying Weak
Dollar is slightly on the softer side in Asian session today. Fed Chair Jerome Powell's affirmed the markets overnight that disinflation process has started. The comments give risk sentiment a lift and pulled the greenback lower. It remains to be seen if Dollar is just digesting the near term gains or topping. Some more time is needed for it to reveal the path. As for the week, Aussie is currently the strongest one, followed by Swiss France and then Canadian. Euro is the worst performer, followed by Sterling, as both was pressured by selling against Swissy. Dollar is mixed in between.
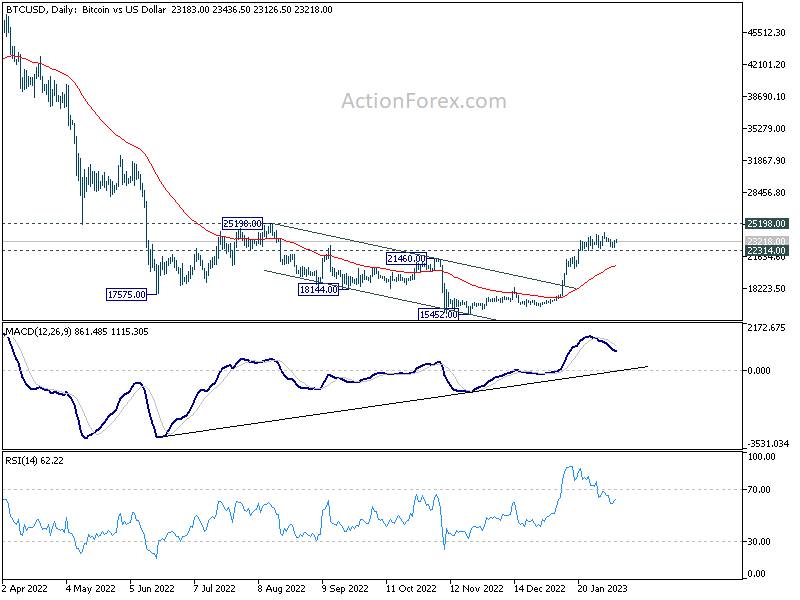
Technically, Bitcoin's rebound from 15452 halted after hitting 24245 and turned into sideway trading. For now, further rally is in favor as long as 22314 support holds. Yet, the real test lies in 25198 resistance. It's probably just a matter of topping after one more surge, or having topped. The development in Bitcoin would be used as a gauge on broader risk sentiment, in particular NASDAQ. That would in turn affect Dollar's next move.
In Asia, at the time of writing, Nikkei is down -0.40%. Hong Kong HSI is down -0.03%. China Shanghai SSE is down -0.21%. Singapore Strait Times is up 0.23%. Japan 10-year JGB yield is up 0.0007 at 0.496. Overnight, DOW rose 0.78%. S&P 500 rose 1.29%. NASDAQ rose 1.90%. 10-year yield rose 0.040 to 3.674.
Fed Powell: Disinflationary process has begun, but still a long way to go
Fed Chair Jerome Powell reiterated yesterday, "The disinflationary process, the process of getting inflation down, has begun and it's begun in the goods sector. But it has a long way to go. These are the very early stages of disinflation."
Regarding last week's surprisingly strong non-farm payroll data, Powell said, "it is good that we have seen a very strong labor market", and "we didn't expect it to be this strong."
But he declined to comment directly on whether the job data would affect the 25bps hike path. Powell said the data "shows you why this will be a process that takes a significant period of time," when it comes to tightening monetary policy.
ECB Schnabel: Monetary policy not having impact on inflation as hoped
ECB Executive Board member Isabel Schnabel said yesterday, "you can't say that monetary policy is having such an impact that we can hope for inflation to reach our 2% target in the medium term."
"We'll closely look at what's happening on labor markets, what's happening to investments, how the economy develops overall," she added.
"We have to ask ourselves is for how long we need to stay in restrictive territory," Schnabel said. "It'll depend on whether we have robust evidence that inflation, and especially underlying inflation, is converging back to our 2% target and stabilizes there."
BoC Macklem: Tightening pause announced is a conditional pause
BoC Governor Tiff Macklem said in a speech that "recent developments have reinforced our confidence that inflation is coming down." The bank expects CPI to fall to around 3% in the middle of 2023, and the reach 2% target in 2024. But, "if those things don't happen, inflation won't come back to our 2% target, and additional monetary tightening will be required."
Macklem noted that the tightening pause as announced in January was "conditional". He said, "it is conditional on economic developments evolving broadly in line with the outlook published in January."
"The transmission mechanism takes time—typically we don't see the full effects of changes in our overnight rate for 18 to 24 months. That's why policy needs to be forward looking," he explained. "In other words, we shouldn't keep raising rates until inflation is back to 2%. Instead, we need to pause rate hikes before we slow the economy and inflation too much. And that is what we are doing now."
"If new evidence begins to accumulate that inflation is not declining in line with our forecast, we are prepared to raise our policy rate further," he said. "But if new data are broadly in line with our forecast and inflation comes down as predicted, then we won't need to raise rates further."
EUR/USD Daily Outlook
Daily Pivots: (S1) 1.0676; (P) 1.0721; (R1) 1.0773; More...
Intraday bias in EUR/USD is turned neutral with 4 hour MACD crossed above signal line, and some consolidations could be seen. Correction from 1.1032 short term top could still extend lower. Break of 1.0668 will target 38.2% retracement of 0.9534 to 1.1032 at 1.0463. Nevertheless, firm break of 4 hour 55 EMA (now at 1.0822) will bring retest of 1.1032 high instead.
In the bigger picture, current development suggests that the rally from 0.9534 low (2022 low) is a medium term up trend rather than a correction. Further rise is in favor to 61.8% retracement of 1.2348 (2021 high) to 0.9534 at 1.1273 next. This will remain the favored case as long as 1.0482 support holds.
Economic Indicators Update
| GMT | Ccy | Events | Actual | Forecast | Previous | Revised |
|---|---|---|---|---|---|---|
| 23:50 | JPY | Bank Lending Y/Y Jan | 3.10% | 2.60% | 2.70% | |
| 23:50 | JPY | Current Account (JPY) Dec | 1.18T | 1.25T | 1.92T | |
| 05:00 | JPY | Eco Watchers Survey: Current Jan | 48.1 | 47.9 | ||
| 15:00 | USD | Wholesale Inventories Dec F | 0.10% | 0.10% | ||
| 15:30 | USD | Crude Oil Inventories | 2.0M | 4.1M |
Fed Powell: Disinflationary process has begun, but still a long way to go
Fed Chair Jerome Powell reiterated yesterday, "The disinflationary process, the process of getting inflation down, has begun and it's begun in the goods sector. But it has a long way to go. These are the very early stages of disinflation."
Regarding last week's surprisingly strong non-farm payroll data, Powell said, "it is good that we have seen a very strong labor market", and "we didn't expect it to be this strong."
But he declined to comment directly on whether the job data would affect the 25bps hike path. Powell said the data "shows you why this will be a process that takes a significant period of time," when it comes to tightening monetary policy.
BoC Macklem: Tightening pause announced is a conditional pause
BoC Governor Tiff Macklem said in a speech that "recent developments have reinforced our confidence that inflation is coming down." The bank expects CPI to fall to around 3% in the middle of 2023, and the reach 2% target in 2024. But, "if those things don't happen, inflation won't come back to our 2% target, and additional monetary tightening will be required."
Macklem noted that the tightening pause as announced in January was "conditional". He said, "it is conditional on economic developments evolving broadly in line with the outlook published in January."
"The transmission mechanism takes time—typically we don't see the full effects of changes in our overnight rate for 18 to 24 months. That's why policy needs to be forward looking," he explained. "In other words, we shouldn't keep raising rates until inflation is back to 2%. Instead, we need to pause rate hikes before we slow the economy and inflation too much. And that is what we are doing now."
"If new evidence begins to accumulate that inflation is not declining in line with our forecast, we are prepared to raise our policy rate further," he said. "But if new data are broadly in line with our forecast and inflation comes down as predicted, then we won't need to raise rates further."
ECB Schnabel: Monetary policy not having impact on inflation as hoped
ECB Executive Board member Isabel Schnabel said yesterday, "you can't say that monetary policy is having such an impact that we can hope for inflation to reach our 2% target in the medium term."
"We'll closely look at what's happening on labor markets, what's happening to investments, how the economy develops overall," she added.
"We have to ask ourselves is for how long we need to stay in restrictive territory," Schnabel said. "It'll depend on whether we have robust evidence that inflation, and especially underlying inflation, is converging back to our 2% target and stabilizes there."
Crude Oil Price Could Recover If It Clears This Hurdle
Key Highlights
- Crude oil price is facing resistance near the $76.50 zone.
- A connecting bearish trend line is forming with resistance near $76.10 on the 4-hours chart.
- Gold price is consolidating losses above the $1,850 support zone.
- EUR/USD extended its decline below the 1.0750 support.
Crude Oil Price Technical Analysis
Crude oil price started a strong decline from the $82.40 resistance against the US Dollar. The price declined below the $78.00 support to move into a bearish zone.
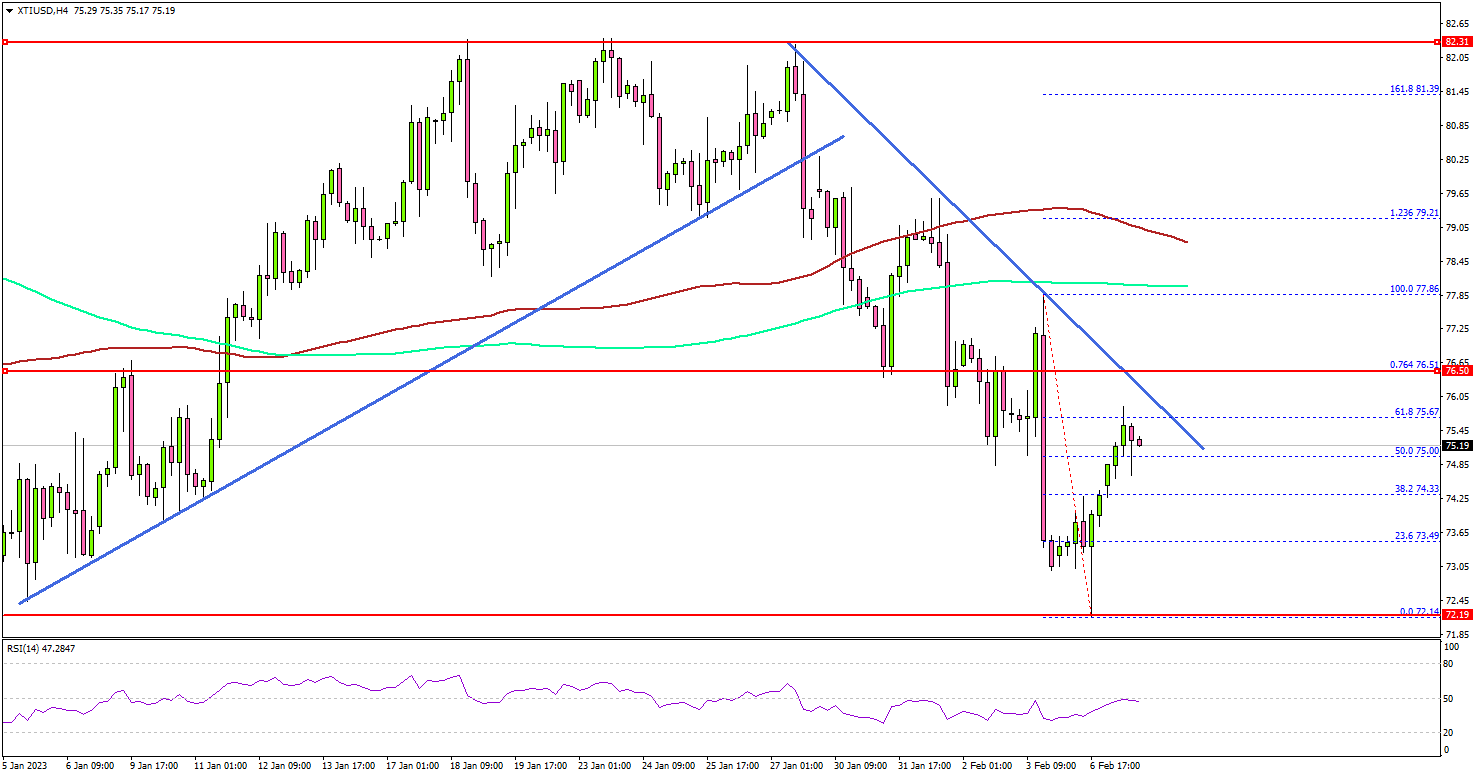
Looking at the 4-hours chart of XTI/USD, the price traded below a major bullish trend line. It even settled below the $76.50 support, the 100 simple moving average (red, 4-hours) and the 200 simple moving average (green, 4-hours).
Finally, the bulls appeared near the $72.00 support. A low was formed near $72.14 before the price started an upside correction.
On the upside, the price is facing resistance near the $76.00 zone. The next major resistance is near the $76.50 zone. A clear move above the $76.50 resistance could open the doors for another steady increase towards $78 or even $80.
If not, the price might drop again from $76. An immediate support is now forming near the $74 zone. The next major support sits near the $73.50 level. Any more losses might call for a test of the $72.40 support zone in the coming days.
Looking at gold price, the bulls are trying to protect the $1,850 support zone and they might aim a recovery wave in the coming days.
Economic Releases to Watch Today
- Fed's Williams speech.
- Fed's Waller speech.
BTC/USD: Forecasting Elliott Wave ((iv)) Correction In Bitcoin
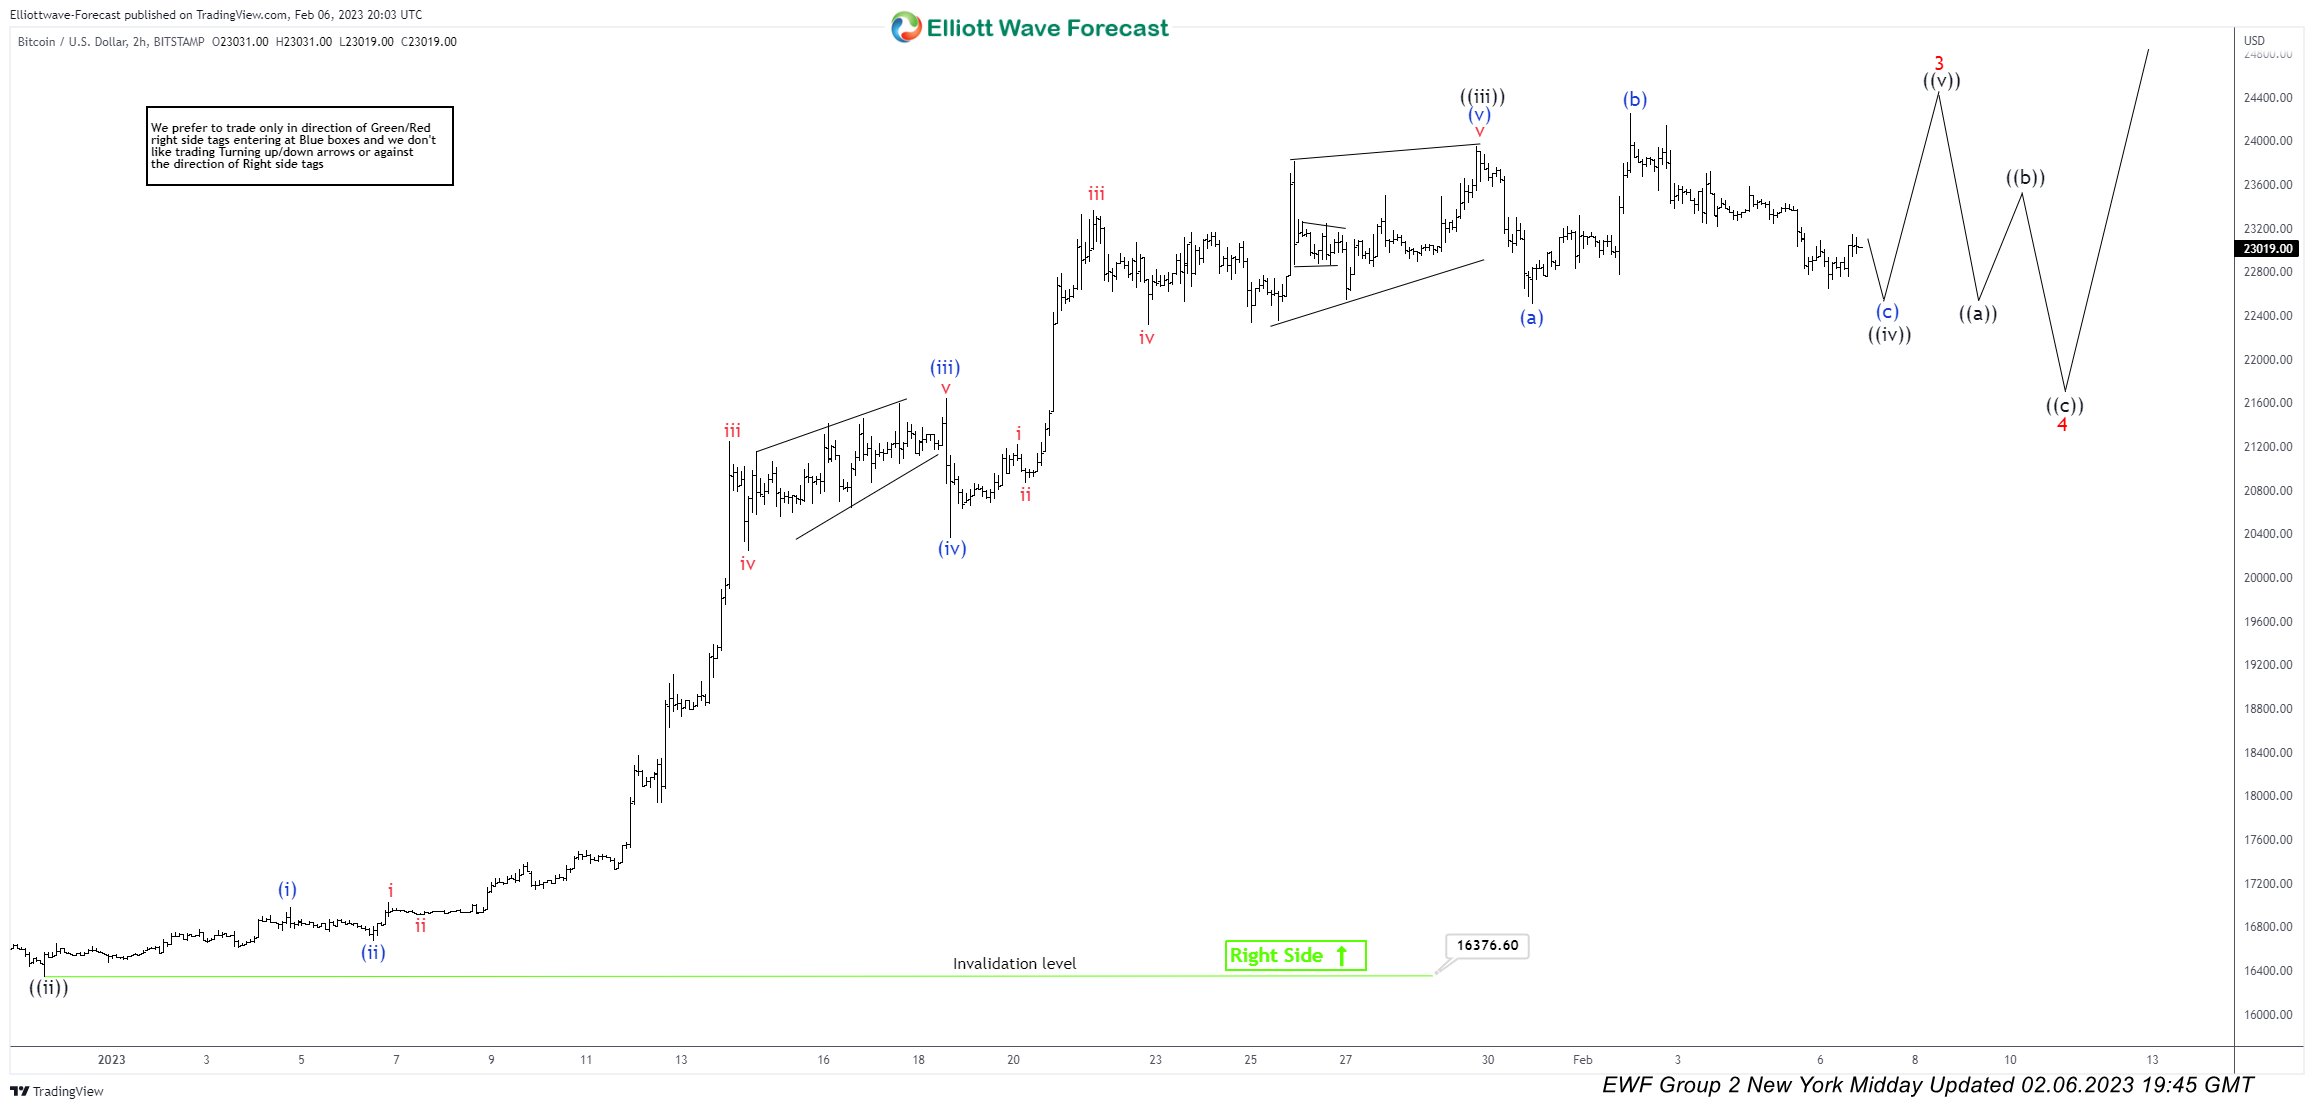
Hello Traders, in this article we will have a look on BTC/USD. You will see how we were able to forecast in advance the upcoming wave ((iv)) correction. Bitcoin is trading within a larger degree cycle that started from 11.21.2022. Current cycle appears to be within extended wave 3. Inside our members area we cover also 4 hour, Daily & Weekly charts. That will give you also a bigger context as where we stand in the cycle. Moreover, as day trading or position trading can be applied when trading our charts it is important for a trader to know and understand when the market is approaching a reaction point within a cycle. This can help with making better decisions as whether is good to take profits, move stop loss, enter trades etc.
Firstly, let’s have a look on BTC/USD from 01.24.2023
BTC/USD 2H Chart 01.24.2023
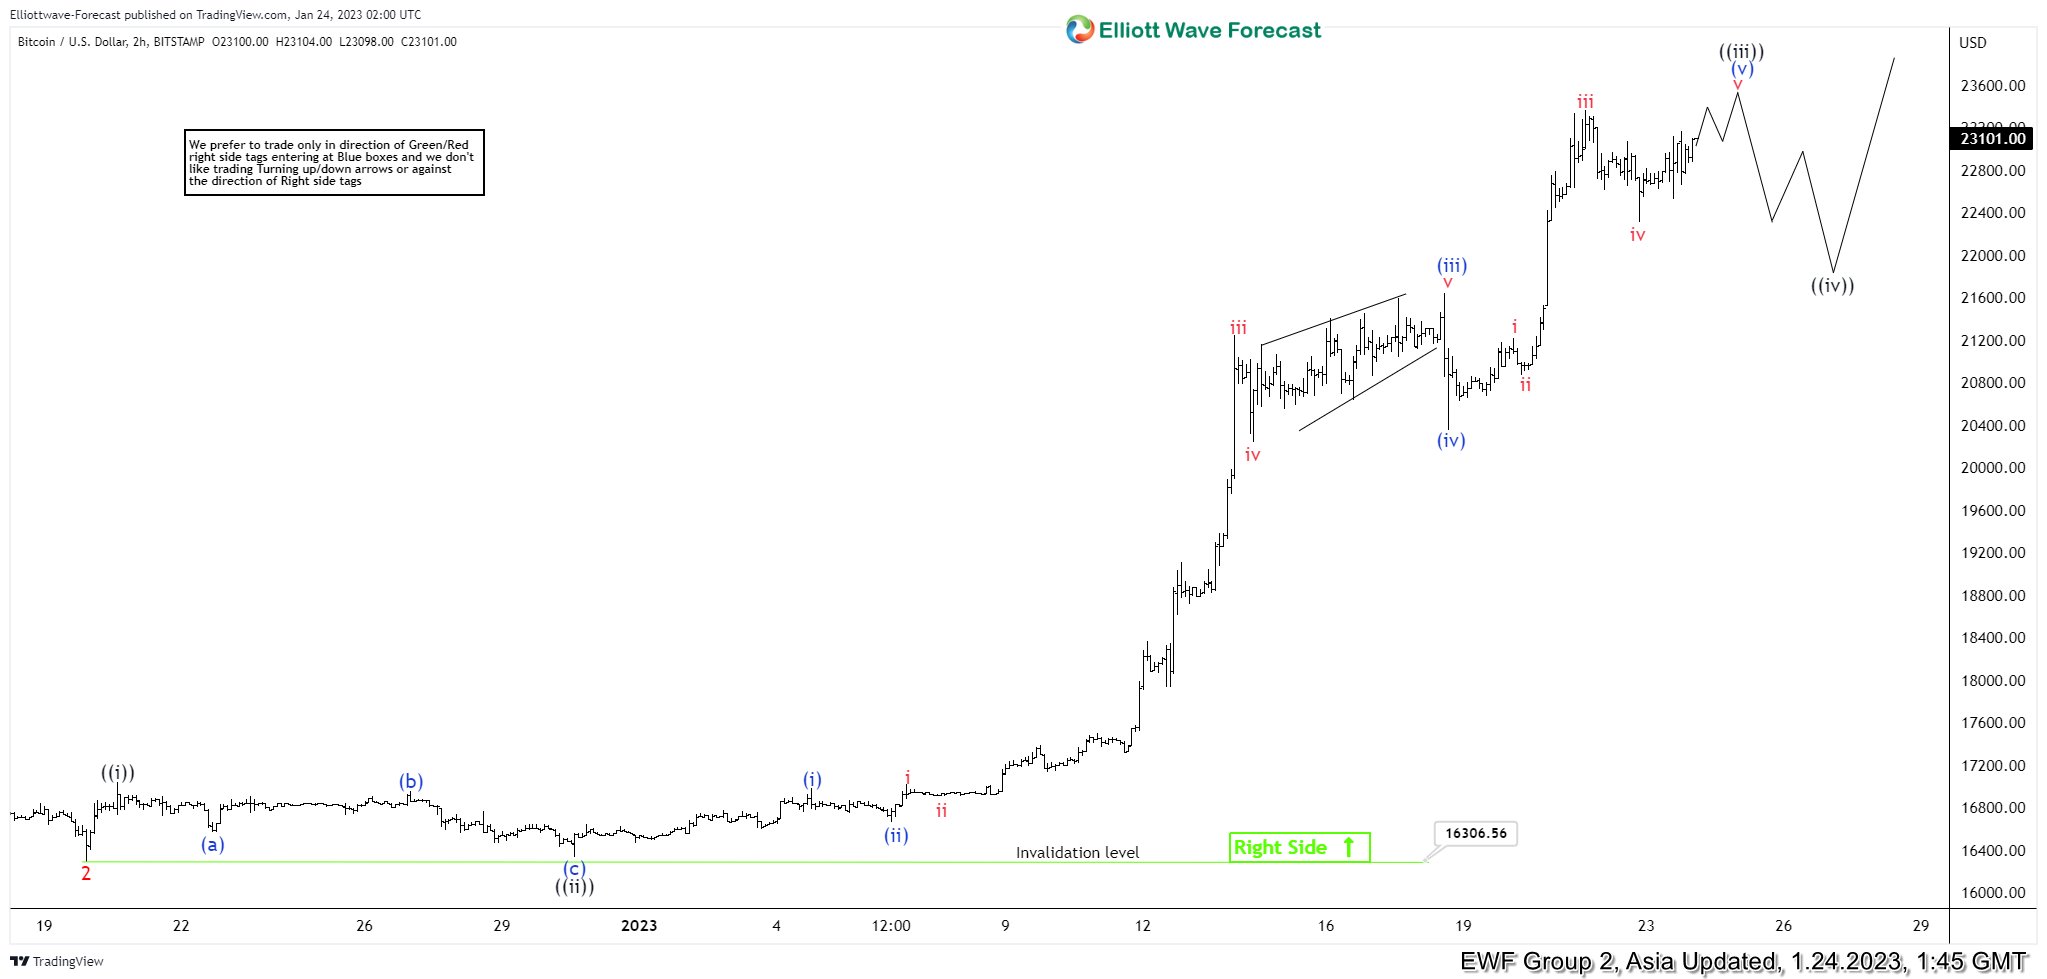
Bitcoin has been trading higher in a wave ((iii)). However, It had created a nest and was trading higher within v of (v) of ((iii)). At that point the market was getting closer to the end of wave ((iii)) and soon was expected to pullback in ((iv)).
Fast forward, a couple of days later here is what happened.
BTC/USD 2H Chart 02.06.2023
Bitcoin has ended as expected wave ((iii)) and pullback in ((iv)) played out as a flat correction within wave ((iv)). Soon it expected to make the next and final move higher in ((v)) to end wave 3 in red. By having the information and expected path beforehand in mind traders can make better decisions with their trades. This is one of the many advantages and benefits members get at Elliott Wave Forecast. Apart from the charts you can see Daily technical videos, Live Analysis sessions in which you can ask questions in real time. Live trading room is also available in which we discuss trading ideas using our system. Learn to trade the right side and anticipate the next move in the market today.