
Sample Category Title
GBP/JPY Daily Outlook
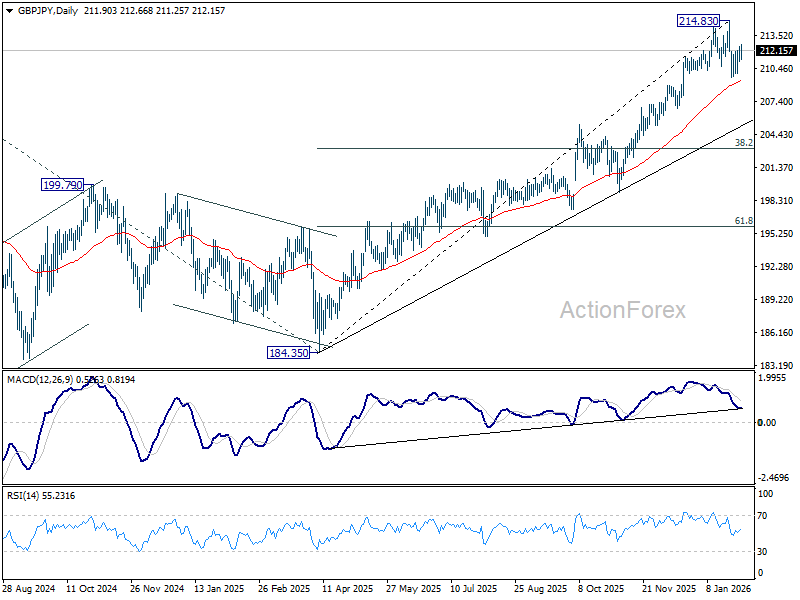
Daily Pivots: (S1) 211.07; (P) 211.78; (R1) 212.53; More...
Consolations continues in GBP/JPY and intraday bias stays neutral. Risk will stay on the downside as long as 214.83 holds, even in case of strong recovery. Below 209.61, and sustained break of 55 D EMA (now at 209.27) will argue that it's correcting whole rise from 184.35 and target 38.2% retracement of 184.35 to 214.83 at 203.18.
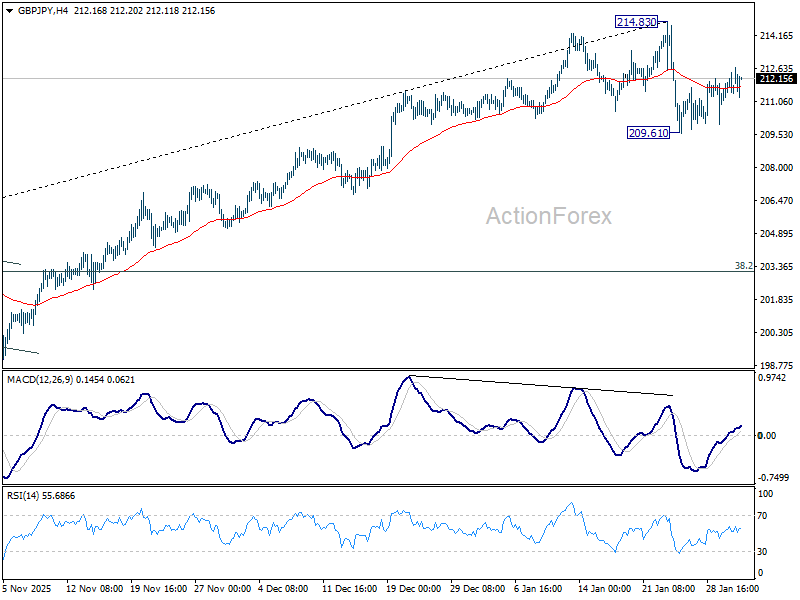
In the bigger picture, up trend from 123.94 (2020 low) is in progress. Next target is 61.8% projection of 148.93 (2022 low) to 208.09 (2024 high) from 184.35 at 220.90. On the downside, break of 205.30 resistance turned support is needed to indicate medium term topping. Otherwise, outlook will stay bullish even in case of deep pullback.
EUR/JPY Daily Outlook
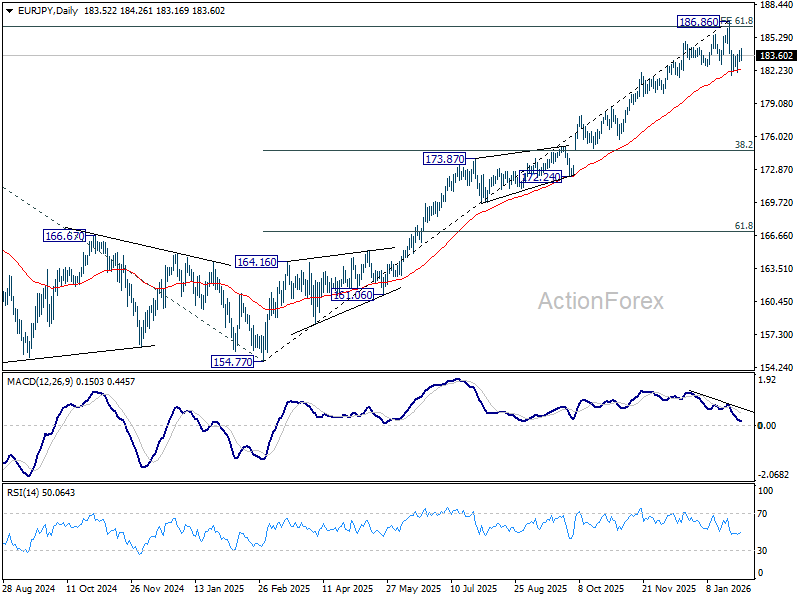
Daily Pivots: (S1) 182.78; (P) 183.42; (R1) 184.06; More...
EUR/JPY is staying in consolidations above 181.76 and intraday bias stays neutral. Risk remains on the downside as long as 186.86 holds, in case of strong recovery. Break of 181.76 and sustained trading below 55 D EMA (now at 182.31) should solidify the case that fall from 186.86 medium term top is correcting whole rise from 154.77. Deeper decline should then be seen to 38.2% retracement of 154.77 to 186.86 at 174.60.
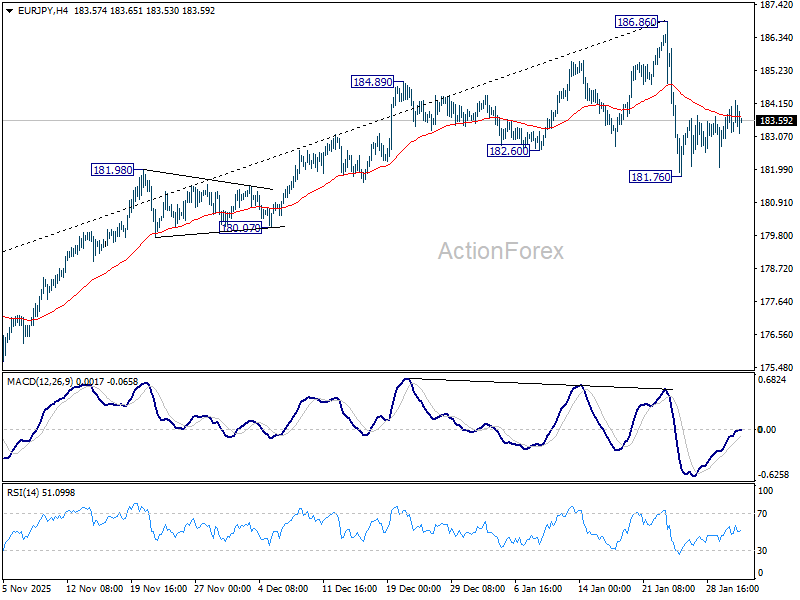
In the bigger picture, up trend from 114.42 (2020 low) is in progress and and met 61.8% projection of 124.37 to 175.41 from 154.77 at 186.31. Considering bearish divergence condition in D MACD, upside could be capped by 186.31 on first attempt. Still, outlook will stay bullish as long as 55 W EMA (now at 173.32) holds, even in case of deep pullback. Sustained break of 186.31 will pave the way to 78.6% projection at 194.88 next.
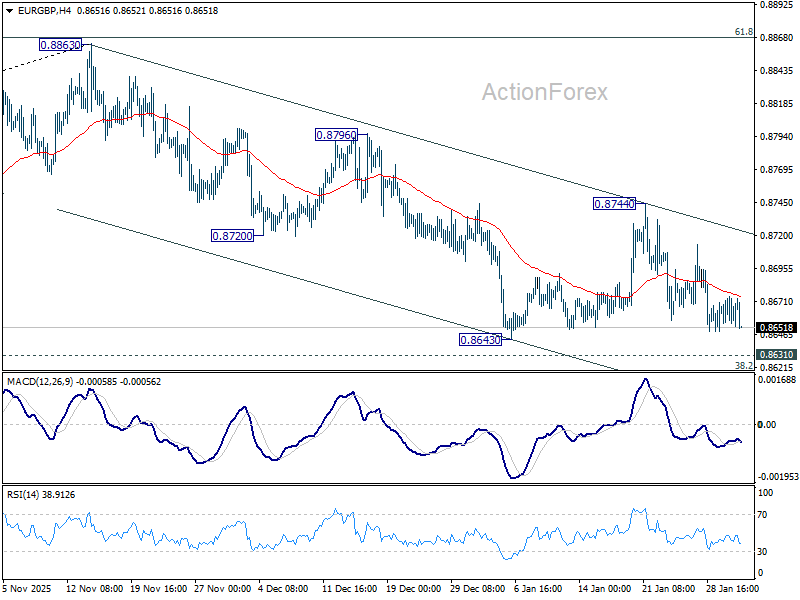
EUR/GBP Daily Outlook
Daily Pivots: (S1) 0.8655; (P) 0.8663; (R1) 0.8676; More…
Intraday bias in EUR/GBP remains neutral it's still bounded in sideway trading. Risk stays on the downside with 0.8744 resistance intact. Further decline is expected to 0.8631 cluster support (38.2% retracement of 0.8221 to 0.8663 at 0.8618). Decisive break there will carry larger bearish implications and pave the way to 61.8% retracement at 0.8466.
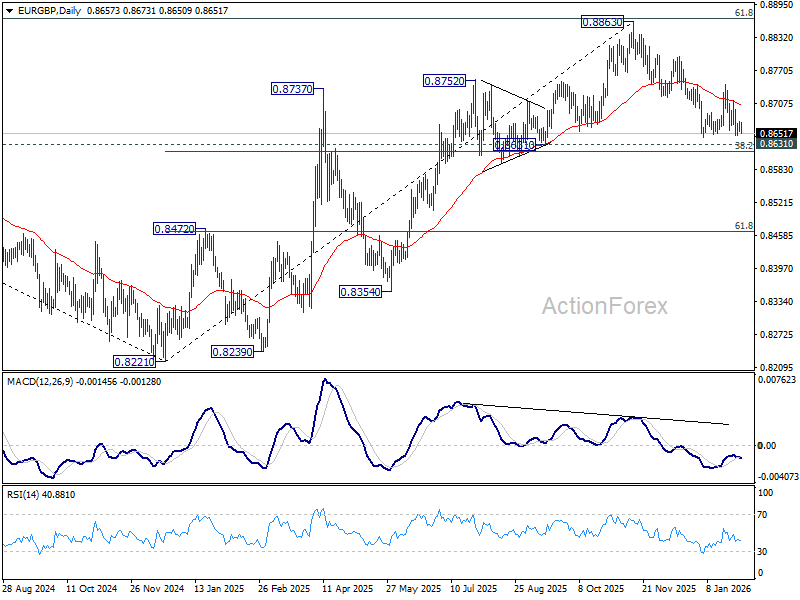
In the bigger picture, rise from 0.8221 medium term bottom (2024 low) is seen as a corrective move. Upside should be limited by 61.8% retracement of 0.9267 to 0.8221 at 0.8867. Sustained trading below 55 W EMA (now at 0.8625) should confirm that this corrective bounce has completed. In this case, deeper fall would be seen back to 0.8201/21 key support zone. However, decisive break of 0.8867 will suggest that EUR/GBP is already reversing whole decline from 0.9267 (2022 high). That should pave the way back to 0.9267.
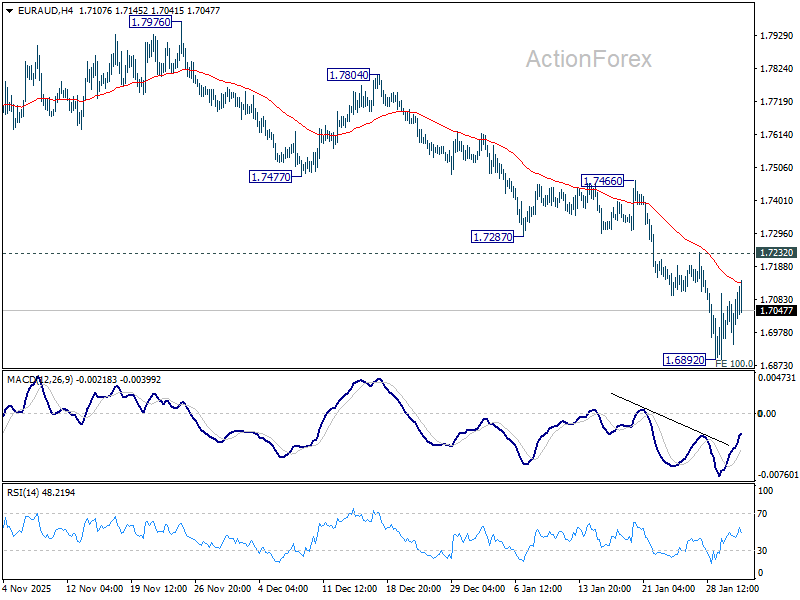
EUR/AUD Daily Outlook
Daily Pivots: (S1) 1.6947; (P) 1.7016; (R1) 1.7091; More...
Intraday bias in EUR/AUD remains neutral for the moment. On the upside, firm break of 1.7232 resistance should confirm strong support from 100% projection of 1.8554 to 1.7245 from 1.8160 at 1.6851. Intraday bias will be back to the upside for 1.7466 support and above. However, decisive break of 1.6851 will likely bring downside acceleration to 138.2% projection at 1.6351 next.
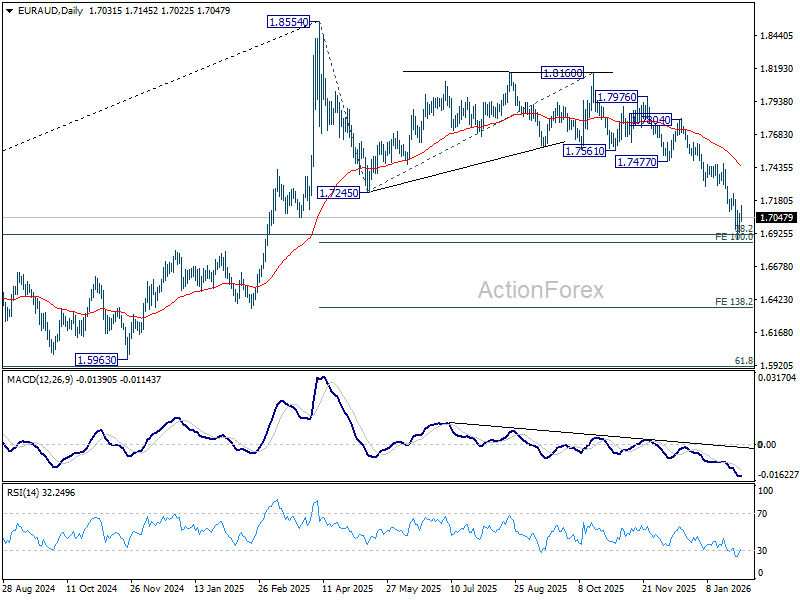
In the bigger picture, fall from 1.8554 is seen as correction to up trend from 1.4281 (2022 low). Strong support should be seen from 38.2% retracement of 1.4281 to 1.8554 at 1.6922 to bring rebound. However, risk will stay on the downside as long as 55 D EMA (now at 1.7442) holds. Sustained break of 1.6922 will raise the chance of bearish trend reversal, and target 61.8% retracement at 1.5913.
EUR/CHF Daily Outlook
Daily Pivots: (S1) 0.9144; (P) 0.9160; (R1) 0.9175; More....
EUR/CHF recovered after hitting 161.8% projection of 0.9394 to 0.9268 from 0.9347 at 0.9143 and intraday bias is turned neutral for consolidations. Upside of recovery should be limited by 0.9235 to bring another fall. Decisive break of 0.9143 will extend larger down trend to 261.8% projection at 0.9017.
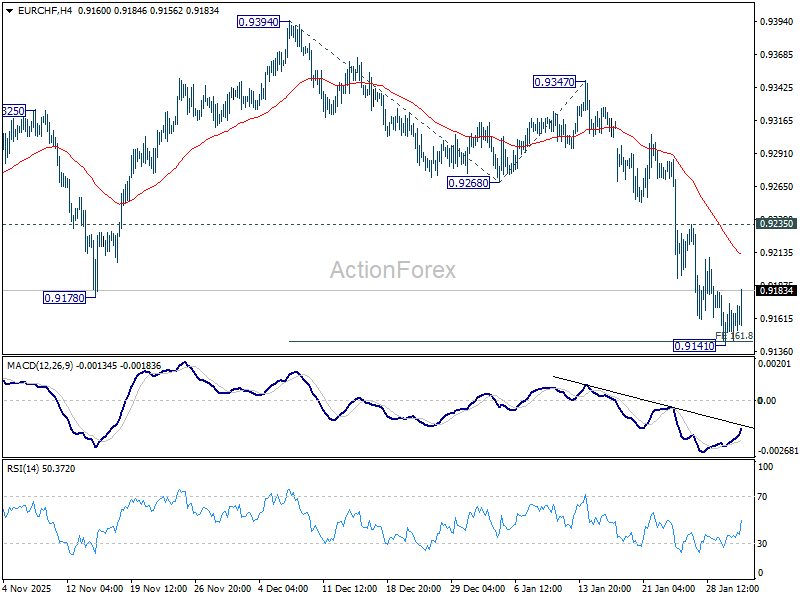
In the bigger picture, another rejection by 55 W EMA (now at 0.9350) keeps outlook bearish. Downtrend from 1.2004 (2018 high) is still in progress. Firm break of 0.9178 will target 61.8% projection of 1.1149 to 0.9407 from 0.9928 0.8851. Outlook will stay bearish as long as 0.9394 resistance holds, in case of recovery.
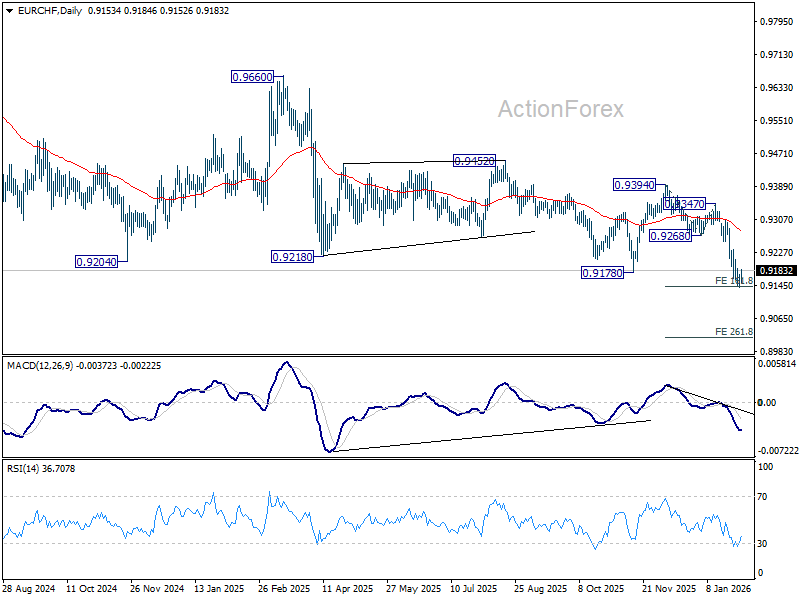
Chart Alert: Gold Extends Plunge by 9%, Approaching $4,405 Inflection Level for Potential Minor Bounce
Key takeaways
- Gold has entered a disorderly liquidation phase: Driven primarily by forced unwinding of leveraged long positions rather than a shift in Fed policy expectations.
- Margin hikes and order flows, not Fed politics, are the real catalyst: CME’s increase in gold and silver futures margin requirements sharply raised capital costs, choking off bullish risk appetite and triggering cascading sell-offs, while US 2-year yields signal no hawkish repricing.
- Near-term setup favours a tactical bounce, with clear risk levels: Gold is approaching the critical US$4,405 support, reinforced by multiple technical confluences and extreme volatility readings; a hold above this level opens scope for a minor mean-reversion rebound, while a break lower signals further downside.
The price actions of Gold (XAU/US) have staged the expected corrective decline on last Friday, 30 January 2026, to hit the second intermediate support at US$4,757 as highlighted.
The yellow precious metal printed an intraday low at US$4,679 and closed the US session at US$4,895 on Friday, 30 January 2026, recording a daily loss of 9%, its steepest drop since 1983.
Order flows are the main catalyst for the steep losses, not Kevin Warsh
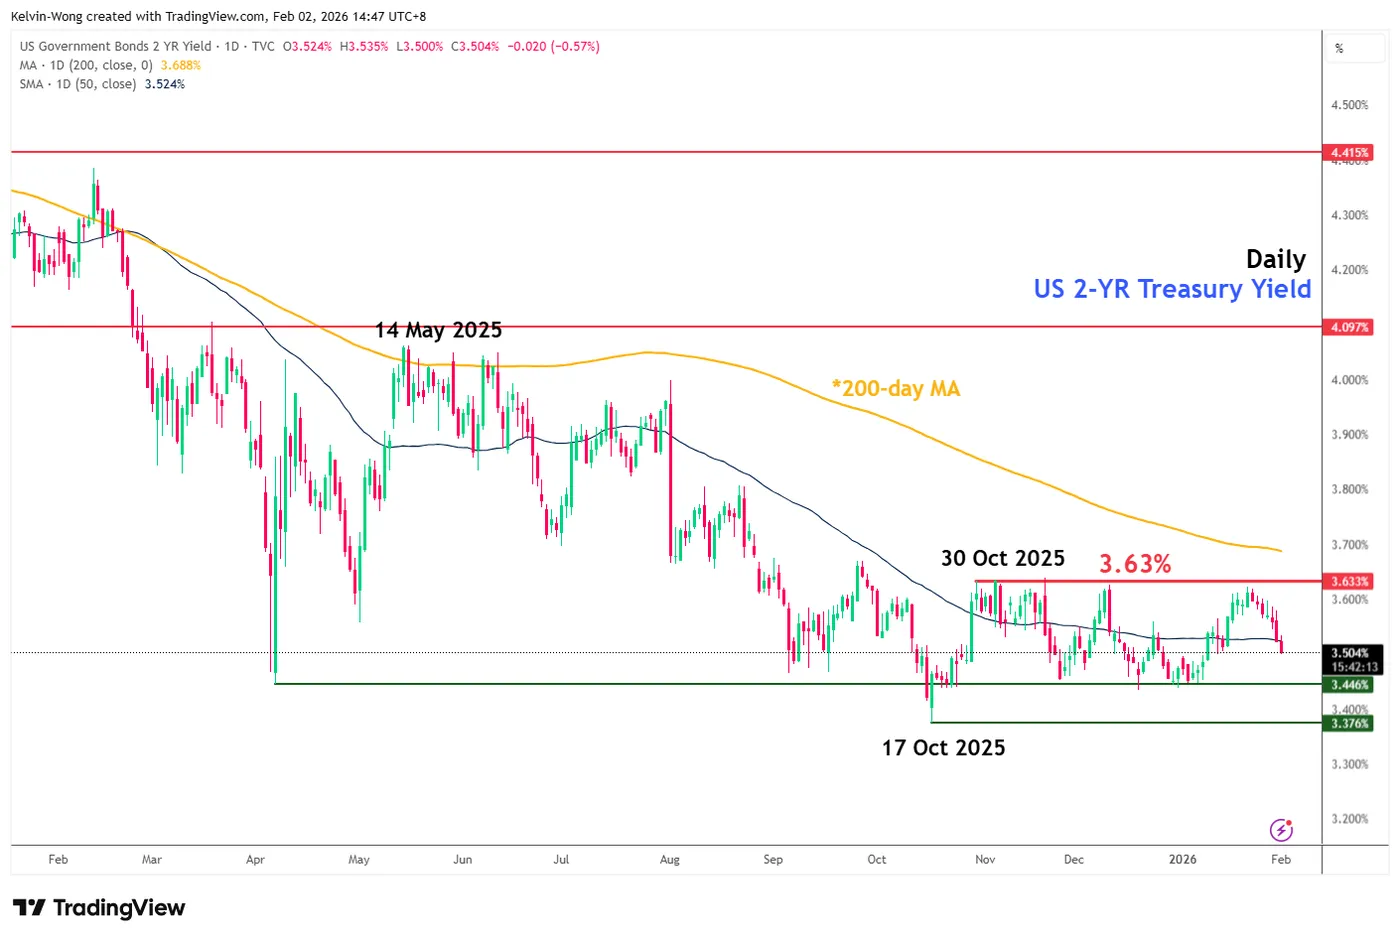
Fig. 1: 2-YR US Treasury yield medium-term trend as of 2 Feb 2026 (Source: TradingView)
Several media reports have highlighted that US President Trump’s official announcement to nominate ex-Fed governor Kevin Warsh as the new Fed Chair is likely the driver that triggered the rampant sell-off in gold and silver due to his past remarks on his preference for a smaller US Federal Reserve’s balance sheet, which may lead to an indirect tightening of liquidity conditions.
However, the US Treasury market does not imply such a narrative that “Kevin Warsh is going to be a new hawkish Fed Chair”.
The 2-year US Treasury yield, which is the most sensitive to the Fed’s monetary policy stance, did not trade higher last Friday; instead, it dropped by 4 basis points to close lower at 3.52%, and remained below the medium-term range resistance of 3.63% in place since 30 October 2025 (see Fig. 1).
In today’s Asia session, 2 February 2026, Gold (XAU/USD) has continued to extend its losses by 9% to print an intraday low of US$4.402 at the time of writing due to a hike in metal futures margins announced by CME Group over the weekend.
COMEX gold futures margins (1oz) are raised from 6 per cent to 8 per cent, while COMEX 5000 silver futures (SI) are set to increase to 15 per cent from 11 per cent.
Hence, such increases in margin requirements are likely lead to a further unwinding of speculative long positions in Gold and Silver.
Higher capital outlays to sustain or extend long positions abruptly choked off bullish risk appetite, unleashing a cascading liquidation in Gold (XAU/USD).
Let's now look at the short-term technical chart to decipher the near-term (1 to 3 days) trajectory
Short-term trend (1 to 3 days): Minor mean reversion rebound after overextended decline
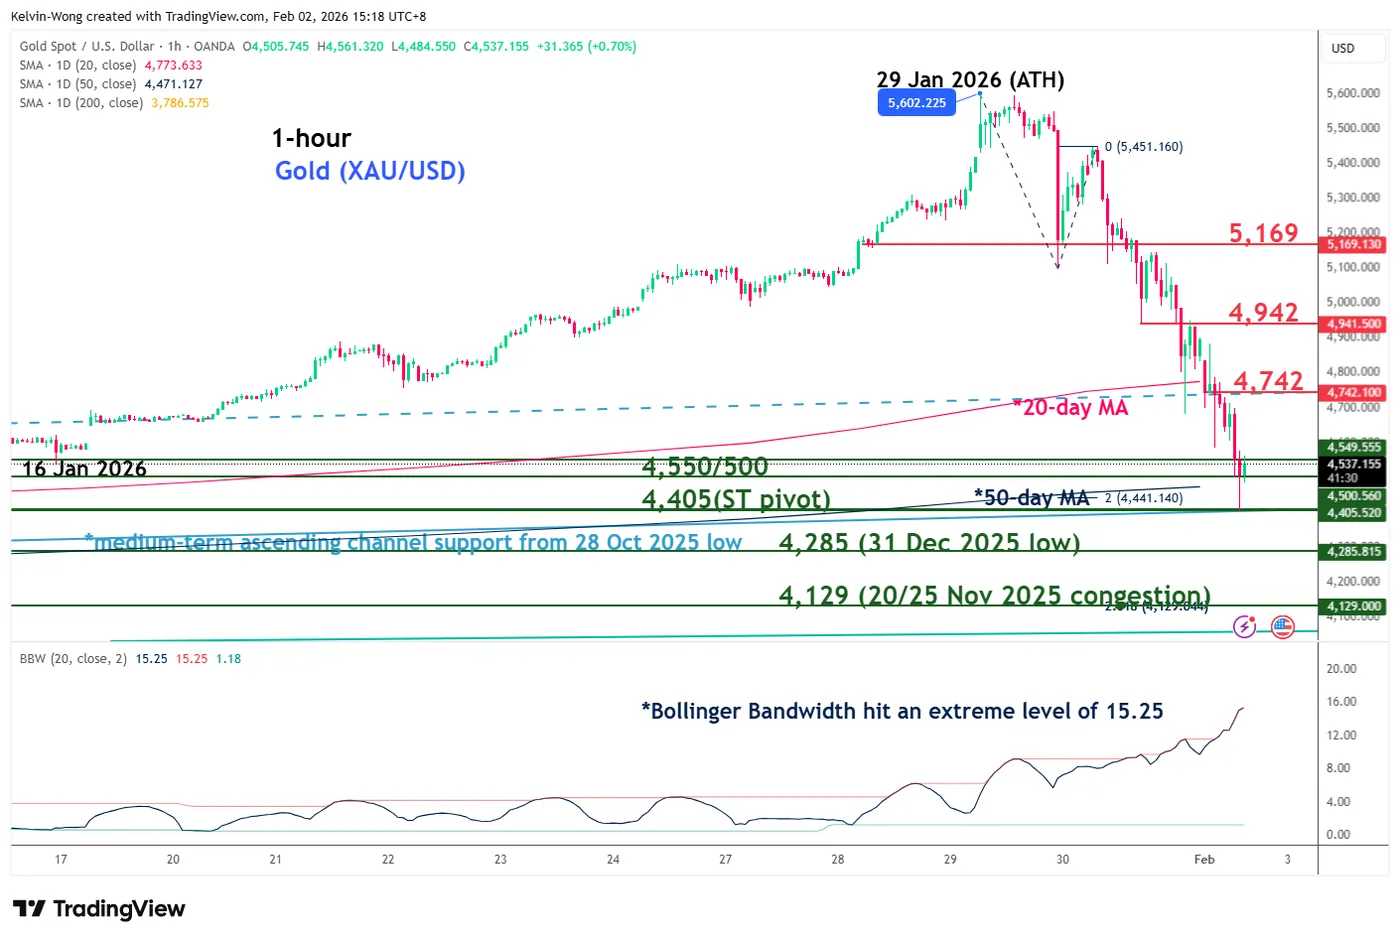
Fig. 2: Gold (XAU/USD) minor trend as of 2 Feb 2026 (Source: TradingView)
Watch the US$4,405 key short-term pivotal support on Gold (XAU/USD). A clearance above US$4,742 (also the 20-day moving average) is likely to increase the odds of a minor mean reversion rebound towards the next intermediate resistances at US$4,942 and US$5,169 (also the 61.8% Fibonacci retracement of the steep decline from 26 January 2026 all-time high to 2 February 2026 intraday low) (see Fig. 2).
However, a break and an hourly close below US$4,405 invalidates the minor bullish recovery scenario for a further extension of the corrective decline towards the next intermediate supports at US$4,285 and US$4,129.
Key elements to support the short-term bullish bias
- The US$4,405 key short-term pivotal support is defined by a confluence of different elements that point to a similar level of around US$4,405; the 50-day moving average, the lower boundary of a medium-term ascending channel from 28 October 2025, and a Fibonacci extension of the current drop, measured from the current all-time high of 29 January 2026.
- Hourly Bollinger Bandwidth has spiked to an extreme 15.25, indicating a volatility climax and suggesting the recent price sell-off is overextended in the near term.
GBP/USD Retreats From Highs As EUR/GBP Enters Holding Pattern
GBP/USD is showing positive signs above 1.3580 and 1.3620. EUR/GBP declined and is now consolidating losses below 0.8700.
Important Takeaways for GBP/USD and EUR/GBP Analysis Today
- The British Pound rallied above 1.3700 and 1.3800 before there was a pullback.
- There is a connecting bearish trend line forming with resistance at 1.3760 on the hourly chart of GBP/USD at FXOpen.
- EUR/GBP is trading in a bearish zone below the 0.8690 pivot level.
- There is a key expanding triangle forming with resistance near 0.8680 on the hourly chart at FXOpen.
GBP/USD Technical Analysis
On the hourly chart of GBP/USD at FXOpen, the pair remained well-bid above 1.3500. The British Pound started a decent increase above 1.3650 against the US Dollar.
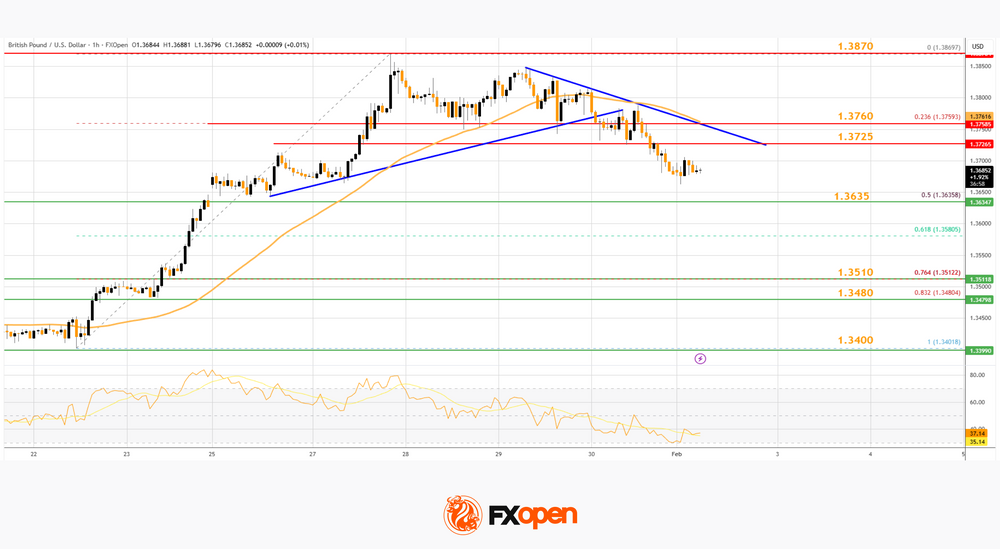
The bulls were able to push the pair above the 50-hour simple moving average and 1.3750. The pair even climbed above 1.3800 and traded as high as 1.3869. Recently, there was a pullback below 1.3760 and the 23.6% Fib retracement level of the upward move from the 1.3401 swing low to the 1.3869 high.
The pair is now consolidating below 1.3750. There is also a connecting bearish trend line forming with resistance at 1.3760. On the upside, the GBP/USD chart indicates that the pair is facing resistance near 1.3725.
The next hurdle for the bulls could be 1.3760. A close above 1.3760 could open the doors for a move toward 1.3870. Any more gains might send GBP/USD toward 1.4000.
On the downside, the bulls might remain active near the 50% Fib retracement at 1.3635. If there is a downside break below 1.3635, the pair could accelerate lower. The first major support is at 1.3510, below which the pair could test 1.3480.
The next key area for the bulls could be 1.3400, below which the pair could test 1.3320. Any more losses could lead the pair toward 1.3250.
EUR/GBP Technical Analysis
On the hourly chart of EUR/GBP at FXOpen, the pair started a steady decline from well above 0.8725. The Euro traded below 0.8690 against the British Pound.
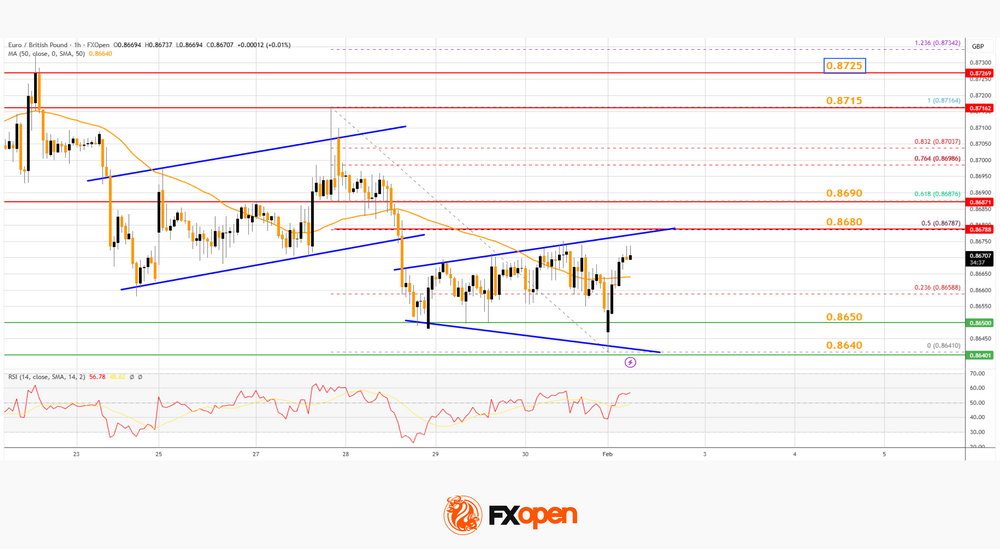
The EUR/GBP chart suggests that the pair even declined below 0.8660 and the 50-hour simple moving average. A low was formed at 0.8641, and the pair is now consolidating losses. There was a move above 0.8650 and the 23.6% Fib retracement level of the downward move from the 0.8716 swing high to the 0.8641 low.
The pair is now facing resistance near a key expanding triangle at 0.8680 and the 50% Fib retracement. The next major barrier for the bulls could be 0.8690.
A close above 0.8690 might accelerate gains. In the stated case, the bulls may perhaps aim for a test of 0.8715. Any more gains might send the pair toward the 0.8725 pivot.
Immediate support sits near 0.8650. The first key zone sits at 0.8640. A downside break below 0.8640 might call for more downsides. In the stated case, the pair could drop toward 0.8600.
Trade over 50 forex markets 24 hours a day with FXOpen. Take advantage of low commissions, deep liquidity, and spreads from 0.0 pips (additional fees may apply). Open your FXOpen account now or learn more about trading forex with FXOpen.
This article represents the opinion of the Companies operating under the FXOpen brand only. It is not to be construed as an offer, solicitation, or recommendation with respect to products and services provided by the Companies operating under the FXOpen brand, nor is it to be considered financial advice.
Bitcoin Breaks Key Support Level
In our 21 January note, titled “Bitcoin Falls Below $90k: Why Does It Matter?”, we confirmed the relevance of a system of two trend channels and highlighted that the price was sitting at the lower boundary of a long-term ascending channel, which had previously acted as strong support in 2025.
In that analysis, we:
→ examined the fundamental drivers behind the price decline;
→ identified a series of bearish signals reflected in BTC/USD price swings;
→ pointed to persistent selling pressure and a growing risk of a support break.
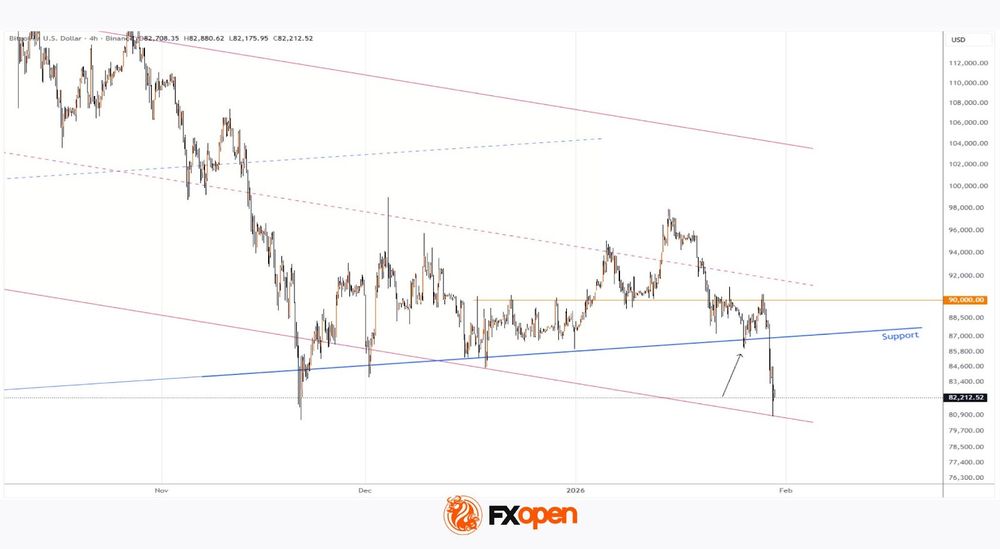
As the Bitcoin price chart shows since then:
→ the lower boundary proved its role as support once more, triggering a rebound (marked by an arrow) on 25–26 January;
→ however, bullish momentum only carried the price up to the psychological $90k level, which acted as resistance on 28 January.
Following this, Bitcoin began to move lower. During the decline, the price successfully broke the key support level, with accelerating downward momentum in BTC/USD confirming that the support had lost its strength.
The lower boundary of the red channel may still act as support, while a potential break below November’s low could trigger panic. In the coming days, a local recovery toward the red channel’s median is possible, especially after signs of oversold conditions.
Overall, the long-term ascending channel on the BTC/USD chart is losing relevance, while the descending trend is becoming increasingly dominant.
FXOpen offers the world's most popular cryptocurrency CFDs*, including Bitcoin and Ethereum. Floating spreads, 1:2 leverage — at your service (additional fees may apply). Open your trading account now or learn more about crypto CFD trading with FXOpen.
*Important: At FXOpen UK, Cryptocurrency trading via CFDs is only available to our Professional clients. They are not available for trading by Retail clients. To find out more information about how this may affect you, please get in touch with our team.
This article represents the opinion of the Companies operating under the FXOpen brand only. It is not to be construed as an offer, solicitation, or recommendation with respect to products and services provided by the Companies operating under the FXOpen brand, nor is it to be considered financial advice.
Data Probably Have to be Very Weak for Fed to Leave Wait-and-See Bias
Markets
Going into the weekend, market dominos fell in place for an overdue correction on a stretched metals/USD debasement trade. It’s not clear what domino piece went down first. Gold, silver but also copper already showed signs of vertigo on Thursday. The dollar rebound was at that time still limited, but the greenback gained traction on Friday. The announcement of Kevin Warsh to be the new Fed chair also helped the correction. It removed uncertainty and the new Fed governor maybe isn’t a bad choice concerning the debate on Fed independence. Whatever the trigger, metals including gold, silver copper and others fell prey to profit taking. The mirroring image was a rebound of the dollar. DXY closed the week at 97.00, to be compared with a 95.55 low on Tuesday. EUR/USD closed at 1.1855, returning below the previous top of 1.1919. The correction in safe havens like gold and silver didn’t help US equities. The Nasdaq lost 0.94%. US interest rate markets don’t draw any firm conclusions on Fed policy after Warsh’s appointment. The US yield curve steepened slightly (2-y: -3.7 bp; 30-y: +2 bps). German yields changed less than one bp even as some national inflation data (Spain, Germany) printed slightly higher than expected.
Friday’s correction in commodities (gold, silver, copper, oil) but also equities continues this morning. The dollar maintains most of last week’s gain, but the rebound slows. Commodity-related currencies (AUD, NOK) are ceding ground. The fate of this repositioning remains the focus for global trading at the start of the week. However markets this week also get the usual US economic update, to begin with the manufacturing ISM (today), JOLTS job openings (tomorrow), ADP job growth and services ISM (Wed) and the payrolls on Friday. Data might (or might not) validate the Fed’s view that the economy is growing at a solid pace and that the labour market stabilizes. Data probably have to be very weak for the Fed to leave its wait-and-see bias. Warsh looking over Powell’s shoulder won’t change that. Last week’s better than expected EMU growth data and national inflation data also suggest the ECB can consider itself being in a good place to watch and see. At Thursday’s ECB meeting, markets probably will look for the ECB’s assessment on recent (geopolitical) turmoil, including the impact of a weaker dollar/stronger euro. We also keep an eye at the policy meetings of the likes of the Czech National bank, the National Bank of Poland and the Reserve Bank of Australia. The CNB will likely keep its policy rate at 3.5%, but is there room left for an additional finetuning cut? The NBP decision probably will be a close call (unchanged at 4% or 3.75%). Also Tuesday’s policy decision of the Reserve Bank of Australia (RBA) will receive more than average attention. Will the RBA (have to) backtrack on earlier easing as inflation fails to return to target as hoped? For the Bank of England (expected unchanged at 3.75%) it’s probably too early to already front run on hoped for easing of inflation.
News and views
S&P raised Italy’s rating outlook to positive from stable and confirmed the rating at BBB+. The rating agency praised the country’s resilience amidst trade and tariff uncertainty, its ability to post net current account surpluses and the continuous improvements in Italy’s net external creditor position. Budgetary consolidation is gradually advancing, allowing for a projected headline deficit below the European Union’s 3% target in 2026. The numbers are still due for release, but it’s expected that Italy’s deficit already dropped below that mark last year. S&P expects debt-to-GDP to have come in at 136% last year. That is elevated, the agency says, but should start to decline from 2028 onwards. Italy is forecasted to grow steadily over the next three years, be it more slowly than peers.
India in its new budget unveiled on Sunday is sticking to budgetary prudence. It steered clear from big-ticket, economy-boosting spending measures and instead focused on shielding the country from rising global risks. The budget is packed with support for embittered exporters (hurt by 50% US levies) and contains more backing for strategic sectors such as rare earths, semiconductors and critical minerals to boost self-reliance. The spending plan also contains infrastructure spending and an 18% hike in defense expenditure. These measures come along with intentions to cut red tape to do business easier and improve productivity. The deficit under the this budget is expected to ease marginally from 4.4% to 4.3%. Indian stocks during a special session yesterday slumped in a move widely attributed to an equity transaction tax hike. USD/INR this morning declines to 91.61, still close to the 92 record high (INR low) seen and last week.
Metals Slammed as Leverage Gets Flushed
Those who hoped that Friday’s sharp drop in gold and silver prices — which shed 9% off gold and 27% off silver — would slow this Monday woke up to another nightmare this morning. Both metals are heavily sold in Asia, suggesting that leveraged positions and stop losses have not yet been fully cleared.
There has been a lot of speculation in recent weeks, and that speculative air is now coming out quite violently.
Looking at levels, for gold, I had been pointing to a possible correction toward the $4’600–4’800 range in the event of a sell-off, and we are hovering near $4’600 per ounce support this morning. I must admit that the sell-off has been far more brutal than I — and many — expected. This morning, the minor 23.6% Fibonacci retracement from October 2023 to last week has been cleared.
Given the high volatility and the size of leveraged positions, the sell-off could deepen toward the 50-DMA (currently near $4’480) and potentially further to the 200-DMA (currently near $4’235). The key technical level I am watching sits lower, at $4’115 — the major 38.2% Fibonacci retracement of the rally since late 2023. This level should hold if the “Sell America, Sell the Dollar” theme remains in play amid waning trust in White House trade and geopolitical policies.
For silver, the rally on the way up was faster than gold’s, so the correction on the way down is faster too. Silver was down more than 26% on Friday, another 13% this morning, and losses are being printed faster than I can finish my sentence. Overall, it has given back nearly 40% since last week’s peak at the time of writing.
More importantly, silver has slipped below two key technical levels: the 50-DMA and the major 38.2% Fibonacci retracement. The latter suggests silver has entered a bearish consolidation phase, with the risk of deeper losses before the correction slows.
How deep? The next key level is the 50% retracement, just below $70 per ounce — a psychological level that could act as a speed bump and attract dip buyers. Below that, the major 61.8% retracement at $57.80 per ounce would be another level to watch.
Whether the latest sell-off in metals becomes an opportunity for a fresh start — especially for those who missed the rally — will depend on several factors, including the US dollar.
The US dollar has been better bid since Friday, with the dollar index rebounding around 1% off four-year lows following news that the Federal Reserve may have a new Chair. Kevin Warsh was chosen to be the next Fed President and will replace Jerome Powell if confirmed.
The nomination ends months of speculation over who would lead the Fed next and offers clues about the future policy direction. Based on his past views, Mr Warsh has been critical of the Fed’s leadership and its relentlessly expanding balance sheet. He has also voiced strong concerns about inflation eroding purchasing power while inflating asset prices.
As such, he is expected to favour balance sheet reduction for bringing inflation down. And there is scope to shrink the Fed’s balance sheet substantially! Before 2008, the balance sheet stood below $1 trillion, peaked near $9 trillion in 2022, and now sits around $6.5 trillion. That could mark the end of the era of free money for markets — and that is bad news.
A balance sheet reduction could pose a major challenge for long-dated US bonds and US equity indices that have enjoyed a multi-decade climb. The knee-jerk reaction to the Warsh news was a spike in the US 10-year yield, which has eased this morning, partly as flows exit metals. But over a longer horizon — 12 months and beyond — a smaller Fed balance sheet would add upward pressure on long maturity yields.
Regarding rate cuts... the market reaction in the US 2-year yield suggests markets still expect rate cuts, betting that balance sheet reduction — combined with AI-driven productivity gains — could ultimately lower inflation. I won’t lie: I agree. The Fed’s monstrous balance sheet was always going to be addressed. It just might be happening now.
So what does that mean for equities? Could lower rates offset the impact of a smaller Fed balance sheet? It all depends on how quickly that balance sheet shrinks. The US — and global — economy has become deeply addicted to central bank buying, and weaning markets off free money could be so painful that some think the Fed’s balance sheet could ultimately end up larger under Warsh than before. Time will tell.
US equities are poised to start the week with a sharp sell-off, despite falling yields. Risk-off dominates the narrative — ironically triggered in part by the collapse in gold. If gold cannot protect investors during a sell-off, what can?
The Swiss franc? The USDCHF is trading below 0.78, raising questions about whether negative rates could return in Switzerland this year.
Elsewhere, the European Central Bank (ECB) and the Bank of England (BoE) are expected to stand pat this week, while the Reserve Bank of Australia (RBA) is expected to hike. Policy divergence should create attractive FX opportunities.
In equities, it is a heavy earnings week: Palantir and Disney today, AMD tomorrow, Google and Qualcomm on Wednesday, and Amazon on Thursday. Even strong results from Meta, Microsoft and Apple have failed to fully revive bullish sentiment. Investors are increasingly selective, scrutinising whether cloud growth is truly AI-driven and whether AI investments are delivering real returns. Earnings will not be a walk in the park.