Sample Category Title
Eco Data 2/3/26
| GMT | Ccy | Events | Act | Cons | Prev | Rev |
|---|---|---|---|---|---|---|
| 21:45 | NZD | Building Permits Dec | -4.60% | 2.80% | 2.70% | |
| 23:50 | JPY | Monetary Base Y/Y Jan | -9.50% | -10.20% | -9.80% | |
| 00:30 | AUD | Building Permits M/M Dec | -14.90% | -6.00% | 15.20% | 13.10% |
| 03:30 | AUD | RBA Interest Rate Decision | 3.85% | 3.85% | 3.60% | |
| 04:30 | AUD | RBA Press Conference |
| 21:45 | NZD |
| Building Permits Dec | |
| Actual | -4.60% |
| Consensus | |
| Previous | 2.80% |
| Revised | 2.70% |
| 23:50 | JPY |
| Monetary Base Y/Y Jan | |
| Actual | -9.50% |
| Consensus | -10.20% |
| Previous | -9.80% |
| 00:30 | AUD |
| Building Permits M/M Dec | |
| Actual | -14.90% |
| Consensus | -6.00% |
| Previous | 15.20% |
| Revised | 13.10% |
| 03:30 | AUD |
| RBA Interest Rate Decision | |
| Actual | 3.85% |
| Consensus | 3.85% |
| Previous | 3.60% |
| 04:30 | AUD |
| RBA Press Conference | |
| Actual | |
| Consensus | |
| Previous | |
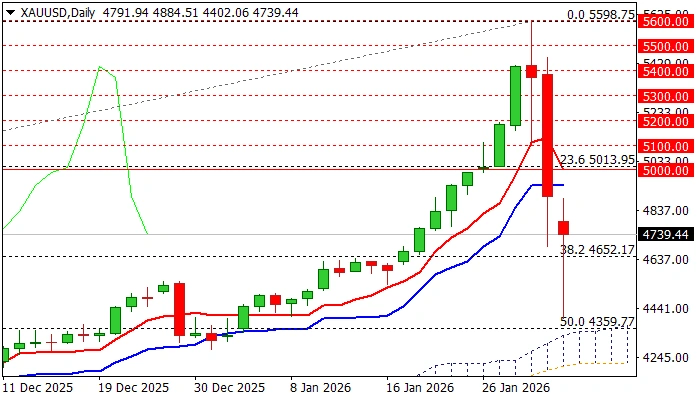
Gold: Downside Still Very Vulnerable Despite Today’s Strong Bounce
Gold extended sharp drop and fell to the lowest in one month, after trading on Monday started with about $100 gap lower, signaling that negative sentiment (after Friday’s biggest daily drop in over four decades), persists.
De-escalating tensions over Iran and initial signals that war in Ukraine might be heading towards its end, contributed to fresh selling, with speculations that big names were also in play to significantly lower metal’s price.
The cocktail of key factors pushed the price significantly lower, though on the bigger picture this still looks like a healthy correction of larger rally, as today’s spike low ($4402) found footstep just above 50% retracement of $3120/$5598 (May/ January upleg).
Today’s strong bounce from new low at $4402 (approx. $300) signals growing bids, with close above cracked Fibo 38.2% level ($4652), along with formation of bull-trap, needed to keep in play hopes of an end of potential further recovery.
However, more work at the upside will be still required to validate such scenario (close above Fibo 38.2% of $5598/$4402 pullback) while filling today’s gap and sustained break above $5000 (psychological / 50% retracement) would generate stronger bullish signal.
Negative scenario, on the other hand, may see today’s bounce as positioning for fresh push lower, as near-term action remains weighed by Friday’s massive bearish candle, while overall sentiment is still predominantly negative, due to weaker key fundamental factors, as well as existing fears of more losses after panic selling in past two sessions.
Lower triggers lay at $4359 (50% retracement) and $4348 (top of rising thin daily cloud, spanned between $4348 and $4218), with break here to generate fresh bearish signal and unmask nest targets at $4067 (Fibo 61.8% of $3120/$5598) and $4000 (psychological).
Res: 4859; 4900; 5000; 5100.
Sup: 4402; 4348; 4218; 4170.
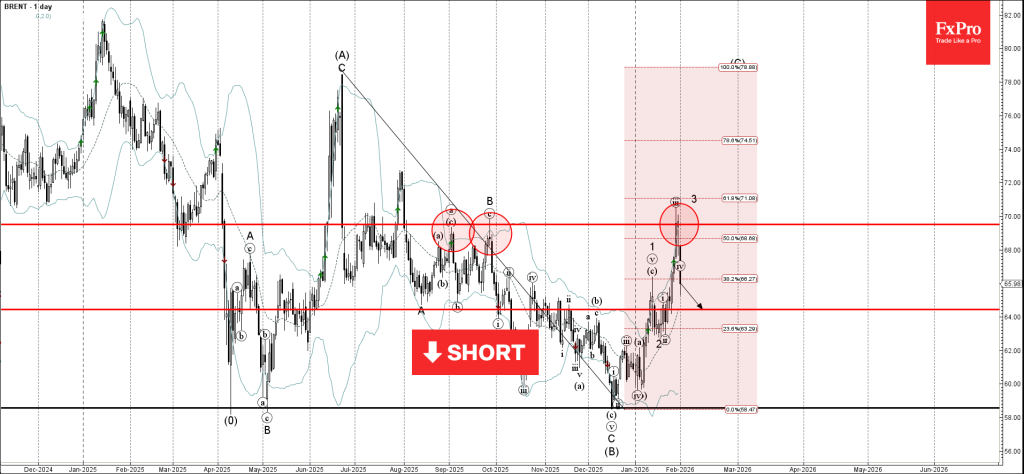
Brent Crude Oil Wave Analysis
Brent Crude Oil: ⬇️ Sell
- Brent Crude Oil reversed from resistance level 69.50
- Likely to fall to support level 64.25
Brent Crude Oil recently reversed from the resistance area located between the pivotal resistance level 69.50 (which has been reversing the price from September), upper daily Bollinger Band and by the 61.8% Fibonacci correction of the downward impulse from June of 2025.
The downward reversal from this resistance area created the daily Japanese candlesticks reversal pattern Long-legged Doji – strong sell signal for Brent Crude Oil.
Brent Crude Oil can be expected to fall to the next support level 64.25 (former resistance from November and January).
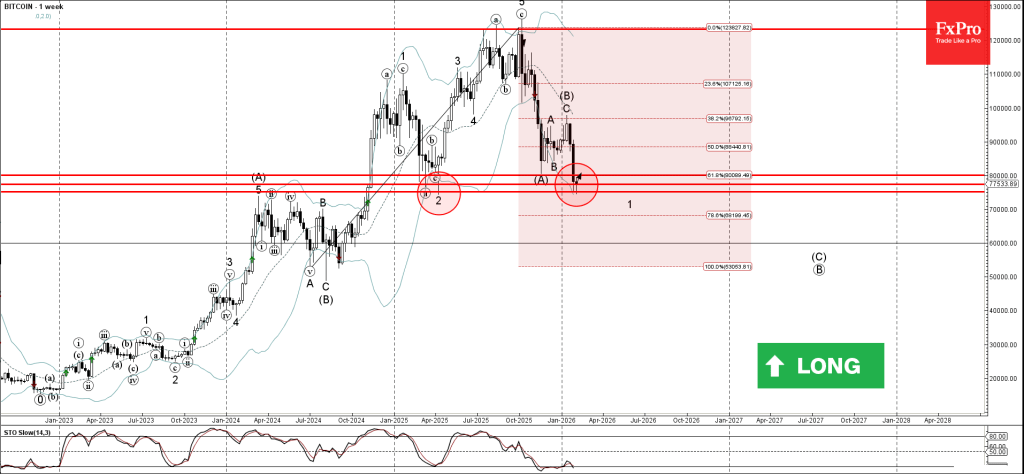
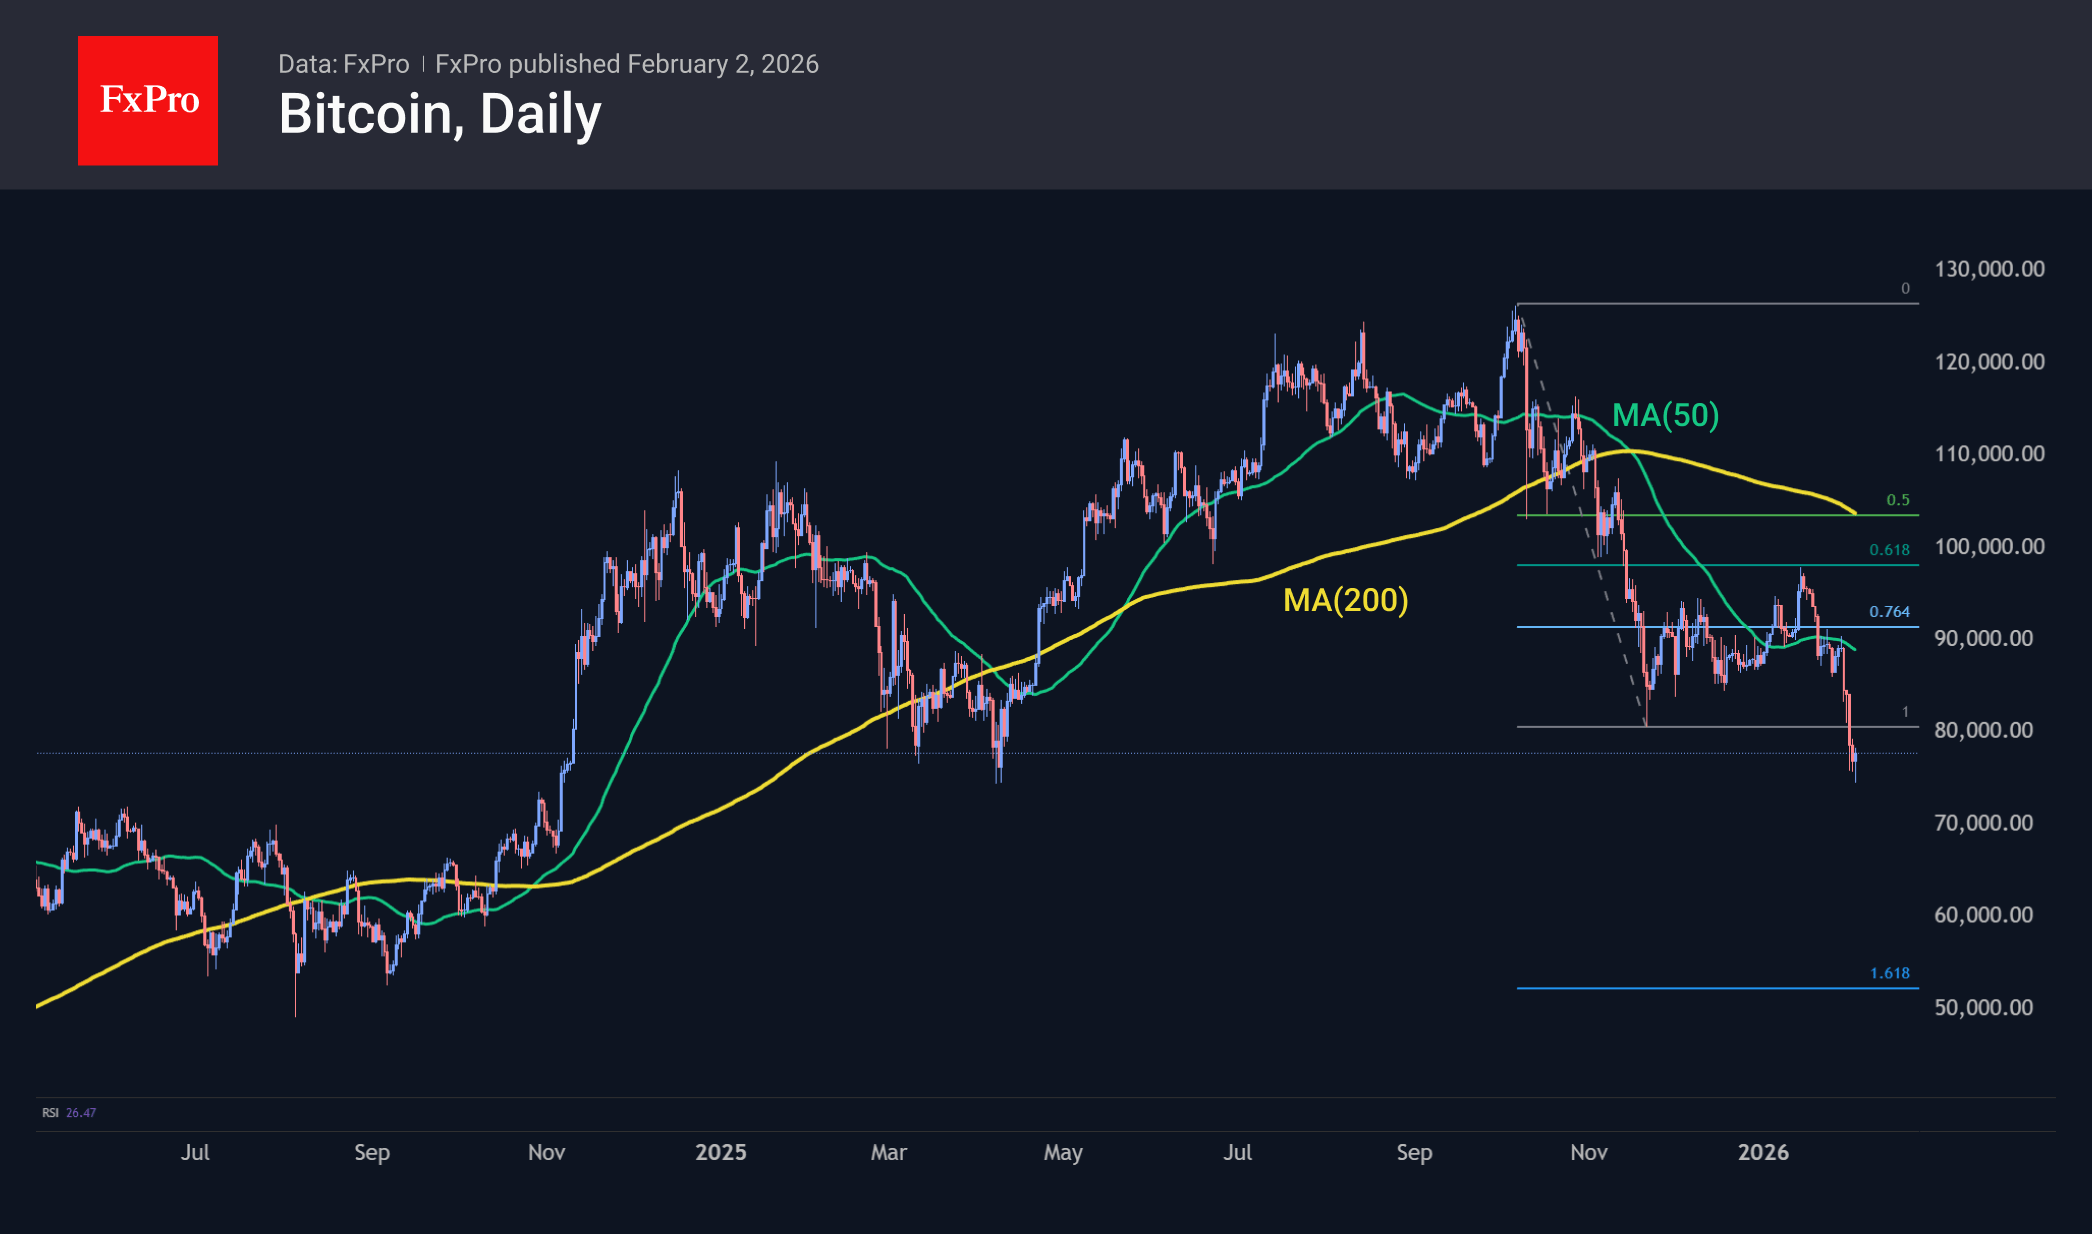
Bitcoin Wave Analysis
Bitcoin: ⬆️ Buy
- Bitcoin reversed from support area
- Likely to rise to resistance level 80000.00
Bitcoin cryptocurrency recently reversed up from the support area located between the support levels 75000.00 and 77400.00, which reversed the price multiple times at the start of 2025.
This support area was strengthened by the lower weekly Bollinger Band and by the 61.8% Fibonacci correction of the weekly impulse from 2024.
Given the oversold weekly Stochastic and weekly uptrend, Bitcoin cryptocurrency can be expected to rise to the next round resistance level 80000.00.
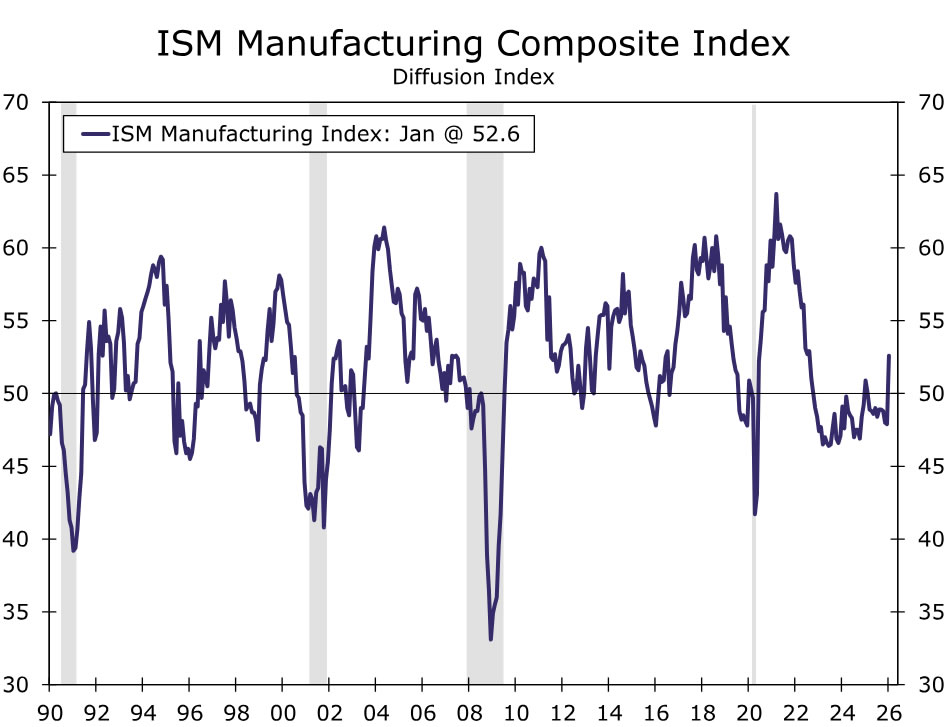
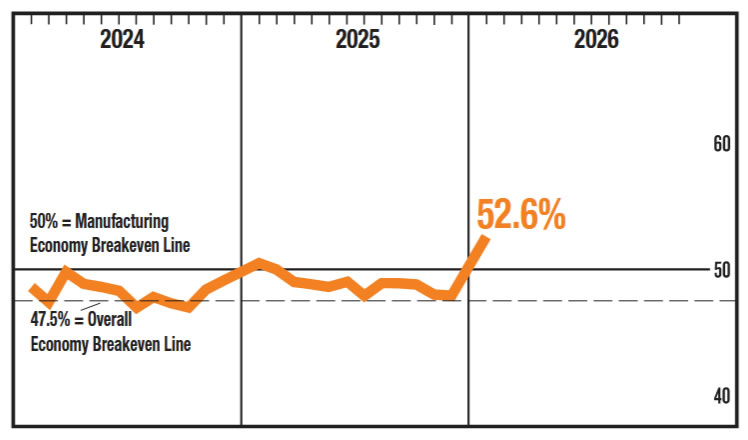
ISM Manufacturing Rises to Highest Since 2022
Summary
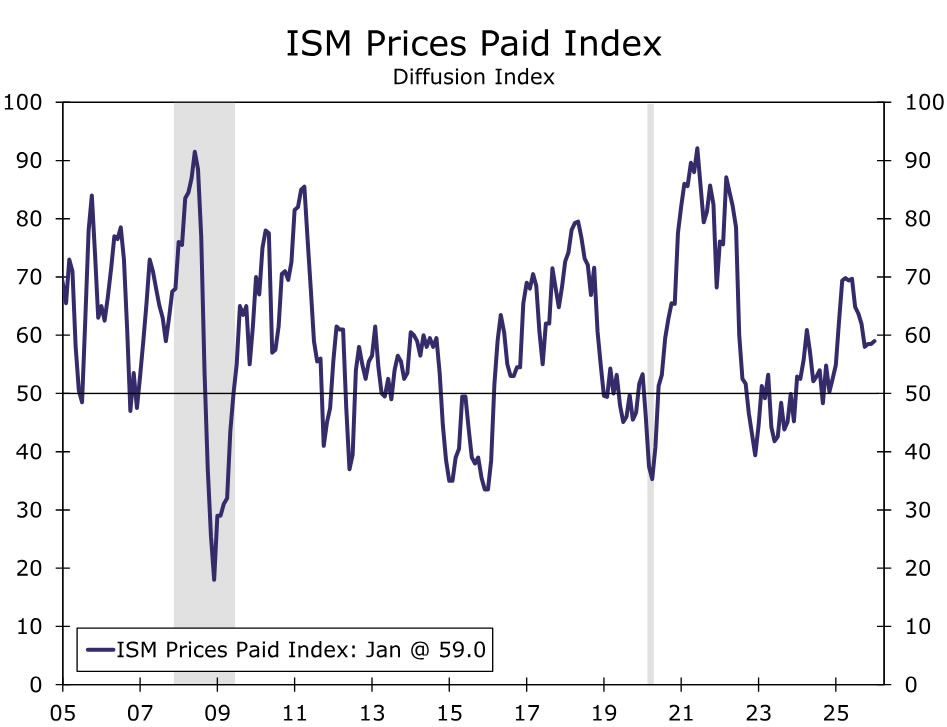
The 4.7 point jump in the ISM manufacturing index is consistent with our call for a modest broadening in capital expenditures and manufacturing activity, though some year-end replenishing amid trade uncertainty could be exaggerating momentum. Prices at 59.0 is not terribly encouraging for the efforts to get inflation in check.
"A new year, with new challenges"
The ISM manufacturing index crossed back over into expansion territory after 10 straight months in the purgatory of contraction last year. Today's 52.6 reading for January signals a welcome bit of relief for manufacturing even if some year-end quirks are giving only a temporary boost to the numbers in today's report (chart).
Three out of five of the subcomponents that feed into the headline for the ISM manufacturing index are now in expansion territory. The biggest overall move was in new orders which jumped 9.7 points to 57.1 (chart). That's the biggest one-month pop outside the pandemic since 2001 and signals the fastest pace of expansion for this forward-looking measure in nearly four years. While we've highlighted the broadening out in durable goods orders as a signal traditional manufacturing and cap-ex might be gaining traction, this likely overstates the extent of order expansion as the release noted "post-holiday replenishment and customers’ desire to get ahead of additional tariff-driven price increases as possible reasons for the increase [in orders]".
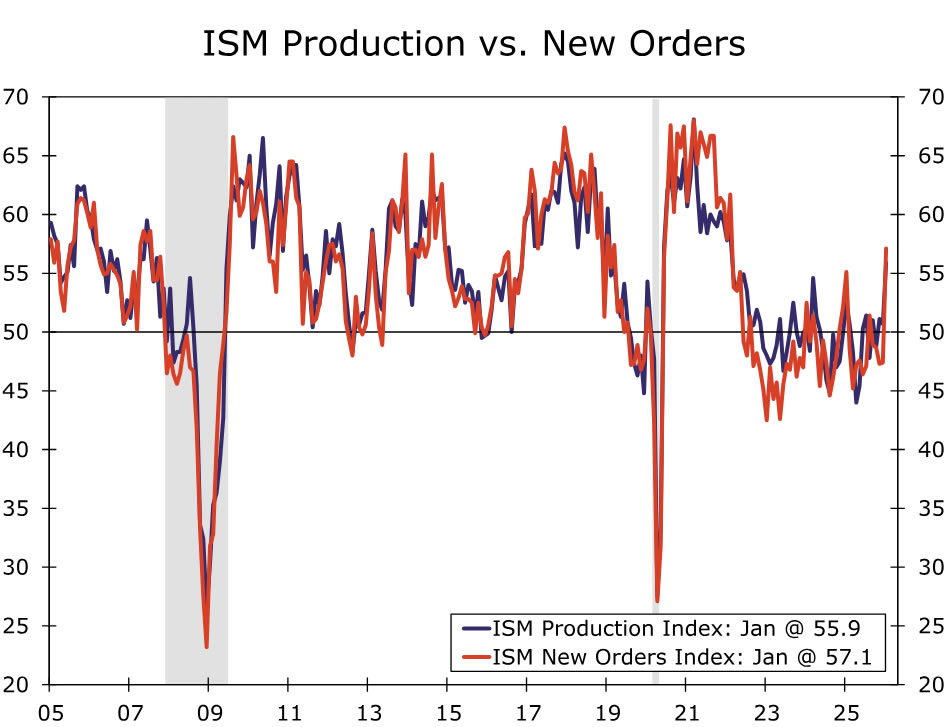
Supplier deliveries came in at 54.4 in January and that too lifted the headline, although we should be wary of long wait-times amid evolving trade tensions. Production also jumped 5.2 points to hit 55.9 suggesting a somewhat brighter assessment of production despite lackluster industrial production data.
The select respondent comments continue to strike a tone of caution around activity due to tariffs. Nearly all respondents made direct mentions of tariffs last month, while three industries (Computer & Electronic Products, Chemical Products and Apparel & Leather) specifically mentioned moving manufacturing out of China. Others noted supply chain volatility, the inability to plan long-term and profit misses because of tariff costs.
The prices paid index inched higher to 59.0, indicating some stubbornness in prices with 11 industries reporting paying higher prices for raw materials last month (chart). Just under 30% of respondents reported paying higher prices, which is the highest in at least four months, but remains well below the 49.2% that reported so back in April 2025.
The employment index registered its highest reading in a year, although at 48.1 it remains consistent with a contraction in hiring in the sector. The release also noted that "for every comment on hiring, there were two on reducing head counts."
We continue to anticipate a modest broadening in capital expenditures this year, and even if the latest data overstate the current run rate of growth, the January ISM ultimately suggests some sign of stabilization in underlying manufacturing activity.
US ISM manufacturing jumps to 52.6, back into expansion, growth signal strengthens
US ISM Manufacturing PMI jumped sharply from 47.9 to 52.6 in January, far above expectations of 48.3 and marking the first return to expansion since February 2025. The scale of the rebound points to a clear improvement in factory momentum rather than a marginal stabilization.
The details were notably strong. Production rose from 50.7 to 55.9, the highest level since February 2022. New orders surged from 47.4 to 57.1, expanding for the first time since August. Employment also improved, with the index rising from 44.8 to 48.1, though it remains in contraction territory. Price pressures edged higher but stayed contained, with the prices index ticking up from 58.5 to 59.0.
Based on the historical relationship tracked by the Institute for Supply Management, the January PMI reading is consistent with real GDP growth of around 1.7% annualized, reinforcing the view that US growth momentum has firmed at the start of the year.
Crypto Market Has Fallen Back to Last Year’s Low
Market Overview
The crypto market has lost nearly 13% of its capitalisation over the past seven days, falling to $2.59 trillion at the time of writing. With the market bottoming out at $2.52T, it is only $0.1T above last April’s low. The sharp decline following consolidation signals the start of an extended downtrend. However, we also note that the current levels are in the strongest resistance zone for 2021–2024, which became support in 2025. Therefore, it is worth preparing for another and possibly quite protracted tug-of-war in the $2.3–2.7T range.
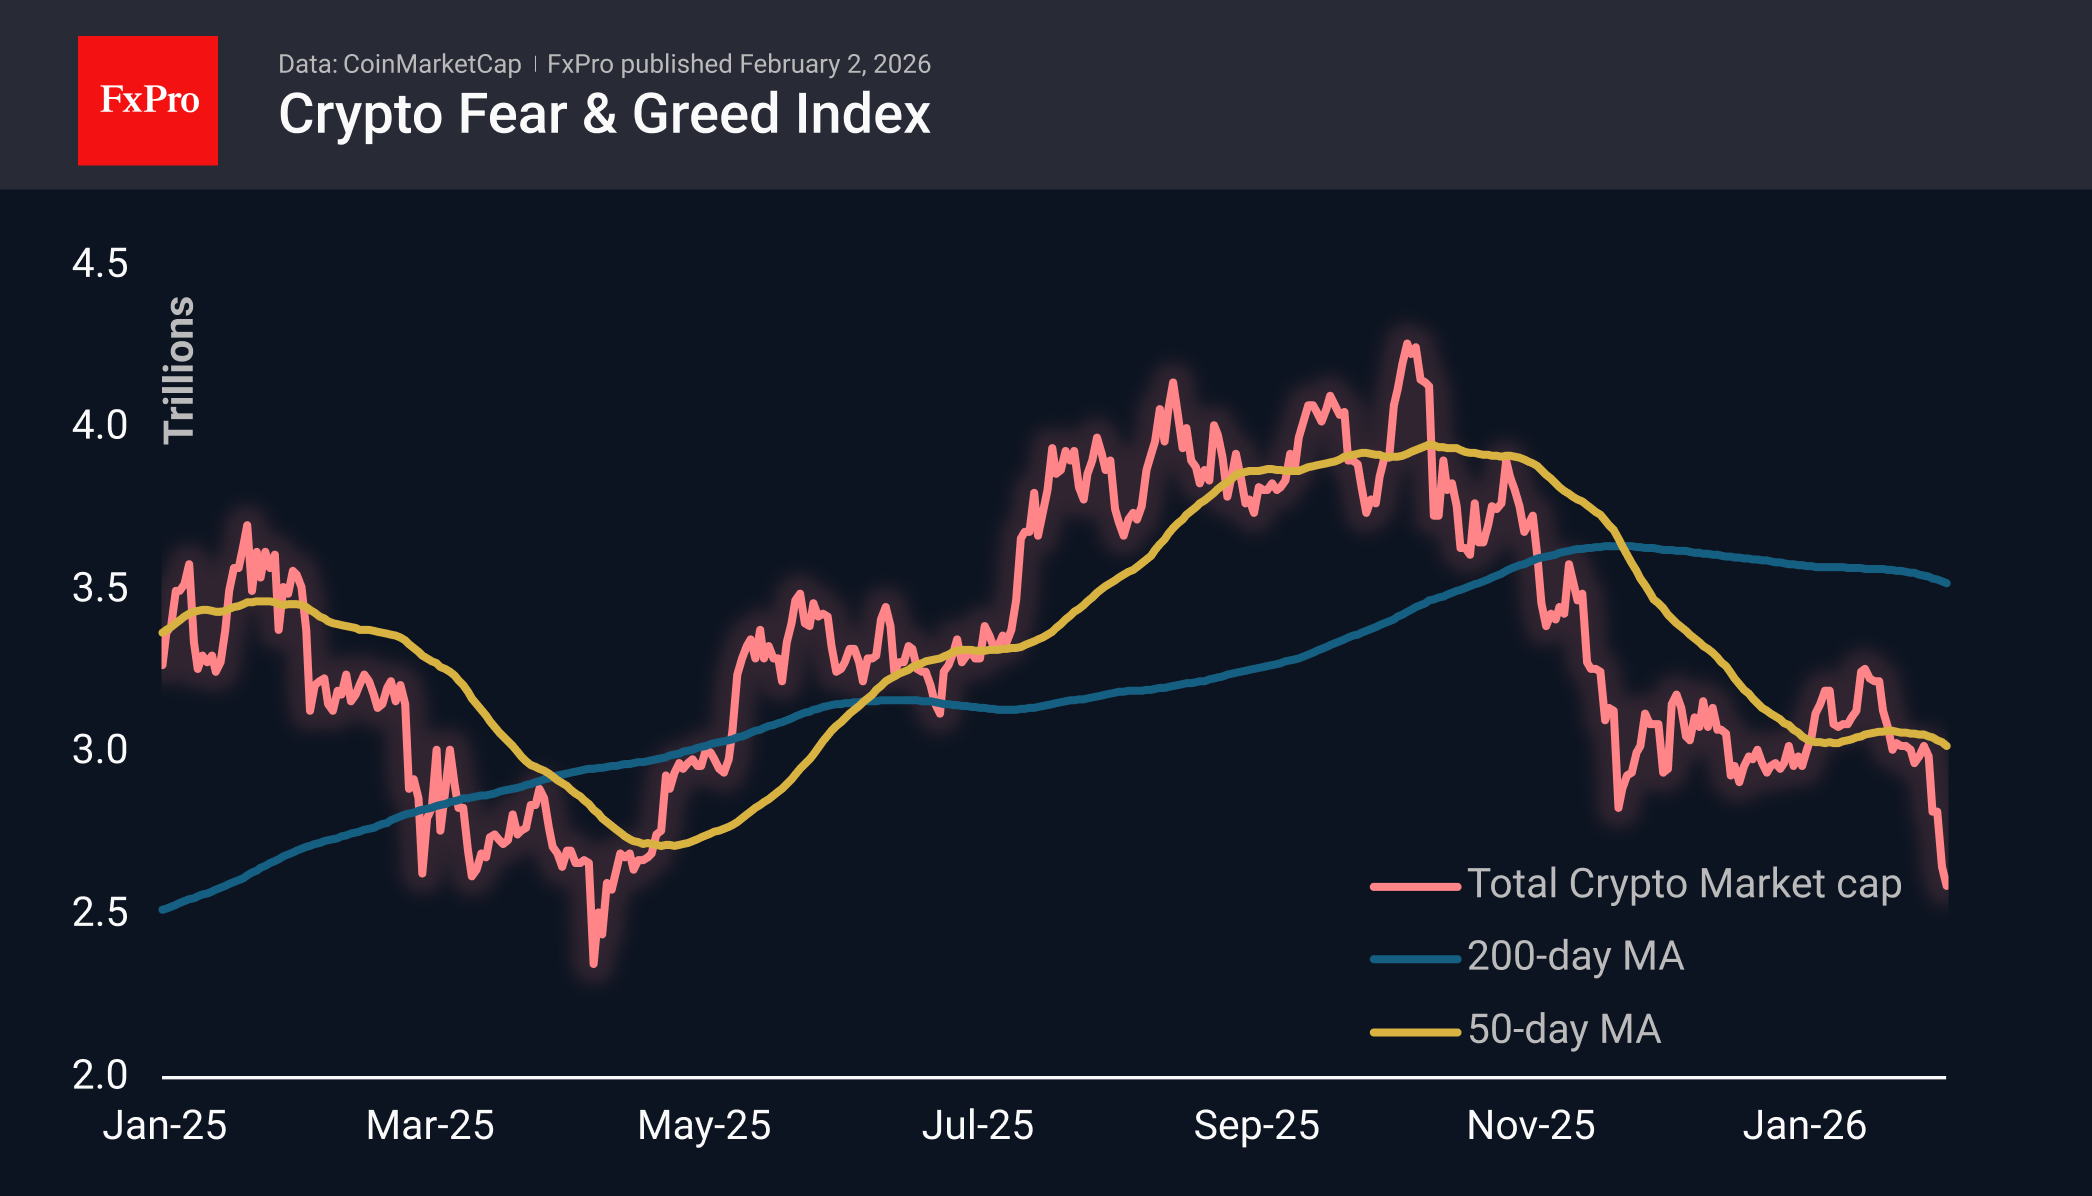
Bitcoin is trading near $78K, rebounding after this morning’s dip below $75K. The first cryptocurrency began its recovery in April from the same area, which probably served as a trigger for bold buyers. We consider it an important bearish signal that BTC began to sell off actively after an unsuccessful attempt to consolidate above the 50-day average. The main scenario for the markets now may be a fall towards $50K in the next month and a half to two months.
Bitcoin fell 11% in January to $78K; the decline has been ongoing since October. The last time BTC fell for four consecutive months was exactly seven years ago — from October 2018 to January 2019. After that, the first cryptocurrency showed impressive growth over five months. In terms of seasonality, February is considered the best month of the year for BTC. Over the past 15 years, Bitcoin has ended this month with growth in 11 cases and only declined in four. The average growth was 27.6%, and the average decline was 19.5%.
News Background
Investors withdrew $1.60 billion (-2.8%) from spot Bitcoin ETFs in the US in January. The outflow from funds has continued for a record three months in a row, amounting to almost $6.2B during this period. Investors withdrew $0.36 billion from spot Ethereum ETFs in the US in January; over the last three months, the outflow amounted to $2.4 billion. In January, investors invested $0.10 billion in SOL ETFs.
Bitcoin’s hash rate has fallen 12% over the past four months, according to Glassnode. This is the most significant correction since 2021, when Chinese authorities banned cryptocurrency mining.
According to The Block, mining company Bit Digital intends to completely abandon Bitcoin mining to focus on investments in Ethereum and strategies related to artificial intelligence.
In January, the average cost of mining one bitcoin reached $74,300, according to Capriole Investments. Large market players have a margin of safety, but the capitulation of some companies could lead to increased sales of mined coins to cover costs.
According to a report by auditing firm BDO, Tether’s profit for 2025 exceeded $10 billion. The USDT issuer’s excess reserves reached $6.3 billion. During the reporting period, Tether issued nearly 50 billion USDT, with the total issuance of the largest stablecoin exceeding 186 billion tokens.
EUR/USD Mid-Day Outlook
Daily Pivots: (S1) 1.1809; (P) 1.1892; (R1) 1.1934; More….
EUR/USD's break of 1.1835 support confirms short term topping at 1.2081. Intraday bias is back on the downside for 55 D EMA (now at 1.1718). Firm break there will raise the chance of reversal on rejection by 1.2 psychological level, and target 1.1576 support. Nevertheless, decisive break above 1.2 will carry larger bullish implications.
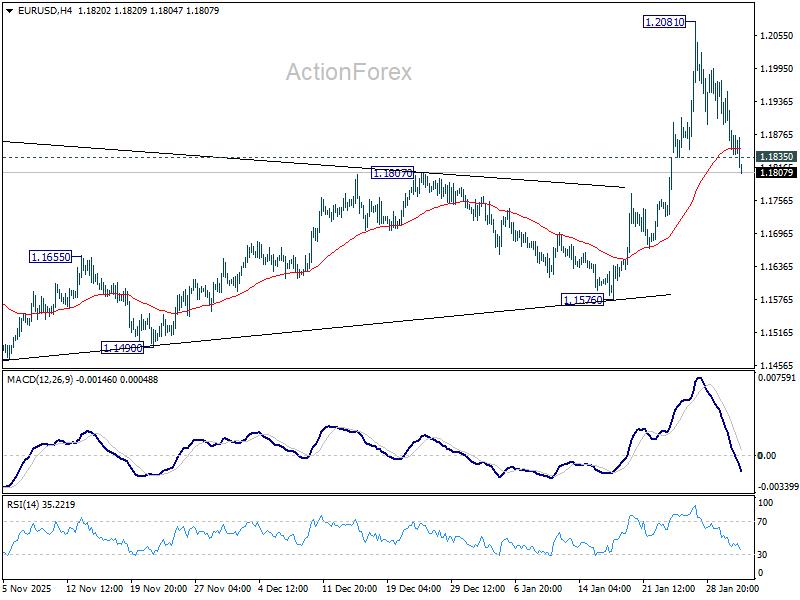
In the bigger picture, as long as 55 W EMA (now at 1.1458) holds, up trend from 0.9534 (2022 low) is still in favor to continue. Decisive break of 1.2 key psychological level will add to the case of long term bullish trend reversal. Next medium term target will be 138.2% projection of 0.9534 to 1.1274 from 1.0176 at 1.2581. However, sustained trading below 55 W EMA will argue that rise from 0.9534 has completed as a three wave corrective bounce, and keep long term outlook bearish.
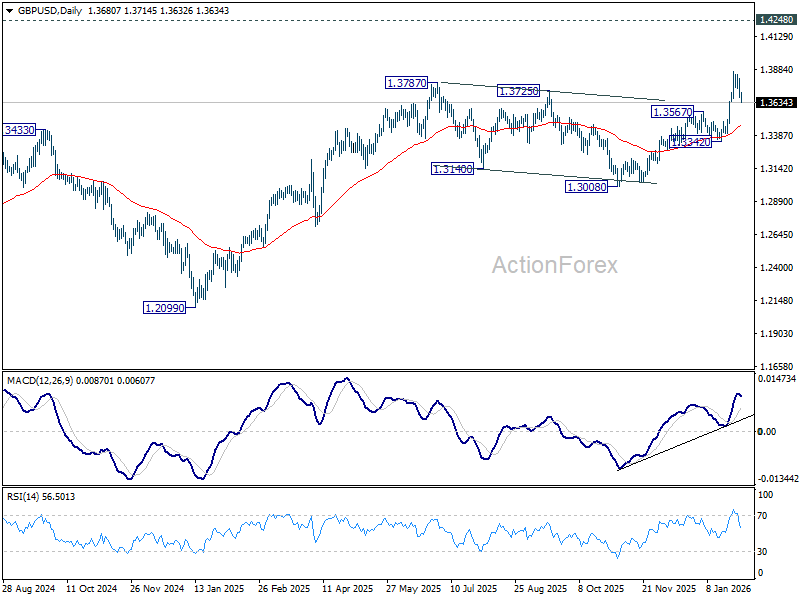
GBP/USD Mid-Day Outlook
Daily Pivots: (S1) 1.3638; (P) 1.3726; (R1) 1.3774; More...
Immediate focus is on 1.3641 minor support in GBP/USD. Firm break there will confirm short term topping at 1.3867. Intraday bias will be back on the downside for 55 D EMA (now at 1.3455). On the upside, though, break of 1.3867 will resume larger up trend towards 1.4284 key resistance.
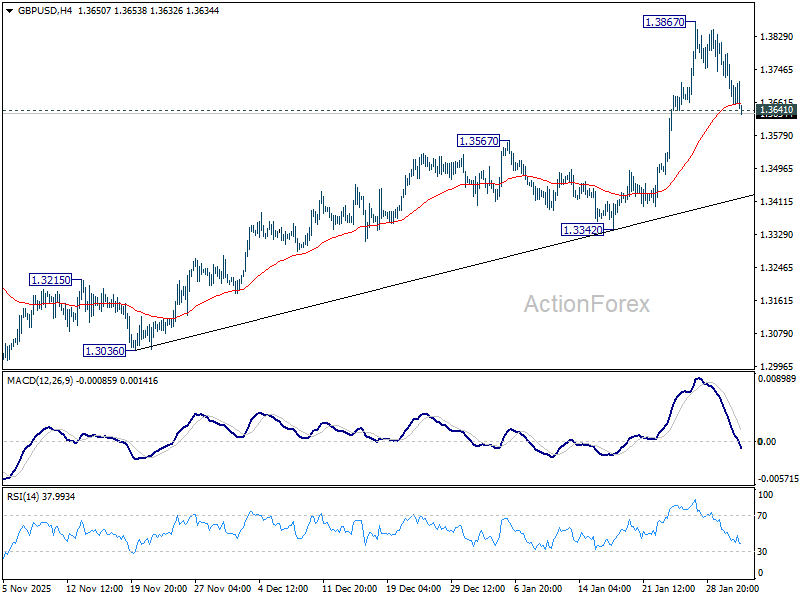
In the bigger picture, rise from 1.0351 (2022 low) is resuming by breaking through 1.3787 high. Further rally should be seen to 1.4284 key resistance (2021 high). Decisive break there will add to the case of long term bullish trend reversal. For now, outlook will stay bullish as long as 1.3008 support holds, even in case of deep pullback.
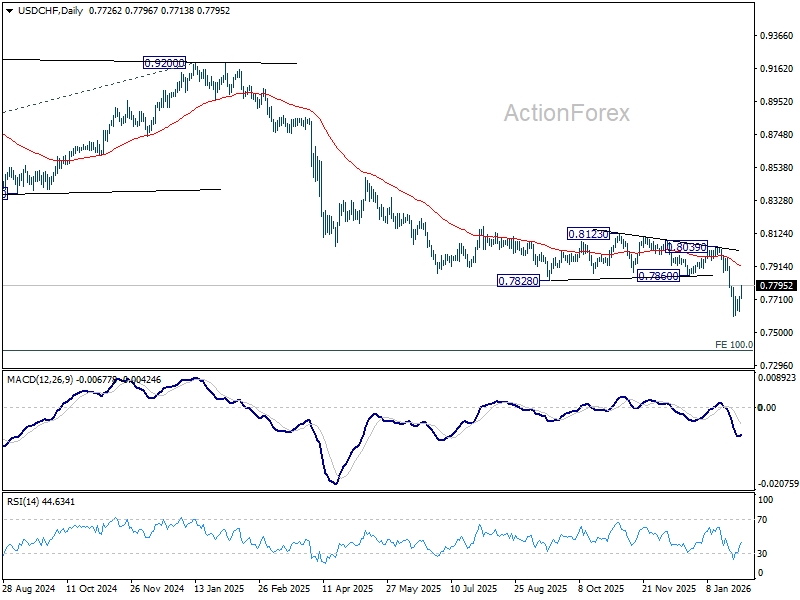
USD/CHF Mid-Day Outlook
Daily Pivots: (S1) 0.7667; (P) 0.7699; (R1) 0.7762; More….
Immediate focus is on 0.7792 resistance as rebound from 0.7603 extends. Firm break there will confirm short term bottoming. Further rise should be seen to 55 D EMA (now at 0.7917. Meanwhile, break of 0.7603 will resume the larger down trend to 0.7382 projection level next.
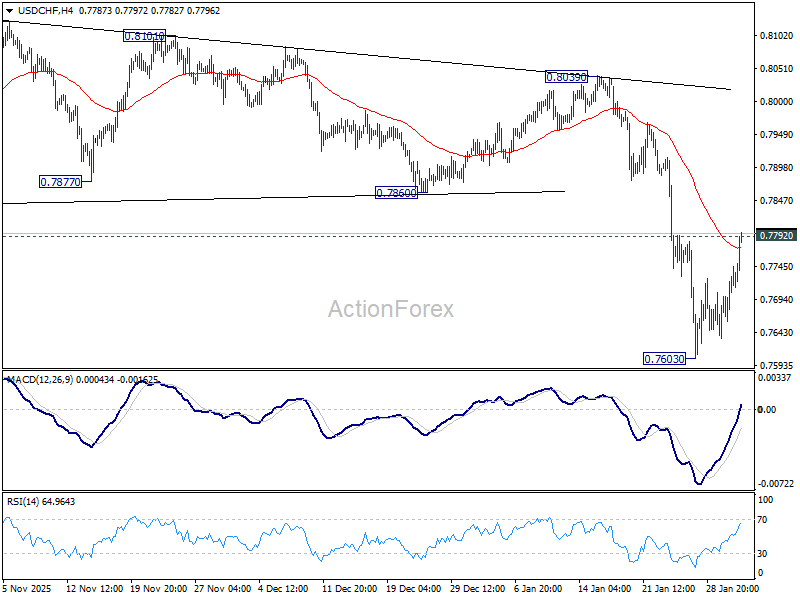
In the bigger picture, larger down trend from 1.0342 (2017 high) is still in progress and resuming. Next target is 100% projection of 1.0146 (2022 high) to 0.8332 from 0.9200 at 0.7382. In any case, outlook will stay bearish as long as 55 W EMA (now at 0.8166) holds.