Sample Category Title
Hangseng Index Rallying in Nesting Impulse Elliott Wave Structure
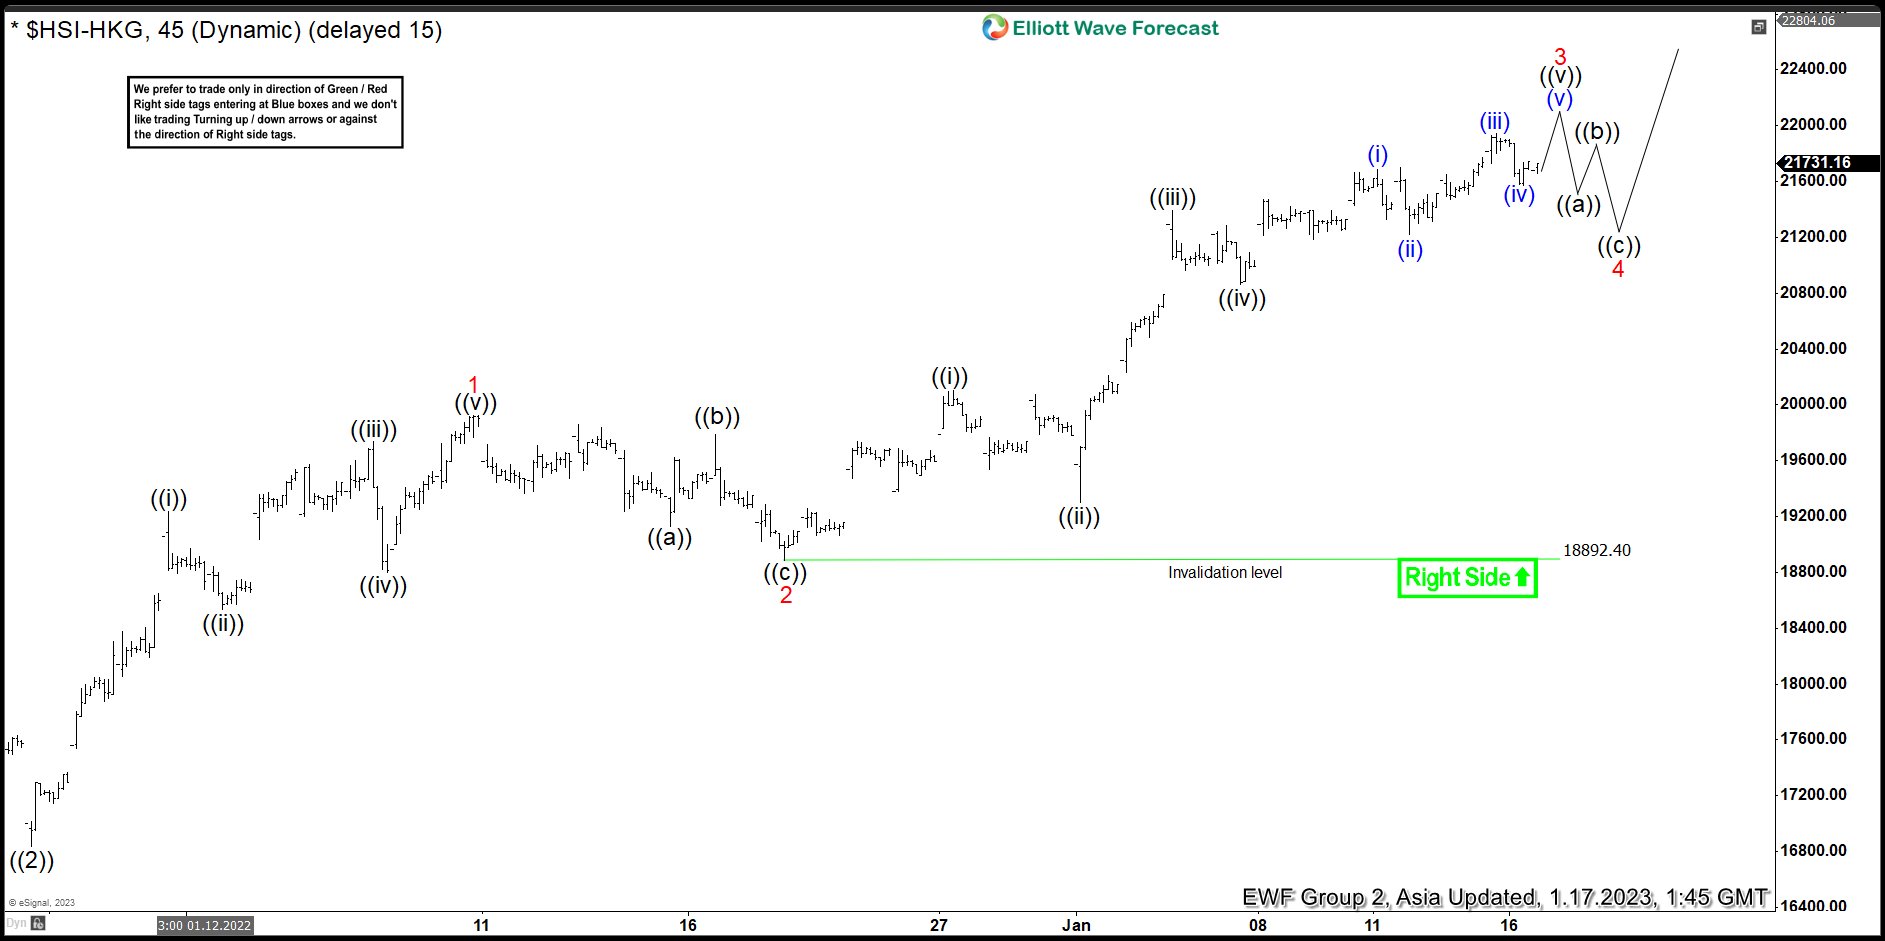
Cycle from 10.31.2022 low in Hangseng Index is in progress as a nesting 5 waves impulsive Elliott Wave structure. Up from 10.31.2022 low, wave ((1)) ended at 18414.09. The 45 minutes chart below shows pullback in wave ((2)) ended at 16833.68. Wave ((3)) is currently in progress as another impulse in lesser degree. Up from wave ((2)), wave ((i)) ended at 19237.45 and dips in wave ((ii)) ended at 18530.82. Wave ((iii)) ended at 19737.31, pullback in wave ((iv)) ended at 18799.81 and final leg wave ((v)) ended at 19926.48. This completed wave 1 in higher degree.
Wave 2 pullback ended at 18878.64 with internal subdivision as a zigzag structure. Down from wave 1, wave ((a)) ended at 19130.53, rally in wave ((b)) ended at 19786.29 and wave ((c)) lower ended at 18878.64. This completed wave 2 in higher degree. The Index has resumed higher in wave 3. Up from wave 2, wave ((i)) ended at 20098.23 and pullback in wave ((ii)) ended at 19303.73. Index then extended higher in wave ((iii)) towards 21396.09, and pullback in wave ((iv)) ended at 20862.77. Expect Index to end wave ((v)) of 3 soon, then it should pullback in wave 4 to correct cycle from 12.20.2022 low before the rally resumes. Near term, as far as pivot at 18878.64 low stays intact, expect pullback to find support in 3, 7, 11 swing for more upside.
Hangseng 45 Minutes Elliott Wave Chart
Technical Outlook and Review
USD/JPY:
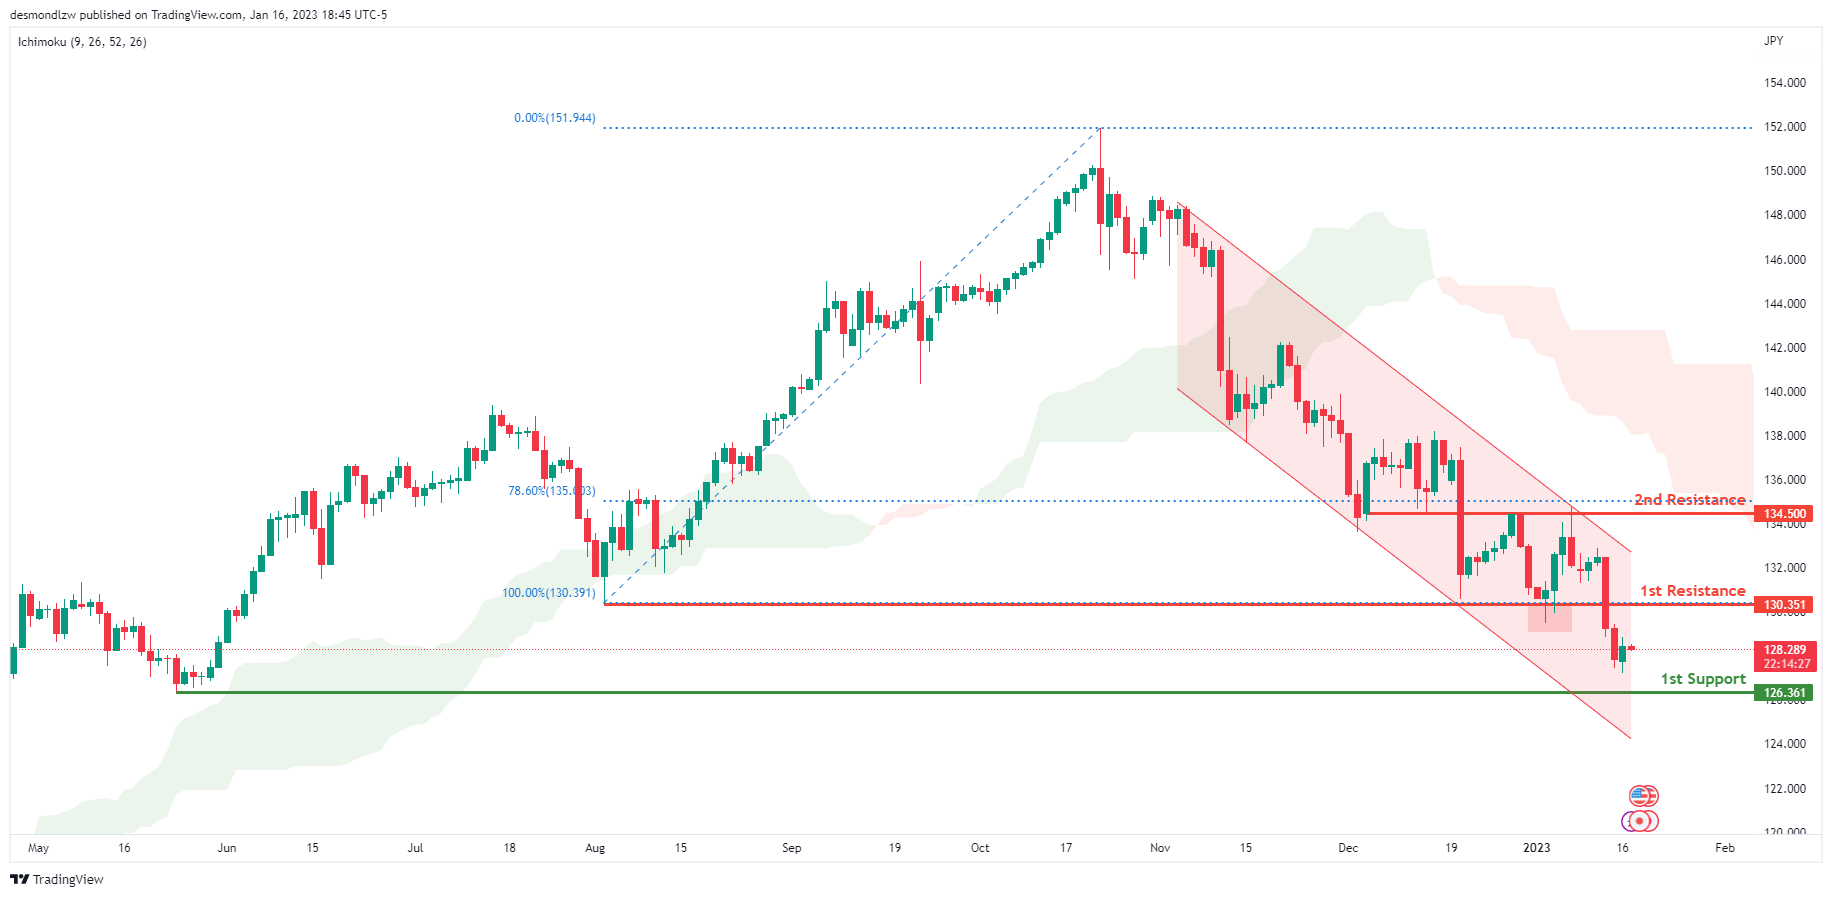
Looking at the Daily chart, my overall bias for USDJPY is bearish due to the current price being below the Ichimoku cloud, indicating a bearish market. To add confluence to this bias, price is also within a descending channel. If this bearish momentum continues, expect the price to possibly continue heading towards the 1st support level at 126.361, where the previous swing low is. In an alternate scenario, price could possibly head back up to retest the 1st resistance at 130.351, where the previous swing low is.
Areas of consideration:
- H4 time frame, 1st resistance at 130.351
- H4 time frame, 1st support at 126.361
DXY:
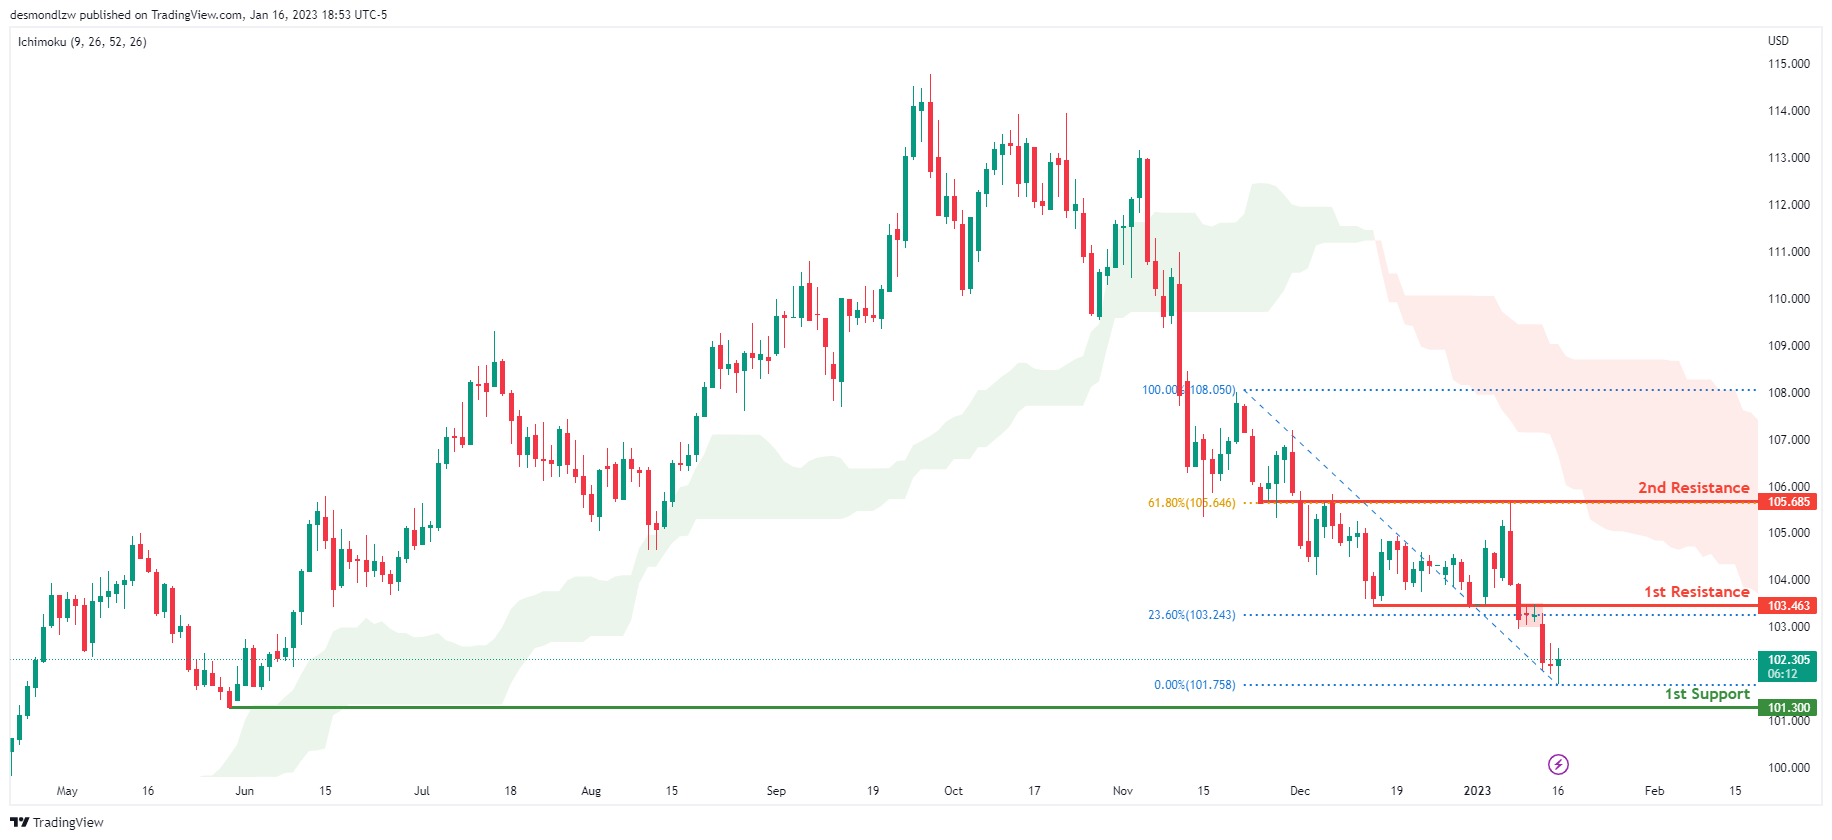
Looking at the Daily chart, my overall bias for DXY is bearish due to the current price being below the Ichimoku cloud, indicating a bearish market. If this bearish momentum continues, expect the price to possibly continue heading towards the 1st support at 101.300, where the previous low is. . In an alternative scenario, price could head back up to retest the 1st resistance at 103.463, where the 23.6% Fibonacci line is.
Areas of consideration:
- H4 time frame, 1st resistance at 103.463
- H4 time frame, 1st support at 101.300
EUR/USD:
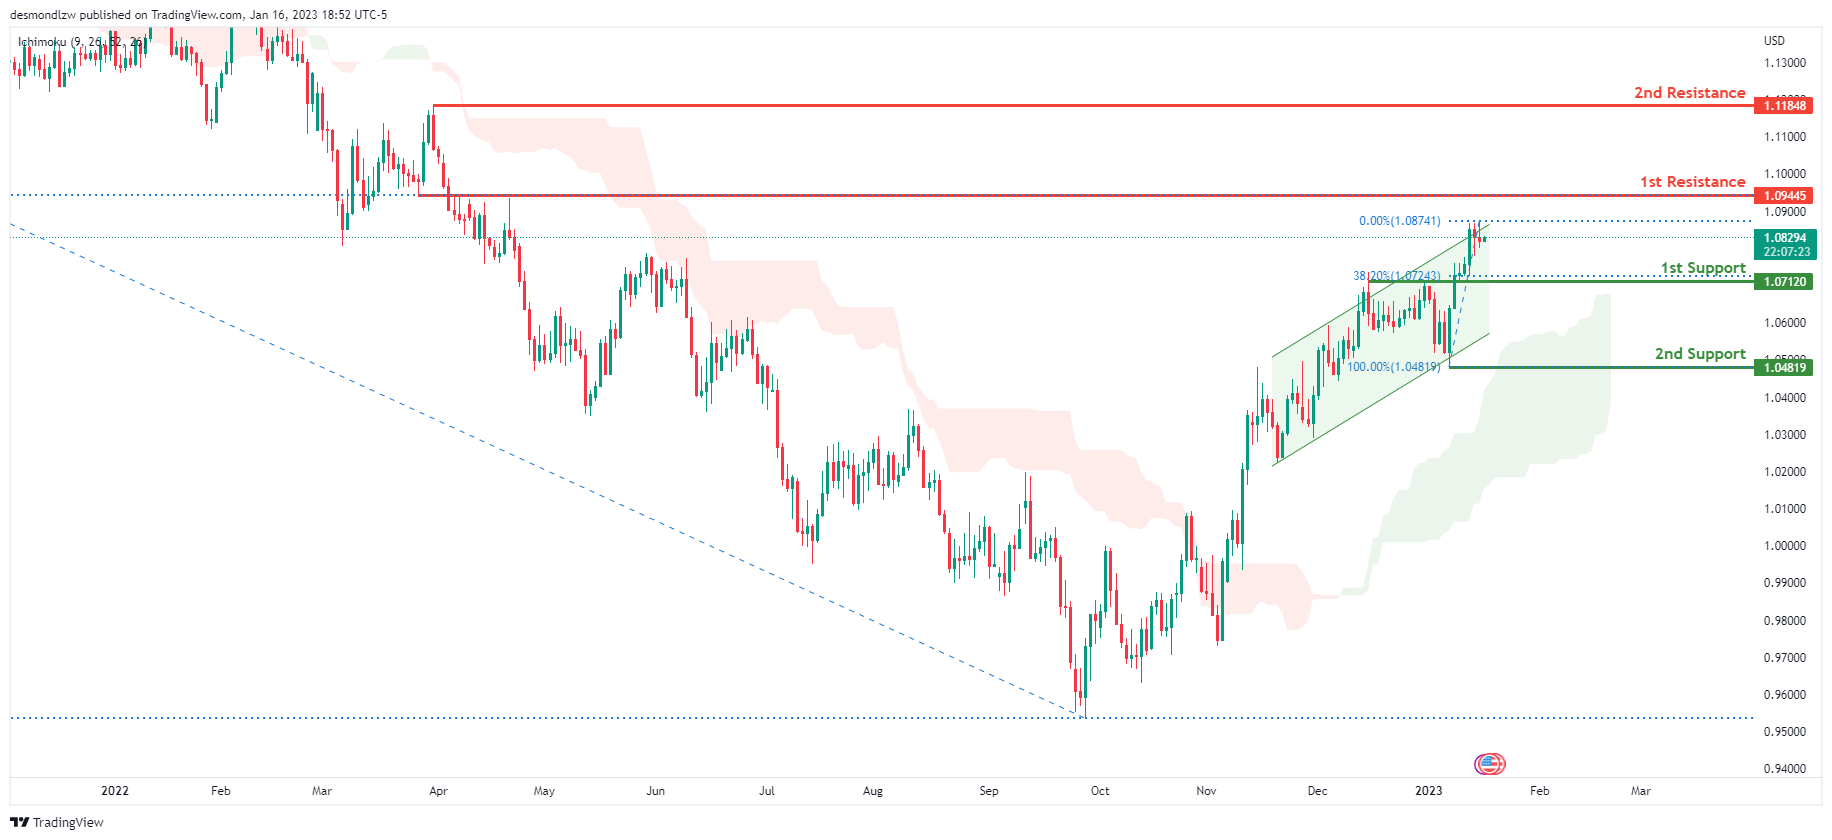
Looking at the Daily chart, my overall bias for EURUSD is bullish due to the current price being above the Ichimoku cloud, indicating a bullish market structure. To add confluence to this bias, price is also within an ascending channel. If this bullish momentum continues, expect the price to possibly continue heading towards the 1st resistance at 1.09445, where the 50% Fibonacci line is. In an alternate scenario, price could possibly head back down to retest the 1st support level at 1.07120, where the 38.2% Fibonacci line is.
Areas of consideration :
- H4 1st resistance at 1.09445
- H4 1st support at 1.07120
GBP/USD:
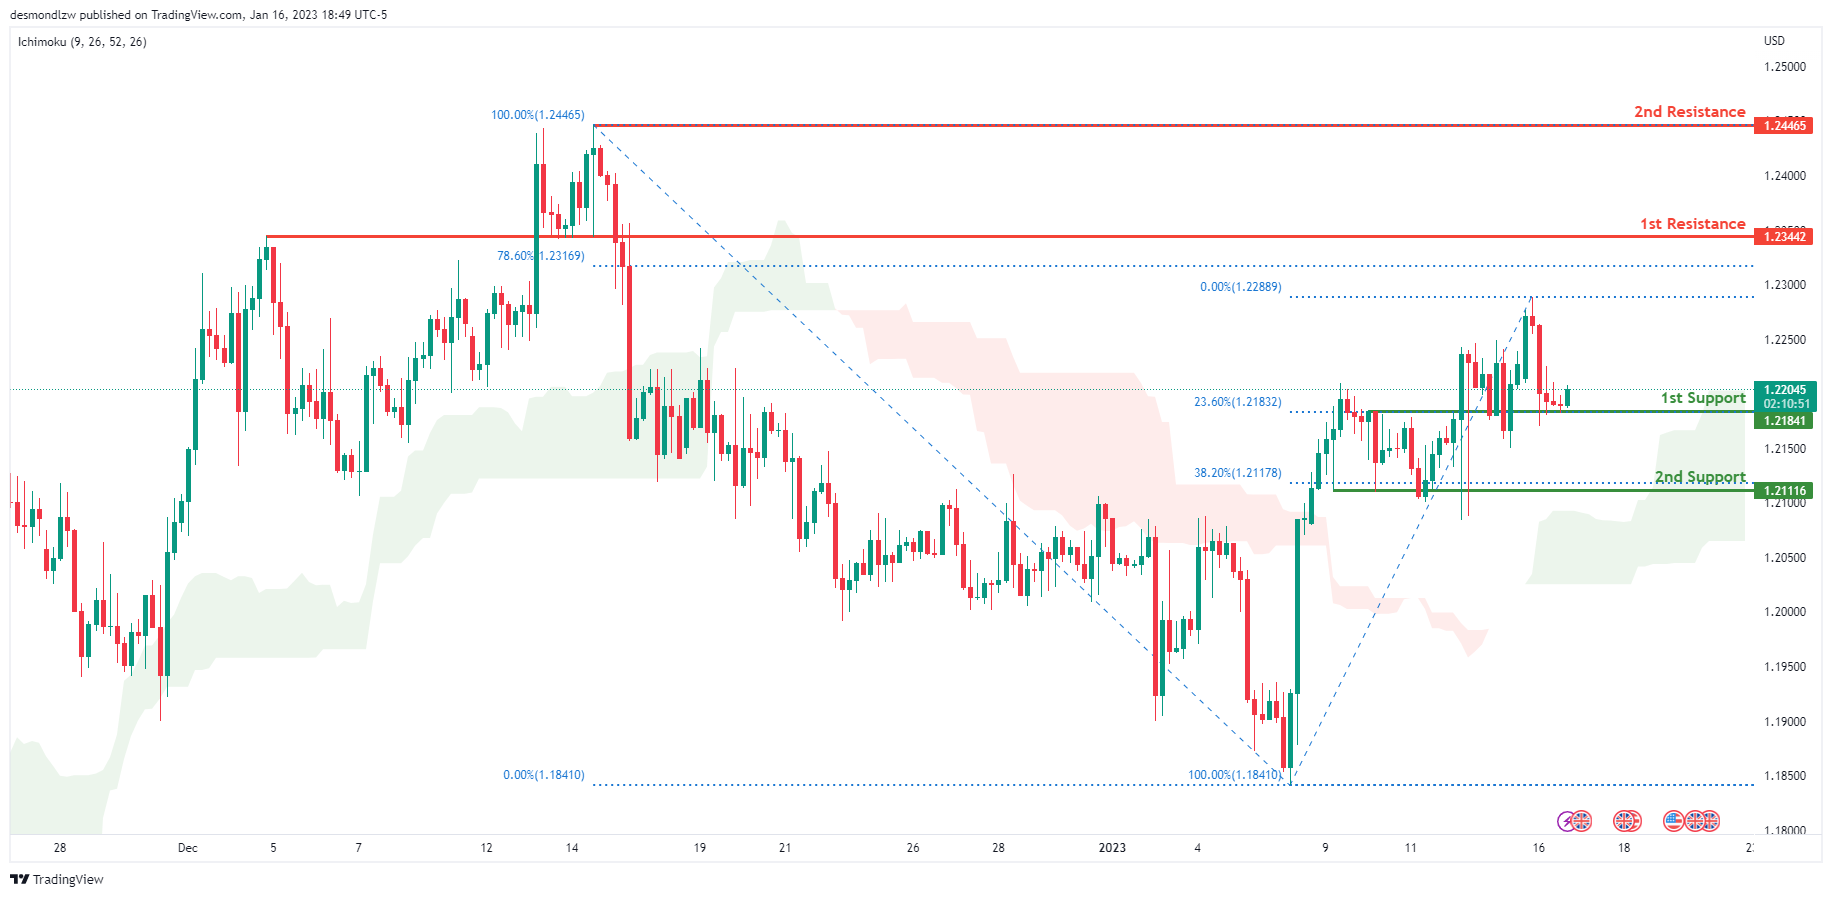
Looking at the H4 chart, my overall bias for GBPUSD is bullish due to the current price being above the Ichimoku cloud, indicating a bullish market. If this bullish momentum continues, expect price to possibly continue heading towards the 1st resistance line at 1.23442, where the 78.6% Fibonacci line is. In an alternate scenario, price could possibly head back down and break the 1st support at 1.21841, where the 23.6% Fibonacci line is, before heading towards the 2nd support at 1.21116, where the 38.2% Fibonacci line is.
Areas of consideration:
- H4 1st resistance at 1.23442
- H4 1st support at 1.21841
- H4 2nd support at 1.20834
USD/CHF:
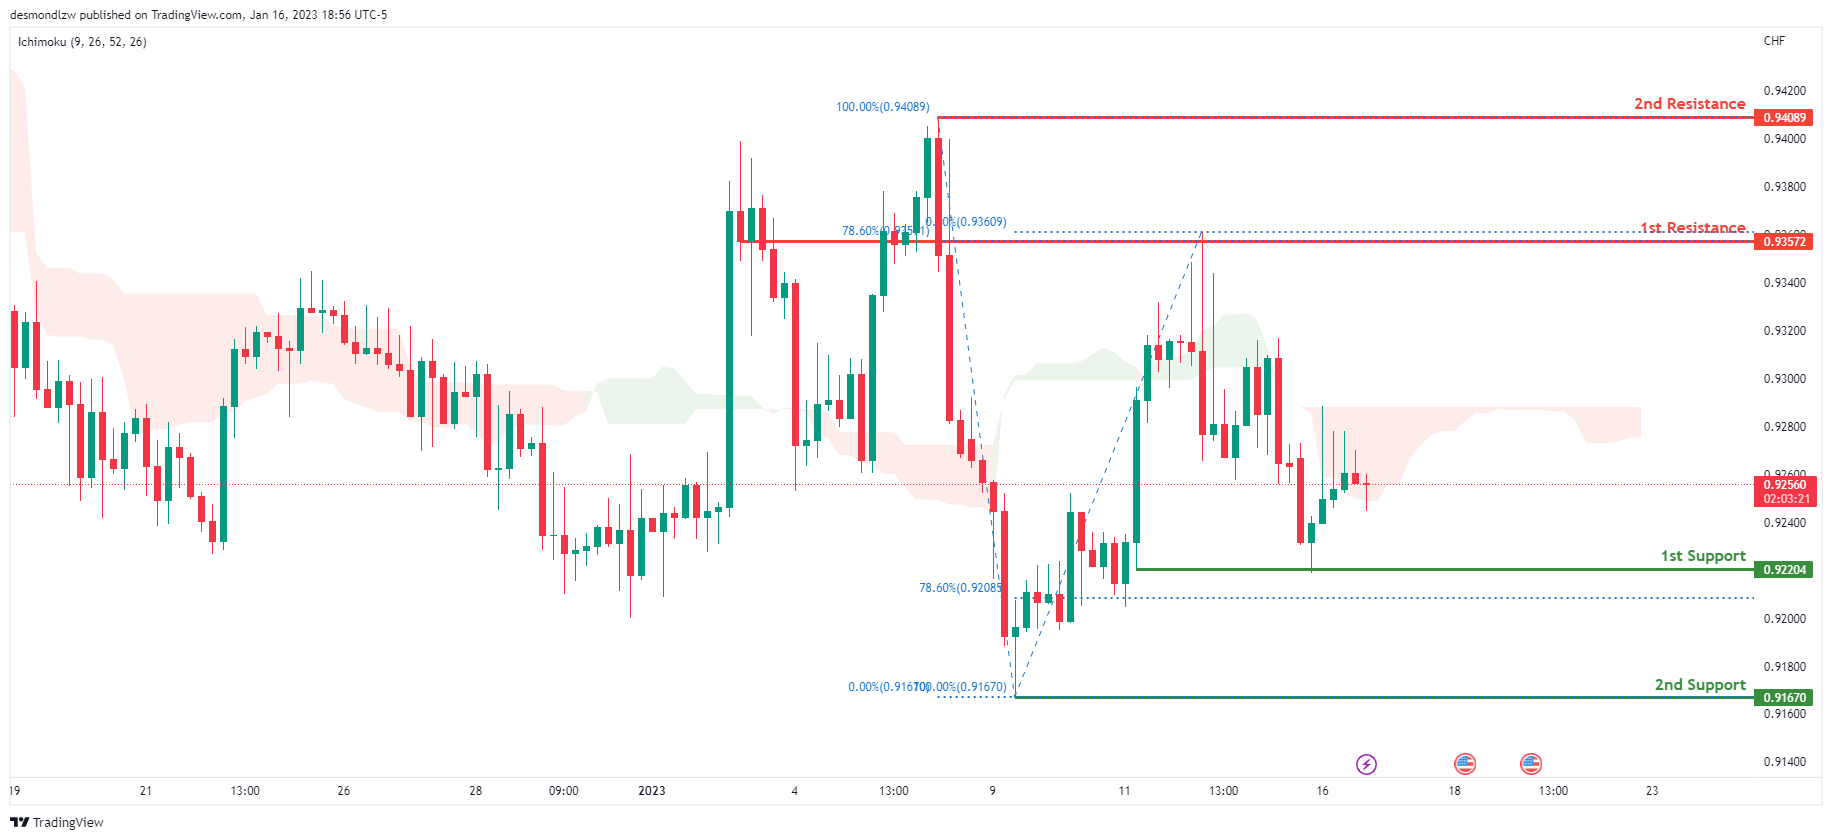
Looking at the H4 chart, my overall bias for USDCHF is bearish due to the current price crossing below the Ichimoku cloud, indicating a bearish market. If the current bearish trend continues, expect the price to possibly head back down to retest the 1st support at 0.92204, slightly above where the 78.6% Fibonacci line is. In an alternative scenario, price could possibly head towards the 1st resistance at 0.93572, where the 78.6% Fibonacci line is.
Areas of consideration
- H4 1st support at 0.92204
- H4 1st resistance at 0.93572
XAU/USD (GOLD):
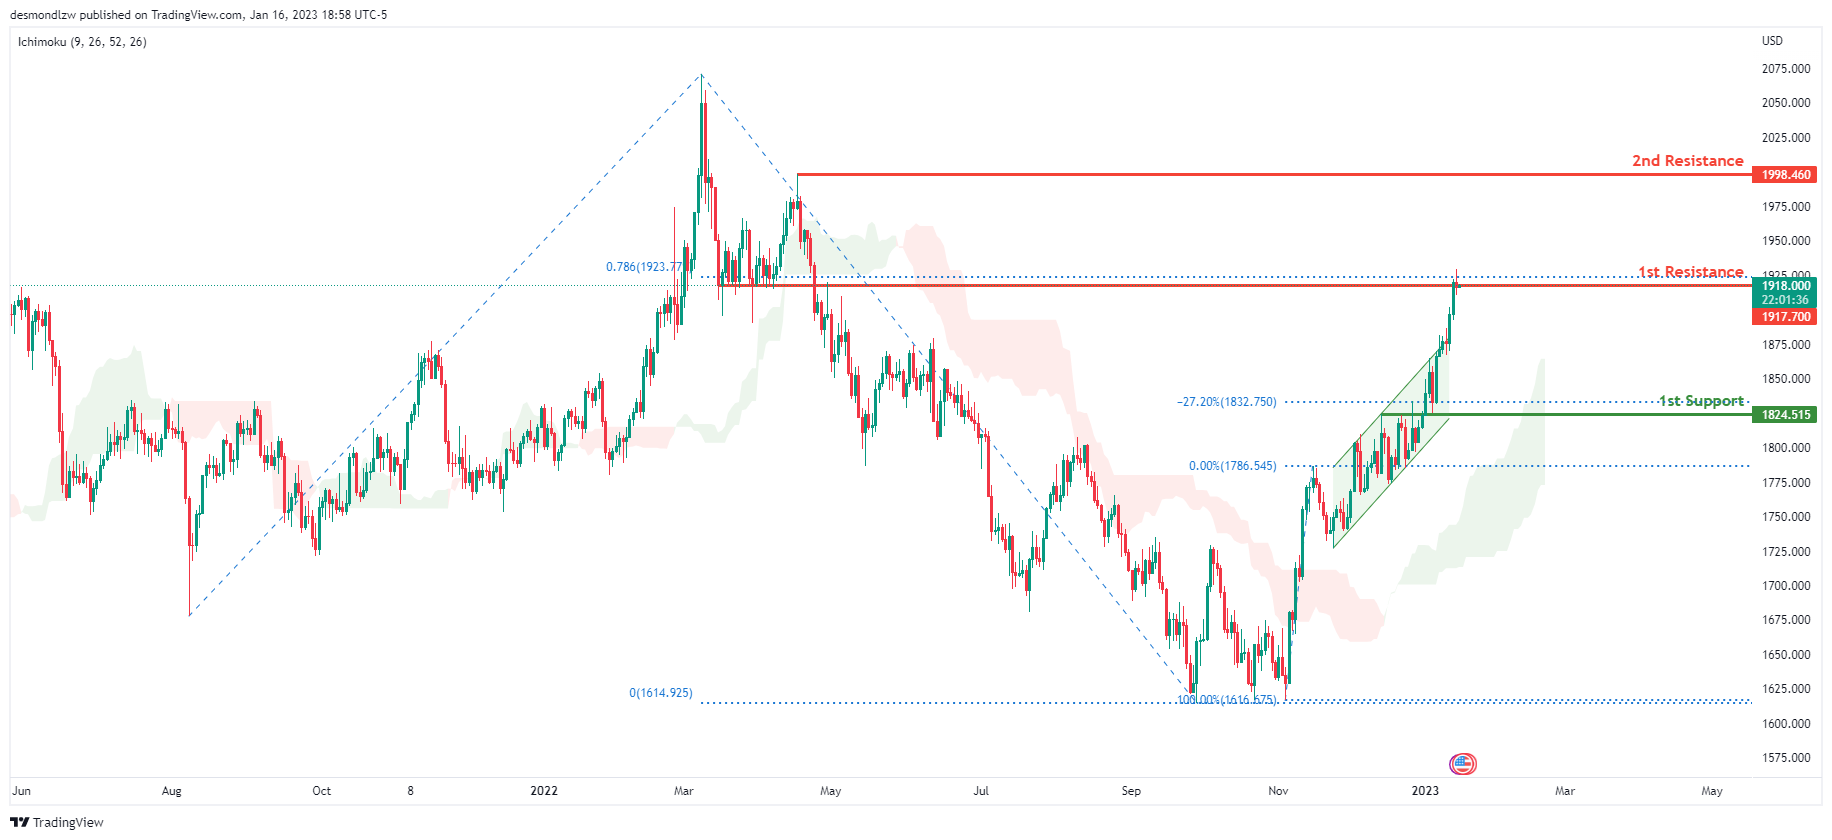
Looking at the Daily chart, my overall bias for XAUUSD is bullish due to the current price crossing above the Ichimoku cloud, indicating a bullish market. To add support to this bias, price has also broken above the bullish ascending channel. If this bullish momentum continues, expect the price to possibly break the 1st resistance at 1917.700 where the 78.6% Fibonacci projection line is, before heading towards the 2nd resistance at 1998.460, where the previous swing high is. In an alternative scenario, price could possibly head back down to retest the 1st support at 1824.515 where the -27.2% Fibonacci expansion line is.
Areas of consideration:
- H4 time frame, 1st resistance at 1917.700
- H4 time frame, 2nd resistance at 1998.460
- H4 time frame, 1st support at 1824.515
- H4 time frame, 2nd support at 1824.515
AUD/USD:
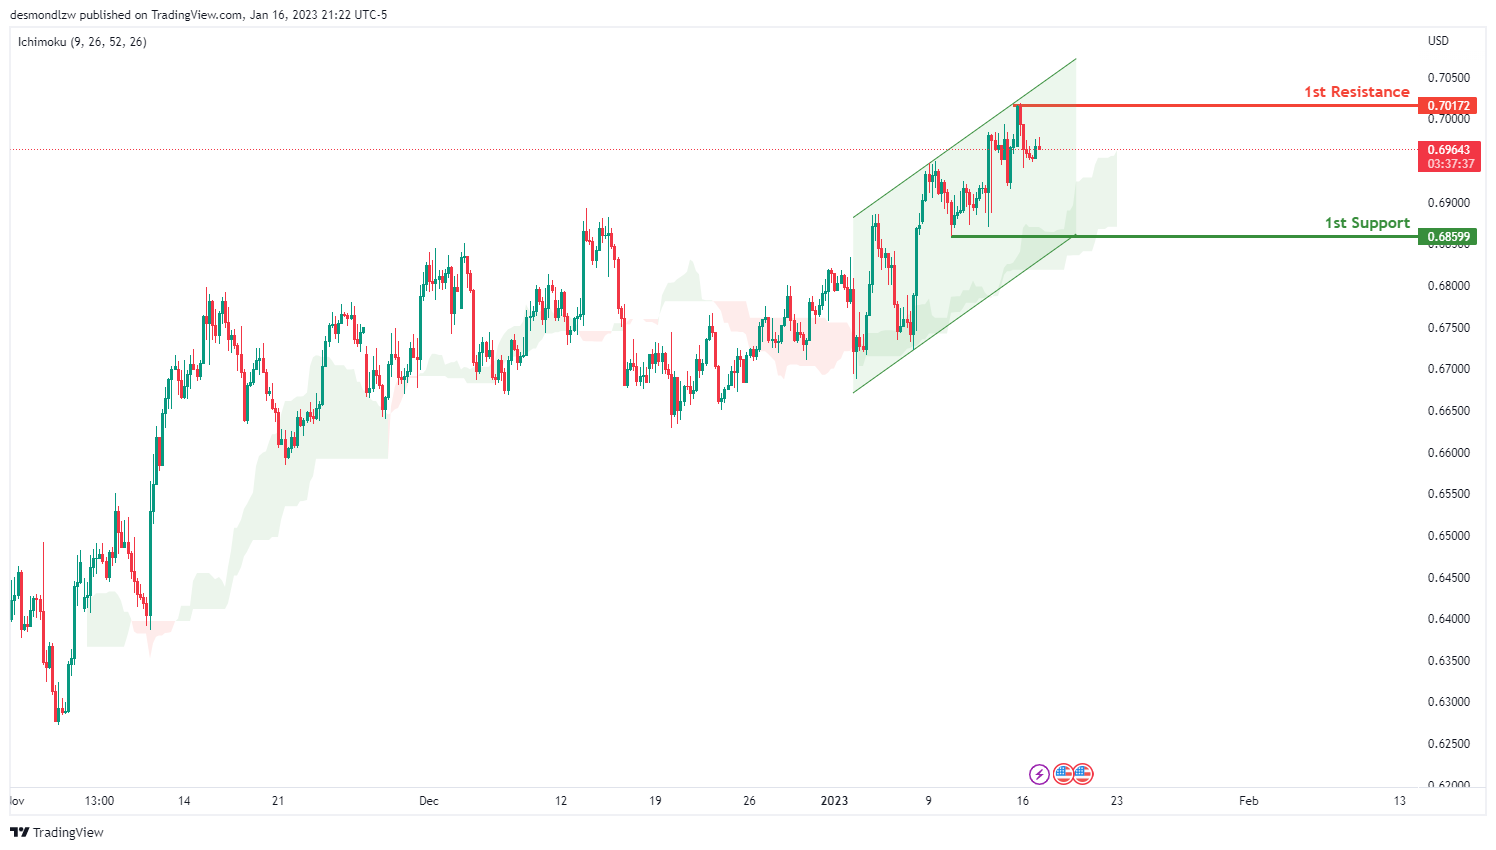
Looking at the H4 chart, we can see that the 1st support is at 0.68599 which is recent swing low .There is an ascending trend line that starts from 3rd JAN 2023 which suggests that there is bullish momentum. Price is also above our Ichimoku cloud suggesting further bullish momentum. 1st resistance is at 0.70172 which is an overlap resistance. 2nd resistance is slightly higher at 0.71381
Areas of consideration
- H4, 1st resistance at 0.70172
- H4, 2nd resistance at 0.71381
- H4, 1st support at 0.68599
NZD/USD:
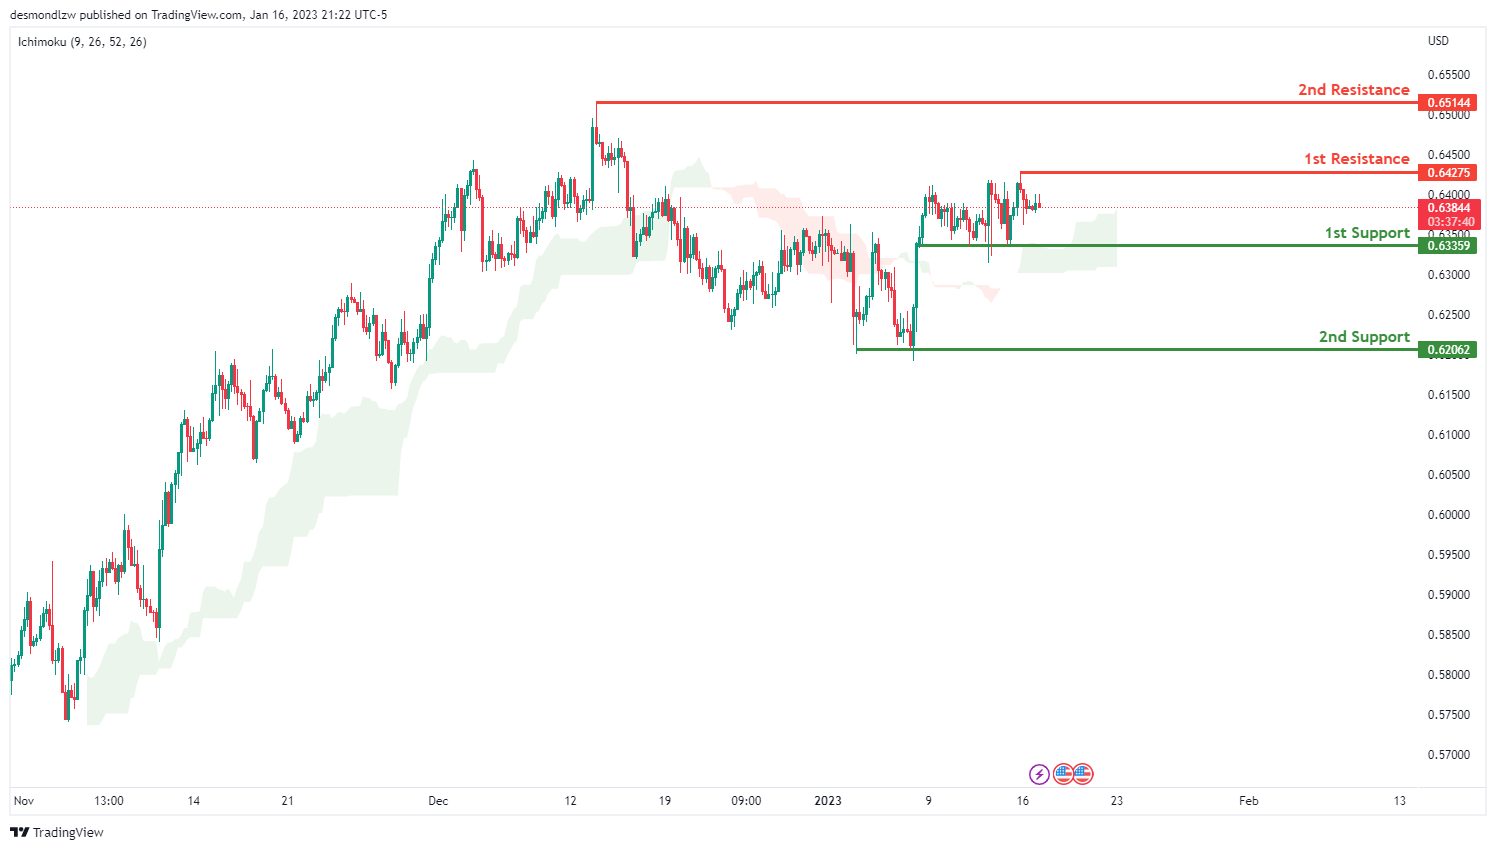
Looking at the H4 chart, we can see that the 1st support is at 0.63359 which is recent swing low. If price breaks this level, we could see it drop to 2nd support down at 0.62062.
For the resistance, our 1st resistance is at 0.64275 which is an recent swing high resistance . If price breaks this level, it could go up to the 2nd resistance at 0.65144 which is the highest price since jun 2022.
Areas of consideration:
- H4 time frame, 1st resistance at 0.64275
- H4 time frame, 2nd resistance at 0.65144
- H4 time frame, 1st support at 0.63359
- H4 time frame, 2nd support at 0.62062
USD/CAD:
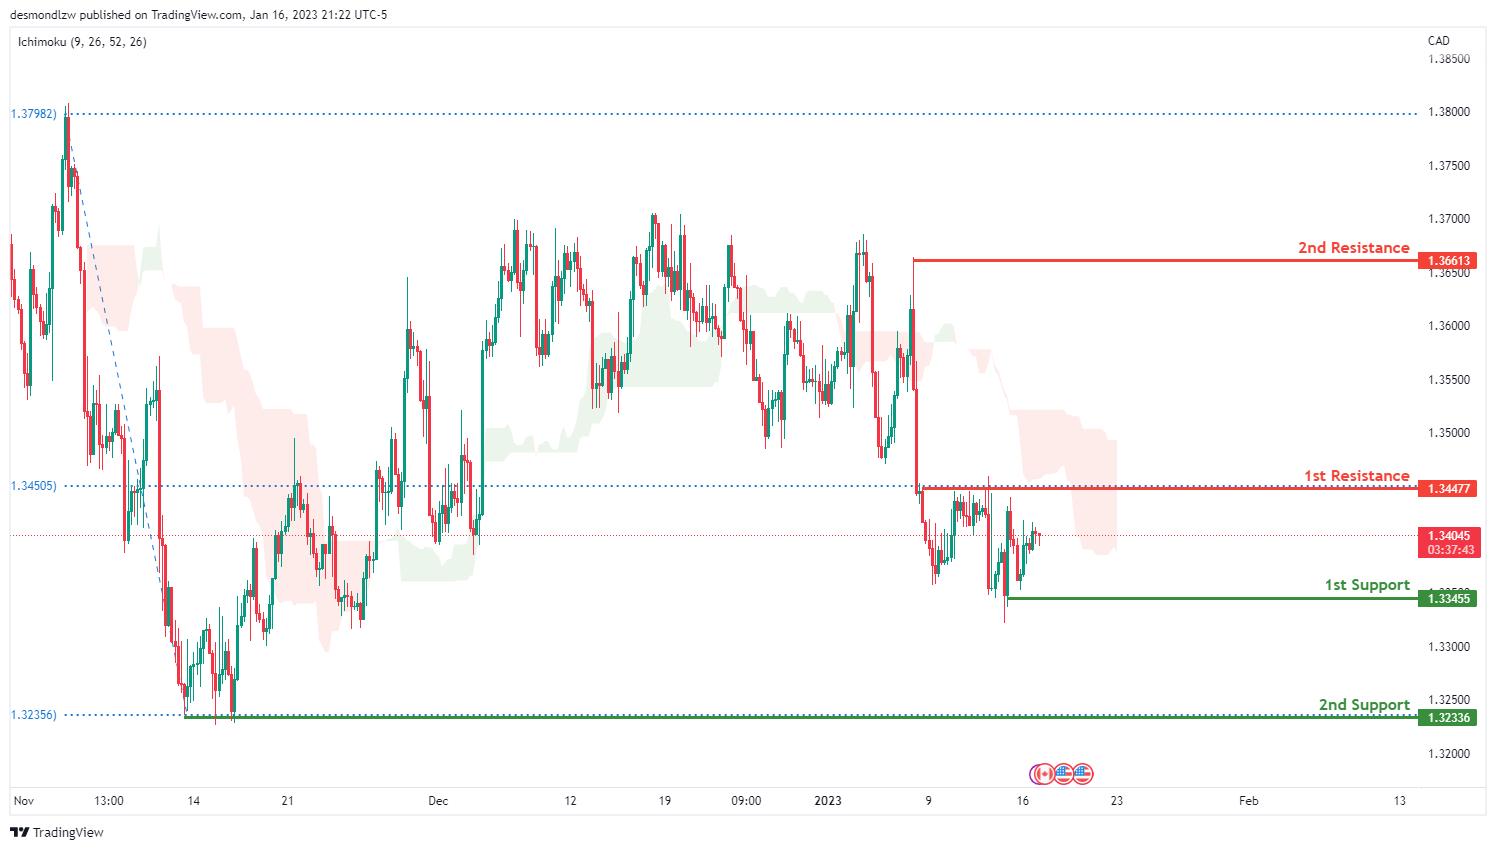
On the H4 chart, we can see price is trying to break the 1st support at 1.33455 which is a swing low support. If price breaks this level, it could drop down to 2nd support at 1.32336 which is a swing low from the 11th November 2022.
In terms of resistance, the 1st resistance we can see is at 1.34477 which is an overlap resistance that happens to coincide with the 38.2% fibonacci retracement. If price breaks this level, it could go up to the 2nd resistance at 1.36613 which is a recent swing high resistance
Areas of consideration:
- H4 time frame, 1st resistance at 1.34477
- H4 time frame. 2nd resistance at 1.36613
- H4 time frame, 1st support at 1.33455
- H4 time frame, 2nd support at 1.32336
OIL:
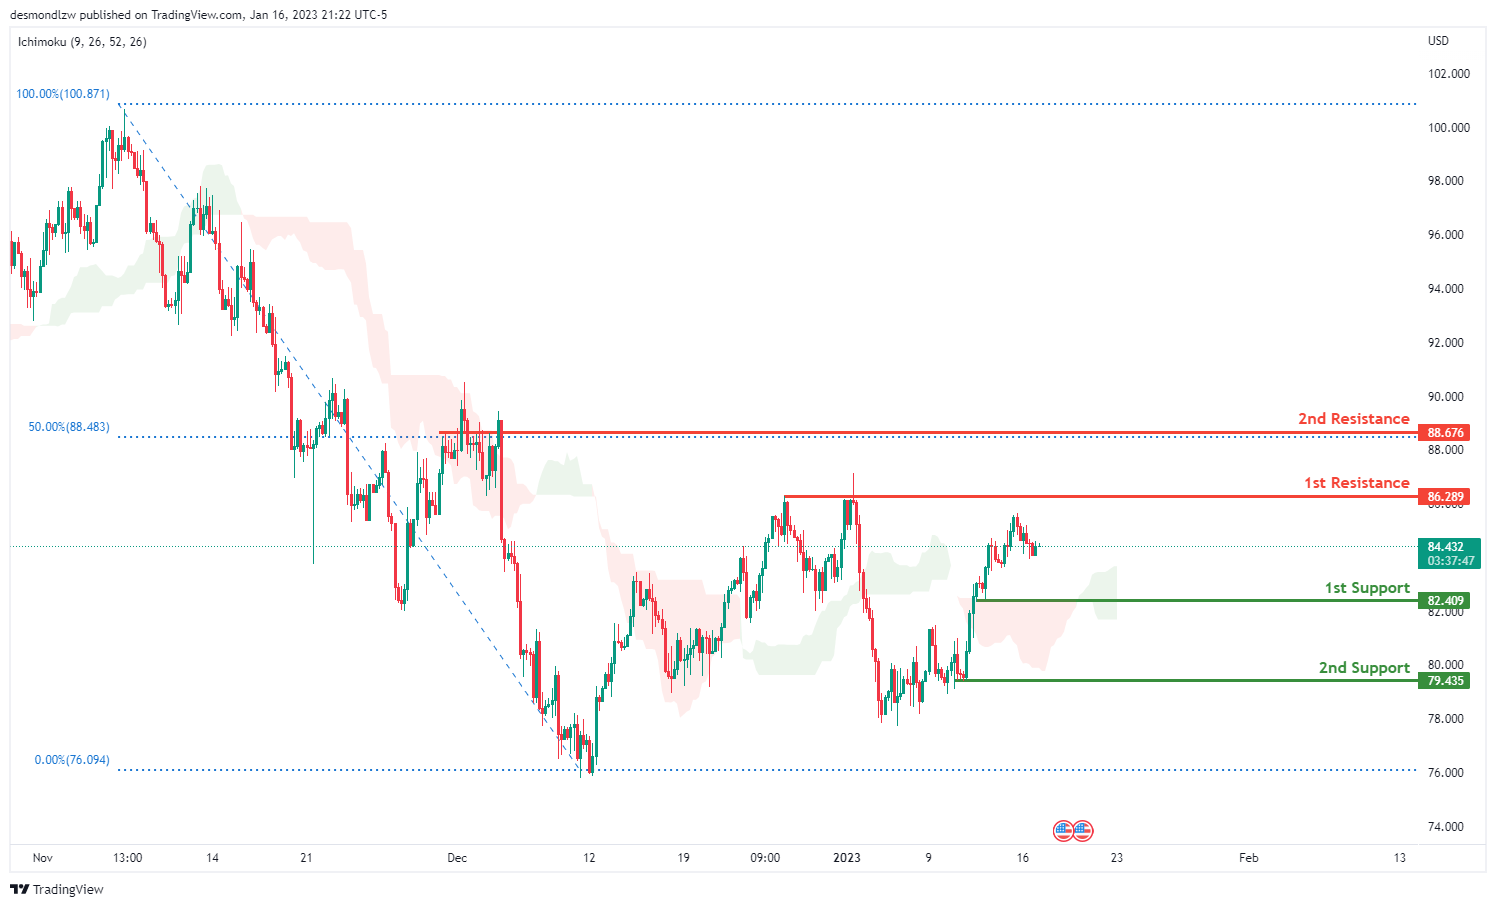
Looking at the H4 chart, we can see that the 1st resistance is at 86.289 If the price breaks this level, we could see the price head up to our 2nd resistance level at 88.676 which is in line with the 50% fibonacci retracement.
In terms of support, we can see our 1st support at 82.409 which is overlap support. Breaking this level would trigger a further drop to our 2nd support at 79.435
Areas of consideration:
- H4 time frame, 2nd resistance at 88.676
- H4 time frame, 1st resistance at 86.289
- H4 time frame,1st support at 82.409
- Hr time frame, 2nd support at 79.435
Dow Jones Industrial Average:
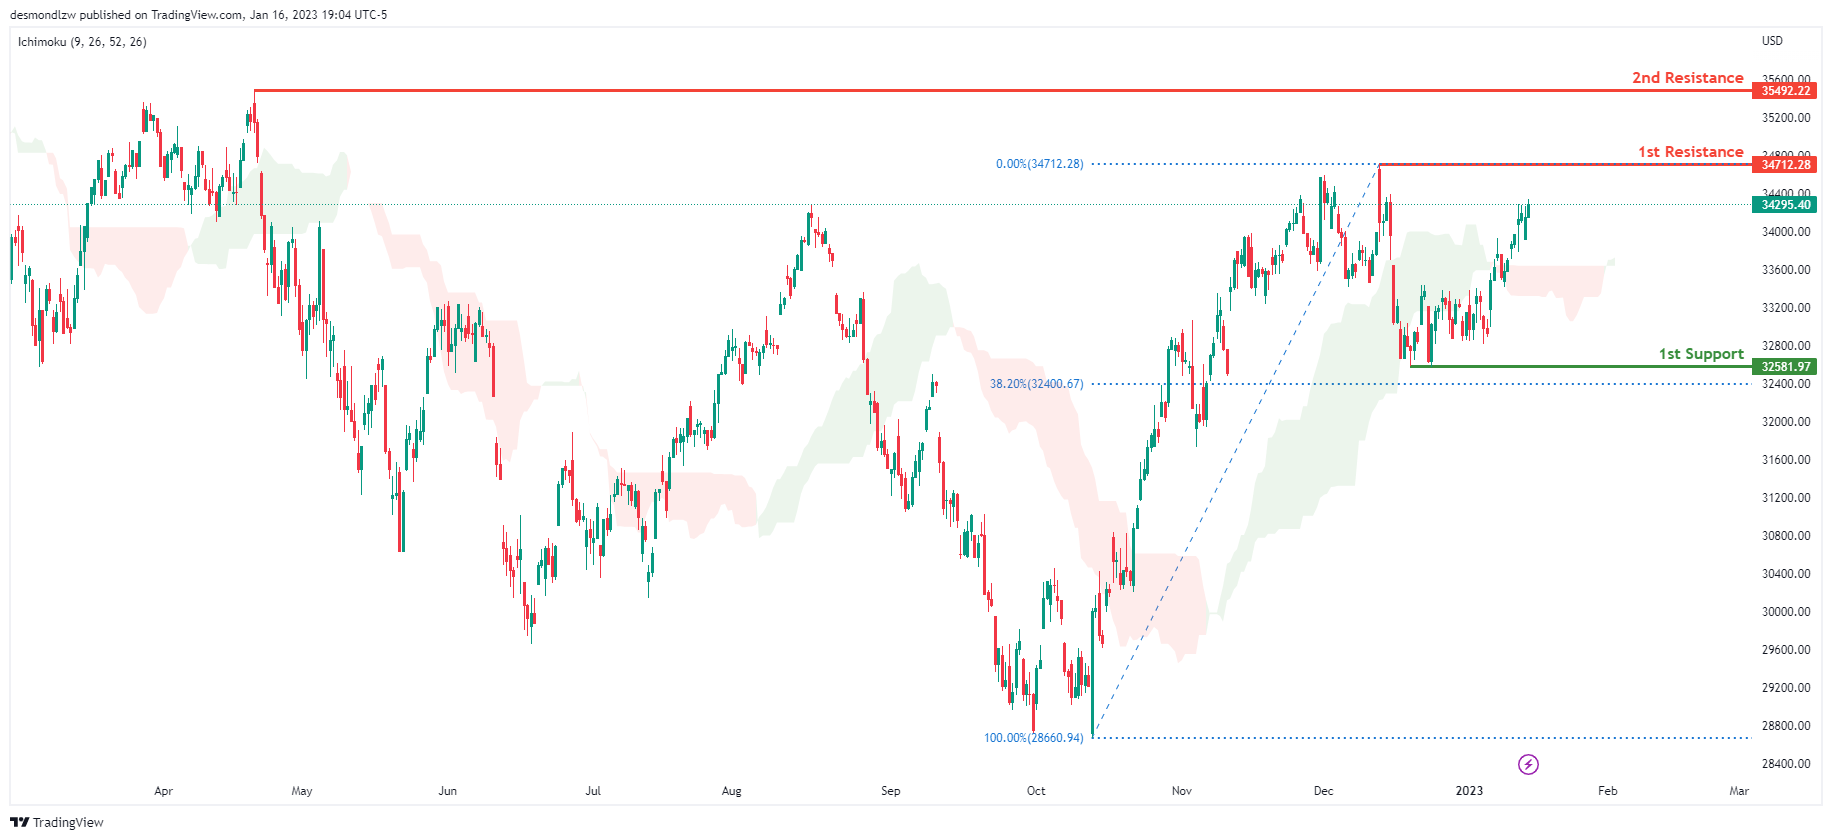
On the H4 chart, the overall bias for DJI is bullish. To add confluence to this, the price is crossing above the Ichimoku cloud which indicates a bullish market. If this bullish momentum continues, expect the price to possibly continue heading towards the 1st resistance line at 34712.28, where the recent swing high is. In an alternative scenario, price could possibly head back down towards the 1st support at 32581.97, slightly above where the 38.2% Fibonacci line is.
Areas of consideration:
- H4 time frame, 1st support at 32581.97
- H4 time frame, 1st Resistance at 34712.28
DAX:
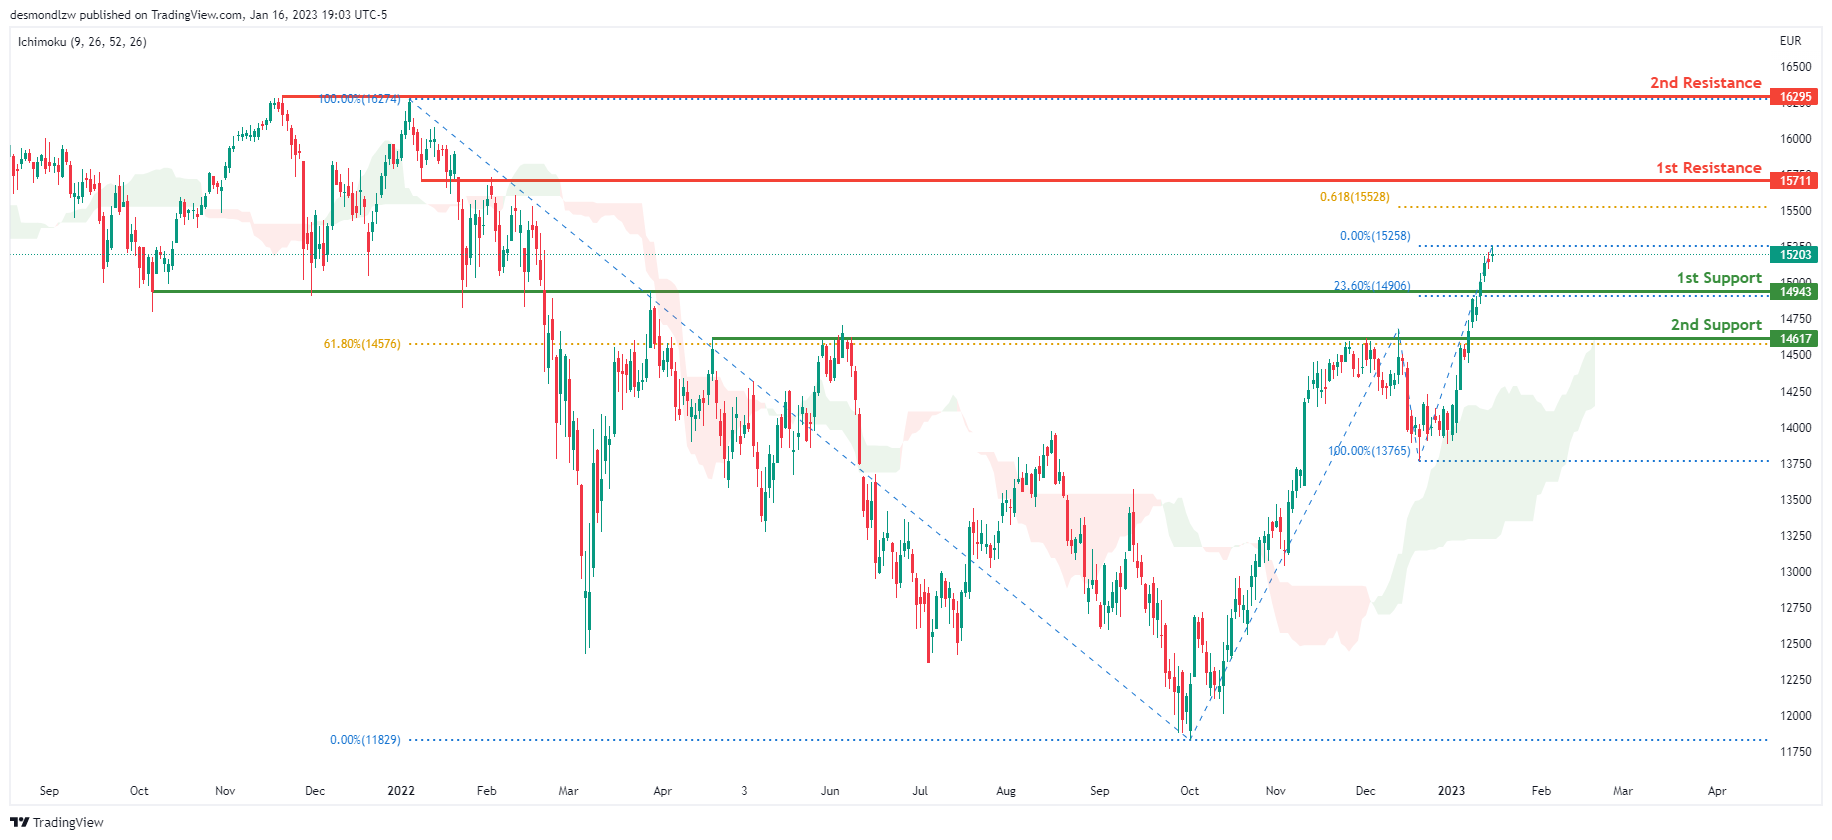
Looking at the Daily chart, my overall bias for DAX is bullish due to the current price crossing above the Ichimoku cloud, indicating a bullish market. If this bullish momentum continues, expect the price to possibly head towards the 1st resistance line at 15711, where the 61.8% Fibonacci projection line is. In an alternative scenario, price could possibly head down to retest the 1st support at 14943, where the 23.6% Fibonacci line is.
Areas of consideration:
- H4 time frame, 1st resistance is at 15711
- H4 time frame, 1st support is at 14943
ETHUSD:
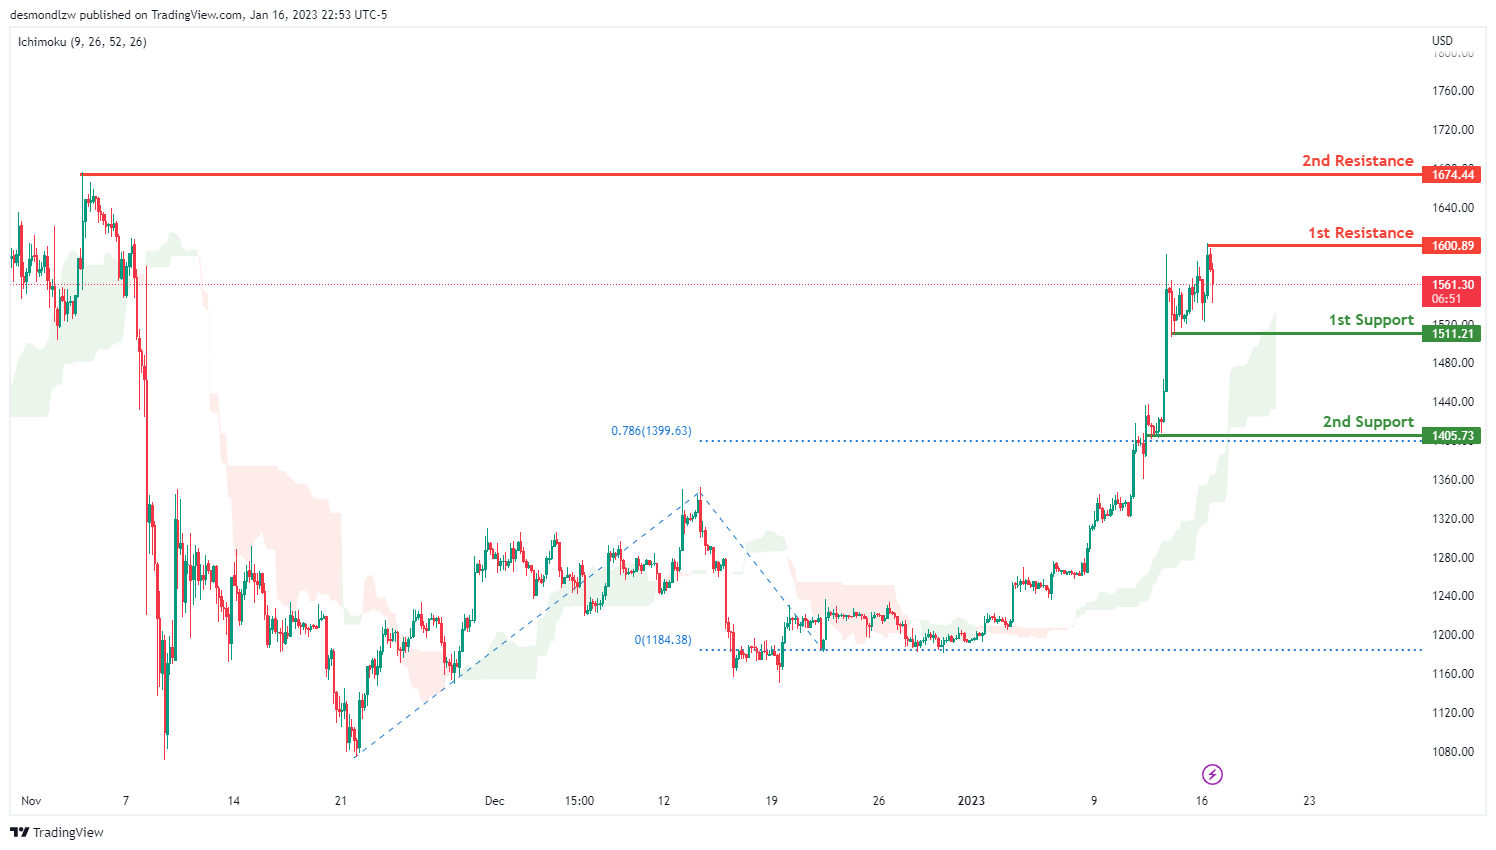
Looking at the H4 chart, my overall bias for ETHUSD is bullish due to the current price crossing above the Ichimoku cloud, indicating a bullish market. If this bullish momentum continues, expect the price to head towards the 1st resistance at 1600.89, where the previous swing high is. In an alternative scenario, the price could head back down to retest the 1st support at 1511.21. If the price break through the 1st support line, the price may further down to the 2nd support line 1405.73 , where is 78.6% Fibonacci extension is.
Areas of consideration:
- H4 time frame, 1st resistance of 1600.89
- H4 time frame, 1st support at 1511.21
- H4 time frame, 2nd support at 1405.73
BTCUSD:
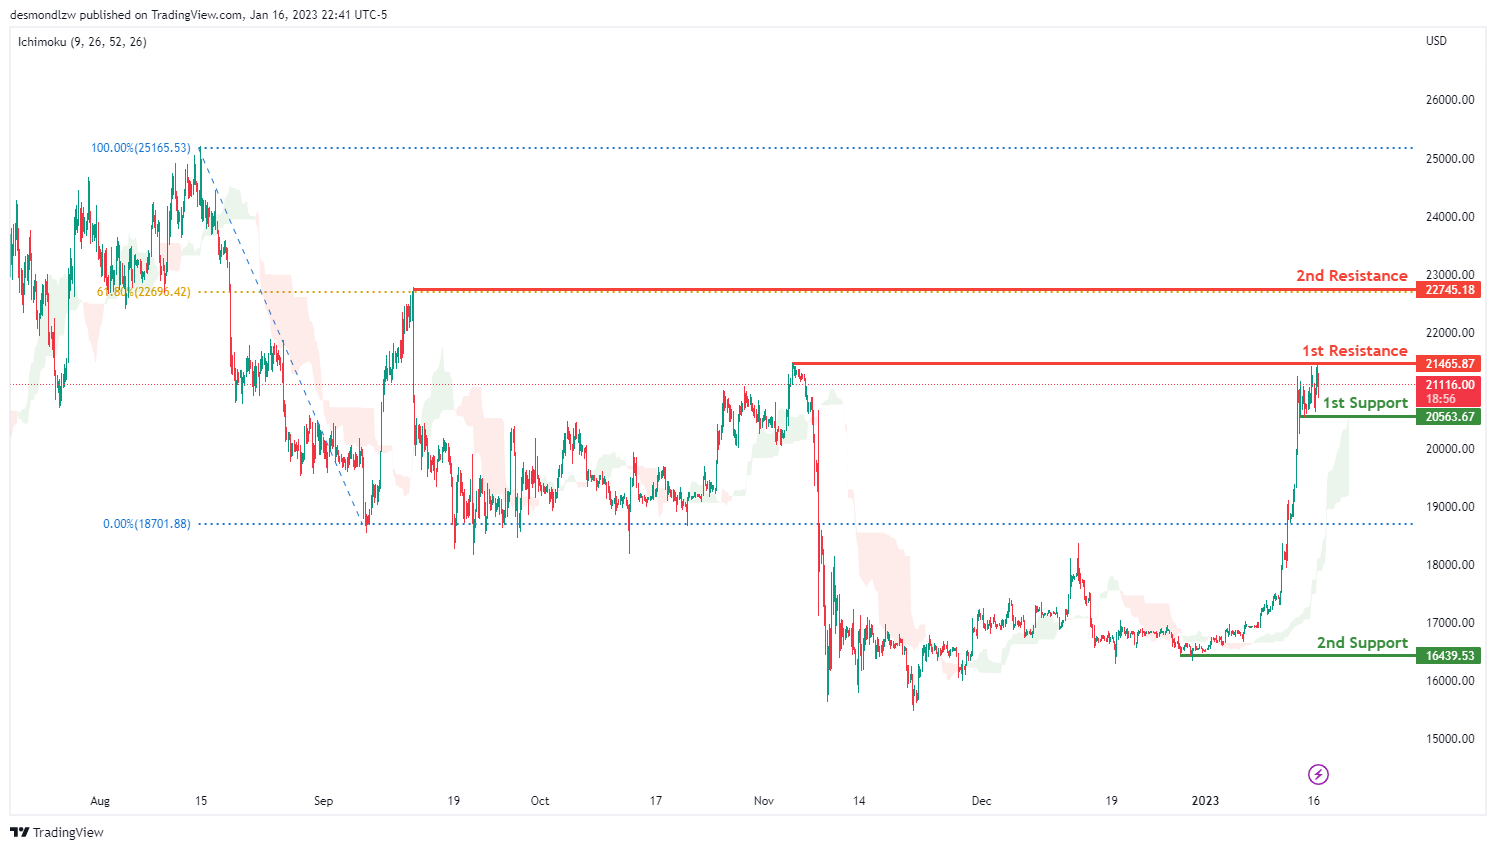
Looking at the H4 chart, my overall bias for BTCUSD is bullish due to the current price being above the Ichimoku cloud, indicating a bullish market. If this bullish momentum continues, expect the price to possibly break the 1st resistance at 21465.87, which is the key level that the price attempts to break, before heading towards the 2nd resistance at 22745.18, where the 61.8% Fibonacci line is. In an alternative scenario, the price could possibly head back down to retest the 1st support at 20563.67.
Areas of consideration:
- H4 time frame, 1st resistance 21465.87
- H4 time frame, 2nd resistance 22745.18
- H4 time frame, 1st support at 20563.67.
S&P 500:
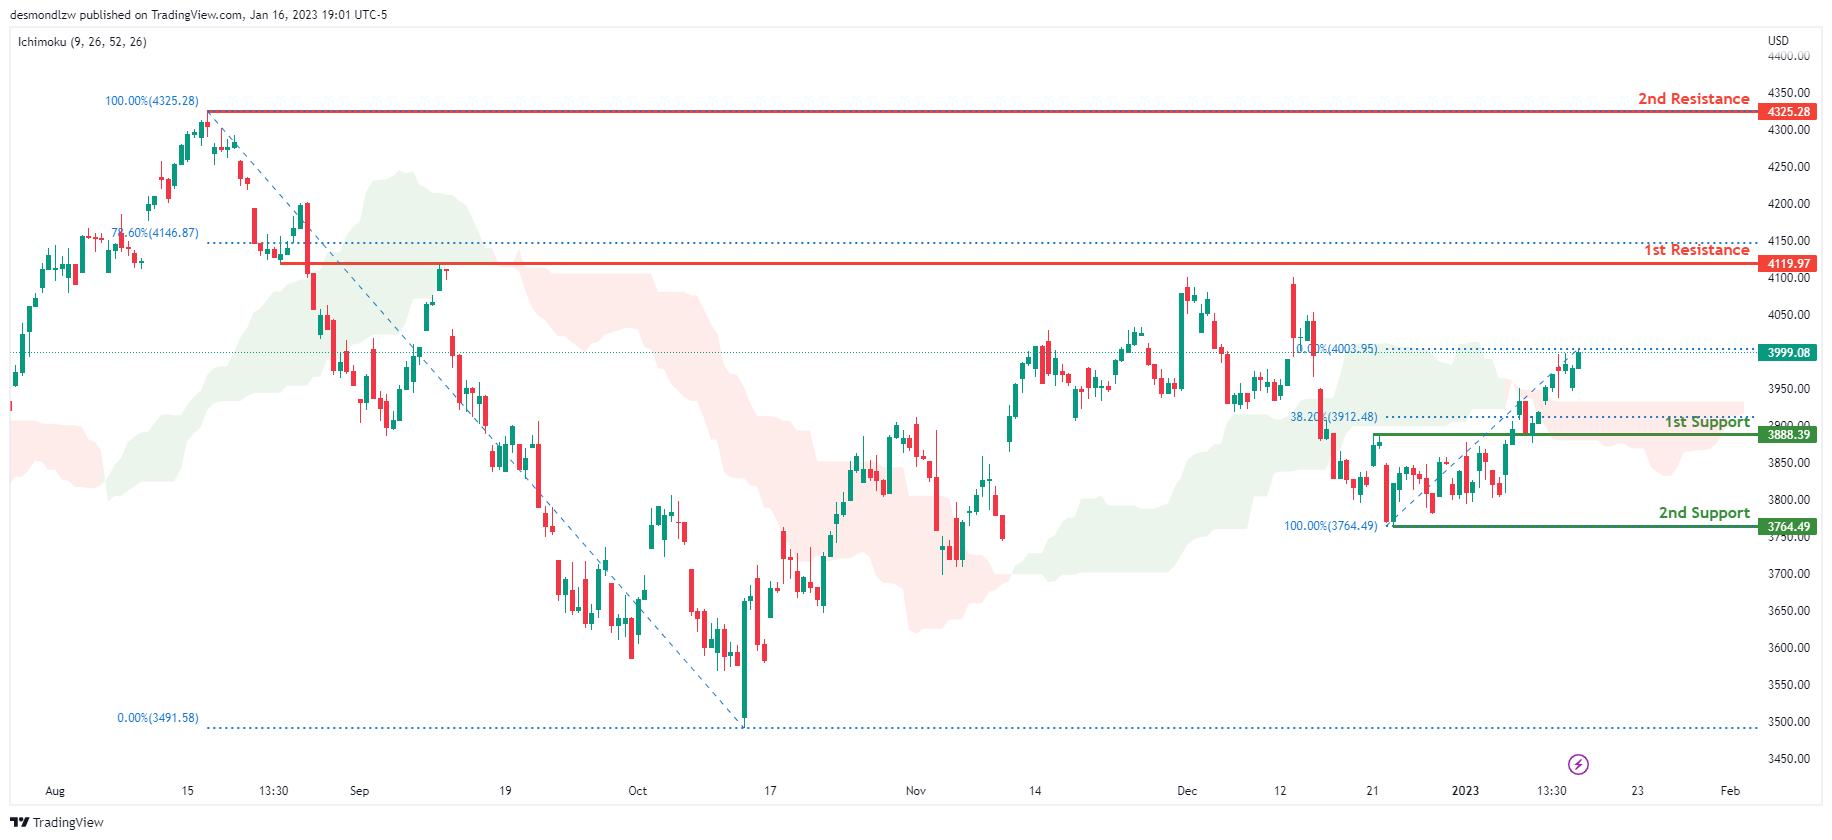
Looking at the H4 chart, my overall bias for S&P500 is bullish due to the current price being above the Ichimoku cloud, indicating a bullish market. If this bullish momentum continues, expect the price to continue heading towards the 1st resistance at 4119.97, where the 78.6% Fibonacci line is. In an alternative scenario, price could possibly head back down to retest the 1st support at 3888.39, where the 38.2% Fibonacci line is.
Areas of consideration:
- H4 time frame, 1st support at 3888.39
- H4 time frame, 1st resistance at 4119.97
China GDP growth slowed to 2.9% yoy in Q4, but beat expectations
China's GDP growth slowed to 2.9% yoy in Q4, down from Q3's 3.9% yoy but beat expectation of 1.8% yoy. For 2022 as a whole, GDP grew 3.0%, sharply lower than 2021's 8.4%, but was better than 2020's 2.2%. That's still the second worst on record nonetheless.
In December, industrial production rose 1.3% yoy, above expectation of 0.3% yoy. Retail sales declined -1.8% yoy, much better than expectation of -9.5% yoy. Fixed asset investment grew 5.1% ytd yoy, above expectation of 5.1%.
"The foundation of domestic economic recovery is not solid as the international situation is still complicated and severe while the domestic triple pressure of demand contraction, supply shock and weakening expectations is still looming," NBS said in a release.
Also released, China's population decreased by -850k in 2022, the first contraction in more than six decades. Birthrate was at 6.77 births per 1000 people, sharply down from 2021's 7.52 births, and marked the lowest level on record. Death rate rose from 7.18 to 7.37 per 1000 people, highest since 1976.
GBP/USD Could Rally Further If It Clears 1.2300
Key Highlights
- GBP/USD started a fresh increase above the 1.2200 resistance.
- It surpassed a major bearish trend line with resistance near 1.2050 on the 4-hours chart.
- EUR/USD might struggle to clear the 1.0920 resistance zone.
- The UK ILO Unemployment rate could remain at 3.7% in Nov 2022 (3M).
GBP/USD Technical Analysis
The British Pound started a fresh increase above the 1.2150 resistance zone against the US Dollar. GBP/USD broke the 1.2200 resistance to move into a positive zone.
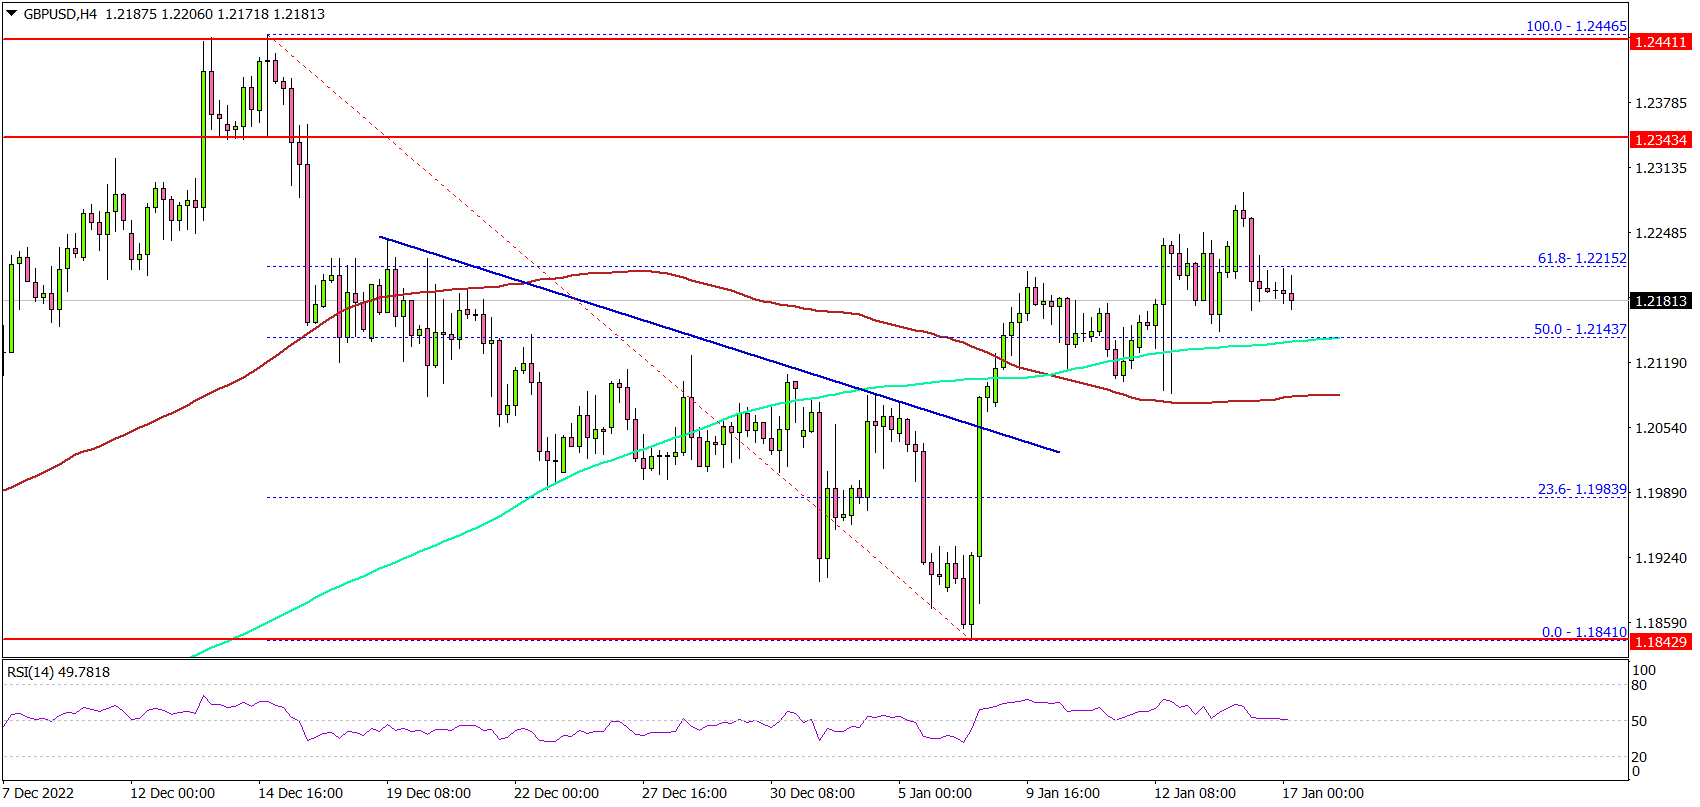
Looking at the 4-hours chart, the pair surpassed a major bearish trend line with resistance near 1.2050. It opened the doors for a move above the 1.2200 resistance, the 100 simple moving average (red, 4-hours) and the 200 simple moving average (green, 4-hours).
There was a clear move above the 50% Fib retracement level of the key decline from the 1.2446 swing high to 1.1841 low. On the upside, an initial resistance is near the 1.2300 level.
The next major resistance may perhaps be near 1.2345. A clear move above the 1.2345 resistance might start a steady increase. In the stated case, GBP/USD could even surpass the 1.2500 zone. The next key hurdle is near 1.2620, above which the pair could climb towards the 1.2800 resistance zone.
On the downside, there is a major support at 1.2120. The next major support is near the 1.2050 level. A downside break below the 1.2050 zone might push the pair lower.
The next major support sits near the 1.2000 level. Any more losses might open the doors for a move towards the 1.1850 support zone.
Looking at EUR/USD, the pair is struggling to gain pace for a clear move above a key barrier near the 1.0920 resistance.
Economic Releases
- UK Claimant Count Change for Dec 2022 – Forecast 11.0K, versus 30.5K previous.
- UK ILO Unemployment Rate for Nov 2022 (3M) – Forecast 3.7%, versus 3.7% previous.
Australia Westpac consumer sentiment rose 5% in Jan
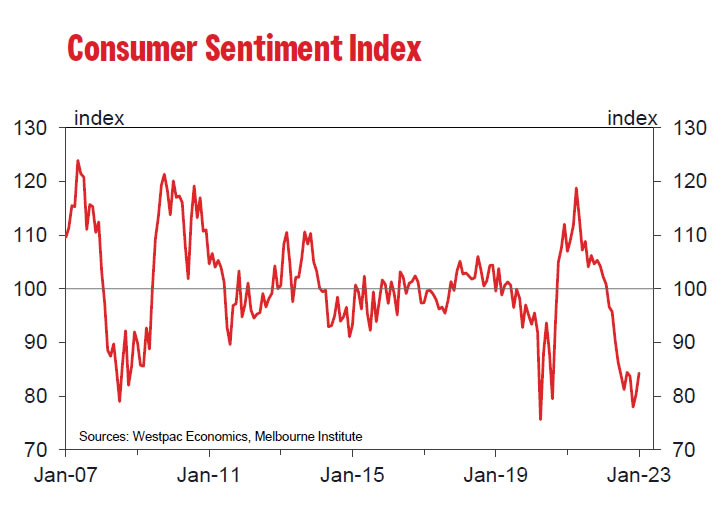
Australia Westpac Consumer Sentiment rose 5.0% mom to 84.3 in January, the largest monthly gain since April 2021. It's also the second straight month of improvement, with combined rise of 8.1%. Current Conditions index rose 2.8% mom while Expectations Index rose 6.3% mom. Unemployment Expectations also improved 8.4% mom.
Westpac said: "One likely explanation for the lift in confidence is that January was the first month since April last year that did not see an increase in the RBA cash rate. While that was because there was no RBA Board meeting in the month rather than an explicit decision by the Bank to leave rates unchanged, the break in the tightening cycle looks to have provided some relief."
Regarding RBA rate decision, Westpac expects another 25bps hike on February. It also expects clear message from RBA that the February increase will not be the last in the tightening cycle, because of a lift in annual inflation, strong retail sales growth and ongoing tight labor market.
NZ NZIER business sentiment hit record low
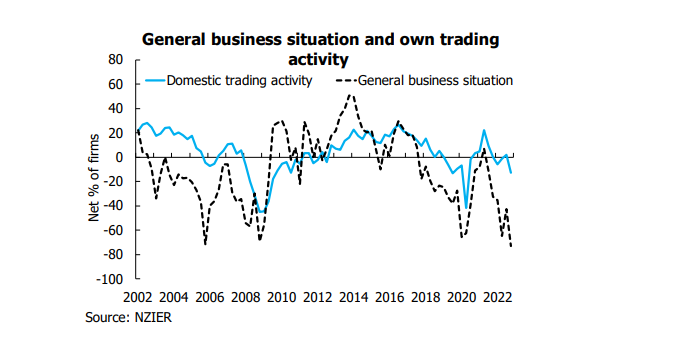
New Zealand NZIER Quarterly Survey of Business Opinion showed, in Q4 on a seasonally adjusted basis, a net 73% of businesses expect general economic conditions to deteriorate over the coming months. That's the worst level in the survey's history.
A net 13% of businesses reported a decline in their own activity over the past quarter, worst since Q2 2020 during the full impact of the first pandemic lockdown. A net 33% expected decline in activity in the coming quarter.
"Firms have also reduced investment plans substantially, particularly when it comes to investment in buildings," NZIER said. Retail businesses were feeling "very downbeat", it found.
BoE Bailey: Labor force shrinkage the major risk to UK inflation
BoE Governor Andrew Bailey told a parliamentary committee yesterday that inflation could fall back substantially this year. Still, there are risks from labor shortage and China.
"The biggest single reason inflation has risen to that level is the war in Ukraine. It is also the most likely reason that we're going to see a rapid fall in inflation in the year ahead, because we are not seeing energy prices rising further. In fact, they're coming down," he said.
"Going forwards, the major risk to inflation coming down in the way that it will is the supply side," Bailey said. "In this country particularly the question of the shrinkage of the labor force," which has pushed up wages.
"First of all in the economic outlook it think it's quite likely we will see a negative impact in the short run in China from what's going on at the moment from the release of the Covid restrictions and the impact that's having," Bailey said. "I'm not sure that would be very long lasting."
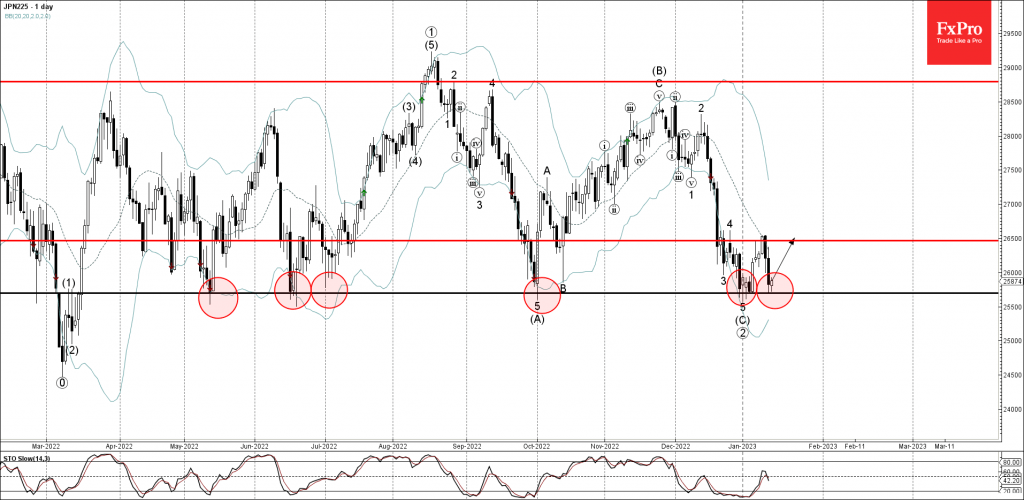
Nikkei 225 Index Wave Analysis
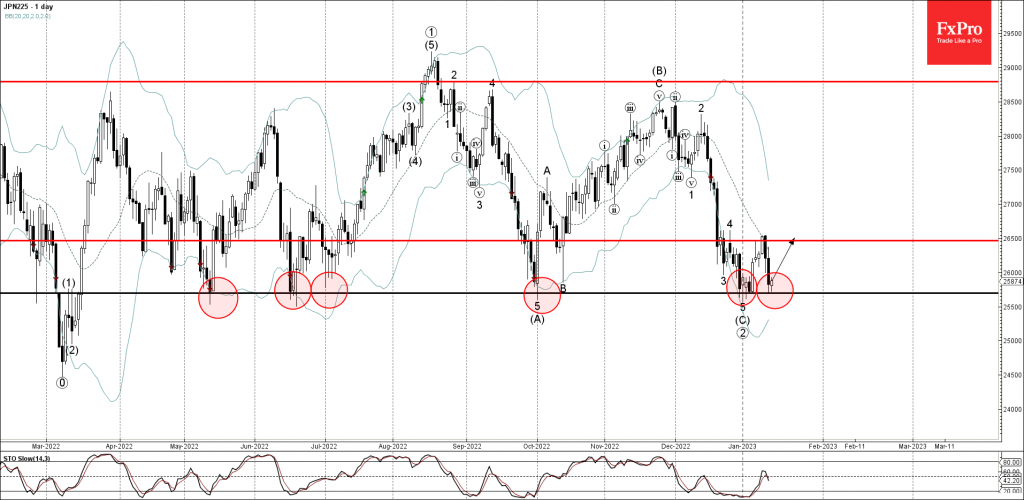
- Nikkei 225 reversed from key support level 25695.00
- Likely to rise to resistance level 26500.00
Nikkei 225 index recently reversed up from the key support level 25695.00 (which has been repeatedly reversing this index from last May).
The upward reversal from the support level 25695.00 continues the active long-term upward impulse wave ③, which also previously started from the same support level.
Nikkei 225 index can be expected to rise further toward the next resistance level 26500.00 (which has been reversing the index from the end of December).
NZDJPY Wave Analysis
- NZDJPY reversed from key support level 81.35
- Likely to rise to resistance level 82.60
NZDJPY currency pair recently reversed up from the key support level 81.35 (which is the lower border of the wide sideways price range inside which the pair has been moving from September).
The support level 81.35 was further strengthened by the lower daily Bollinger Band.
Given the strength of the support level 81.35, NZDJPY can be expected to rise further toward the next resistance level 82.60 (former support level which stopped wave A at the end of last month).