Sample Category Title
EUR/USD Drifting, Eurozone Inflation Next
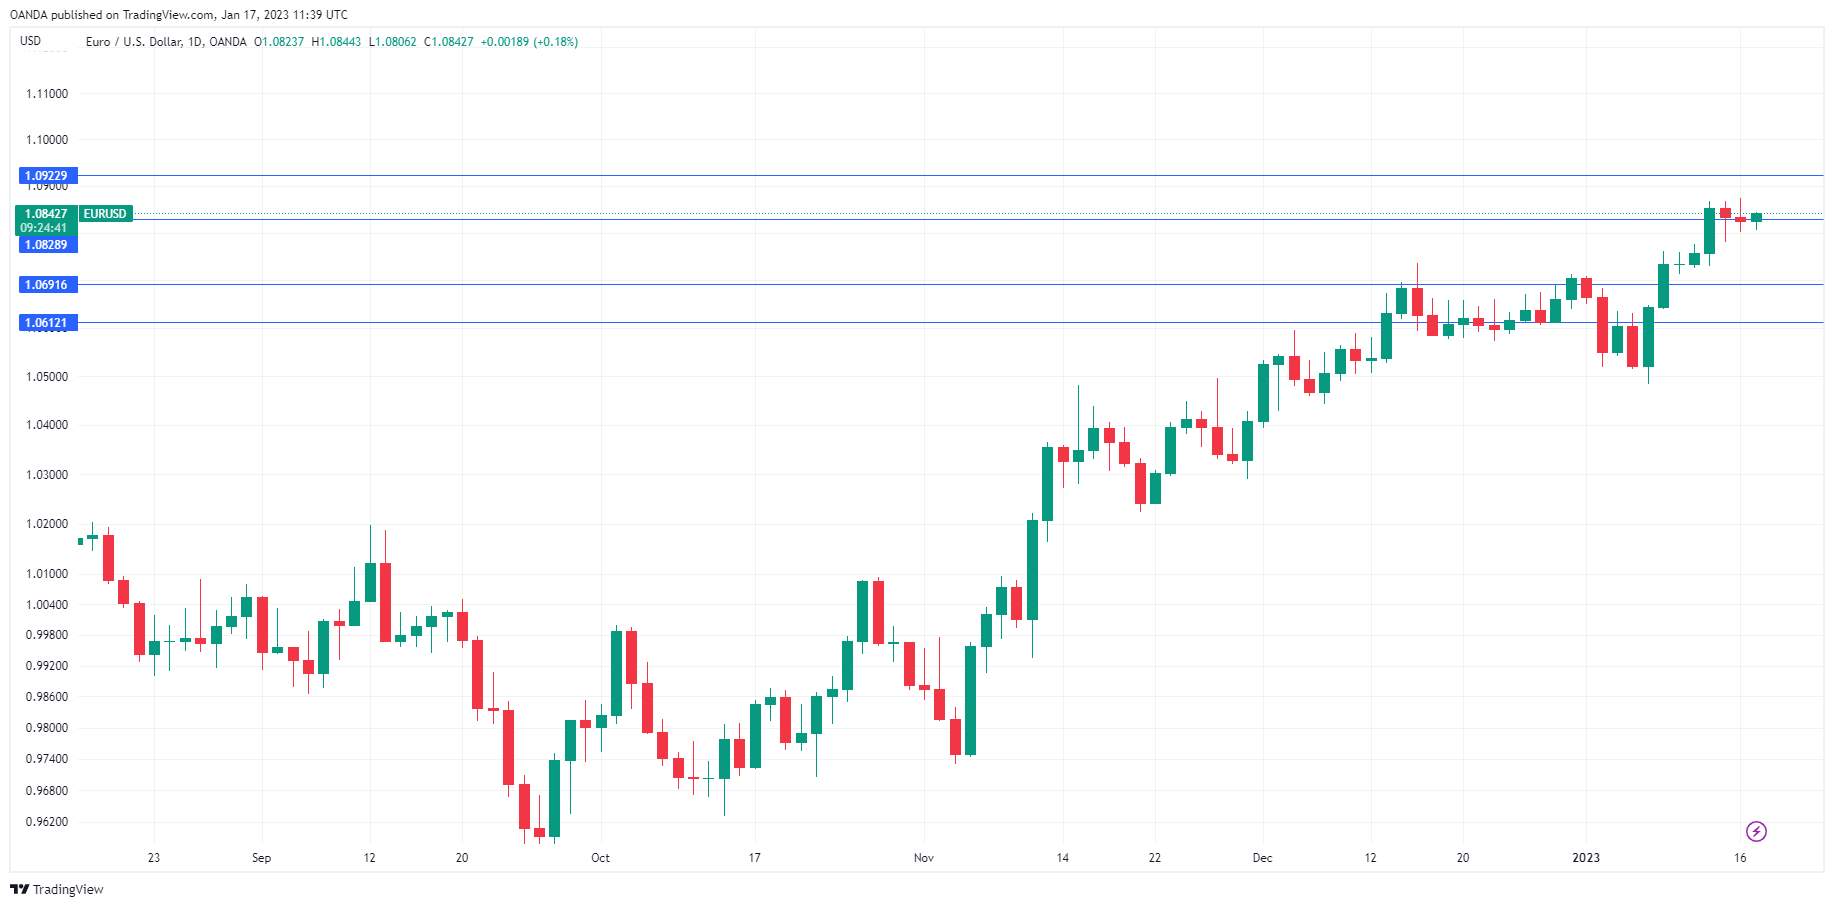
The euro continues to drift this week and is trading close to the 1.0820 line. This follows last week’s sharp gains of 1.8%.
German inflation falls – will eurozone follow suit?
German Final CPI came in at -0.8% m/m in December, matching the forecast and unchanged from November. The annual average in 2022 was 7.9%, compared with just 3.1% in 2021. No big surprise here – inflation soared in 2022, driven mainly by the extreme rise in energy and food prices due to the war in Ukraine. Inflation climbed to 10.4% y/y in October but has been falling and dropped to 8.6% in December. The downtrend is expected to continue into 2023, as energy prices have fallen and the government has introduced relief measures such as fuel discounts.
This sets the stage for the Eurozone inflation release on Wednesday. Inflation has been falling, but the forecast has inflation remaining steady in December: 9.2% for headline inflation and 5.2% for the core rate. The economic outlook for the bloc has also improved. Last week, Goldman Sachs revised upwards its 2023 GDP forecast for the eurozone from -0.1% to a small gain of 0.6%. The sunnier outlook has lifted confidence numbers. Germany’s ZEW Economic Sentiment improved to 16.9 in January, up from -23.3 in December and above the consensus of -15.5 points. The eurozone release had similar numbers, pointing to stronger confidence.
The ECB is no doubt pleased to see stronger data but is unlikely to change its hawkish stance, which includes further rate hikes in the coming months. Inflation may have peaked, but it remains much higher than the ECB’s target of 2%, and the central bank will not pivot until inflation has dropped further, even if that means a recession in the eurozone. Like other central banks, the ECB wants to avoid, at all costs, inflation expectations becoming unanchored, which would complicate its efforts to reduce inflation.
EUR/USD Technical
- EUR/USD is testing resistance at 1.0829. Above, there is resistance at 1.0921
- 1.0691 and 1.0612 are supporting support
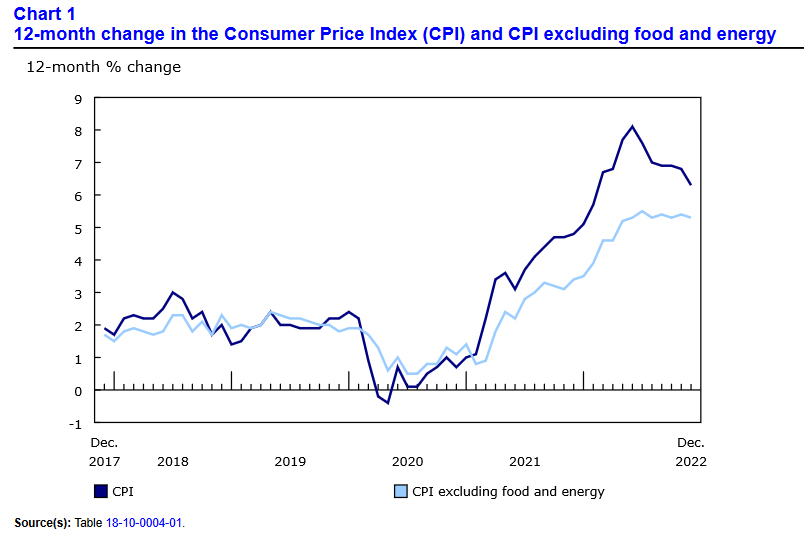
Canada CPI slowed to 6.3% yoy, core down to 5.3% yoy
Canada CPI slowed from 6.8% yoy to 6.3% yoy in December, matched expectations. Excluding food and energy, CPI Core slowed from 5.4% yoy to 5.3% yoy.
CPI median dropped from 5.1% yoy to 5.0% yoy, above expectation of 4.9% yoy. CPI trimmed dropped from 5.4% yoy to 5.3% yoy, above expectation of 5.2% yoy. CPI common dropped from 6.8% yoy to 6.6% yoy, matched expectations.
On a monthly basis, CPI dropped -0.6% mom, largest monthly decline since April 2020. The fall was mostly driven by gasoline prices, which also posted their largest monthly decline since April 2020.
USD/JPY – Calm Before the Storm?
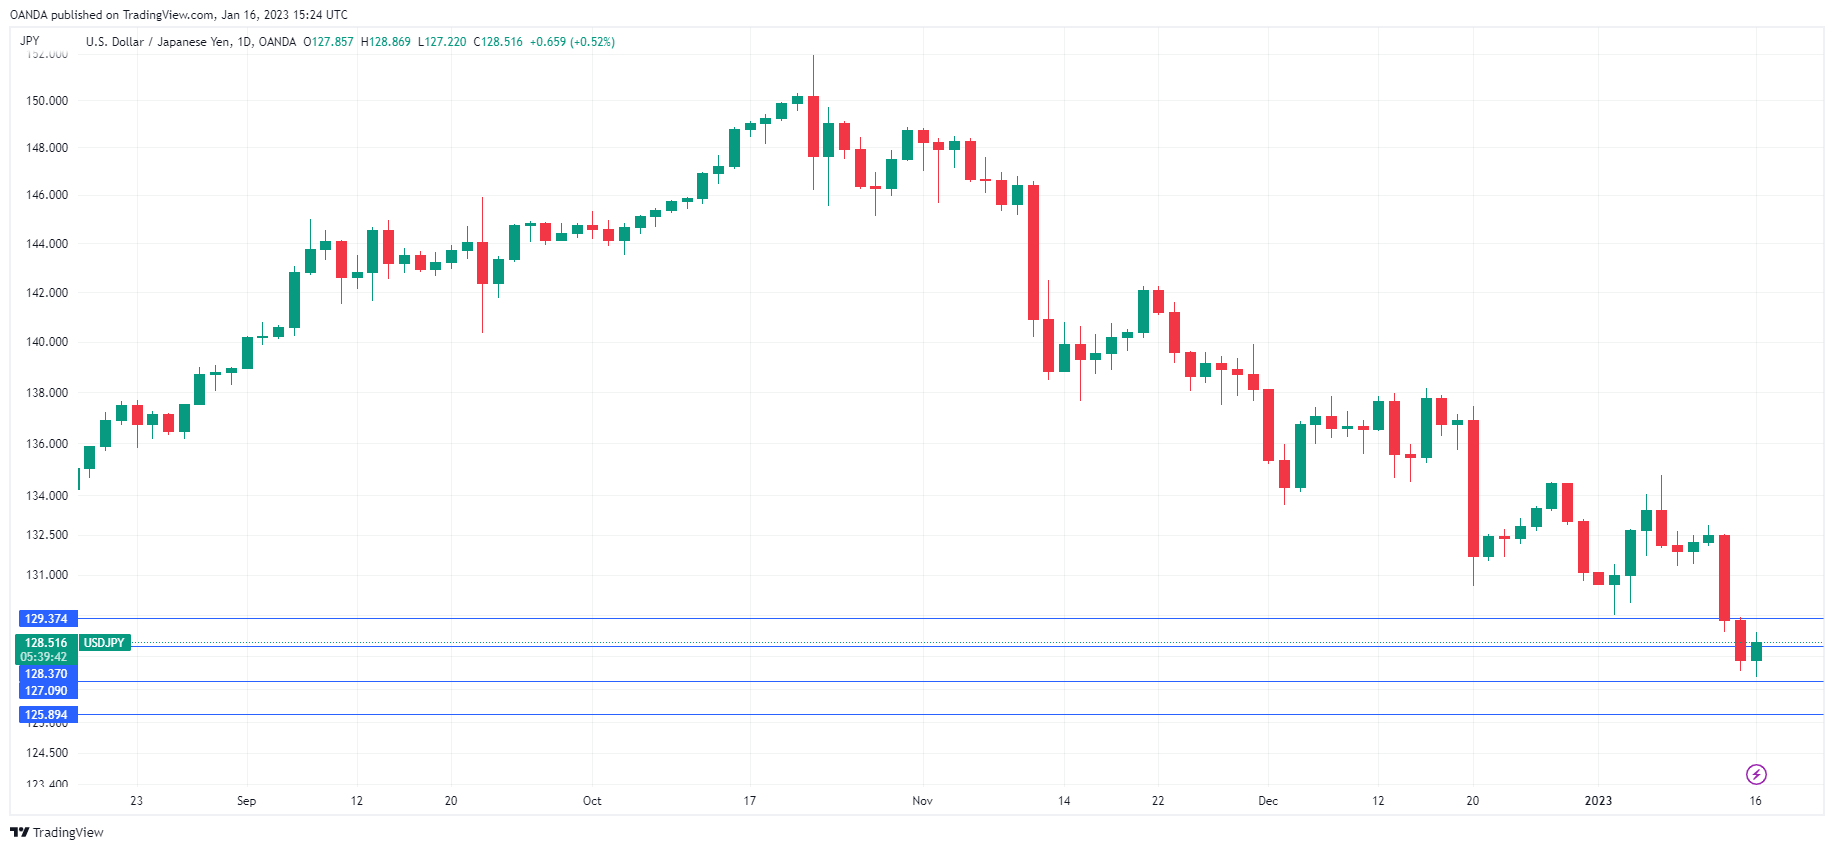
The Japanese yen is in calm waters on Tuesday, as the Bank of Japan’s two-day meeting starts today. In the European session, USD/JPY is trading at 128.76, up 0.18%.
Markets eye BOJ meeting
The markets are keeping a close eye on the BOJ meeting. The central bank shocked the markets at the December meeting with a policy tweak that widened the bank around 10-year JBs to 0.50%, up from 0.25%. The speculation that the BOJ could follow through with additional moves at this meeting has pushed USD/JPY back below the 130 level. On Monday, USD/JPY touched 127.21, its lowest level since May.
It seems likely that further moves are coming from the BOJ, but it’s unclear whether the BOJ will announce the changes on Wednesday or will wait until the new BOJ Governor takes over in April. Unlike the Fed, the BOJ appears to have no interest in telegraphing its plans and is keeping mum, which is making this meeting that much more dramatic. I expect to see some volatility from USD/JPY on Wednesday – if the BOJ does make any policy tweaks, the yen will likely continue to improve. Conversely, if the BOJ maintains the status quo, traders will be disappointed at the lack of action and the yen would likely lose ground.
The BOJ has spent over six trillion yen ($86 billion) since Friday to defend its new 0.50% cap on 10 JGB, as sellers continue to flood the bond market. The central bank could widen the band to 0.75% or make a radical change and discard its yield curve control altogether. Let’s not forget that the BOJ is expected to increase its inflation forecast at the meeting, which would mark a step closer to normalization and would be bullish for the yen.
USD/JPY Technical
- There is resistance at 129.40 and 130.82
- 128.40 and 127.54 are providing support
EURUSD Renewed Its Highs
EUR/USD starts this new week of January in a strong position. It is mainly fluctuating near 1.0855, which is very close to five-month highs. After the market got at hand some facts about a slow-down of the US inflation, dollar got under fierce attacks. This time, investors abandoned the "but on rumors, sell on facts" strategy and went on getting rid of the USD.
Market participants suppose that some positive signals from the background will let the Fed launch the final phase of the tight monetary policy.
Investors estimate the increase in the interest rate, expected by the market in February, as 25 base points. This is forecast by almost 92% of the poll participants.
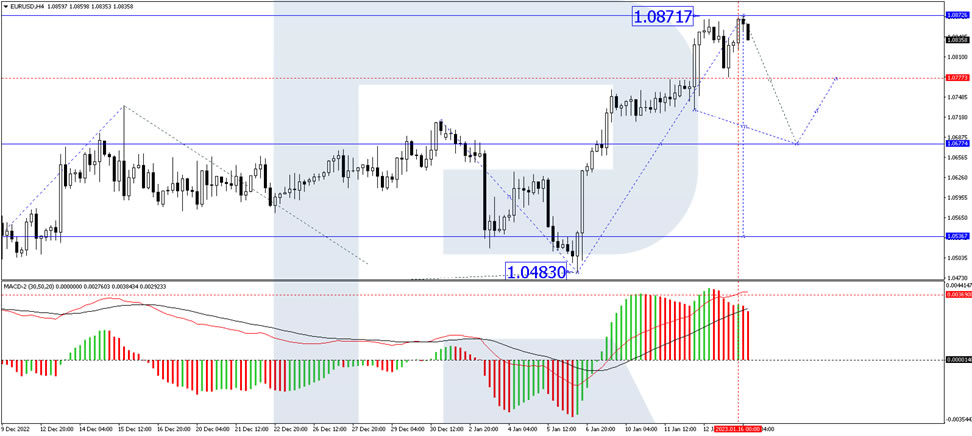
On H4, EUR/USD has completed a wave of growth to 1.0871. Today the market is forming an impulse of decline to 1.0777. Practically, a consolidation range is likely to develop at these levels. With an escape downwards, a wave of decline should continue to 1.0677. Technically, this scenario is confirmed by the MACD: its signal line is at the highs, getting ready for a decline to zero.
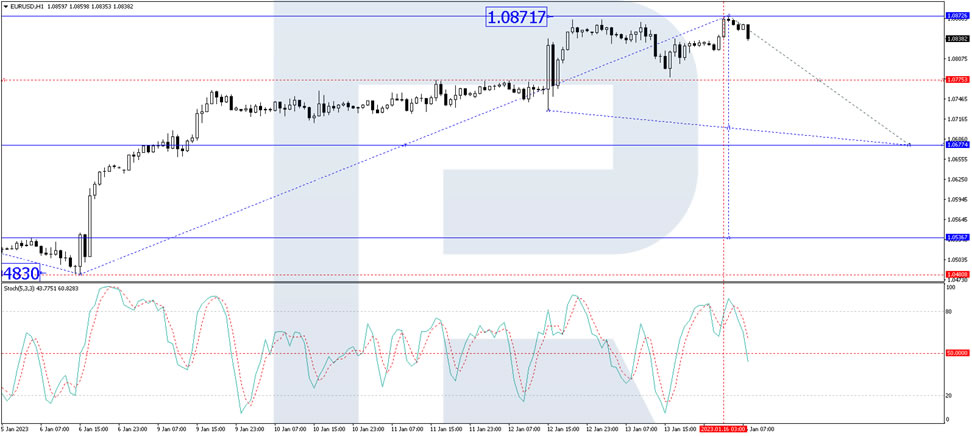
On H1, the pair has formed a structure of a wave of growth to 1.0872. Today the market is developing the first wave of decline to 1.0775. After this level is reached, a link of correction to 1.0808 is not excluded, followed by a decline to 1.0677. Technically, this scenario is confirmed by the Stochastic oscillator. Its signal line is above 80. A decline to 50 is expected. With a breakaway downwards here, a pathway for 20 will open.
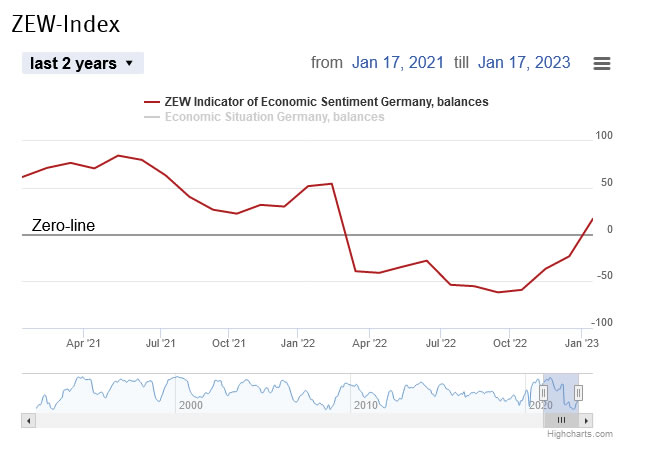
Germany ZEW jumped to 16.9, positive again after a year
Germany ZEW Economic Sentiment jumped sharply from -23.3 to 16.9 in January, well above expectation of -15.5. That's also the first positive reading in a year since February 2022. Current Situation improved from -61.4 to -58.6, below expectation of -57.0.
Eurozone ZEW Economic Sentiment surged from-23.6 to 16.7, well above expectation of -14.3. Current Situation rose 2.6 pts to -54.8.
ZEW President Professor Achim Wambach said: "The ZEW Indicator of Economic Sentiment signals a positive outlook again in January. For the first time since February 2022, the month in which the war in Ukraine began, the indicator points to a noticeable improvement in the economic situation over the next six months.
"The more favourable situation on the energy markets and the German government's energy price caps have contributed to this in particular. In addition, export conditions for the German economy are improving due to China's lifting of Covid-restrictions.
"Accordingly, the earnings expectations of the export-oriented and energy-intensive sectors have gone up significantly. The prospect that the inflation rate will continue to fall has brightened expectations for the consumer-related sectors."
ECB Centeno: The economy surprises quarter after quarter
ECB Governing Council member Mario Centeno said, at a panel at the World Economic Forum, the a recession is not a foregone conclusion.
The Eurozone economy "has been surprising us quarter after quarter," he said. "The fourth quarter in Europe will be most likely still positive. Maybe we'll be surprised also in the first half of the year."
Meanwhile, Centeno pledged that ECB will continue to fight inflation.
JP225 Cash Index Trades in Tight Range as SMA Convergence Flashing Red
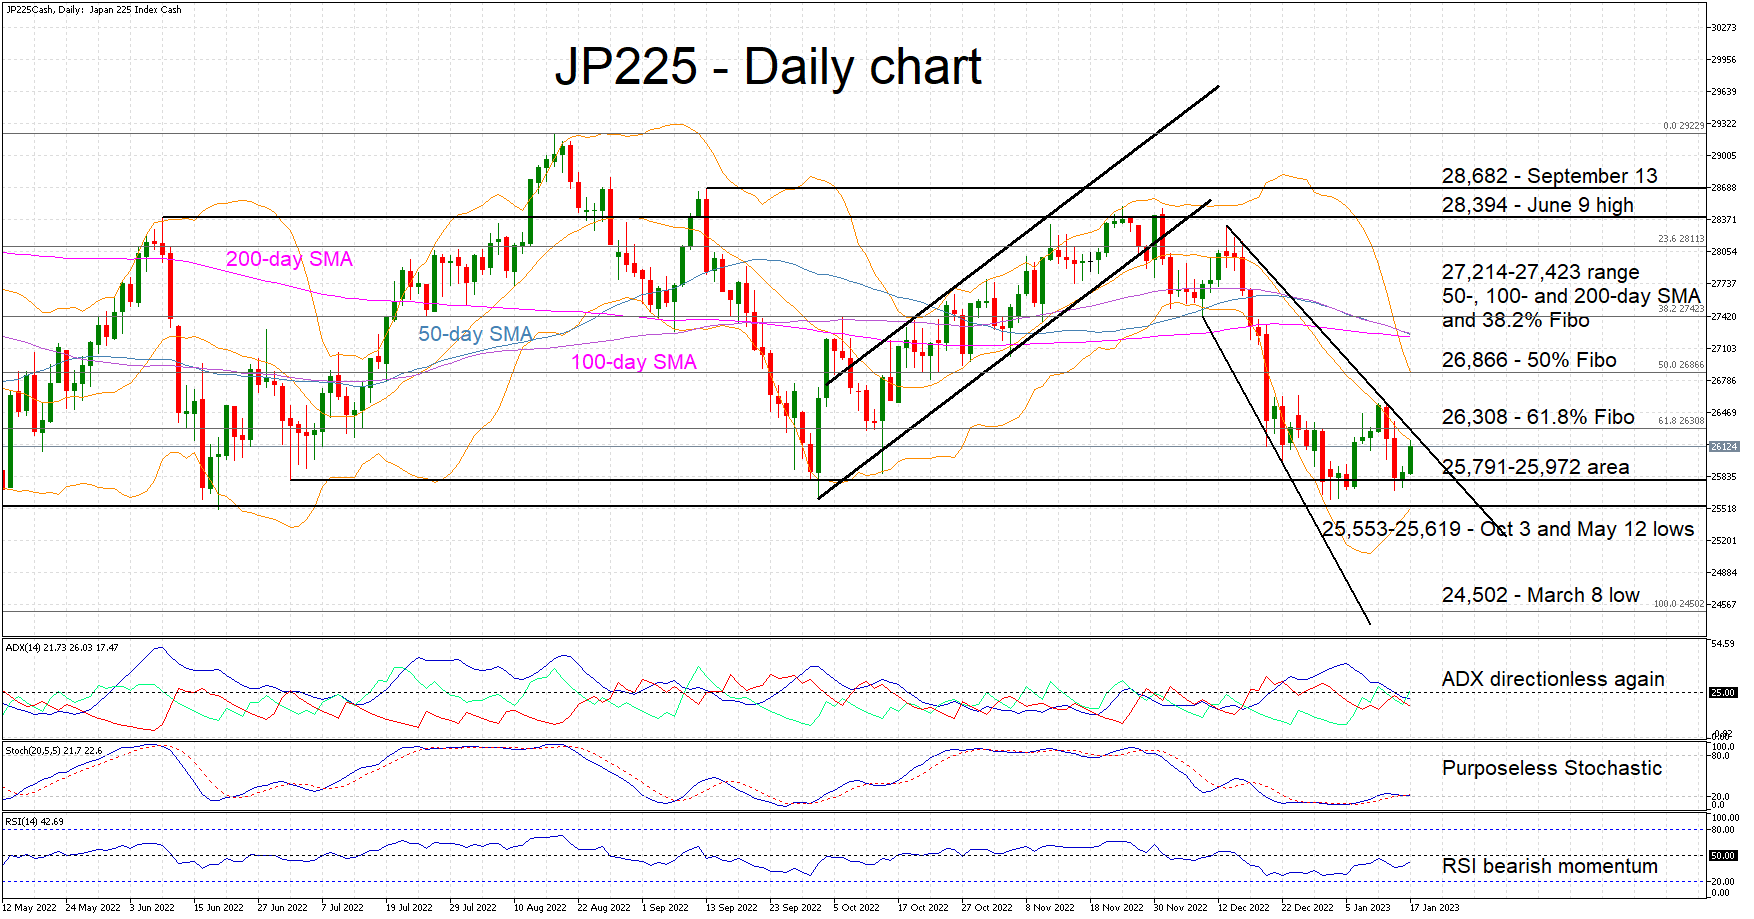
The JP225 cash index has had a muted start in 2023 compared to other equity indices. It is trading in the tight 25,603-26,550 range lacking a clear direction. The Average Directional Movement Index (ADX) is currently trading below 25, confirming a trendless market, while the stochastic oscillator is hovering purposelessly around the 20-level mark.
However, a strong signal appears to be developing in the market. The degree of convergence of the simple moving averages (SMAs) might not go unnoticed by market participants. If one also factors in the developed descending broadening wedge, then there are heightened chances that the JP225 index might be close to trading outside its recent range.
From the bulls’ perspective, the 61.8% Fibonacci retracement level of the March 8 – August 17 uptrend of 26,308 and the December 13 downward trendline are potentially important trigger points. Upon clearing these levels, the next resistance could come at the 50% Fibonacci retracement of 26,866, just ahead of the trifecta of SMAs at the 27,214-27,423 range.
On the other hand, the bears' first target could come at the July 1 low of 25,791. The 25,553-25,619 range, populated by the October 3 and May 12 lows, could then be on the cards. But the key target appears to be the March 8 low of 24,502.
To conclude, market participants appear undecided as the JP225 cash index trades in a tight range. The convergence of the SMAs and the formed price pattern could force market participants to show their hand.
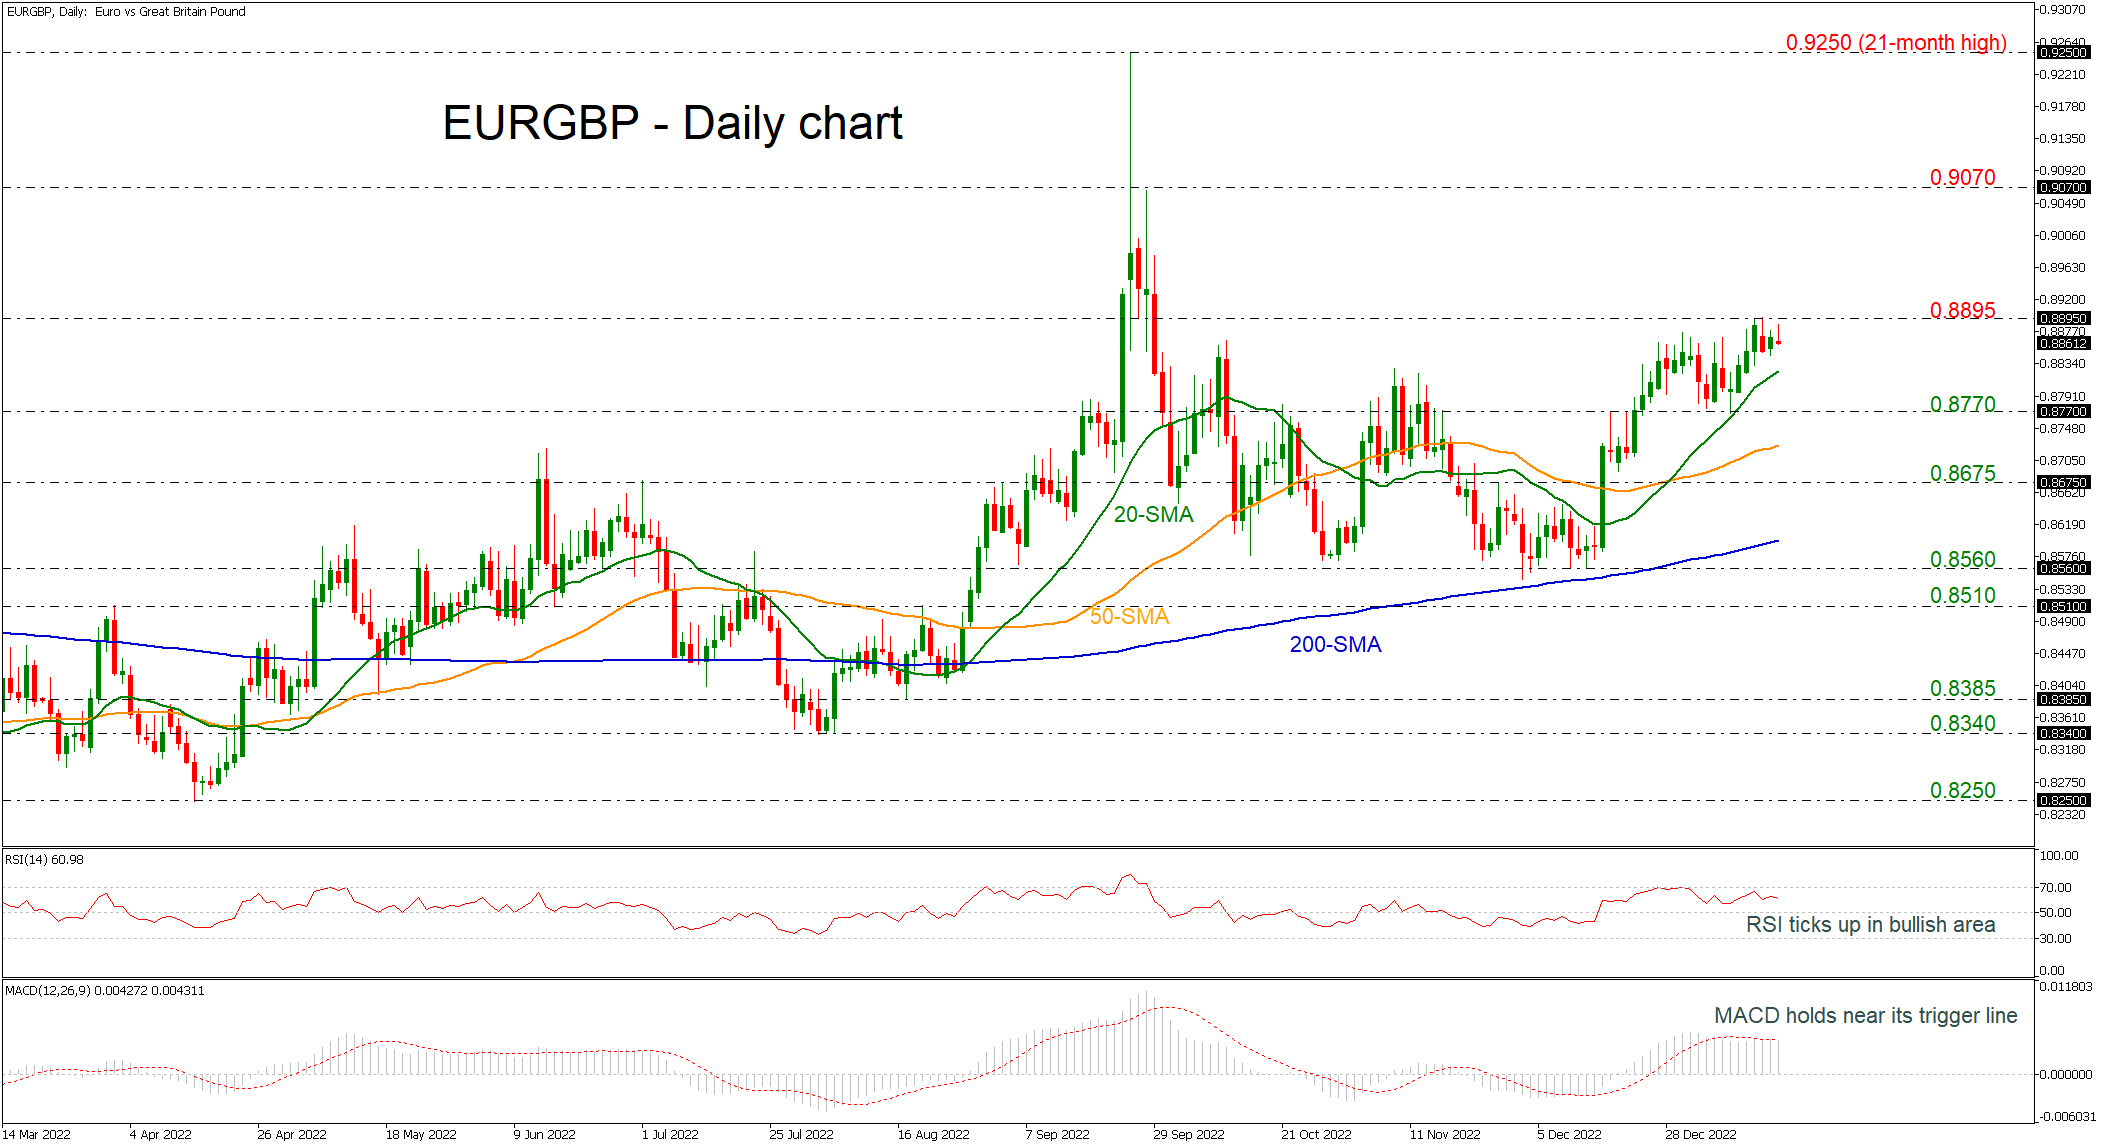
EURGBP Lacks Clear Direction as it Remains Below 0.8900
EURGBP is testing the 0.8895 resistance level, remaining well above the short-term simple moving averages (SMAs). Moreover, the price rebounded after it found support near the 0.8830 barrier, enhancing the argument that the picture may turn positive.
Looking at momentum oscillators on the daily chart, though, they suggest some declines may be on the cards in the short-term. The RSI is above its neutral 50 line but is pointing down, detecting negative momentum. The MACD is trying to overcome its trigger line in the positive territory, indicating some more positive action, but the momentum is too weak.
If the bulls retake control, price advances may stall initially near the latest highs at 0.8895, and subsequently near the 0.9070 bullish spike, registered on September 28. In such a case, the 21-month high of 0.9250 would raise the likelihood for more advances.
On the other hand, immediate support could come from the 20-day SMA at 0.8820 ahead of the 0.8770 support level. A significant leg below this area could send prices towards the 50-day SMA at 0.8730 before the market retests the 0.8675 barrier. Then, if the market fails to hold above this level, the next stop could be at the 200-day SMA near 0.8600.
In the bigger picture, the pair is neutral as long as it is holding beneath the 0.8900 round number and above the 0.8560 support. In case it violates 0.8895, the bulls could take the upper hand.
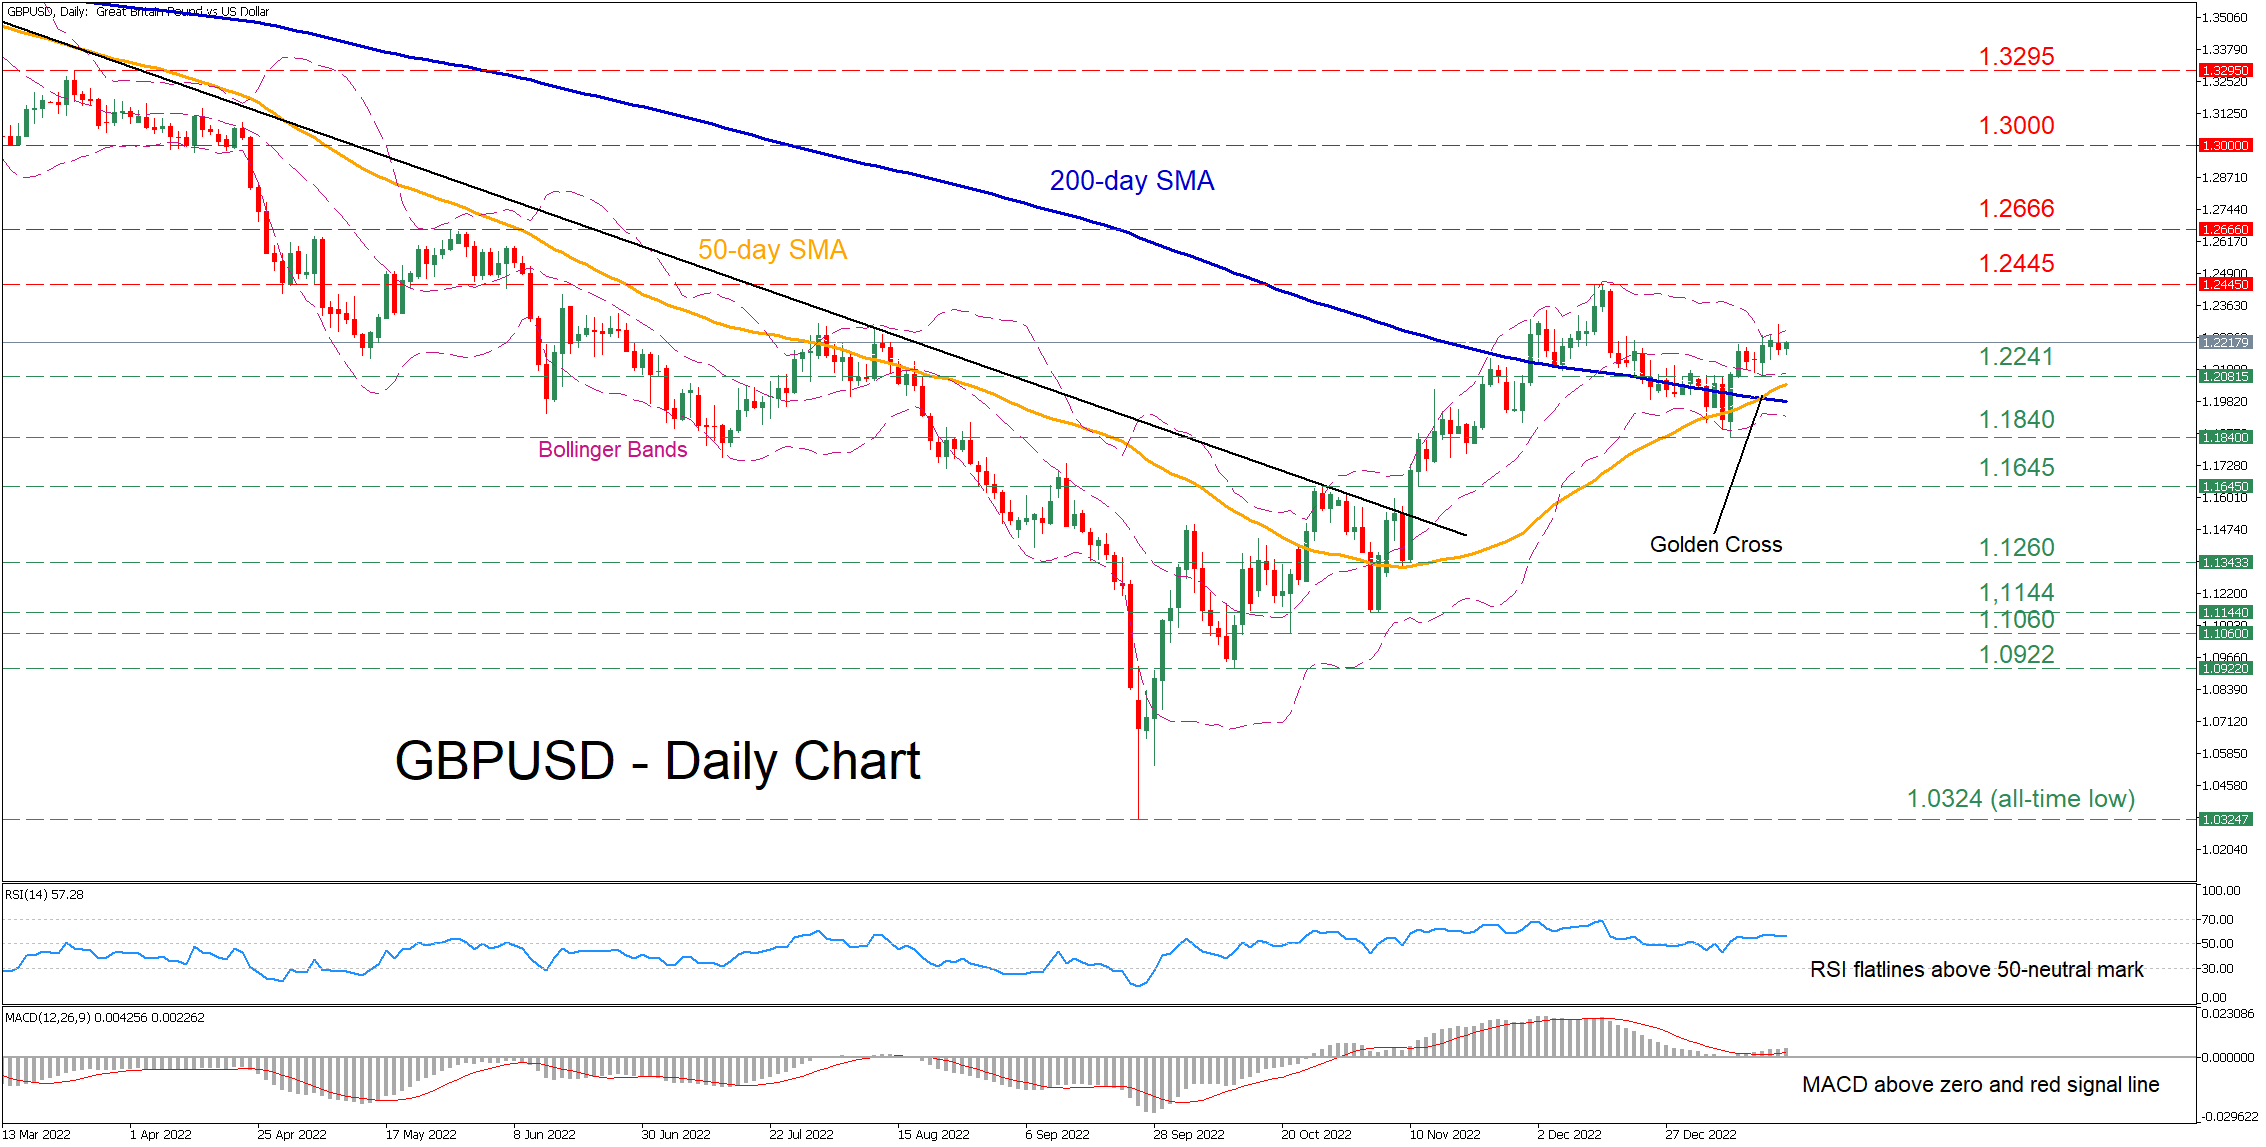
GBPUSD Edges Higher after Completing Golden Cross
GBPUSD has been attempting a rebound since September when the pair recorded an all-time low of 1.0324. Even though the price experienced a minor pullback after its advance got rejected at 1.2445, the recent completion of a golden cross between the 50- and 200-day simple moving averages (SMAs) has induced upside pressure.
The short-term oscillators currently suggest that bullish forces are reigning supreme. Specifically, the RSI is hovering above its 50-neutral mark, while the MACD histogram is strengthening above both zero and its red signal line.
Should the positive momentum intensify further, the pair could initially test the recent rejection region of 1.2445. Breaking above that zone, the bulls could aim for the May peak of 1.2666. Further advances could then come to a halt at the 1.3000 psychological mark, which acted as strong support in March 2022.
On the flipside, bearish actions could send the price to challenge the recent support of 1.2241. Should that floor collapse, the January low of 1.1840 may curb potential declines. Diving lower, the pair might face the October resistance of 1.1645, which could act as support in the future.
Overall, GBPUSD seems to have the necessary momentum to resume its medium-term rebound. Therefore, a break above the recent rejection point of 1.2445 could confirm the bullish scenario.
US Oil: Bulls Target 90.26
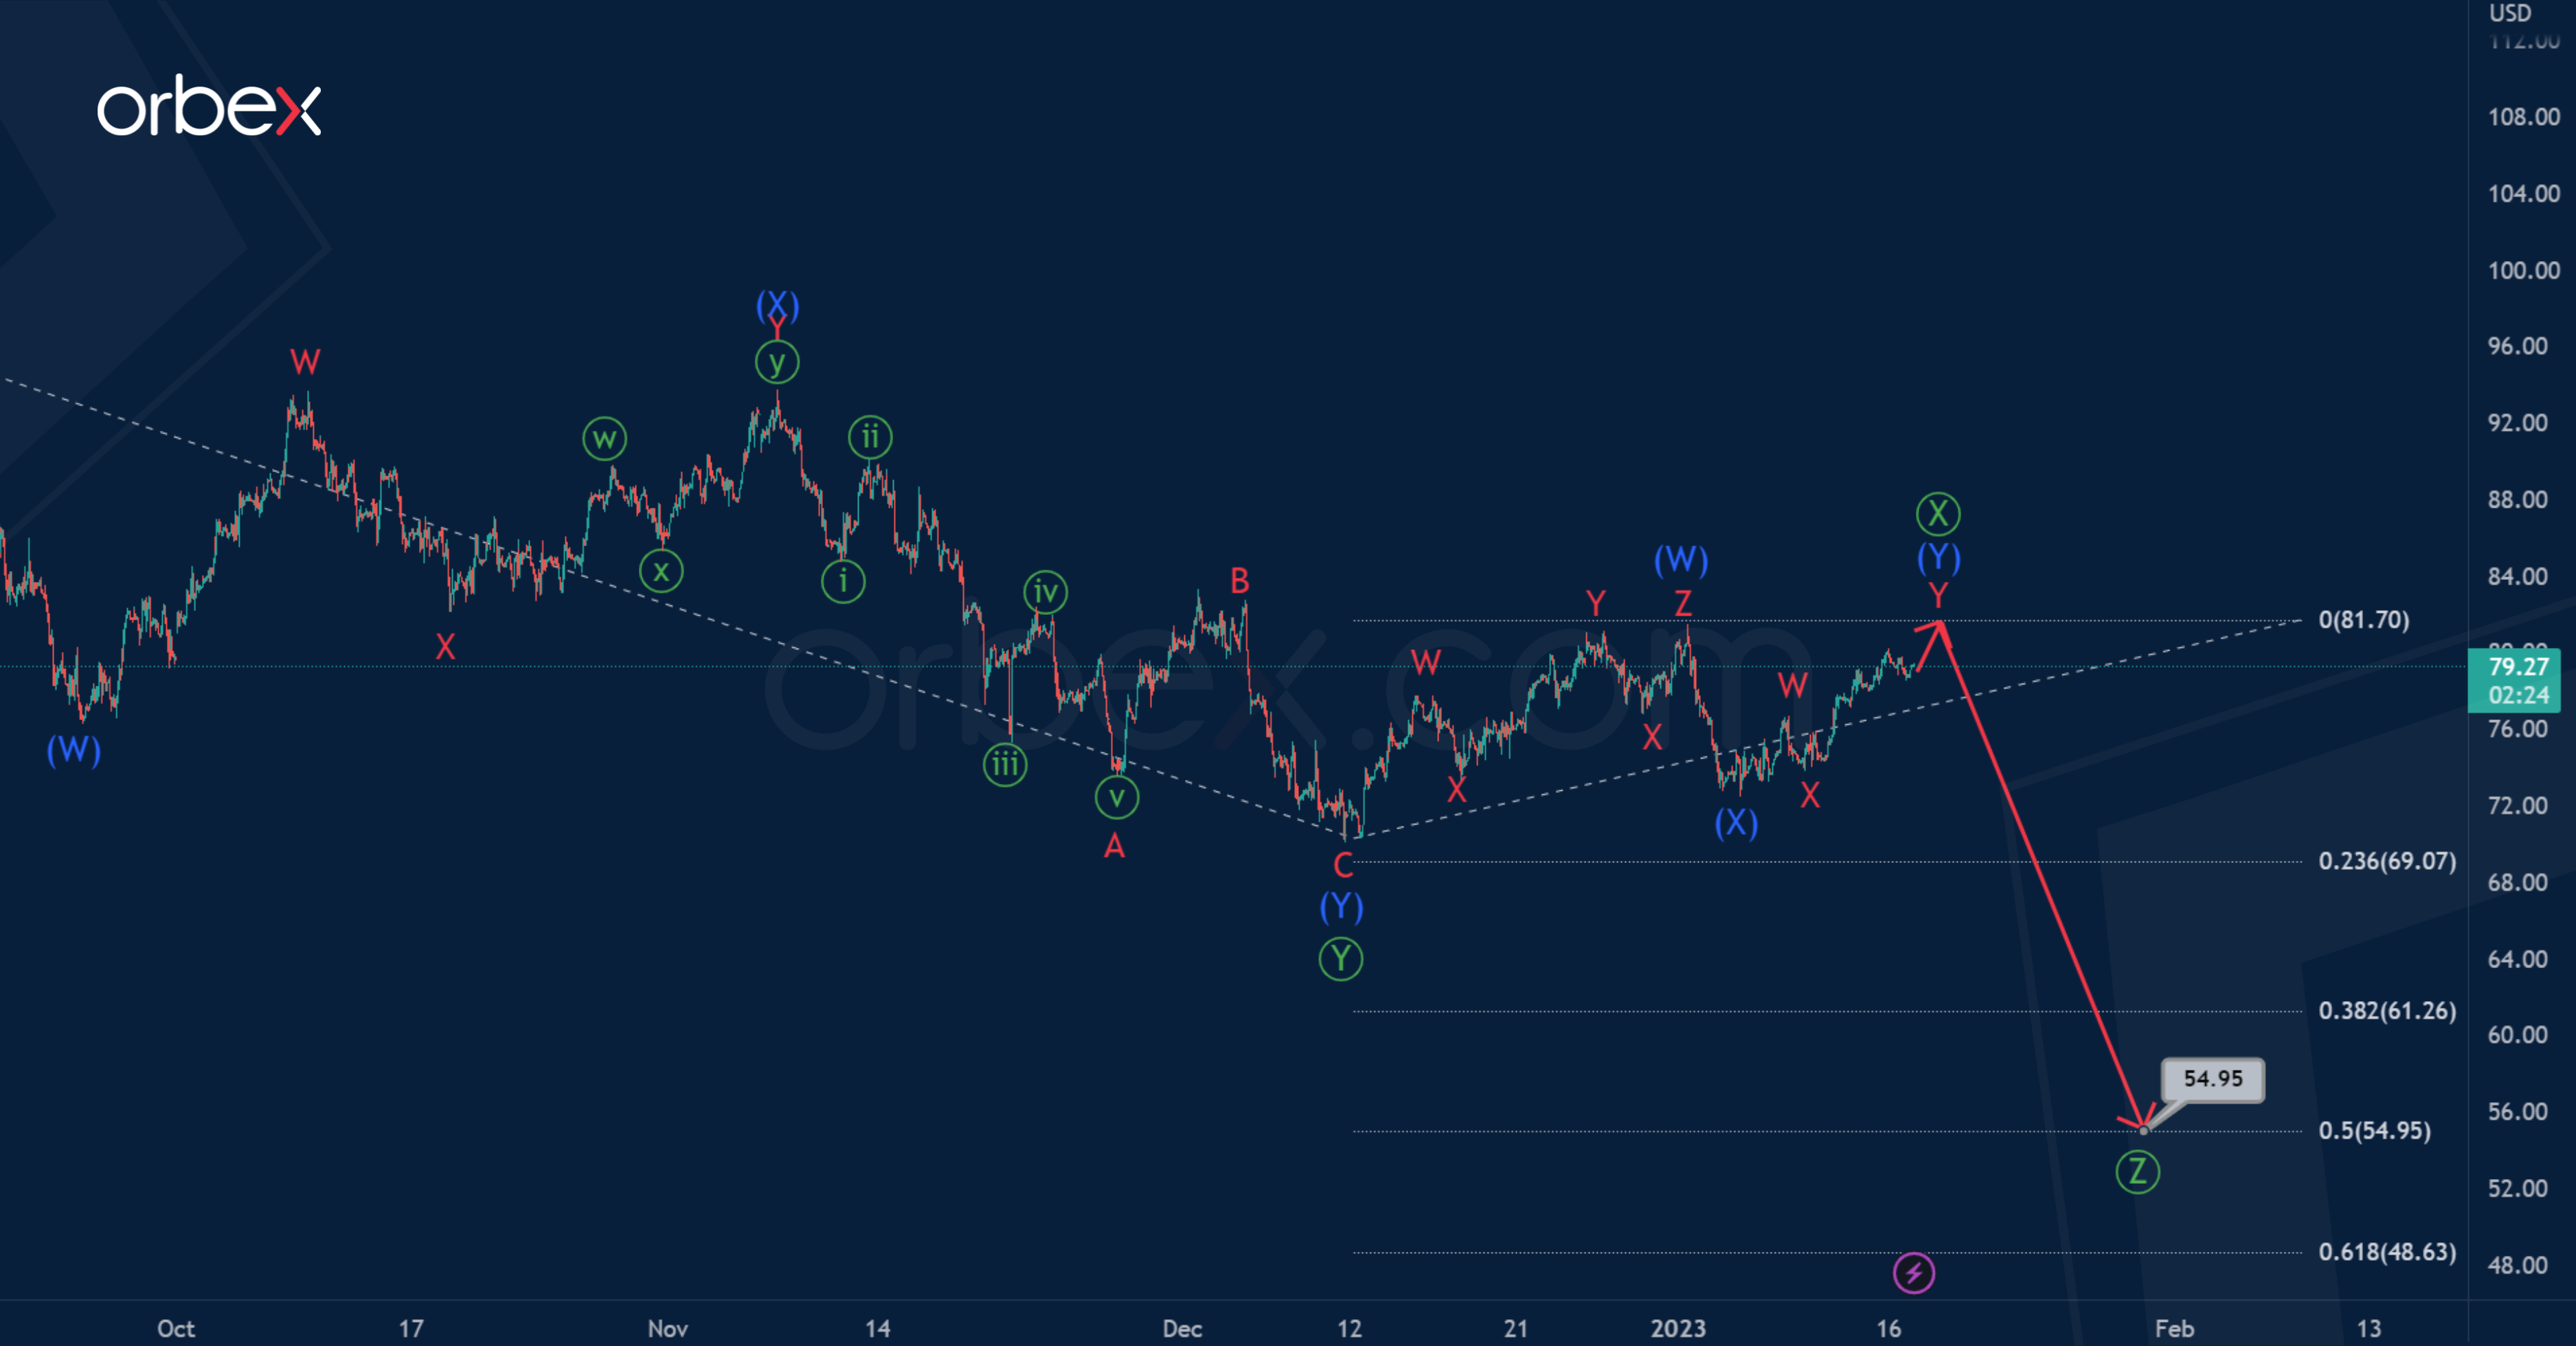
US Oil suggests the formation of a triple zigzag pattern Ⓦ-Ⓧ-Ⓨ-Ⓧ-Ⓩ. The primary waves Ⓦ-Ⓧ-Ⓨ seem to be fully completed.
In the last section of the chart, we see the formation of an ascending primary intervening wave Ⓧ. Perhaps it takes the form of an intermediate double zigzag (W)-(X)-(Y), and now the price is directed upwards in the last actionary wave (Y).
It is likely that the wave (Y) will end near 90.26. At that level, wave Ⓧ will be at 38.2% along the Fibonacci lines of primary wave Ⓨ.
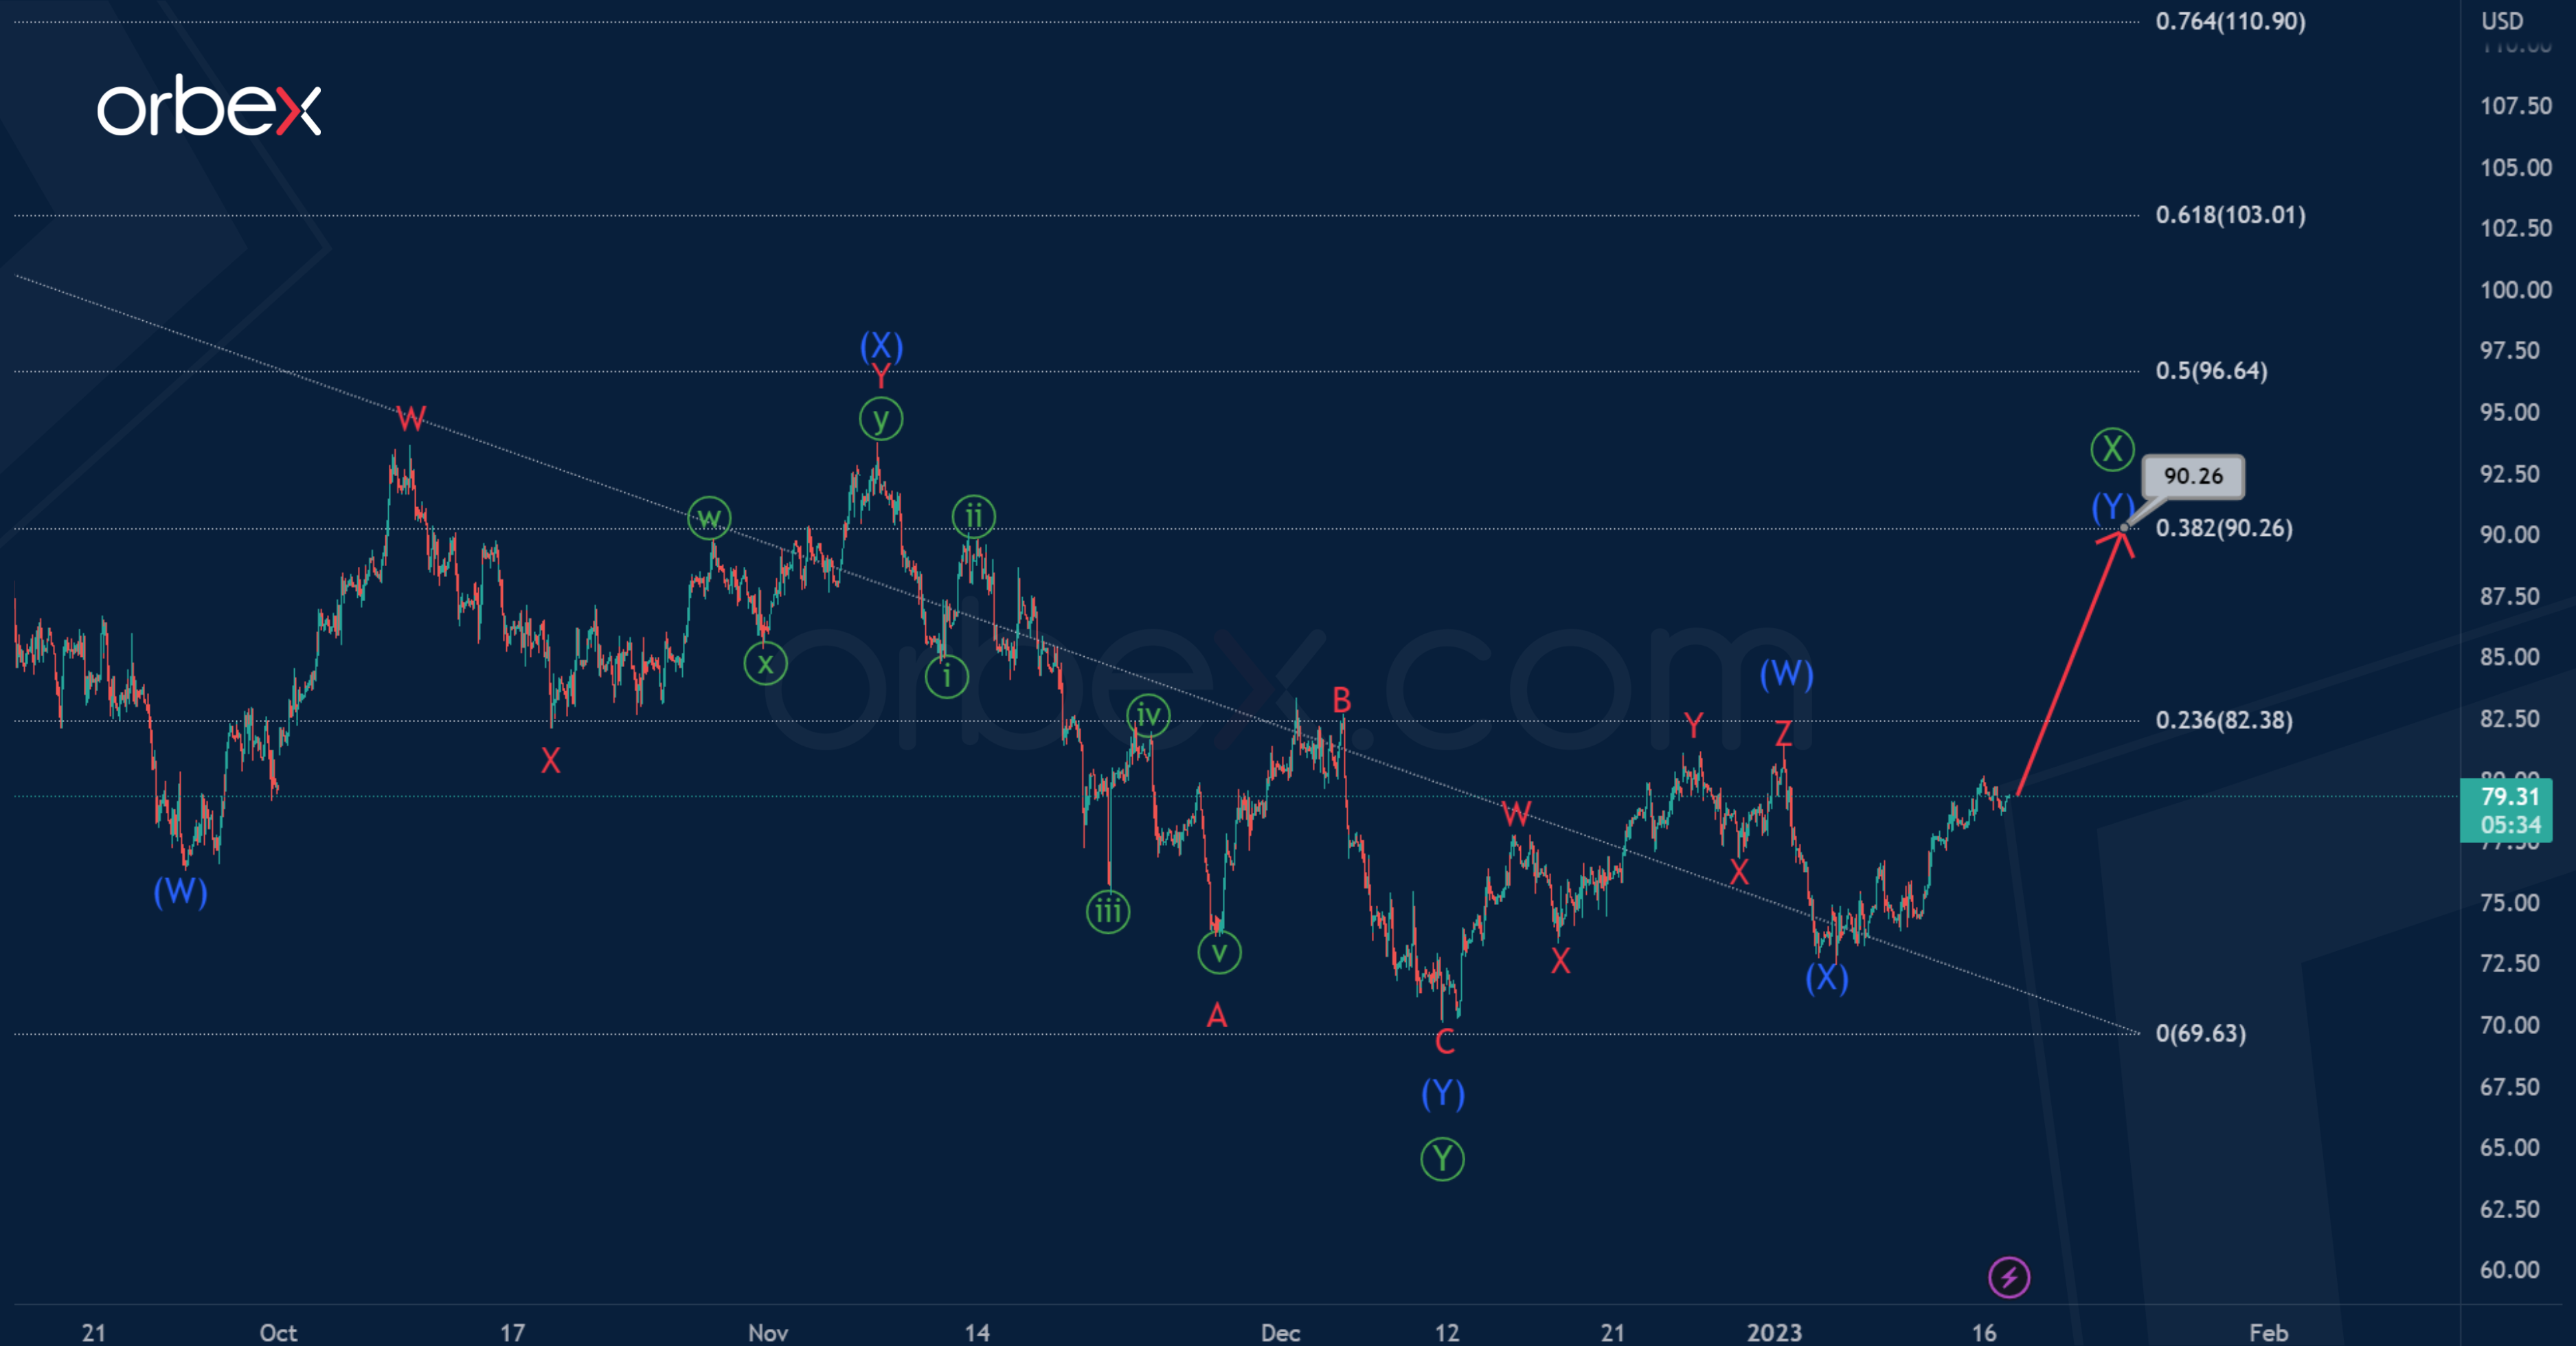
An alternative scenario assumes that the intervening wave Ⓧ will end at the previous high of 81.70, then the market will turn around.
Most likely, in the very near future we will observe the decline and development of the primary actionary wave Ⓩ.
There is a high probability that the bearish trend will continue to 54.95. At that level, primary wave Ⓩ will be equal to half of wave Ⓨ.