
Sample Category Title
USD/CHF Daily Outlook
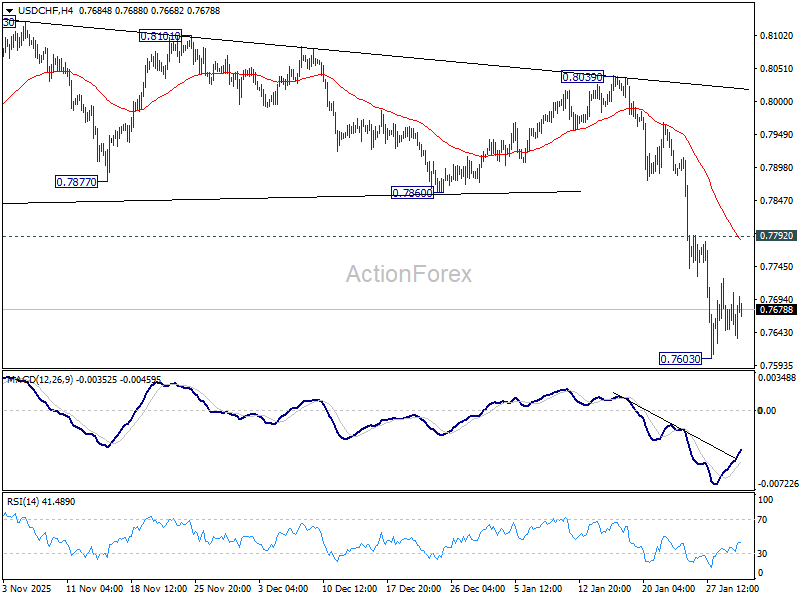
Daily Pivots: (S1) 0.7620; (P) 0.7663; (R1) 0.7686; More….
Intraday bias in USD/CHF remains neutral for consolidations above 0.7603 temporary low. Outlook will stay bearish as long as 0.7792 resistance holds Break of 0.7603 will resume the larger down trend to 0.7382 projection level next. However, firm break of 0.7792 will turn bias back to the upside, for stronger rebound to 0.7860 support turned resistance.
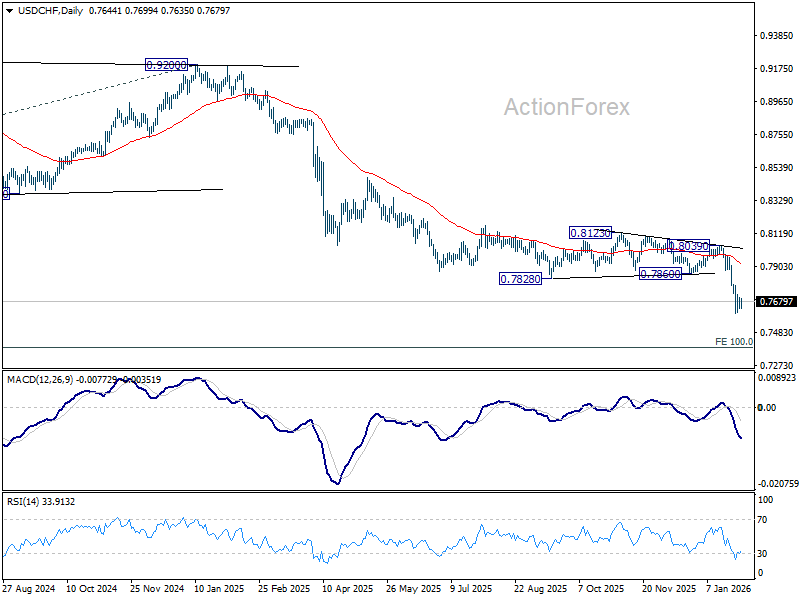
In the bigger picture, larger down trend from 1.0342 (2017 high) is still in progress and resuming. Next target is 100% projection of 1.0146 (2022 high) to 0.8332 from 0.9200 at 0.7382. In any case, outlook will stay bearish as long as 55 W EMA (now at 0.8184) holds.
USD/CAD Daily Outlook
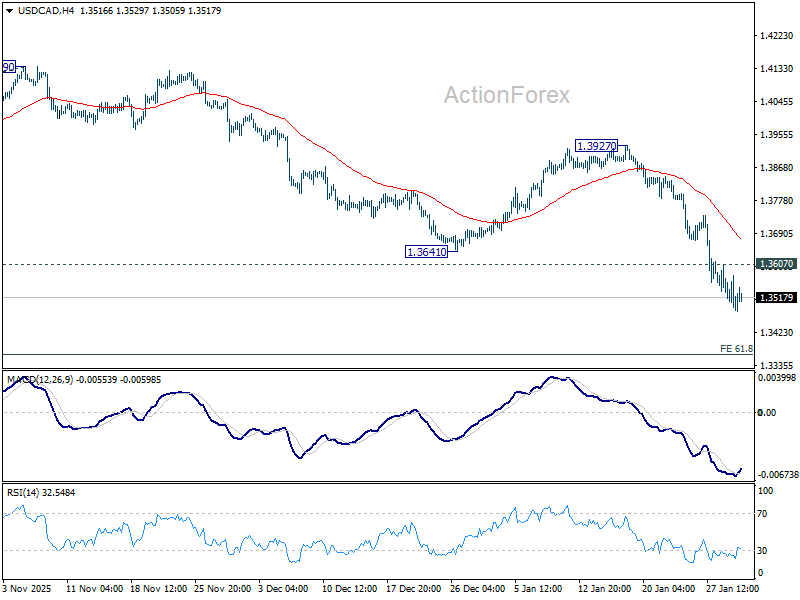
Daily Pivots: (S1) 1.3457; (P) 1.3519; (R1) 1.3553; More...
Intraday bias in USD/CAD stays on the downside at this point. Firm break of 1.3538 low will resume whole fall from 1.4971. Next target is 61.8% projection of 1.4791 to 1.3538 from 1.4139 at 1.3365. On the upside, above 1.3607 minor resistance will turn intraday bias neutral and bring consolidations, before staging another fall.
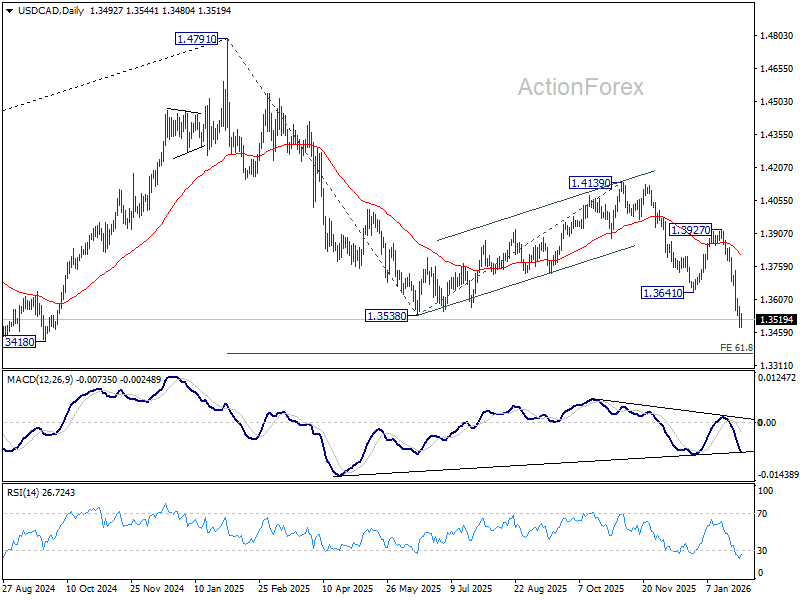
In the bigger picture, price actions from 1.4791 are seen as a corrective pattern to the whole up trend from 1.2005 (2021 low). Deeper fall could be seen as the pattern extends, and break of 1.3538 will target 61.8% retracement of 1.2005 to 1.4791 at 1.3069. For now, medium term outlook will be neutral at best, until there are signs that the correction has completed, or that a bearish trend reversal is confirmed.
AUD/USD Daily Report
Daily Pivots: (S1) 0.6981; (P) 0.7038; (R1) 0.7106; More...
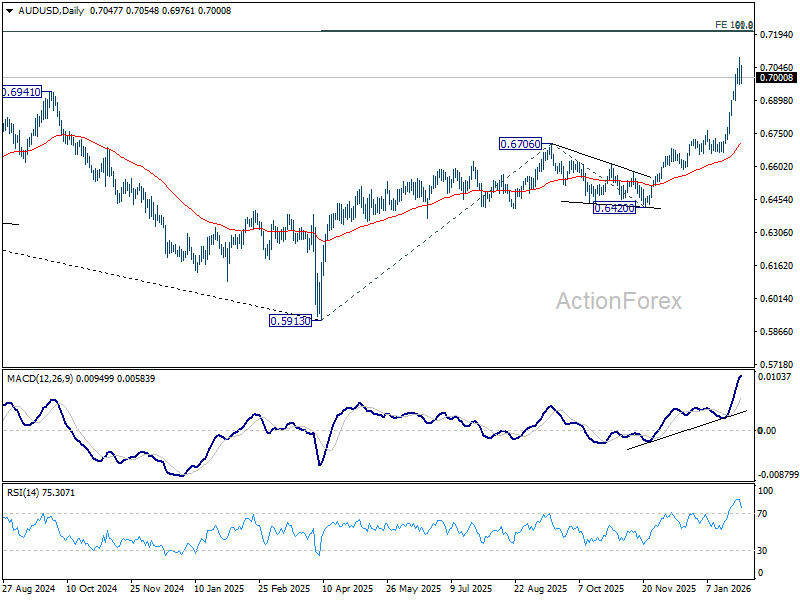
A temporary top is firmed at 0.7093 in AUD/USD with current retreat. Some consolidations would be seen but risk will stay on the upside as long as 55 4H EMA (now at 0.6905) holds. Above 0.7093 will extend larger up trend to 100% projection of 0.5913 to 0.6706 from 0.6420 at 0.7213 next. Nevertheless, break of 55 4H EMA will confirm short term topping, and bring lengthier consolidations before rally resumption.
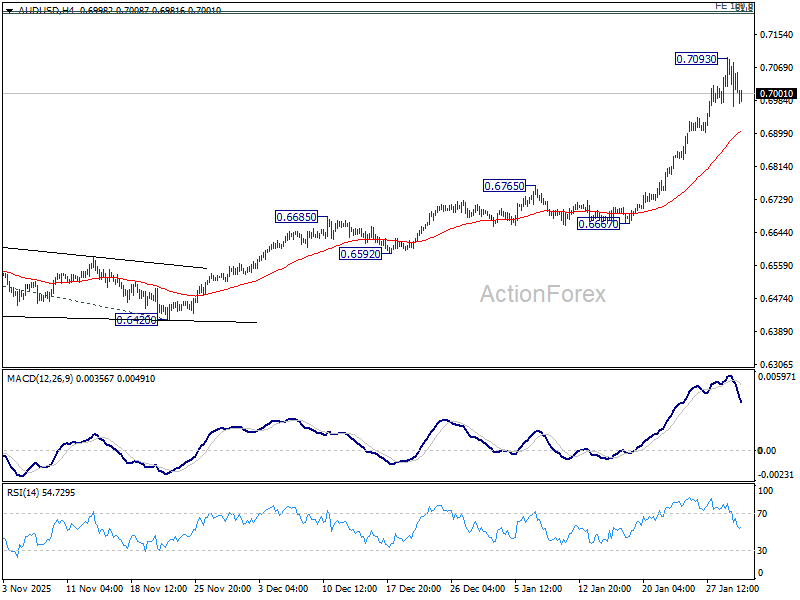
In the bigger picture, current development argues that rise from 0.5913 (2024 low) is reversing whole down trend from 0.8006 (2021 high). Further rally should be seen to 61.8% retracement of 0.8006 to 0.5913 at 0.7206. This will remain the favored case as long as 0.6706 resistance turned support holds, even in case of deep pullback.
Dollar Consolidates as Warsh Hints and Shutdown Deal Calm Nerves
Dollar is consolidating within a narrow range today, reflecting a temporary balance between supportive near-term developments and persistent longer-term headwinds. Volatility has subsided, but price action lacks the conviction typical of a durable turnaround.
A sharp pullback in precious metals has played a key role in easing pressure on the greenback. Gold has retreated below 5,200 after printing fresh record highs above 5,500, with traders locking in gains after a steep and extended rally. That said, the broader trend in Gold remains intact. The correction appears technical in nature, offering relief to Dollar without undermining the longer-term appeal of hard assets as hedges against policy uncertainty. Equity markets also contributed to a slightly more cautious tone. Asian stocks traded lower following a brief US selloff, led by a sharp decline in Microsoft shares. However, broader US indexes stabilized quickly, preventing risk aversion from escalating.
Another notable source of support came from US political developments. President Donald Trump said he would announce his pick for the next Fed chair on Friday, adding that the choice is “somebody that could have been there a few years ago.” The remark was widely read as a strong hint toward former Fed Governor Kevin Warsh. Warsh is viewed by many investors as a stabilizing choice, combining deep Fed experience with credibility as an orthodox central banker. His potential nomination is seen as reducing tail risks around overt political interference in monetary policy, even if pressure on the Fed is unlikely to disappear entirely.
At the same time, lawmakers moved to defuse a looming fiscal cliff. Senators reached agreement on a spending package designed to avert a partial government shutdown, easing a risk that had been weighing on sentiment. Trump endorsed the bipartisan deal publicly, signaling White House backing and reducing the likelihood of last-minute disruption, even as procedural hurdles remain in the House.
These factors collectively explain why the Dollar has managed to steady. The easing of near-term political and fiscal tail risks has encouraged traders to pause rather than press bearish bets aggressively. Yet the underlying narrative has not materially changed. Persistent uncertainty around US trade relations, foreign policy, and political interference continues to motivate diversification away from the Dollar into real assets and alternative currencies. In that sense, Dollar's current recovery looks tactical rather than structural. The broader trend toward Dollar erosion remains in place, with today’s consolidation best viewed as a breather within a larger adjustment.
Performance tables reinforce that view. For the week so far, Dollar sits firmly at the bottom, followed by Euro and Sterling. Kiwi leads, with Swiss Franc next, while Aussie, Yen, and Loonie are clustered in the middle of the performance table.
Swiss KOF falls to 102.5, but outlook remains above average
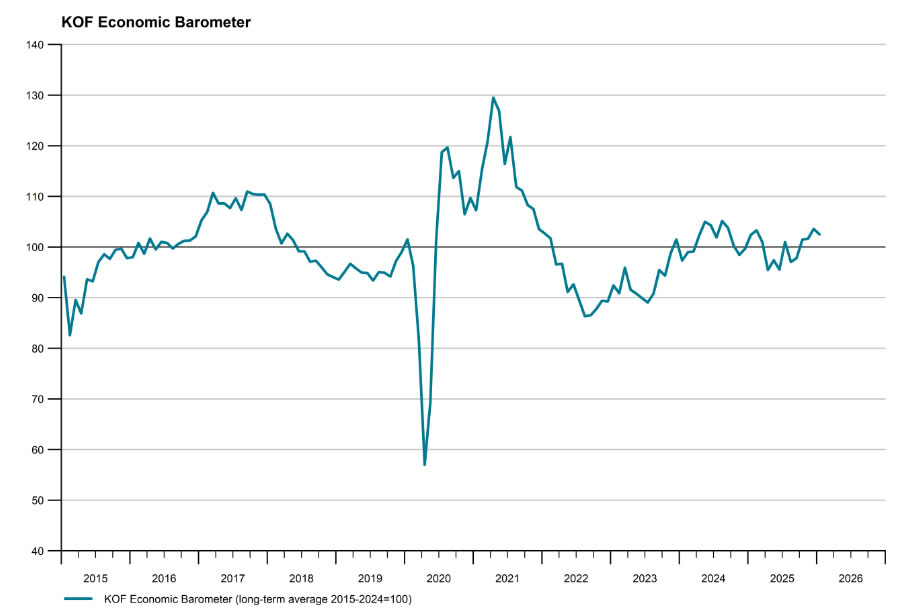
Switzerland’s KOF Swiss Economic Institute Economic Barometer eased from 103.6 to 102.5 in January, undershooting expectations of 103.2. Despite the pullback, the index remains comfortably above its medium-term average, suggesting the outlook has softened but is far from weak.
The decline was driven mainly by deterioration in hospitality and construction, where confidence faded at the start of the year. By contrast, sentiment improved in manufacturing as well as financial and insurance services, helping to cushion the overall slowdown.
Within the producing sector, signals were mixed. Employment prospects, profit expectations, exports, and assessments of production constraints came under pressure. However, brighter readings for order backlogs, general business conditions, and competitive positioning point to underlying resilience, reinforcing the view of moderation rather than a sharp downturn.
Tokyo CPI slows to 2% on fuel subsidies, BoJ normalization path intact
Japan’s January Tokyo core CPI (excluding fresh food) eased from 2.3% to 2.0% yoy, undershooting expectations of 2.2% and marking a 15-month low. Core-core CPI (excluding fresh food and energy) also eased from 2.3% to 2.0% yoy. Headline inflation slowed more sharply from 2.0% to 1.5%.
The slowdown was driven largely by one-off factors. Food inflation excluding fresh food decelerated for a fifth straight month, while energy prices fell -4.2% yoy after gasoline subsidies and the abolition of a provisional fuel tax surcharge. Gasoline prices dropped -14.8%, with electricity and city gas bills also declining. Base effects from last year’s food price surge further weighed on the data.
Despite the softer print, the figures are unlikely to derail the BoJ’s normalization. While fuel subsidies may push core inflation below target in coming months, policymakers are expected to focus on whether firms continue to pass through higher import costs from a weak yen—an outcome that would keep underlying inflation pressures alive.
Japan's industrial production fall -0.1% mom in December, consumption falters
Japan’s industrial production edged down -0.1% mom in December, a milder decline than expected -0.4% mom and consistent with a sector struggling for direction rather than deteriorating sharply. The Ministry of Economy, Trade and Industry maintained its assessment that output “fluctuates indecisively,” reflecting uneven momentum across industries.
Forward-looking guidance from manufacturers remains volatile. Firms surveyed expect output to jump 9.3% in January, followed by a 4.3% decline in February, highlighting stop-start dynamics rather than a clear recovery trend.
Sector performance was split, with declines in production machinery, chemicals, and paper products offset by gains in general machinery, electronics, and motor vehicles. Supply-side indicators pointed to some imbalance. Industrial shipments fell -1.7%, while inventories rose 1.0%, suggesting demand has not kept pace with production and raising the risk of further output adjustments if sales do not improve.
That concern was reinforced by a sharp disappointment in consumption. Retail sales fell -0.9% yoy in December, far below expectations for a 0.7% increase.
AUD/USD Daily Report
Daily Pivots: (S1) 0.6981; (P) 0.7038; (R1) 0.7106; More...
A temporary top is firmed at 0.7093 in AUD/USD with current retreat. Some consolidations would be seen but risk will stay on the upside as long as 55 4H EMA (now at 0.6905) holds. Above 0.7093 will extend larger up trend to 100% projection of 0.5913 to 0.6706 from 0.6420 at 0.7213 next. Nevertheless, break of 55 4H EMA will confirm short term topping, and bring lengthier consolidations before rally resumption.
In the bigger picture, current development argues that rise from 0.5913 (2024 low) is reversing whole down trend from 0.8006 (2021 high). Further rally should be seen to 61.8% retracement of 0.8006 to 0.5913 at 0.7206. This will remain the favored case as long as 0.6706 resistance turned support holds, even in case of deep pullback.
White House and Senate Democrats Agree on a Deal to Avert a Long Partial Government Shutdown
Markets
FX and FI market moves were fairly limited on a closing basis but that hides some bigger intraday swings, at least partially driven by president Trump commenting on a wide range of topics, from Cuba over Venezuela to Canada and the UK. The dollar generally traded on the backfoot with modest losses against all G10 peers. As an example of the volatility, EUR/USD opened at 1.1954 and closed at 1.1971 but intraday moves stretched a full big figure. DXY held north of 96 and USD/JPY fell marginally to 153.11. Net daily changes on US interest rate markets amounted to less than 1.5 bps down across the curve. German Bunds, if anything, slightly outperformed at the front. The eye-watering rally in gold and silver came to a screeching halt but volatility was the name of the game here too. After both hit new record highs, they suddenly crashed 8-12% before paring losses back to opening levels. It turned out to be a prelude for today though with both precious metals tumbling down to yesterday’s intraday lows. The drop follows speculation that president Trump is expected to pick Kevin Warsh as the new Fed chair instead of Rick Rieder. Warsh was seen at the White House yesterday evening. Trump afterwards said he’d announce Powell’s successor Friday morning (US time). “A lot of people think this is somebody that could’ve been there a few years ago”, Trump said seen as a reference to Warsh missing out on the chairmanship to Powell in 2017. Warsh had the reputation of a hawk before he aligned himself with Trump’s views on lower rates. Markets seem to give him the benefit of the doubt with the kneejerk reaction in gold and silver accompanied by a higher dollar and US yields. We’d warn against assuming Warsh is a done deal before Trump’s actual announcement though. Any nomination also needs confirmation by the Senate. Some Republicans have threatened to block any nominee until the DoJ probe into Fed chair Powell’s testimony to Congress about the HQ renovations. In terms of event risks, the one for a (partial) drawn-out shutdown is all but gone (see below), removing a potentially hampering factor for the US dollar. But other important ones are as live as they can be. Trump’s comments in recent days have increased the probability for a US strike on Iran after his “massive armada” arrived at or near the region. This is also what lifted oil prices to around the highest levels since the summer of last year. Weekend strikes in the past have been Trump’s preferred MO. The (geo)politics interfere with an interesting European economic agenda with Q4 GDP and several national January inflation numbers due. The latter will be viewed against the backdrop of these rising oil prices as well as some ECB policymakers flagging the potential impact of a stronger euro on the inflation outlook.
News and views
The White House and Senate Democrats agreed on a deal to avert a long partial government shutdown. Under the agreement, Senate would split off five of the remaining six spending bills (funding until the end of fiscal year; Sept 30) that already cleared the House while passing a two-week extension to fund the Department of Homeland Security to allow more time for negotiations on proposed restrictions on immigration enforcement. After Senate approved the modified package, it needs to go back to the House. It’s highly uncertain that this process will be completed by tonight’s deadline given that the House is out this week and not scheduled to return until Monday. A short-term funding lapse is likely.
The US Treasury released its semi-annual report to Congress on macroeconomic and FX policies of major trading partners to the US. Under the period under review, Q2 2024-Q2 2025, Treasury found no major trading partner that met all three criteria for enhanced analysis. Those are running a bilateral goods trade surplus with the US exceeding $20bn, having a current account surplus of more than 3% of GDP and engaging in net FX purchases totaling more than 2% of GDP over a 12-month period. While Treasury has not designated China as a currency manipulator in this report, China stands out among our major trading partners in its lack of transparency around its exchange rate policies and practices. It remains on the monitoring list together with Japan, Korea, Taiwan, Thailand, Singapore, Vietnam, Germany, Ireland, and Switzerland. Only Thailand didn’t feature on the list in the June 2025 report. The country met the first two criteria because of trade re-routing.
Swiss KOF falls to 102.5, but outlook remains above average
Switzerland’s KOF Swiss Economic Institute Economic Barometer eased from 103.6 to 102.5 in January, undershooting expectations of 103.2. Despite the pullback, the index remains comfortably above its medium-term average, suggesting the outlook has softened but is far from weak.
The decline was driven mainly by deterioration in hospitality and construction, where confidence faded at the start of the year. By contrast, sentiment improved in manufacturing as well as financial and insurance services, helping to cushion the overall slowdown.
Within the producing sector, signals were mixed. Employment prospects, profit expectations, exports, and assessments of production constraints came under pressure. However, brighter readings for order backlogs, general business conditions, and competitive positioning point to underlying resilience, reinforcing the view of moderation rather than a sharp downturn.
Japan’s industrial production fall -0.1% mom in December, consumption falters
Japan’s industrial production edged down -0.1% mom in December, a milder decline than expected -0.4% mom and consistent with a sector struggling for direction rather than deteriorating sharply. The Ministry of Economy, Trade and Industry maintained its assessment that output “fluctuates indecisively,” reflecting uneven momentum across industries.
Forward-looking guidance from manufacturers remains volatile. Firms surveyed expect output to jump 9.3% in January, followed by a 4.3% decline in February, highlighting stop-start dynamics rather than a clear recovery trend.
Sector performance was split, with declines in production machinery, chemicals, and paper products offset by gains in general machinery, electronics, and motor vehicles. Supply-side indicators pointed to some imbalance. Industrial shipments fell -1.7%, while inventories rose 1.0%, suggesting demand has not kept pace with production and raising the risk of further output adjustments if sales do not improve.
That concern was reinforced by a sharp disappointment in consumption. Retail sales fell -0.9% yoy in December, far below expectations for a 0.7% increase.
Tokyo CPI slows to 2% on fuel subsidies, BoJ normalization path intact
Japan’s January Tokyo core CPI (excluding fresh food) eased from 2.3% to 2.0% yoy, undershooting expectations of 2.2% and marking a 15-month low. Core-core CPI (excluding fresh food and energy) also eased from 2.3% to 2.0% yoy. Headline inflation slowed more sharply from 2.0% to 1.5%.
The slowdown was driven largely by one-off factors. Food inflation excluding fresh food decelerated for a fifth straight month, while energy prices fell -4.2% yoy after gasoline subsidies and the abolition of a provisional fuel tax surcharge. Gasoline prices dropped -14.8%, with electricity and city gas bills also declining. Base effects from last year’s food price surge further weighed on the data.
Despite the softer print, the figures are unlikely to derail the BoJ’s normalization. While fuel subsidies may push core inflation below target in coming months, policymakers are expected to focus on whether firms continue to pass through higher import costs from a weak yen—an outcome that would keep underlying inflation pressures alive.
Sharp Correction
We’re coming toward the end of a geopolitically calm-ish week — no major threats, no major events — but with rising volatility in the metals markets. Yesterday was again marked by a strong rally in gold, silver and copper prices, followed this time by a sharp selloff.
Note that the impressive rally in LME copper was triggered by intense speculative trading in China. So metals markets are fuming right now.
Gold is down to around $5’230 per ounce at the time of writing after flirting with the $5’600 level at yesterday’s peak. That’s insane considering the week started near $5’000. And what was just as insane was the sharp selloff that followed. Gold wiped out around $2.5 trillion in market value in just 30 minutes, sending prices from above $5’500 to around $5’100.
Silver also traded past $121 an ounce before pulling back sharply, and is down again in Asia this morning — same story for copper.
Are we surprised? No, we’re not. Price action in metals was impressive, but it could be expected just by looking at the rising stress through the lens of the gold volatility index.
A major spike there has been telling us a lot about the building stress behind such an impressive rally, which lately became driven more by speculation than fundamentals. That means we could see a meaningful pullback of 8–10%, toward the $4’600–4’800 per ounce range, to relieve some of that stress.
Price pullbacks, however, will likely be seen as opportunities to strengthen long positions, as the major drivers of the metals rally — unsustainable-but-still-rising G7 debt, waning appetite for the US dollar, trade and geopolitical uncertainties, the search for supranational assets able to preserve value in case of further geopolitical chaos, and potentially rising price pressures — remain fully in play.
Tensions between the US and Iran these days don’t only push oil prices higher — US crude briefly spiked past $66 per barrel yesterday — they also point to potential disruptions in major trade routes in the region. So, demand for hard commodities and safe-haven assets is certainly not over. That said, a correction looks healthy at these strongly overbought levels.
Voilà — that’s the take on metals: bullish in the longer run, cautious in the short run. Any geopolitical headline could disrupt the correction process and trigger a premature return to metals.
In currencies, the US dollar is consolidating early-week losses near four-year low levels. The USDJPY is unsurprisingly rising again and likely has room to run toward levels that would make Japanese authorities uncomfortable — namely the 160 level. The EURUSD is struggling as well, having failed to hold above 1.20.
Something notable happened this week: large bets were placed via Euribor options expiring in March and June, betting on a 25bp ECB rate cut before summer. That’s clearly a contrarian trade, as markets are pricing a 25bp cut this year with 25% chance only. But it also suggests some investors are preparing for US-EU relations to worsen before improving, and for European economies to require ECB support.
What’s sure is that, with or without stabilization in US relations, EU governments will likely have to deliver on defence and technology spending, implying meaningful fiscal support.
And we all know what the sweet combination of expansive fiscal and monetary policy means for equity markets: gains. As a result, stimulus expectations keep the Stoxx outlook positive, with defence names the first-line beneficiaries of fiscal flows.
Note that the Stoxx 600 fell yesterday, alongside major US peers. One of Europe’s biggest tech names, SAP, tanked 16% after reporting disappointing earnings — notably a lower-than-expected cloud backlog, meaning revenues already committed by customers for future cloud services but not yet recognized. SAP said negotiations took longer than expected and that AI tools should eventually drive customer migration from on-premise servers to the cloud. That narrative hasn’t convinced investors so far: the stock is down more than 40% since February 2025. Whether this is an opportunity or whether SAP’s AI push turns into a flop remains to be seen.
In the US, Microsoft also had an ugly day — a very ugly one, its worst since the DeepSeek-triggered Nvidia selloff last year. Shares dropped around 10%, rebounding from a critical technical level near $423, corresponding to the 38.2% Fibonacci retracement of the past three-year AI rally.
That level matters: a break below would signal an end to the bullish trend and a return to a bearish consolidation zone, opening the door to deeper losses. If it holds however, the latest dip could offer an entry point for buyers at a more reasonable valuation than two months ago. It all comes down to whether massive AI spending is matching demand.
Microsoft’s latest earnings warned of slowing cloud revenue, triggering yesterday’s selloff. But is the slowdown temporary? Big Tech continues to pour money into AI infrastructure, AI companies and AI models — and all that data has to be stored somewhere. The question is: where?
Finally, a company that clearly missed the AI turn: Apple. Apple is nowhere to be found in the AI race. It has invested far less than peers, has no AI model, and opted instead to rely on Google’s Gemini.
That didn’t stop Apple from delivering strong holiday-quarter sales, which initially pushed the stock higher post-earnings in after-hours trading. But appetite faded quickly as investors worried that rising memory-chip prices could squeeze margins, regardless of Apple’s pricing power.
On the other side of the memory-chip trade, SK Hynix is up again — nearly 7% at the time of speaking. European futures are higher, US futures lower, reinforcing the idea that the rotation from US to non-US markets may continue into the weekly close.
And next week — it’s a new week.
Euro Area GDP Out and Trump to Announce Next Fed Chair
In focus today
In the euro area, we receive the first January inflation reports from Germany and Spain. Euro area inflation is expected to decline to 1.7% y/y from 1.94% y/y in December, driven by significant energy base effects despite higher energy prices in January. However, numerous one-offs and policy changes influencing the data warrant a more cautious interpretation than usual.
We also get the first estimate of euro area GDP for Q4 2025, which is likely to show that the euro area ended the year on a solid growth momentum, with strong PMIs for Q4. Preliminary GDP release from Germany showed growth of 0.2% q/q as industrial activity rebounded. Combining these pieces of information, we expect the euro area Q4 GDP growth will come in at 0.3% q/q. We also get the unemployment rate for December which we expect to show a stable unemployment rate of 6.4%.
In the US, the delayed December PPI report is due, following CPI data that came in slightly below expectations. Senate Democrats have slowed progress on the appropriations bill to fund the government. If unresolved today, a partial shutdown could occur, though such situations are often resolved last minute.
In Norway, December retail sales are released. After rising 1.3% in November, we estimate a 0.5% decline in December, partly due to seasonal adjustment issues related to Black Week shifting Christmas trade.
In Sweden, focus turns to December retail sales and November wage growth. Retail sales likely declined in December after November's sharp rise driven by Black Week shopping. Wage growth remains steady at 3.6% y/y and is expected to hold.
In China, the official PMI data from NBS will be released on Saturday. Manufacturing PMI rebounded above the 50-mark in December, and we expect it to remain broadly stable in January, supported by strong exports.
Economic and market news
What happened overnight
In the US, Donald Trump announced that he will name a replacement for Jerome Powell as Chair of the Fed today, 30 January. There is significant focus on whether the pick would be more dovish and in alignment with Trump's administration. The shortlist reportedly includes Kevin Warsh, Kevin Hasset, Christopher Waller and Rick Rieder. While Rieder had been leading predictions in recent days, betting markets shifted yesterday, with Warsh now considered the favourite, holding a 92% probability on Polymarket.
Oil prices have increased lately with Brent crude benchmark trading at USD 69.75 this morning, after briefly reaching USD 70.75 overnight. The increase has been driven by weaker USD and markets increasingly pricing in a geopolitical risk premium, as tensions continue to build up in Iran. Yesterday, the EU agreed to hit Iran with sanctions, including the designation of its Islamic Revolutionary Guard Corps as a terrorist organisation. Additionally, overnight, Donald Trump signed an executive order to establish a process for imposing tariffs on goods from countries that supply oil to Cuba.
What happened yesterday
In Norway, the unemployment rate (SA) from NAV surprised by falling to 2.1% in December, despite a clear downward trend in employment throughout Q4. While a slight drop in the labour force contributed, it cannot fully explain the decline. Our seasonal adjustment shows that unemployment was approximately 2.15% in both November and December, so that most of the fall was due to rounding. For January, we expect the unemployment rate (SA) to remain unchanged at 2.1%, with a risk that it will rise to 2.2%.
In Sweden, the Riksbank left the policy rate unchanged at 1.75%, as widely expected. The Riksbank reiterated that "the rate is expected to remain at this level for some time to come", as it assesses that the current rate supports economic activity strengthening and stabilizes inflation around the target over the longer term. For more details, see Riksbank review: January 2026, 29 January. Meanwhile, the NIER survey weakened slightly but remained solid, with minor changes from the previous month. Household sentiment continues to drag the indicator lower, while the corporate outlook remains strong. Notably, recent hard data shows a pickup in consumption.
In Germany, data from the Ministry of Finance showed that public investments fell 25% short of the target in 2025. Total public investments amounted to EUR 86.8bn in 2025 which was 17% higher than in 2024 but at the same time 25% below the targeted EUR 115.6bn. Defence expenditures amounted to EUR 87.0bn in 2025 which was 18% more than in 2024 but 7% short of the EUR 94.0bn target. The failure to reach the targets is a slightly dovish signal for the ECB but not enough to cause a rate cut in 2026 as there is still a large increase in spending. For details, see German Fiscal Tracker, 29 January.
In the US, the Chicago Fed's latest unemployment rate 'nowcast' signals a potential dip to 4.3% in the upcoming January Jobs Report. High-frequency data has been generally positive as jobless claims continue to decline, ADP's weekly data indicates jobs growth during the reference period, and online job postings have modestly increased.
Equities: Thursday saw a reversal of some of this week's key trading themes. First, tech underperformed sharply, driven by Microsoft (-10%), with other software stocks also suffering, such as Zscaler and Strategy Inc. Semiconductors, however - which have been the outperformers lately - held up well in what was largely a software-related selloff. It is also worth adding that Meta jumped 10%. This was therefore not a broad-based tech selloff like last quarter, when AI capex was in focus. Again, remember that the previous tech selloff did not coincide with earnings reports but occurred a week later, so it is too soon to draw broad conclusions. As our readers know, we prefer riding the AI wave through Asia (the Kospi is up another 1% this morning) while remaining neutral on the global tech sector.
FI and FX: EUR/USD slid through the night and is currently trading in the low 1.19's. NOK had a strong first half of yesterday's session, under a lot of volatility. As SEK trading was muted on the back of an undramatic Riksbank, with the Swedish Krona holding steady we saw NOK/SEK edge higher through the day. The sharp rally in the oil market continued yesterday, with Brent trading at the highest levels since last summer. Yesterday also saw wild swings in the metals space, with copper rising 11% whilst the price of Gold saw a sudden and dramatic fall at 16:00 CET, before eventually recouping some of the losses. Finally, reports have it that Kevin Warsh is likely to be Trump's nominee as the next Fed chair, due to be announced today.