Sample Category Title
EU and Eurozone economic sentiment jumps as confidence broadens Into 2026
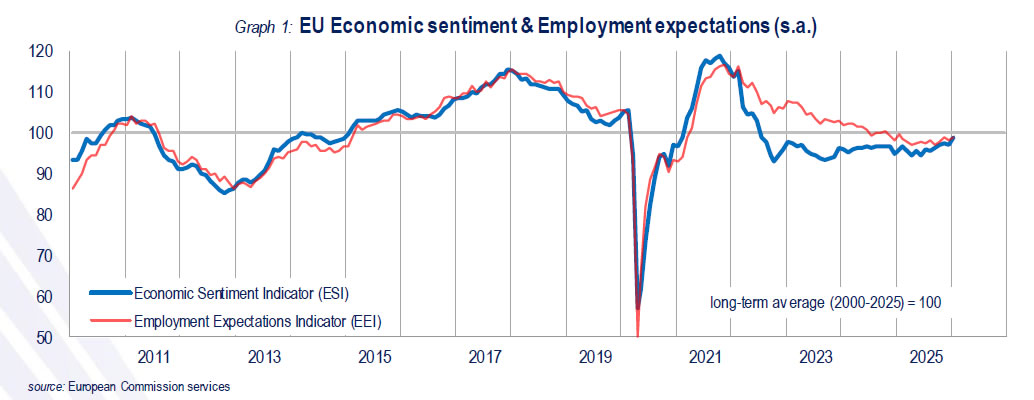
Economic sentiment in Europe improved sharply in January, with the Economic Sentiment Indicator rising 1.9 points to 99.2 in the EU and 2.2 points to 99.4 in the Eurozone. The readings mark the closest approach to the long-term average of 100 since mid-2022, signaling a meaningful improvement in confidence at the start of 2026.
Labor outlook strengthened alongside sentiment. Employment Expectations Indicator climbed to its highest level in 12 months in both the EU (99.1) and the Eurozone (98.2), suggesting firms are becoming more confident about near-term hiring despite lingering macro uncertainty.
The improvement was broad-based. Confidence rose across industry, services, retail trade, and among consumers, with construction the only sector showing a marginal decline. Country data also highlights the breadth of the rebound, with notable gains in all six largest EU economies: France (+5.8), Germany (+3.0), Poland (+2.9), Netherlands (+2.3), Spain (+1.7) and Italy (+1.3), pointing to a region-wide uplift rather than isolated strength.
Crypto in Zugzwang
Market Overview
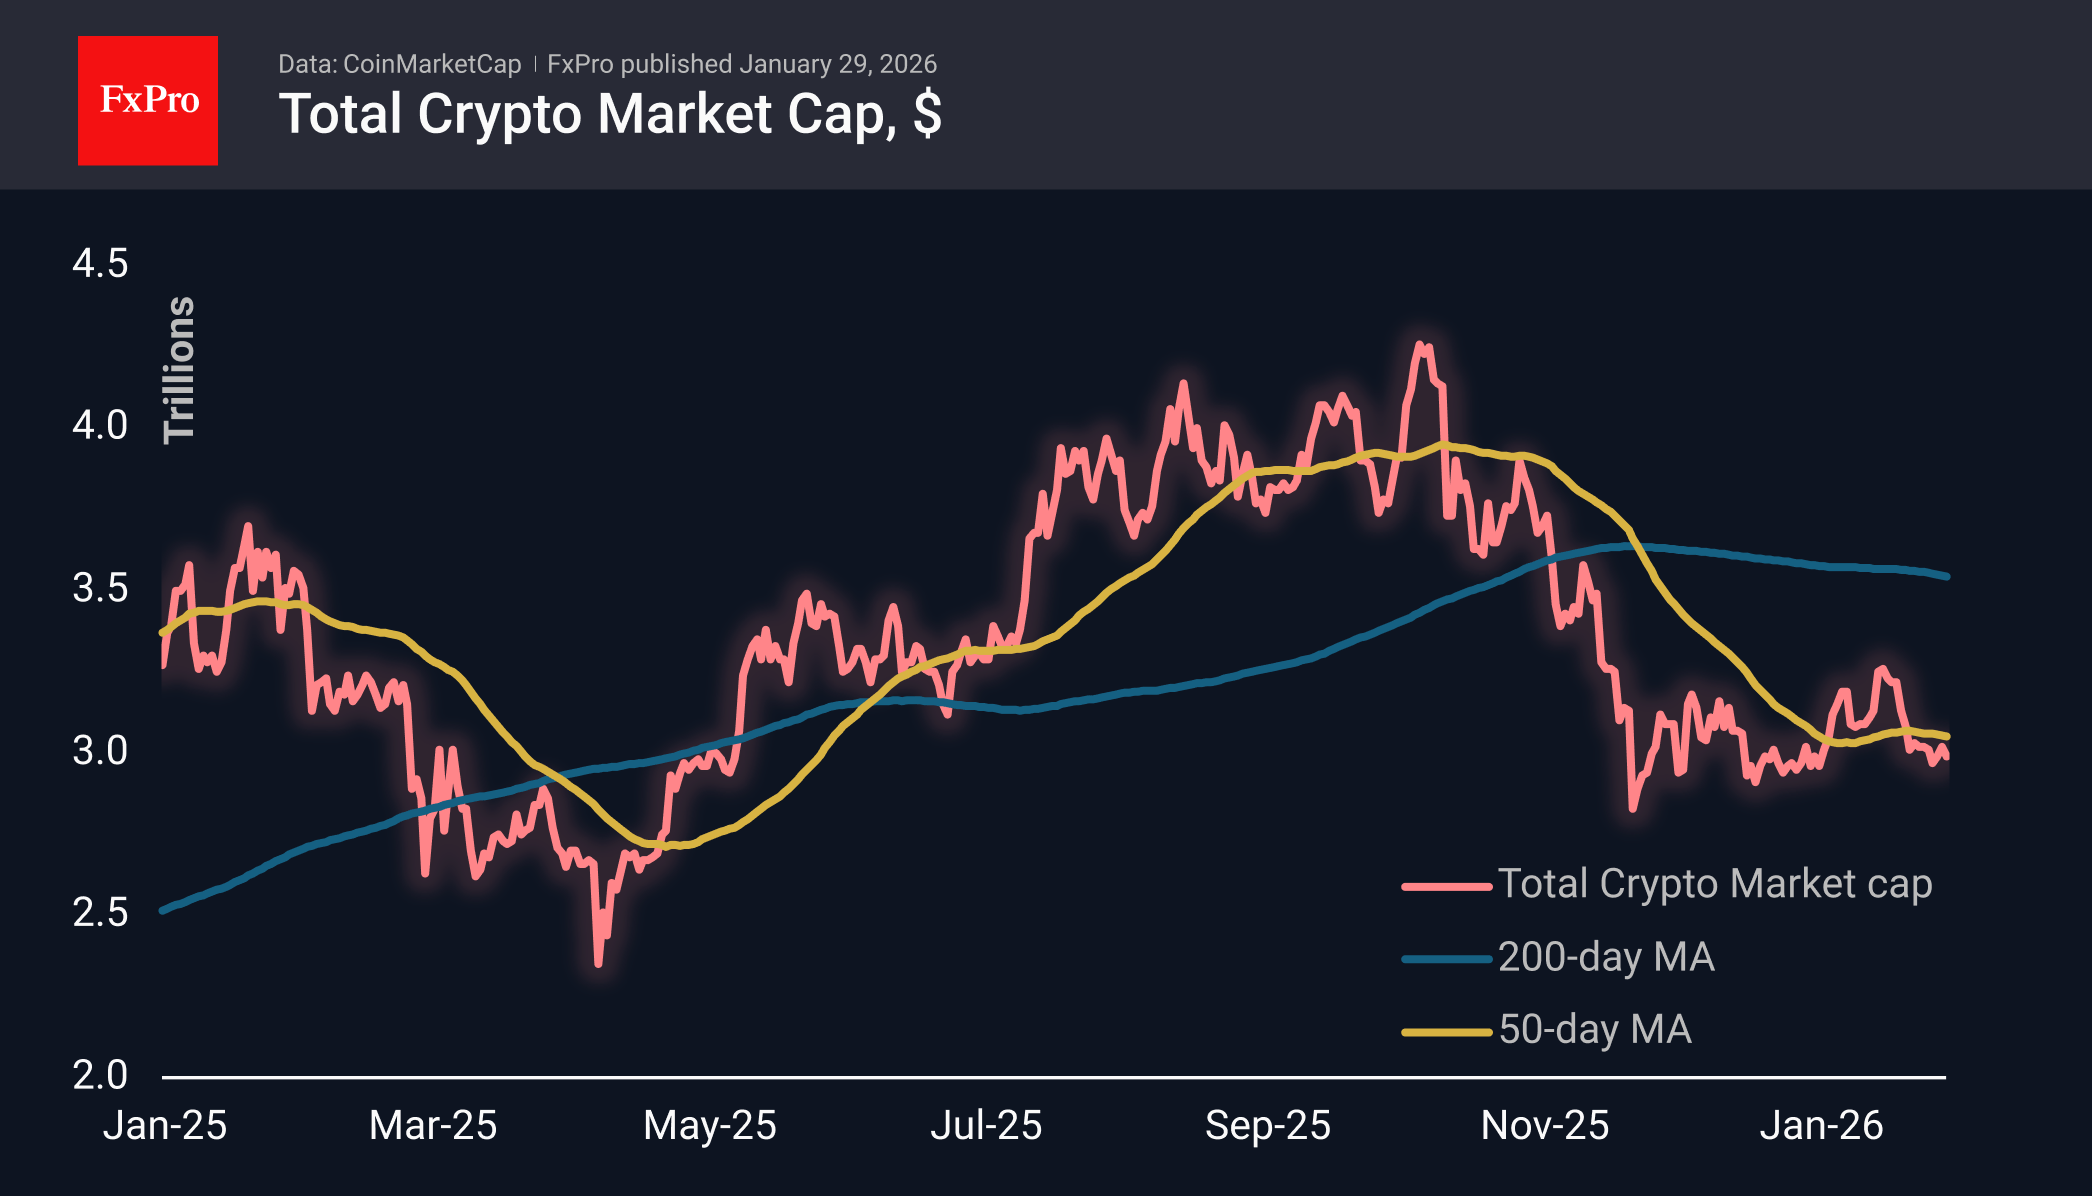
The cryptocurrency market continues to lag, unable to keep pace with the growing stock and metal markets. Suddenly, cryptocurrencies no longer appear to be an alternative to fiat money and a hedge against the not-so-responsible financial policies of major countries. The weak performance of cryptocurrencies has been accompanied by a sharp surge in interest in precious metals. As a result, cryptos temporarily appear to be a source of funds for strengthening positions in gold and silver. At the same time, they are not giving up important local support levels, both in terms of market capitalisation as a whole and individual coins – Bitcoin, Ethereum, XRP, and Solana.
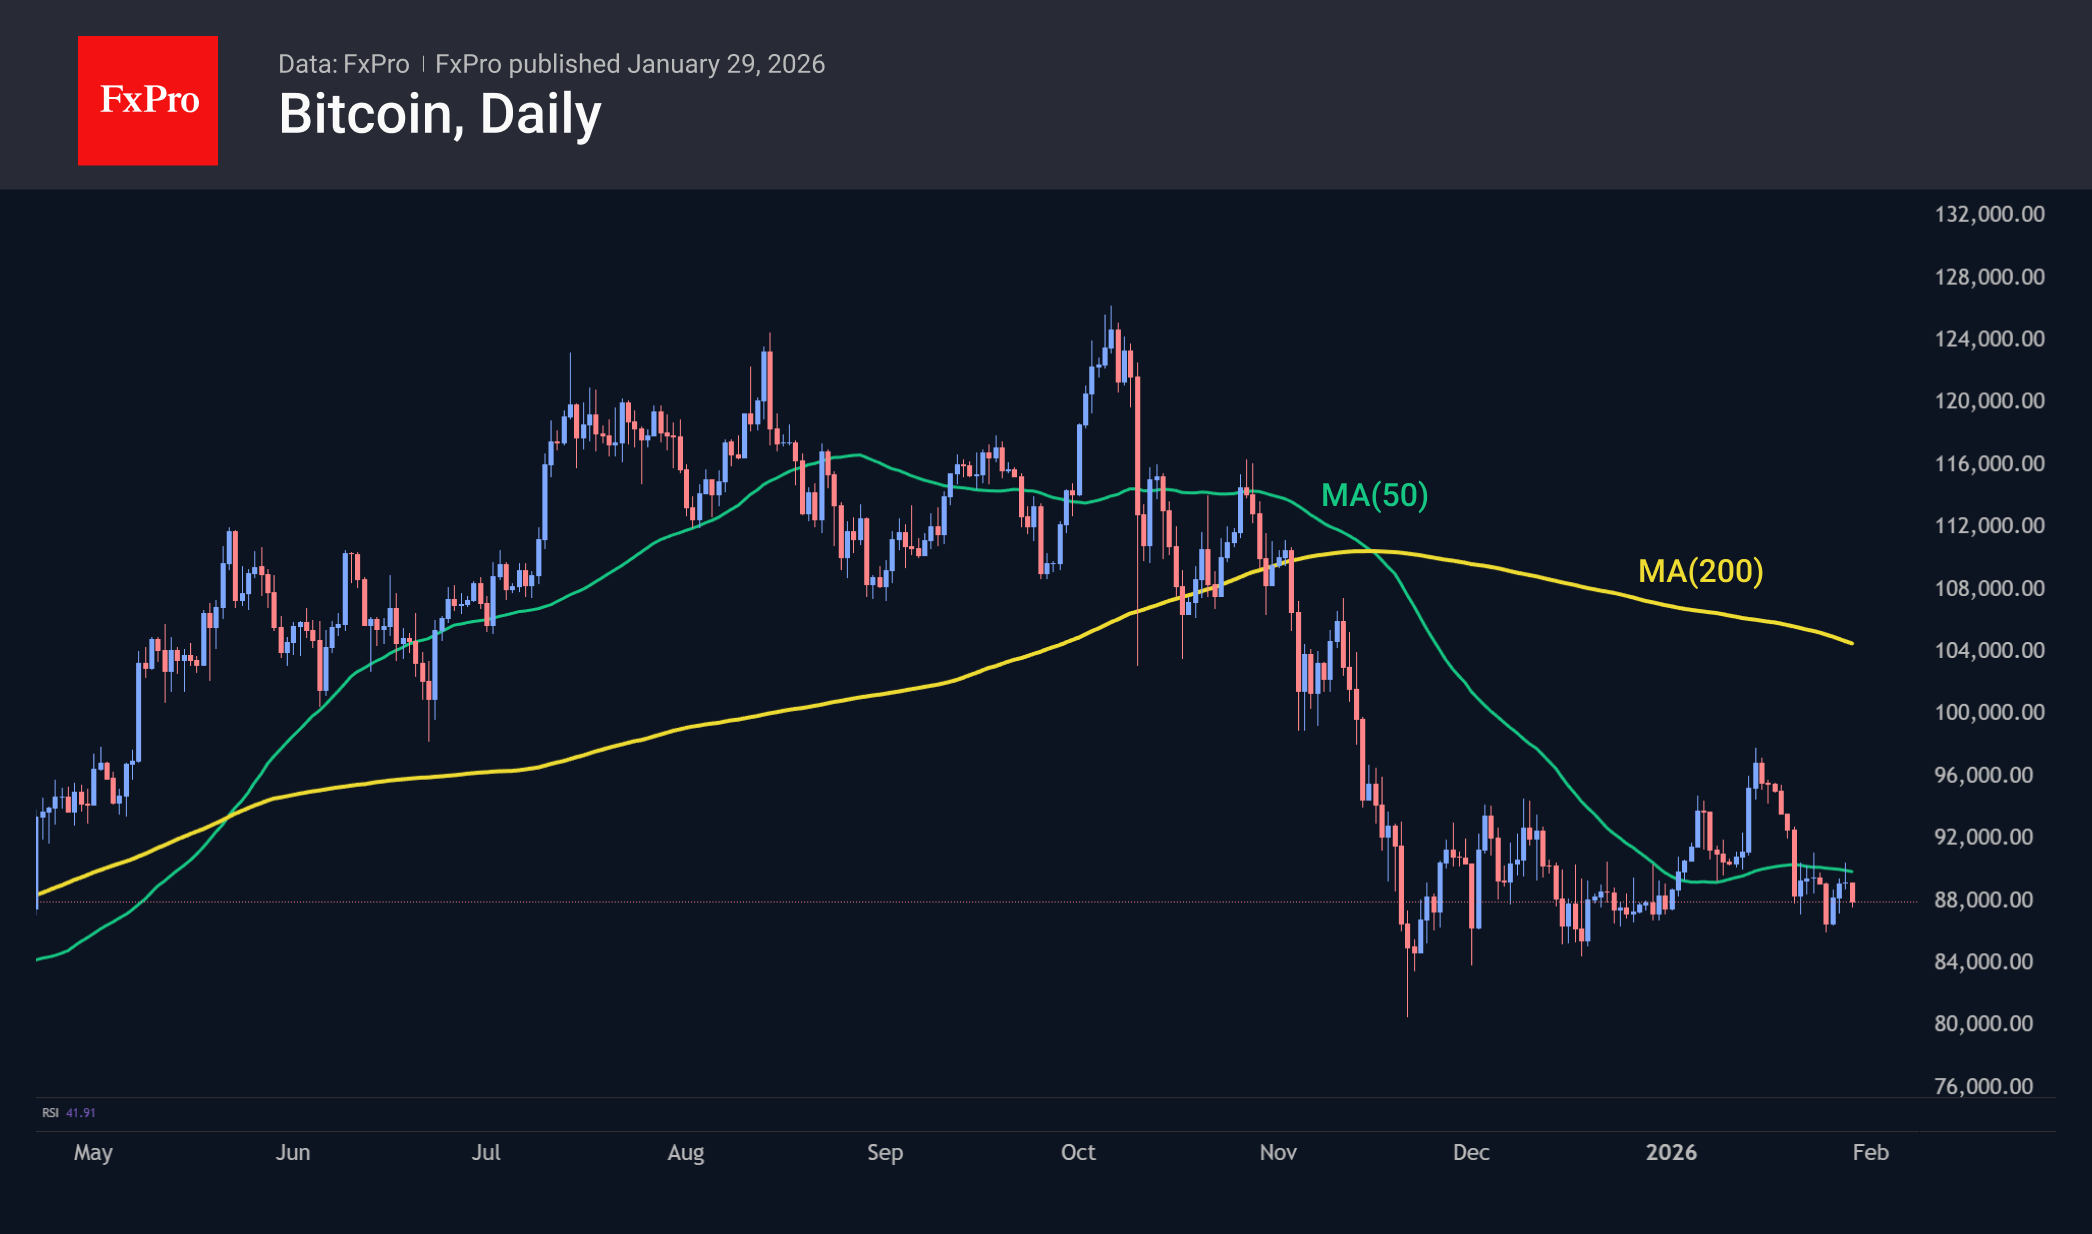
On Wednesday evening, Bitcoin saw another round of sell-offs as the market attempted to break above $90K, failing yet again to return above the 50-day moving average. This curve is gradually turning downwards, further strengthening the bearish arguments. On the other hand, BTC has not yet begun an active decline after consolidation. A formal signal for the start could be a break of support near $85K. An important question is whether a sharp downturn in metals will help cryptocurrencies by restoring interest in them, or whether it will cause even more damage. We lean towards the latter due to the potential for deleveraging, which is dangerous for all risky assets in the early stages. This is a zugzwang situation, where the next move only makes the situation worse.
News Background
Bitcoin is trading just above $86,600, which is the average entry price for spot ETF buyers, according to CryptoQuant. A fall below this ‘psychological barrier’ will deprive holders of their ‘profit buffer’ and trigger an acceleration in the sale of shares.
Glassnode notes a market recovery after October’s deleveraging. The key trend is a shift in focus from aggressive risk to defensive strategies. Traders have reallocated capital from perpetual futures to the options market.
In January, precious metals surpassed cryptocurrencies in popularity on social media, according to Santiment. Investors’ attention has shifted to gold and silver due to the sharp rise in their prices.
Tether stores about 140 tonnes of gold worth $23 billion in a former nuclear bunker in Switzerland, said company head Paolo Ardoino. This makes Tether the largest private holder of physical gold in the world. Last year, the company acquired more than 70 tonnes of the precious metal and intends to continue purchasing.
In early February, Fidelity will launch its own stablecoin on the Ethereum blockchain. The creation of the asset will be a response to growing customer demand and part of a strategy to expand the practical utility of blockchain-based financial instruments.
Ripple has introduced Ripple Treasury, a platform for corporate treasury management. The solution allows traditional cash and digital assets to be managed in a single system to simplify cross-border payments and liquidity management.
GBP/USD at Peak Levels: Attention Shifts to the Bank of England
GBP/USD remains near its August 2021 highs, holding around 1.3834 on Thursday, as heightened volatility in the US dollar continues to weigh on the pair.
Market participants are reacting to US Treasury Secretary Scott Bessent's comments, stating that Washington has no plans to intervene in currency markets by selling dollars against the yen. This statement has added to the prevailing sentiment of a "sell America" strategy, which is putting downward pressure on the dollar.
With the US Federal Reserve expected to keep interest rates unchanged, market focus has shifted towards the Bank of England. The consensus is that the BoE will maintain its key rate at 3.75% at next week's meeting. This expectation is supported by rising inflation, which hit 3.4% in December, alongside recent retail sales data showing increased price pressures.
Technical Analysis
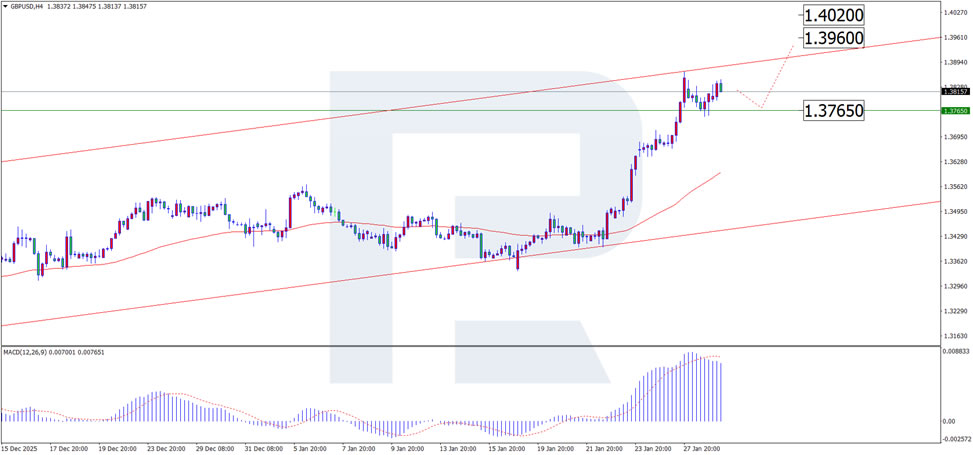
On the H4 chart, GBP/USD is currently undergoing a correction from the 1.3845 level. The market may continue this pullback to support at 1.3765, before potentially bouncing higher. The first target for any upward movement would be resistance at 1.3960, followed by 1.4020. This scenario is confirmed by the MACD indicator, which shows a downward trend but remains above the zero level.
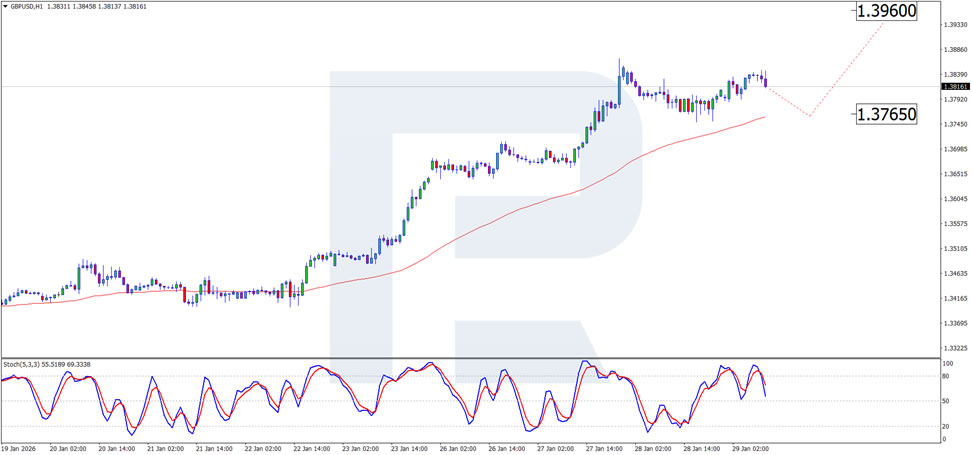
On the H1 chart, the correction from 1.3845 continues, with the next support target around 1.3765. A rebound from this level could drive prices higher, supporting further upward momentum. This is confirmed by the Stochastic oscillator, which shows a decline but remains below the 80.0 mark.
Conclusion
GBP/USD remains strong at its recent highs, and attention is now turning to the upcoming BoE decision. While the pair is currently in a correction phase, the outlook for further growth remains positive, depending on the Bank of England's response to inflation pressures.
GBP/JPY Daily Outlook
Daily Pivots: (S1) 210.61; (P) 211.32; (R1) 212.58; More...
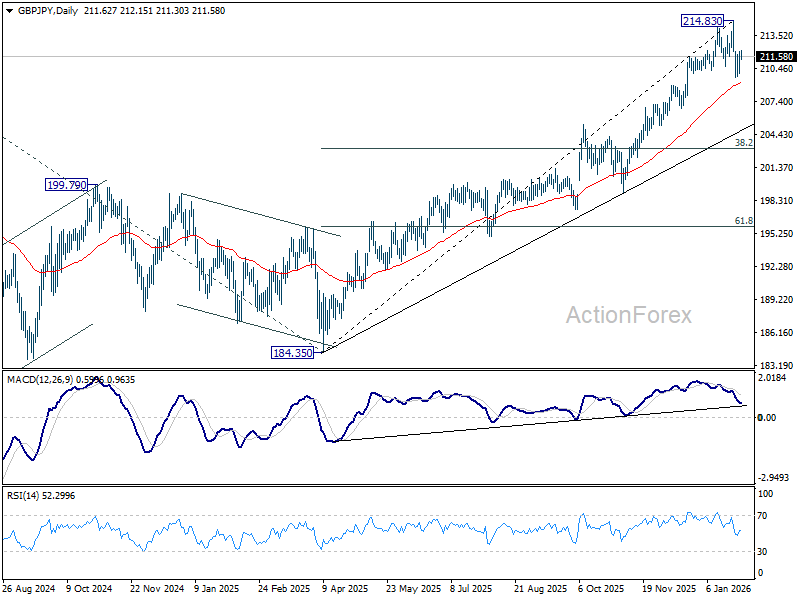
Intraday bias in GBP/JPY remains neutral for consolidations above 209.61 temporary low. Risk will stay on the downside as long as 214.83 holds, even in case of strong recovery. Below 209.61, and sustained break of 55 D EMA (now at 209.18) will argue that it's correcting whole rise from 184.35 and target 38.2% retracement of 184.35 to 214.83 at 203.18.
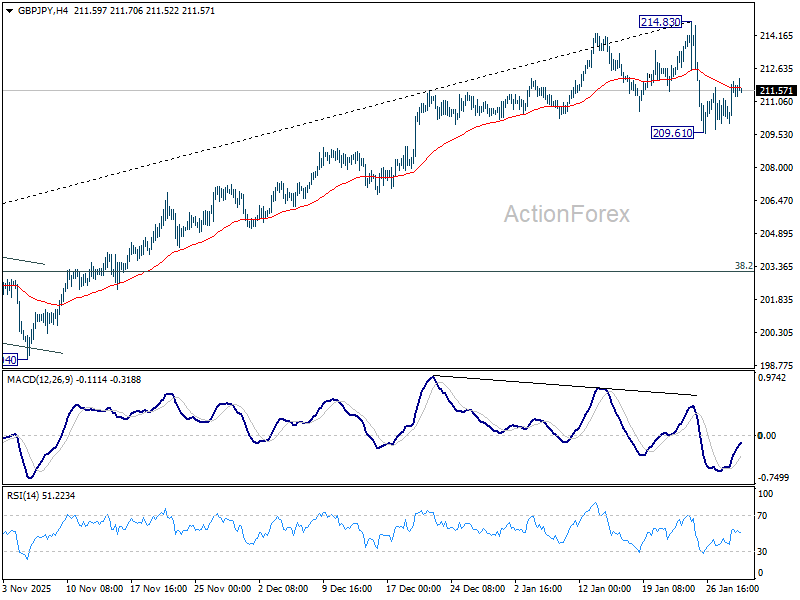
In the bigger picture, up trend from 123.94 (2020 low) is in progress. Next target is 61.8% projection of 148.93 (2022 low) to 208.09 (2024 high) from 184.35 at 220.90. On the downside, break of 205.30 resistance turned support is needed to indicate medium term topping. Otherwise, outlook will stay bullish even in case of deep pullback.
EUR/JPY Daily Outlook
Daily Pivots: (S1) 182.77; (P) 183.19; (R1) 183.81; More...
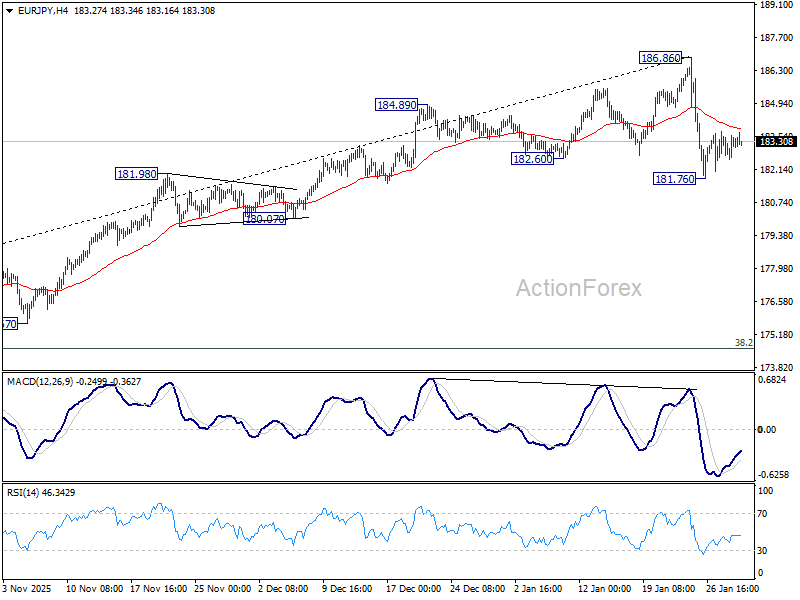
Intraday bias in EUR/JPY remains neutral for consolidations above 181.76 temporary low. Risk will stay on the downside as long as 186.86 holds, in case of strong recovery. Break of 181.76 and sustained trading below 55 D EMA (now at 182.19) should solidify the case that fall from 186.86 medium term top is correcting whole rise from 154.77. Deeper decline should then be seen to 38.2% retracement of 154.77 to 186.86 at 174.60.
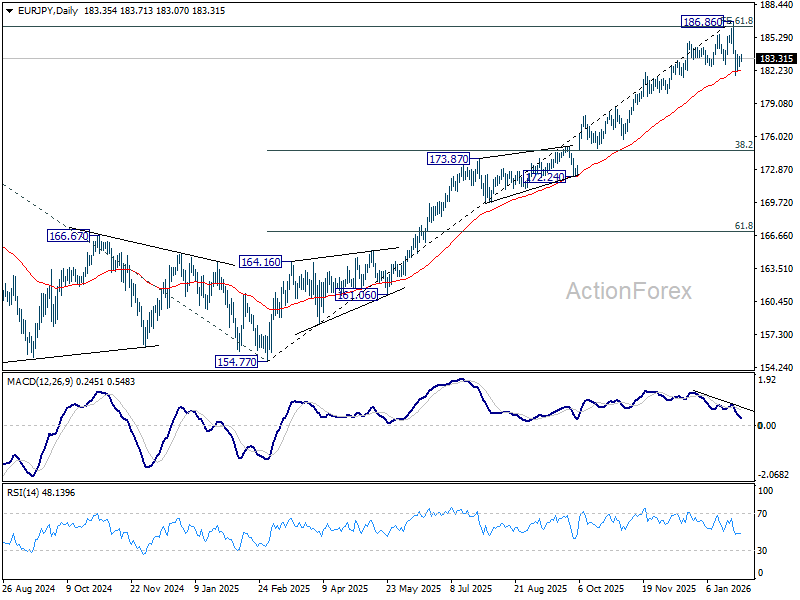
In the bigger picture, up trend from 114.42 (2020 low) is in progress and and met 61.8% projection of 124.37 to 175.41 from 154.77 at 186.31. Considering bearish divergence condition in D MACD, upside could be capped by 186.31 on first attempt. Still, outlook will stay bullish as long as 55 W EMA (now at 173.32) holds, even in case of deep pullback. Sustained break of 186.31 will pave the way to 78.6% projection at 194.88 next.
EUR/GBP Daily Outlook
Daily Pivots: (S1) 0.8635; (P) 0.8671; (R1) 0.8693; More…
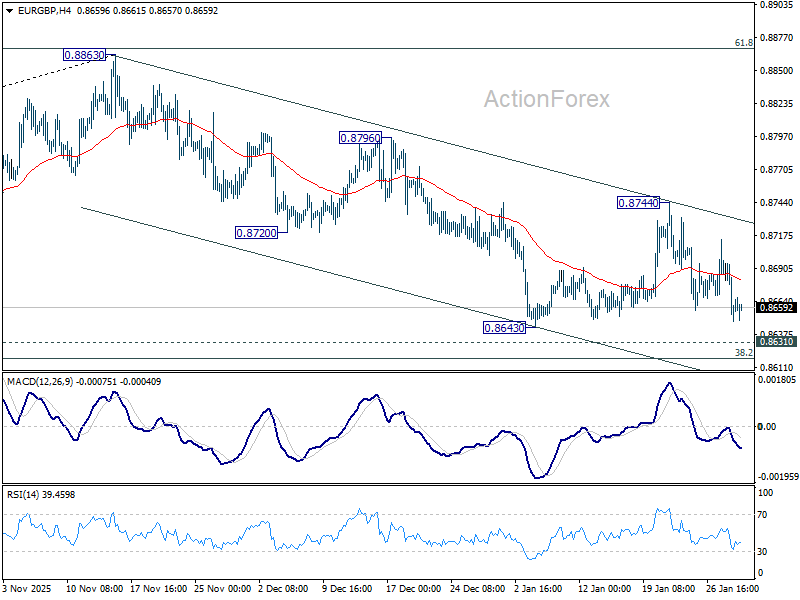
Range trading continues in EUR/GBP and intraday bias stays neutral. Risk will remain on the downside as long as 0.8744 resistance holds. Further decline is expected to 0.8631 cluster support (38.2% retracement of 0.8221 to 0.8663 at 0.8618). Decisive break there will carry larger bearish implications and pave the way to 61.8% retracement at 0.8466.
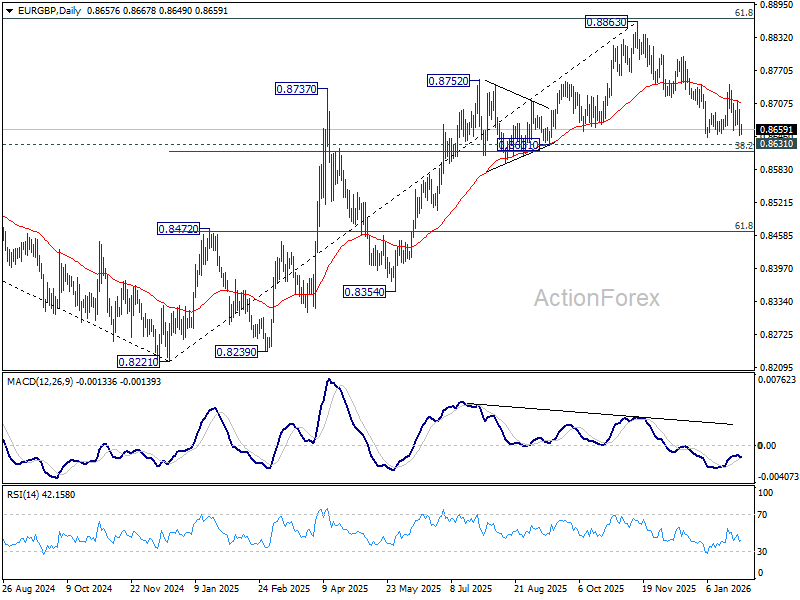
In the bigger picture, rise from 0.8221 medium term bottom (2024 low) is seen as a corrective move. Upside should be limited by 61.8% retracement of 0.9267 to 0.8221 at 0.8867. Sustained trading below 55 W EMA (now at 0.8625) should confirm that this corrective bounce has completed. In this case, deeper fall would be seen back to 0.8201/21 key support zone. However, decisive break of 0.8867 will suggest that EUR/GBP is already reversing whole decline from 0.9267 (2022 high). That should pave the way back to 0.9267.
EUR/AUD Daily Outlook
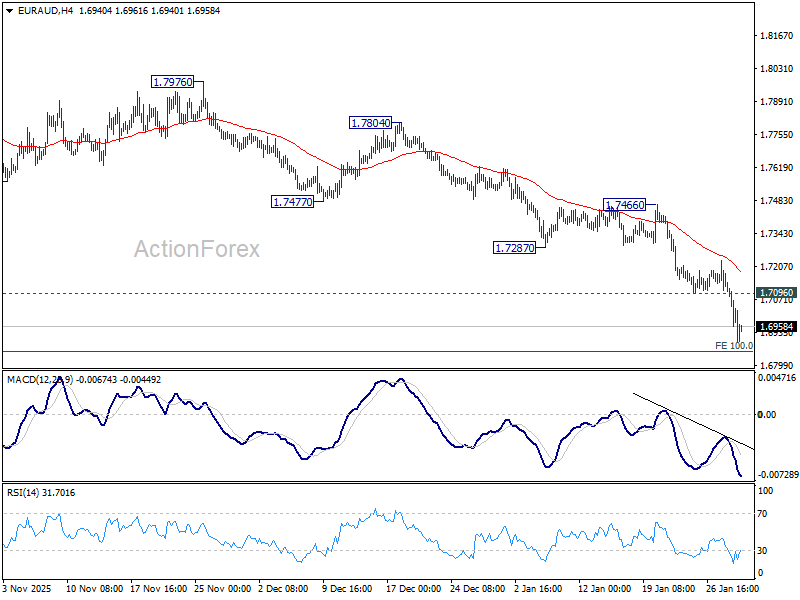
Daily Pivots: (S1) 1.6900; (P) 1.7046; (R1) 1.7123; More...
Intraday bias in EUR/AUD remains on the downside for 100% projection of 1.8554 to 1.7245 from 1.8160 at 1.6851. Some support could be seen from there to bring rebound. Break of 1.7096 support turned resistance will turn bias back to the upside for stronger rebound. However, decisive break of 1.6851 will likely bring downside acceleration to 138.2% projection at 1.6351 next.
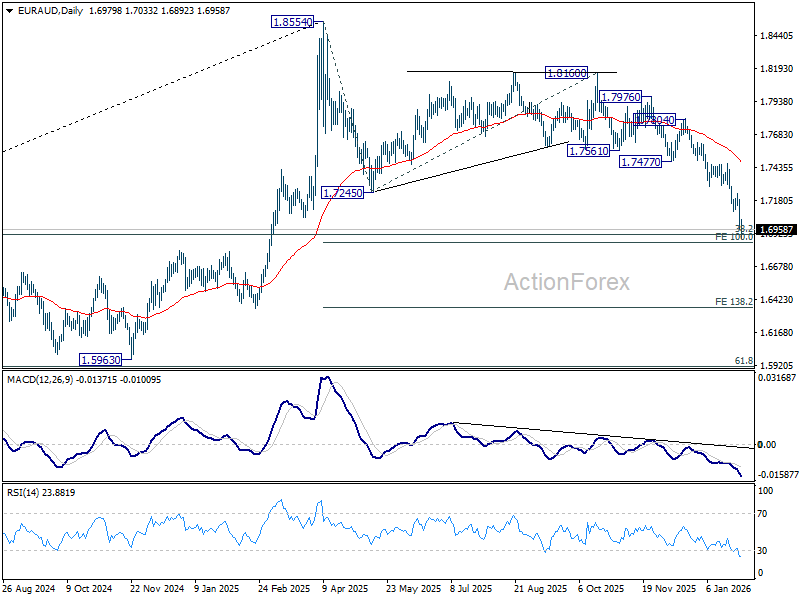
In the bigger picture, fall from 1.8554 is seen as correction to up trend from 1.4281 (2022 low). Strong support should be seen from 38.2% retracement of 1.4281 to 1.8554 at 1.6922 to bring rebound. However, risk will stay on the downside as long as 55 D EMA (now at 1.7473) holds. Sustained break of 1.6922 will raise the chance of bearish trend reversal, and target 61.8% retracement at 1.5913.
EUR/CHF Daily Outlook
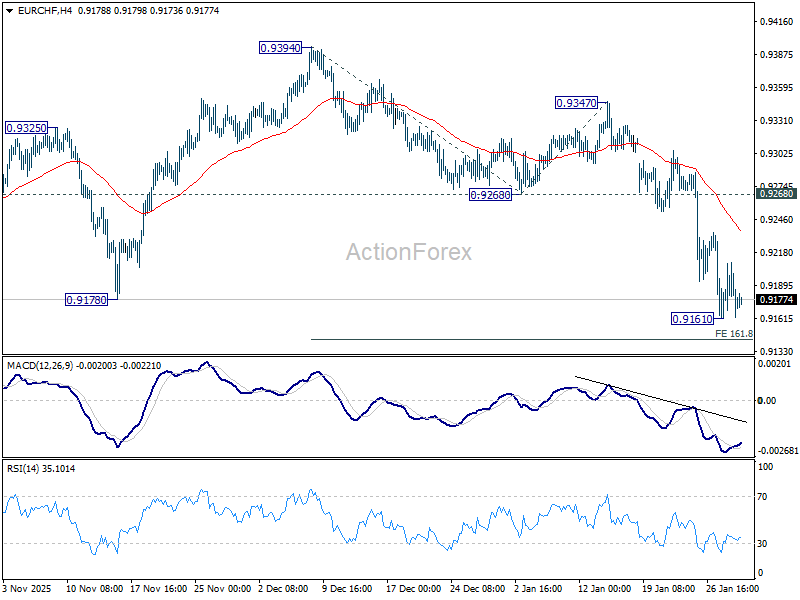
Daily Pivots: (S1) 0.9162; (P) 0.9187; (R1) 0.9211; More....
Intraday bias in EUR/CHF remains neutral and more consolidations would be seen above 0.9161 temporary low. Upside should be limited below 0.9268 support turned resistance. Firm break of 161.8% projection of 0.9394 to 0.9268 from 0.9347 at 0.9143 will target 261.8% projection at 0.9017.
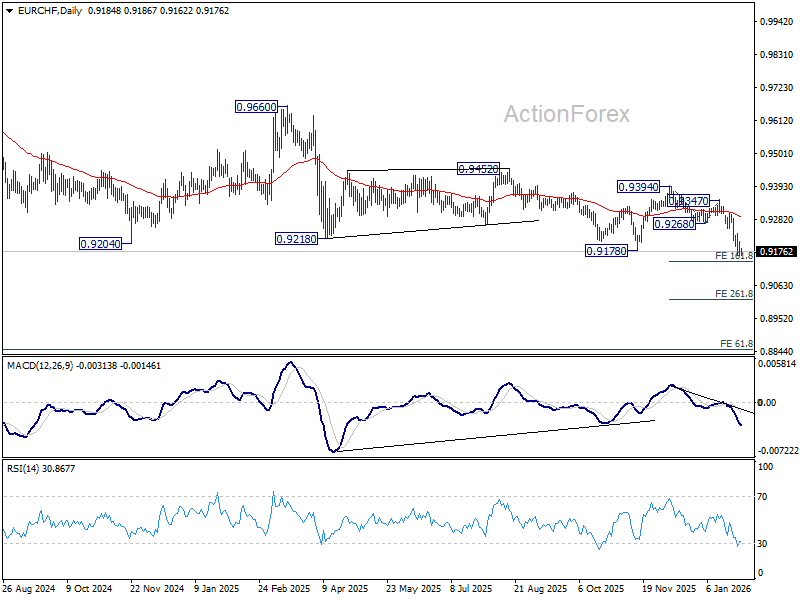
In the bigger picture, another rejection by 55 W EMA (now at 0.9350) keeps outlook bearish. Downtrend from 1.2004 (2018 high) is still in progress. Firm break of 0.9178 will target 61.8% projection of 1.1149 to 0.9407 from 0.9928 0.8851. Outlook will stay bearish as long as 0.9394 resistance holds, in case of recovery.
EUR/USD Daily Outlook
Daily Pivots: (S1) 1.1885; (P) 1.1965; (R1) 1.2035; More….
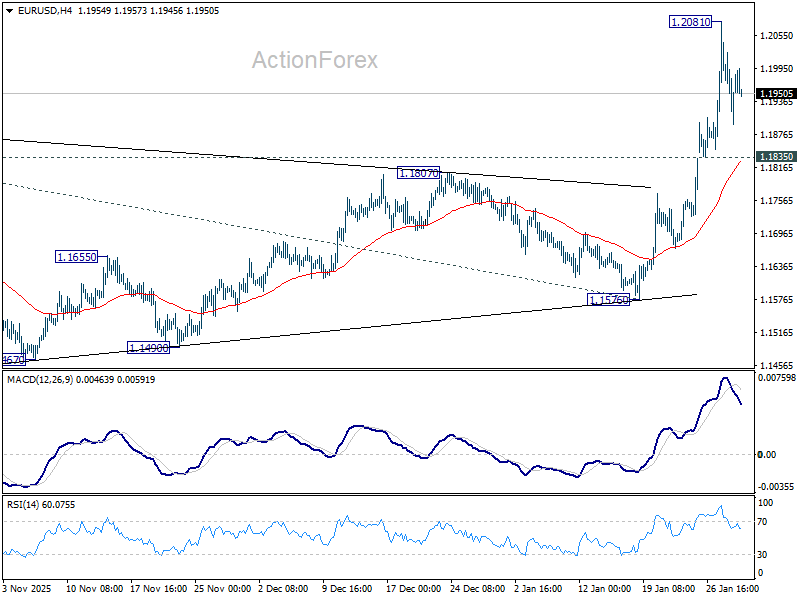
Intraday bias in EUR/USD remains neutral for consolidations below 1.2081 temporary top. Downside should be contained by 1.1835 support. Decisive break above 1.2 will carry larger bullish implications. Next near term target will be 38.2% projection of 1.0176 to 1.1917 from 1.1576 at 1.3434. However, break of 1.1835 will indicate short term topping, and turn bias to the downside for deeper pullback.
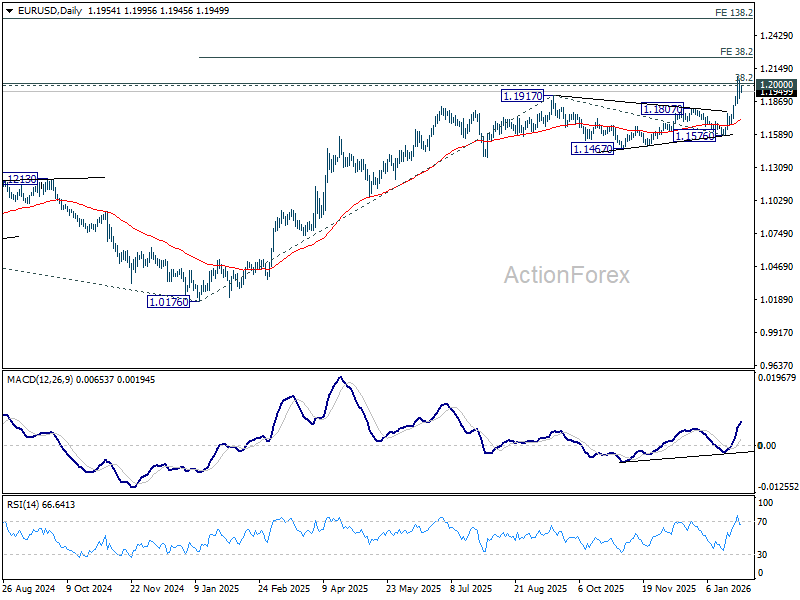
In the bigger picture, as long as 55 W EMA (now at 1.1443) holds, up trend from 0.9534 (2022 low) is still in favor to continue. Decisive break of 1.2 key psychological level will add to the case of long term bullish trend reversal. Next medium term target will be 138.2% projection of 0.9534 to 1.1274 from 1.0176 at 1.2581. However, sustained trading below 55 W EMA will argue that rise from 0.9534 has completed as a three wave corrective bounce, and keep long term outlook bearish.
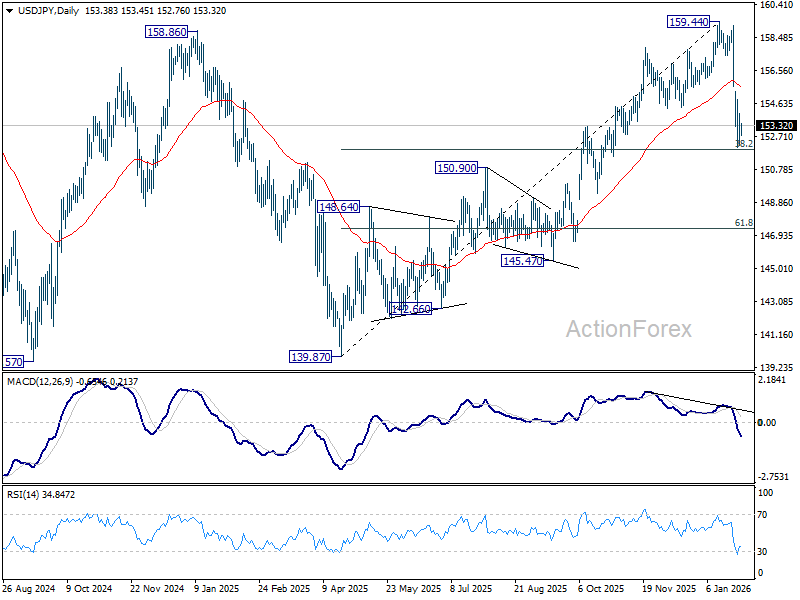
USD/JPY Daily Outlook
Daily Pivots: (S1) 152.38; (P) 153.21; (R1) 154.24; More...
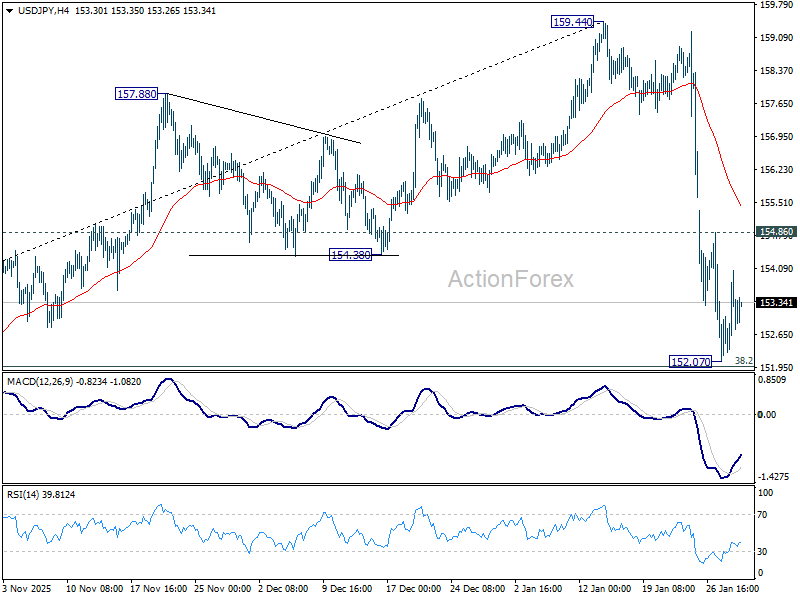
Intraday bias in USD/JPY stays neutral for consolidations above 152.07. As noted before, fall from 159.44 is seen as correcting the rise from 139.87. Strong support should be seen from 38.2% retracement of 139.87 to 159.44 at 151.96 to bring rebound, at least on first attempt. On the upside above 154.86 minor resistance will turn intraday bias to the upside for recovery. However, decisive break of 151.96 will argue that it is reversing whole rise from 139.87. Deeper decline would then be seen to 61.8% retracement at 147.34.
In the bigger picture, outlook is unchanged that corrective pattern from 161.94 (2024 high) should have completed with three waves at 139.87. Larger up trend from 102.58 (2021 low) could be ready to resume through 161.94. This will remain the favored case as long as 55 W EMA (now at 151.35) holds. However, sustained break of 55 W EMA will argue that the pattern from 161.94 is extending with another falling leg.