Sample Category Title
WTI Explodes to $66 as Iran Tensions Boil – US Oil Outlook
- Oil jumps 5% as traders predict attacks on Iran are getting closer by the second
- Exploring Technical Analysis for a rally in the commodity
- WTI could still be rising further – checking potential levels for breakouts
Oil is a complex commodity to trade – affected by numerous countries, suppliers, refineries, economic activity, and, these days, conflicts.
Iran has been a boiling pot for tensions since 1979, with the Islamic Regime extending extremist policies in the Middle East, supplementing small regional tensions to sponsoring full-capacity armies like in Lebanon with Hezbollah, Gaza with Hamas, or even further in Yemen with the Houthis.
The issue is when such policies come at the cost of Iran's own civilian population, victim of extreme inflation, pollution, and resource scarcity (water levels are at 60-year lows) – The Iranian Rial has lost 97% of its value against the US Dollar in about a year.
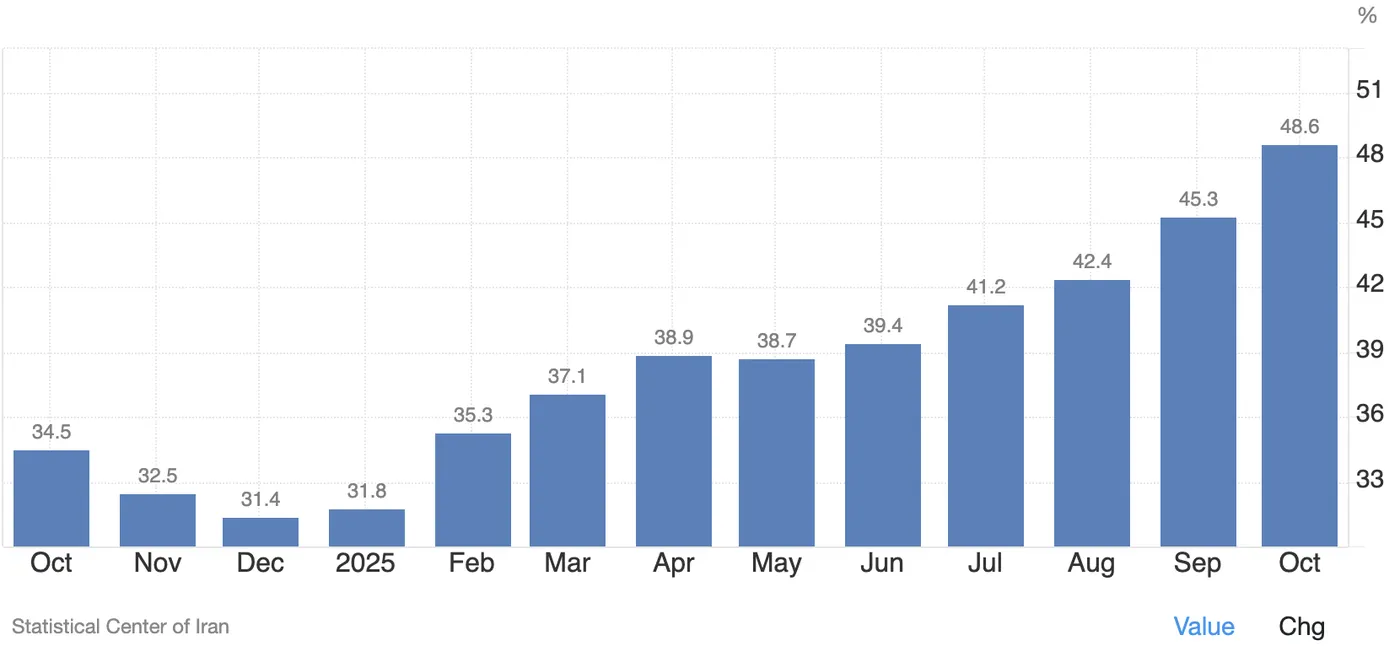
Iranian Inflation rate (until October 2025) – Source: TradingEconomics
With such conditions, without counting the public punishments and executions for regime dissenters, the population had seen many violent protests throughout the past many years.
But today looks even worse. An estimated 30,000 deaths are reported amid the recent revolts, and the toll could be even worse.
These reports and global US policies have pushed the Trump Administration to consider an imminent intervention to assist the Iranian population and eventually overthrow the Iranian government.
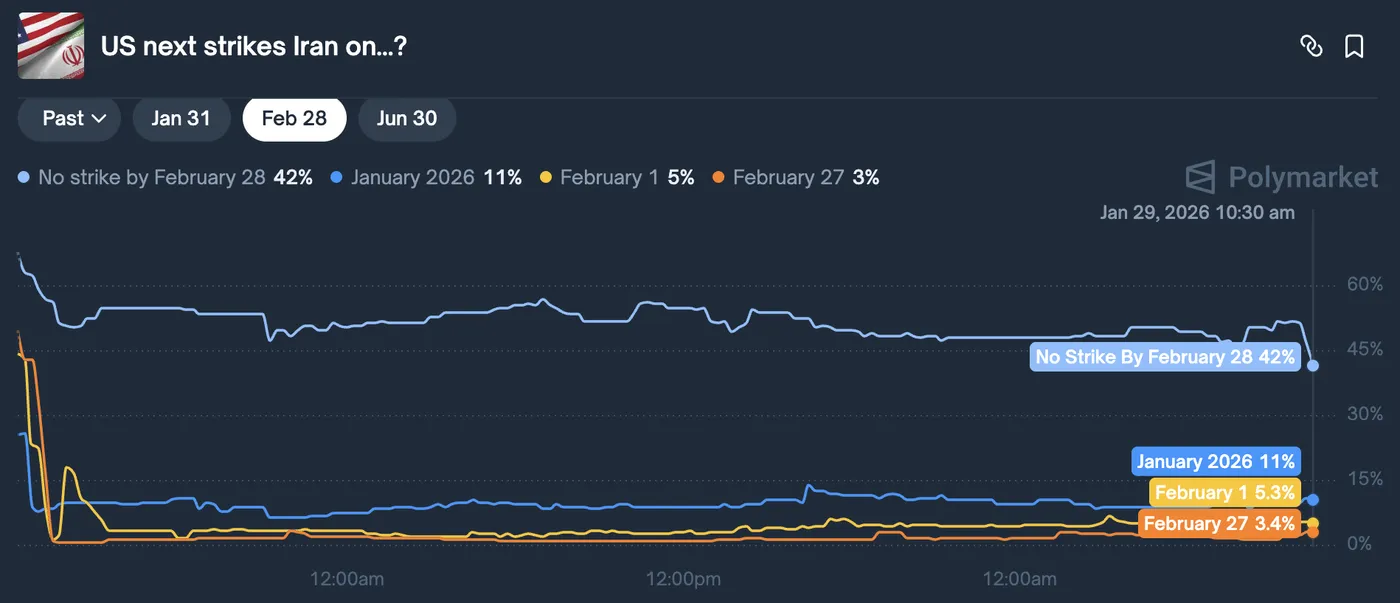
Odds for a US strike in Iran – Source: Polymarket
What concerns Markets is that Iran is a top-6 global oil producer and holds the second-largest natural gas reserves. If it were only that, Markets could be looking away after adding a small risk premium.
The larger threat, however, is the potential closure of the Strait of Hormuz, through which all energy-commodity shipping to Asia passes, accounting for around 20% of global Oil and gas flows.
During the 1980s, the Tanker War disrupted the Strait heavily, and attacks on tankers there could have a significant impact on Global Energy prices.
The current flows and tensions are also assisting Metals on their way to continued all-time highs. More on this coming up during today's session.
As traders price in more imminent interventions from the US, which could signal a larger regional war, let's dive into a multi-timeframe analysis of WTI (US) Oil to determine whether technicals point to continued upside or if prices are approaching relative extremes.
US Oil Multi-Timeframe Analysis
WTI Daily Chart
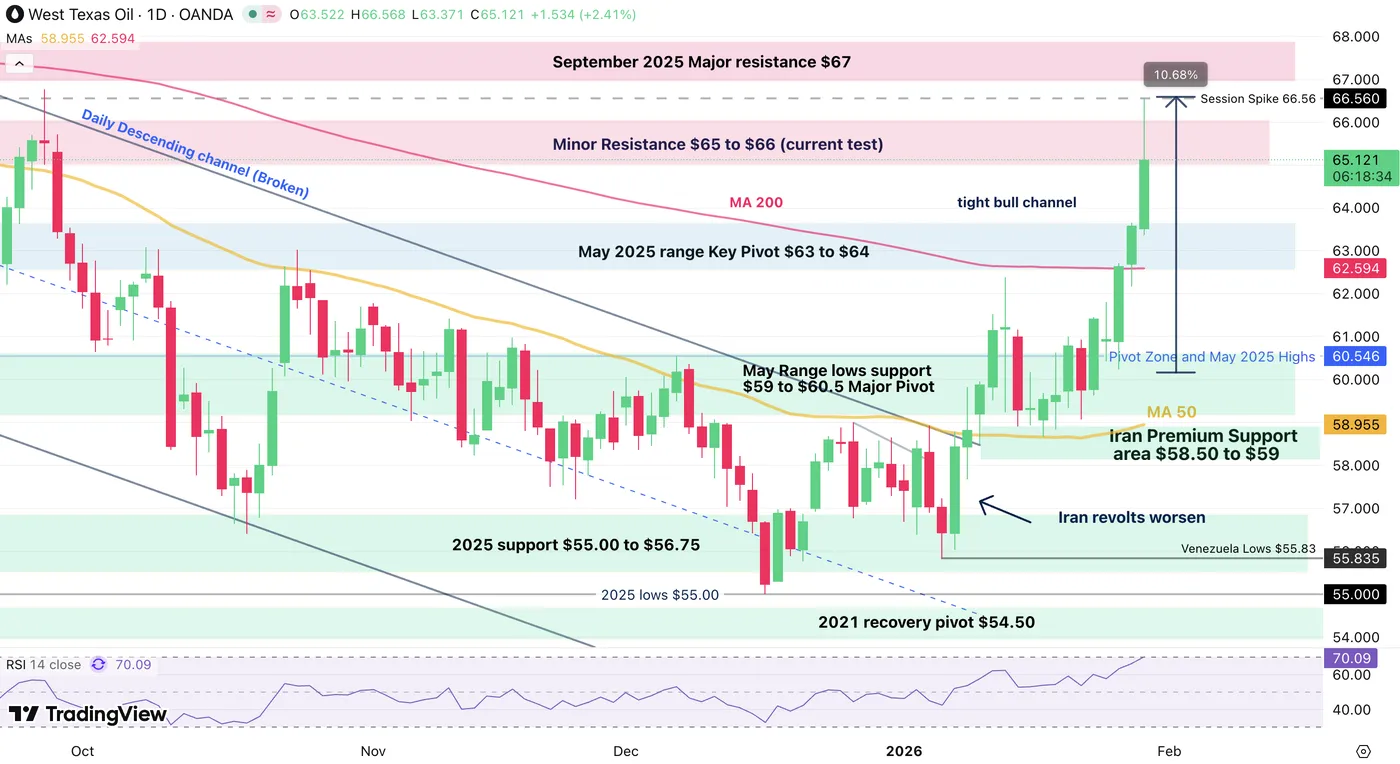
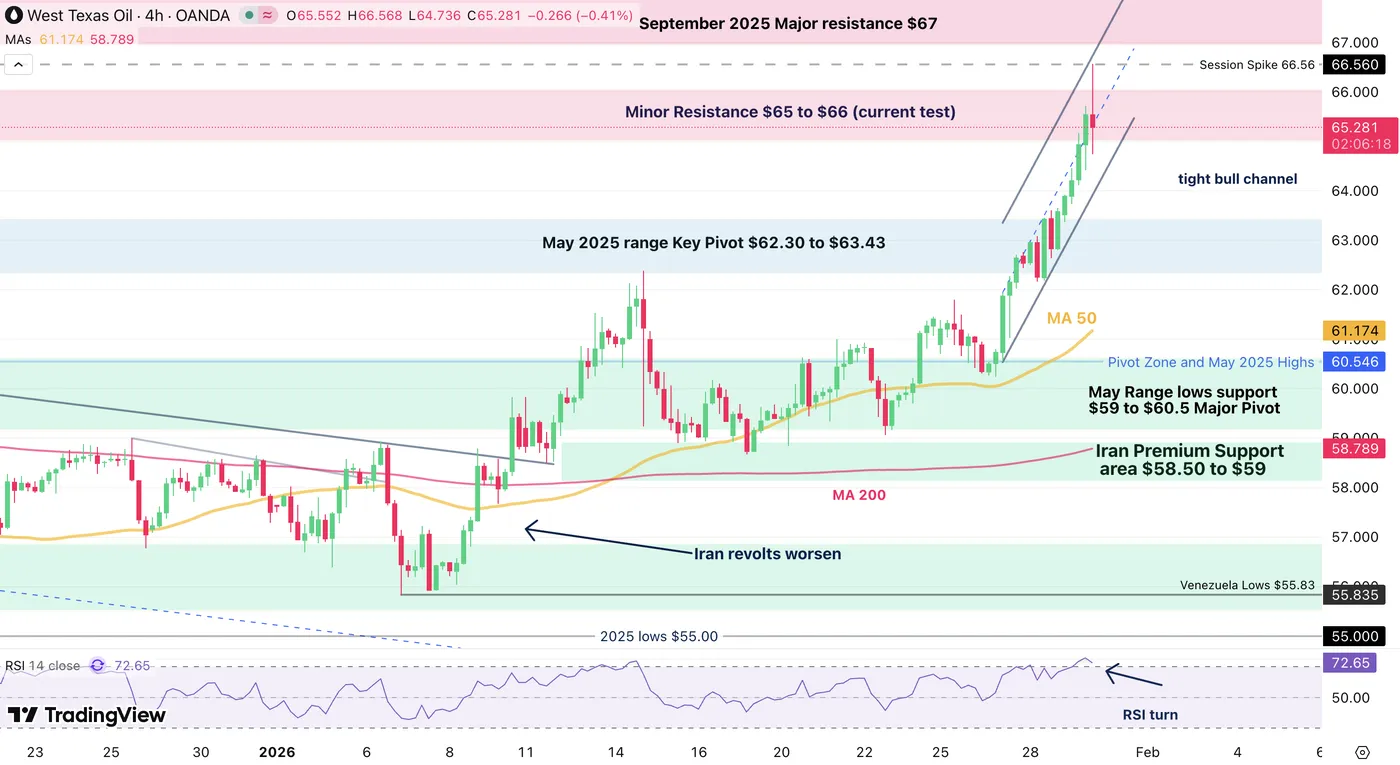
WTI Oil Daily Chart – January 29, 2026. Source: TradingView
As was expressed in our previous Oil piece, the 200-Day Moving Average ($62.59) offered a significant breakout signal after getting breached yesterday.
With the price action remaining solidly above its $58.50 Iran-Premium support, bulls have pushed for a daily tight bull channel in a 13% weekly rise.
Still, recent spikes to $66.56 highs have found rejection from increasingly overbought levels – As long as no attacks materialize, further upside could be limited. Let's discover why on shorter timeframes.
WTI 4H Chart and Technical Levels
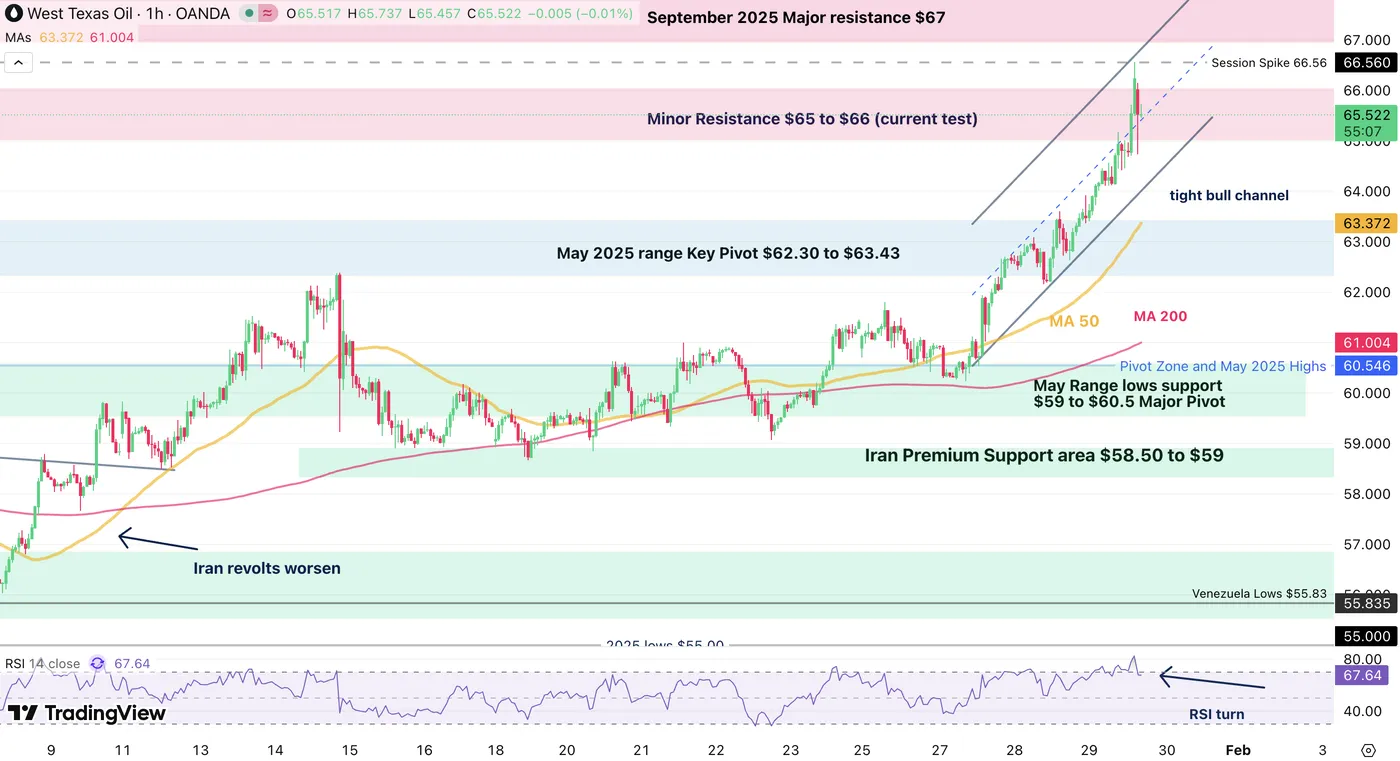
WTI Oil 4H Chart – January 29, 2026. Source: TradingView
With the recent spike in the action, RSI levels have turned into overbought conditions – logical when looking at the recent amassement of Military assets in the region.
The issue is that such volatility-premium spikes can be tricky to trade – A quick shift from Market maker pricing, demand explosions and headlines can trigger swift moves.
However, if nothing happens, the premium can quickly draw lower.
To spot if any attacks actually materialize, look at today's peak.
- Any rise above $66.56 points at an actual attack and could see WTI extend to $78, similar level as during the 12-Day War.
- In the meantime, if nothing happens, a retest of the $62.30 to $63.40 Pivot zone could largely occur and would provide a decent pullback entry to avoid entering at extremes. Stop entries on breakouts could also be warranted.
WTI Technical Levels
Levels to place on your WTI charts:
Resistance Levels
- Session Spike $66.56
- Minor Resistance $65 to $66 (current test)
- September 2025 Major resistance $67 (could get breached if US attacks)
- Psychological Resistance $70
- $78.43 12-Day War highs
Support Levels
- $64.00 Tight Channel Lows
- May 2025 range Key Pivot $62.30 to $63.43
- May Range lows support $59 to $60.5 Major support
- Iran Premium Support area $58.50 to $59
1H Chart and Trading Setups
WTI Oil 1H Chart – January 29, 2026. Source: TradingView
Looking even closer, the $65-$66 Resistance level will act as key area of interest:
- Remaining within the range through today and this weekly close would point to a continued breakout (lower odds if nothing new happens)
- Rejecting it however points to a retracement at least to the Main Pivot Zone
- Any sudden breakout above implies an actual attack – The premium is now fully priced in, hence any further reactions would confirm that the risk is on.
Safe Trades and Stay in Touch with the Latest News!
Canada’s Trade Deficit Deepens in November
Canada's trade deficit widened substantially from $395 million in October to $2.2 billion in November.
Exports in November pulled back (-2.8% month-on-month, m/m). However, the decline was narrowly based, driven by a 24.4% m/m drop in unwrought gold, silver, and platinum metals, and an 11.6% drop in motor vehicles and parts. Otherwise, 8 of 11 product categories registered a gain in October, with a 7.6% m/m increase in crude oil exports providing the largest lift.
Goods imports edged lower by 0.1% m/m in November, with 7 of 11 subsectors booking a decline. Imports of motor vehicles and parts (-4.5% m/m) contributed most to the drop, with energy imports (-10.6% m/m) also denting the headline number. A 6.2% m/m increase in consumer goods imports helped offset the impact.
In volume terms, merchandise exports were down 0.9% m/m while imports increased by 0.9% m/m.
Canada's merchandise trade surplus with the United States widened from $5.2 billion in October to $6.6 billion in November. Exports to non-U.S. markets fell by 4.9% m/m on the month.
Key Implications
Trade data for the month of November continues to highlight the impact that pronounced volatility in precious metals shipments are having on Canada's trade data. Smoothing through the noise, Canadian export volumes remain a few percent below their pre-tariff levels. The recovery in Canada's overall trade picture has been uneven, and businesses can anticipate challenging conditions in the months ahead.
Canada's recent strategic partnership with China may alleviate some strain in key sectors like autos and agriculture. But the future of North American trade will be highly contingent on the outcome of the upcoming review of the USMCA agreement. The U.S. Supreme Court is also soon set to rule on whether the U.S. administration's use of IEEPA tariffs is lawful. The jury is out on what the decision will be, but it may have implications for upcoming negotiations.
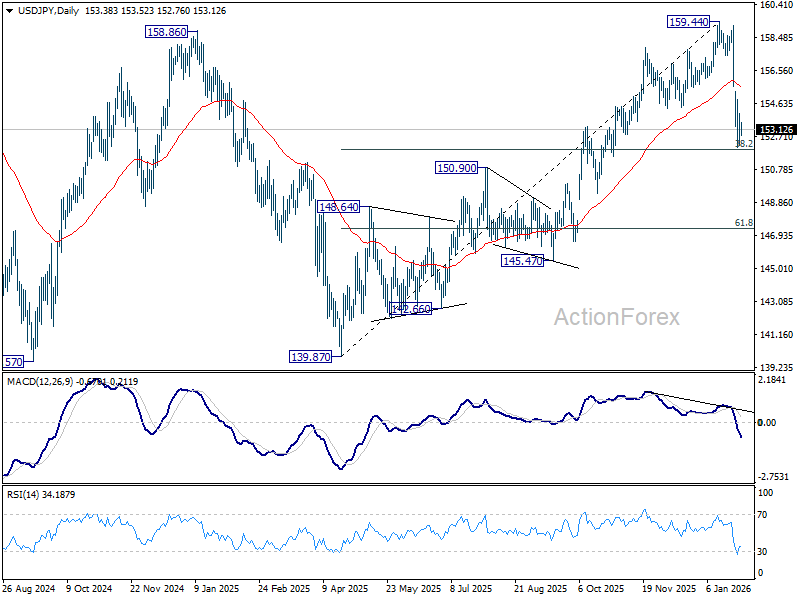
USD/JPY Mid-Day Outlook
Daily Pivots: (S1) 152.38; (P) 153.21; (R1) 154.24; More...
Intraday bias in USD/JPY remains neutral for the moment. As noted before, fall from 159.44 is seen as correcting the rise from 139.87. Strong support should be seen from 38.2% retracement of 139.87 to 159.44 at 151.96 to bring rebound, at least on first attempt. On the upside above 154.86 minor resistance will turn intraday bias to the upside for recovery. However, decisive break of 151.96 will argue that it is reversing whole rise from 139.87. Deeper decline would then be seen to 61.8% retracement at 147.34.
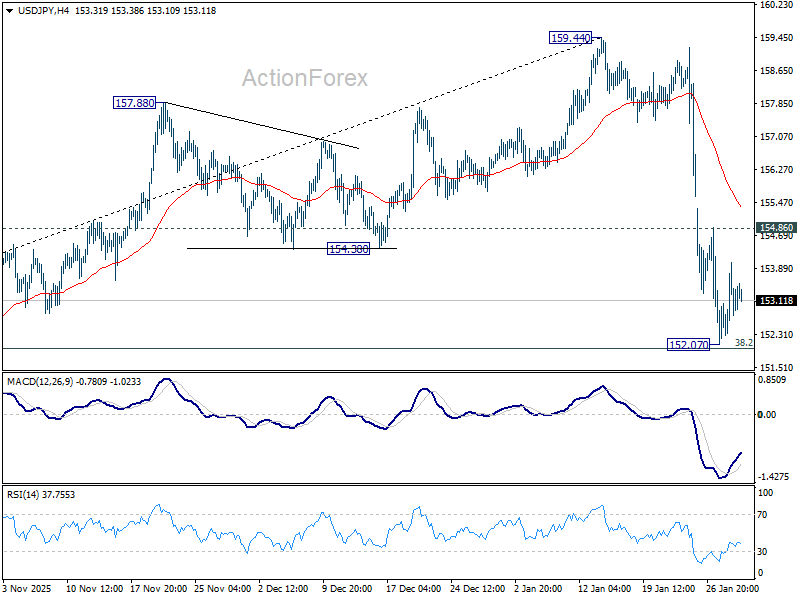
In the bigger picture, outlook is unchanged that corrective pattern from 161.94 (2024 high) should have completed with three waves at 139.87. Larger up trend from 102.58 (2021 low) could be ready to resume through 161.94. This will remain the favored case as long as 55 W EMA (now at 151.35) holds. However, sustained break of 55 W EMA will argue that the pattern from 161.94 is extending with another falling leg.
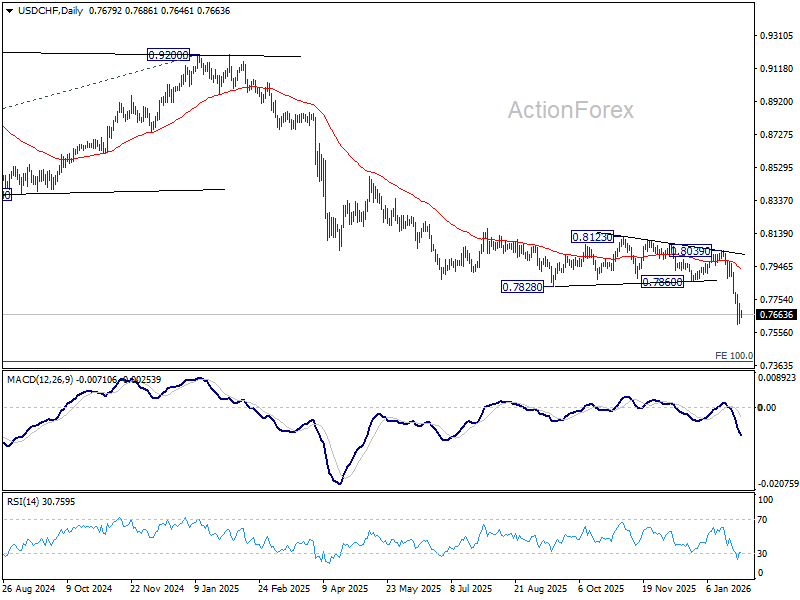
USD/CHF Mid-Day Outlook
Daily Pivots: (S1) 0.7622; (P) 0.7674; (R1) 0.7738; More….
USD/CHF is staying in consolidations above 0.7603 and intraday bias remains neutral. Outlook will stay bearish as long as 0.7792 resistance holds Break of 0.7603 will resume the larger down trend to 0.7382 projection level next. However, firm break of 0.7792 will turn bias back to the upside, for stronger rebound to 0.7860 support turned resistance.
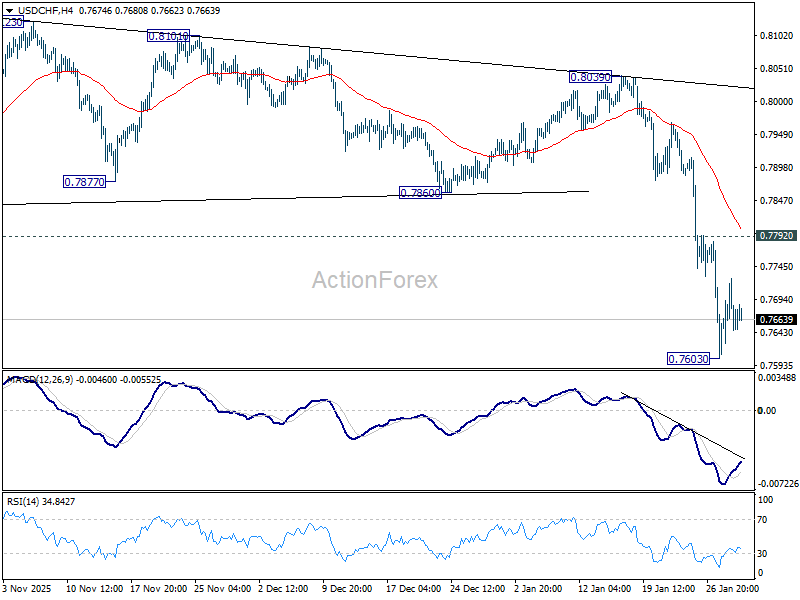
In the bigger picture, larger down trend from 1.0342 (2017 high) is still in progress and resuming. Next target is 100% projection of 1.0146 (2022 high) to 0.8332 from 0.9200 at 0.7382. In any case, outlook will stay bearish as long as 55 W EMA (now at 0.8184) holds.
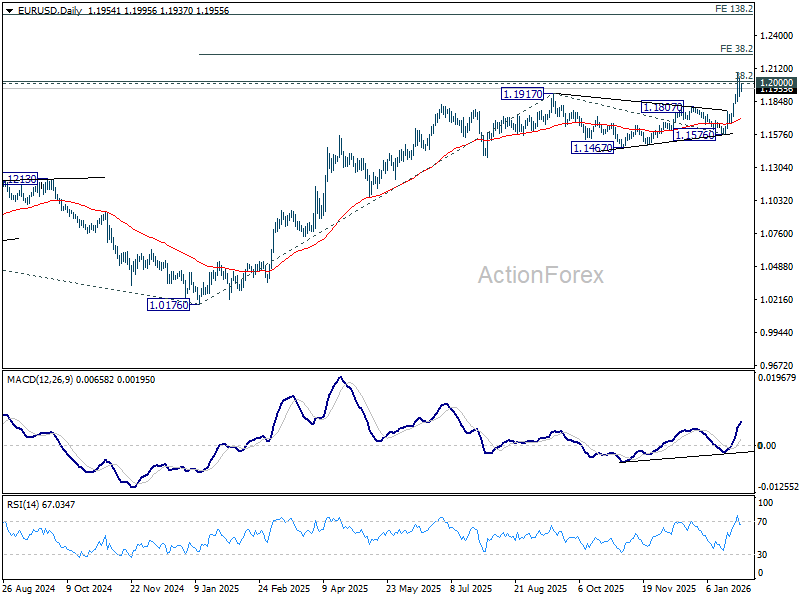
EUR/USD Mid-Day Outlook
Daily Pivots: (S1) 1.1885; (P) 1.1965; (R1) 1.2035; More….
EUR/USD is staying in consolidations below 1.2081 and intraday bias remains neutral. Downside should be contained by 1.1835 support. Decisive break above 1.2 will carry larger bullish implications. Next near term target will be 38.2% projection of 1.0176 to 1.1917 from 1.1576 at 1.3434. However, break of 1.1835 will indicate short term topping, and turn bias to the downside for deeper pullback.
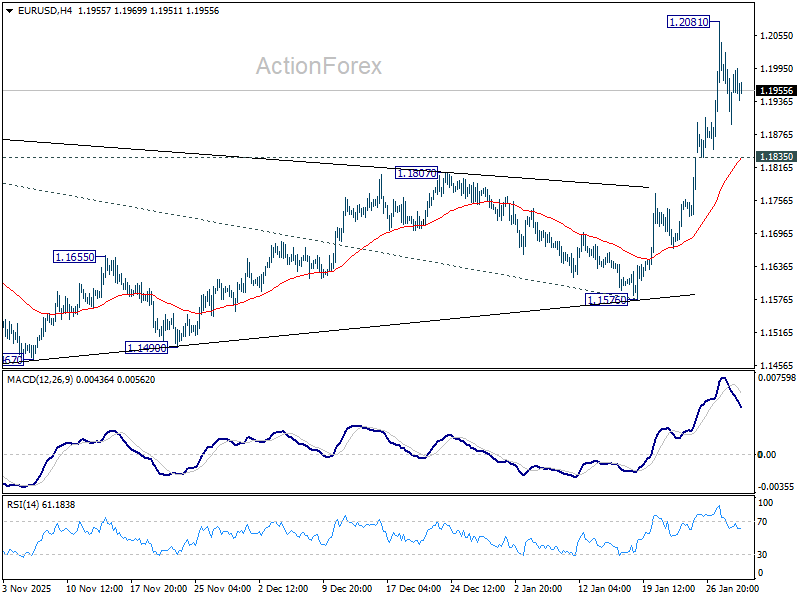
In the bigger picture, as long as 55 W EMA (now at 1.1443) holds, up trend from 0.9534 (2022 low) is still in favor to continue. Decisive break of 1.2 key psychological level will add to the case of long term bullish trend reversal. Next medium term target will be 138.2% projection of 0.9534 to 1.1274 from 1.0176 at 1.2581. However, sustained trading below 55 W EMA will argue that rise from 0.9534 has completed as a three wave corrective bounce, and keep long term outlook bearish.
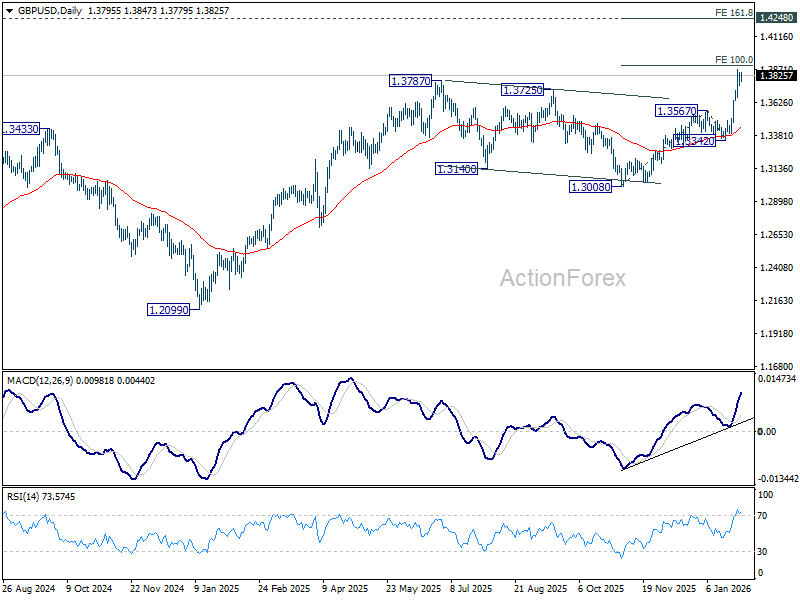
GBP/USD Mid-Day Outlook
Daily Pivots: (S1) 1.3755; (P) 1.3802; (R1) 1.3854; More...
GBP/USD is extending consolidations below 1.3867 temporary top and intraday bias stays neutral. Downside should be contained by 1.3641 to bring another rally. Firm break of 100% projection of 1.3008 to 1.3567 from 1.3342 at 1.3901 will pave the way to 161.8% projection at 1.4246, which is close to 1.4248 key structural resistance. However, break of 1.3641 will turn bias to the downside for deeper pullback.
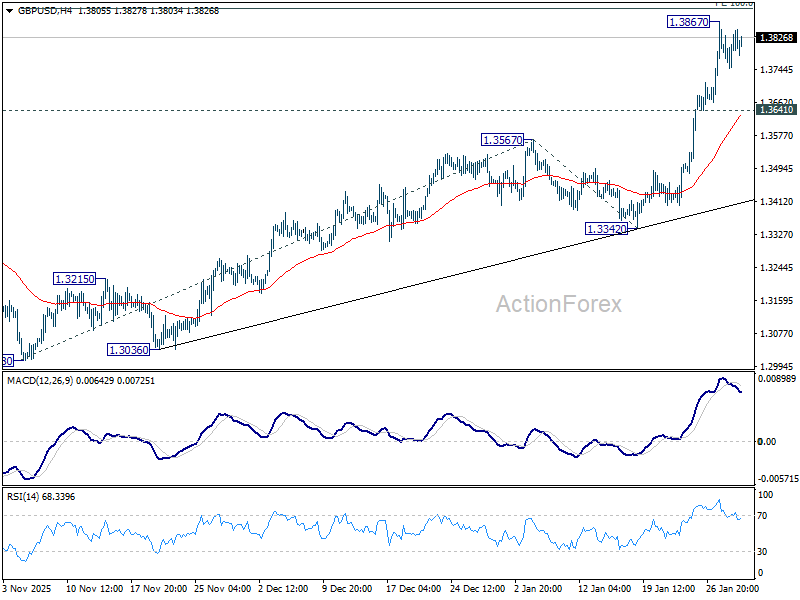
In the bigger picture, rise from 1.0351 (2022 low) is resuming by breaking through 1.3787 high. Further rally should be seen to 1.4284 key resistance (2021 high). Decisive break there will add to the case of long term bullish trend reversal. For now, outlook will stay bullish as long as 1.3008 support holds, even in case of deep pullback.
Dollar Stays Heavy as Trump Renews Attacks on Fed Powell, Oil Surges
Trading in the FX markets has turned notably listless, with Dollar continuing to drift lower but without broad-based follow-through. Political pressure, however, returned swiftly. US President Donald Trump again lashed out at Fed Chair Jerome Powell, criticizing the decision to keep rates unchanged and reviving his long-running argument that policy is far too tight. He said Powell “again refused to cut interest rates,” arguing there was “absolutely no reason” to keep rates at current levels. He went further, calling for substantial and immediate easing, insisting the Fed is acting too slowly.
The President also tied rate policy directly to trade strategy, claiming tariffs have made the US “strong and powerful again” and arguing that, as a result, the US should be paying lower interest rates than any other country. Markets largely shrugged off the remarks, seeing them as reinforcing political pressure rather than signaling imminent policy change.
Elsewhere, Oil prices surged, with WTI pushing back above the 65 mark to the highest level since late September. The rally was driven by rising concern over a possible US military strike on Iran. Markets are increasingly focused on the risk of retaliation, particularly the prospect that Iran could disrupt traffic through the Strait of Hormuz, a chokepoint for roughly 20 million barrels per day of global oil supply.
In FX performance terms for the week so far, Dollar remains firmly at the bottom, followed by Euro and Sterling. Aussie leads, with Kiwi and Swiss Franc close behind. Yen and Loonie are holding near the middle.
In Europe, at the time of writing, FTSE is up 1.00%. DAX is down -0.88%. CAC is up 0.92%. UK 10-year yield is down -0.023 at 4.530. Germany 10-year yield is down -0.005 at 2.854. Earlier in Asia, Nikkei rose 0.03%. Hong Kong HSI rose 0.51%. China Shanghai SSE rose 0.16%. Singapore Strait Times rose 0.42%. Japan 10-year JGB yield rose 0.014 to 2.257.
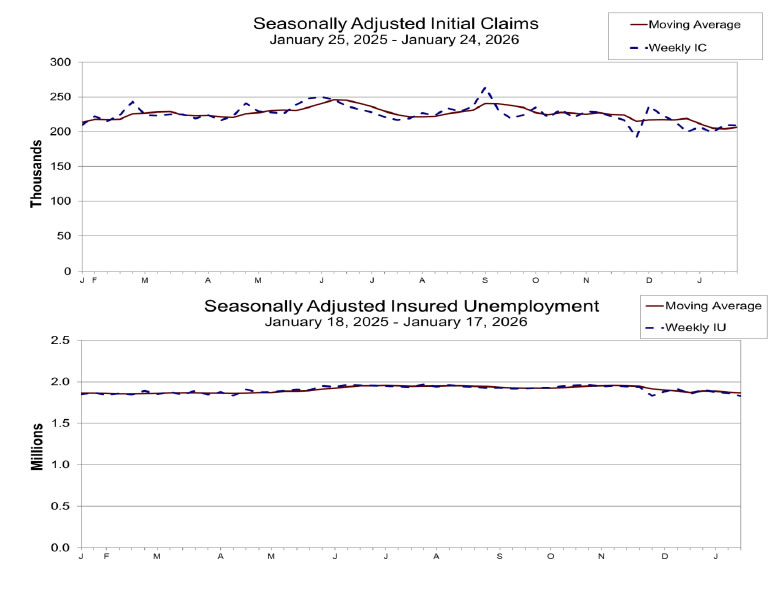
US initial jobless claims tick down to 209k, vs exp 200k
US initial jobless claims fell -1k to 209k in the week ending January 24, above expectation of 200k. Four-week moving average of initial claims rose 2k to 206k.
Continuing claims fell -38k to 1827k in the week ending January 17, lowest since September 21, 204. Four-week moving average of continuing claims fell -7k to 1868k.
BoC Macklem sees forecasts more fragile amid rising uncertainty
In an interview with Reuters, BoC Governor Tiff Macklem warned that the global environment faces an unusually high risk of fresh disruptions. He said geopolitical risks are "elevated" and that the potential for new shocks has increased materially. He also cited attacks on the independence of the Fed as an added source of uncertainty this year.
As a result, he said the Bank of Canada’s latest economic projections are more "vulnerable" than usual, with “more things that can go wrong around that forecast.”
Asked whether risks later this year lean more toward a rate cut or a hike, Macklem declined to assign a directional bias. He said the level of uncertainty makes it difficult to meaningfully assess probabilities. "And, to be honest, I think we're finding that difficult," he added.
Macklem pointed to renewed tariff threats from the White House and the upcoming review of the US-Mexico-Canada trade framework as clear risks to the outlook, on top of broader global uncertainties.
The comments followed the BoC’s decision this week to keep rates on hold and publish updated forecasts that continue to show modest growth in 2026 and 2027, broadly unchanged from October.
EU and Eurozone economic sentiment jumps as confidence broadens Into 2026
Economic sentiment in Europe improved sharply in January, with the Economic Sentiment Indicator rising 1.9 points to 99.2 in the EU and 2.2 points to 99.4 in the Eurozone. The readings mark the closest approach to the long-term average of 100 since mid-2022, signaling a meaningful improvement in confidence at the start of 2026.
Labor outlook strengthened alongside sentiment. Employment Expectations Indicator climbed to its highest level in 12 months in both the EU (99.1) and the Eurozone (98.2), suggesting firms are becoming more confident about near-term hiring despite lingering macro uncertainty.
The improvement was broad-based. Confidence rose across industry, services, retail trade, and among consumers, with construction the only sector showing a marginal decline. Country data also highlights the breadth of the rebound, with notable gains in all six largest EU economies: France (+5.8), Germany (+3.0), Poland (+2.9), Netherlands (+2.3), Spain (+1.7) and Italy (+1.3), pointing to a region-wide uplift rather than isolated strength.
NZ ANZ business confidence eases to 64.1, pricing signals turn hotter
New Zealand’s ANZ Business Confidence eased in January, slipping from a 30-year high of 73.6 to 64.1. While the decline looks notable, confidence remains at a very strong level historically. The own activity outlook also moderated, falling from 60.9 to 51.6, pointing to some loss of momentum after December’s surge. According to ANZ, the coming months will be key in determining whether growing talk of rate hikes begins to weigh on activity.
The more important signal came from inflation indicators, which moved decisively higher. The net share of firms expecting to raise prices in the next three months rose 5 points to 57%, the highest reading since March 2023. Firms also expect to raise prices by 2.1%, up from 1.8%, marking the fastest pace in two years. Wage pressures are beginning to lift modestly, while inflation expectations reached their %, highest level in 15 months.
ANZ described the results as a mix of “good news and bad news,” warning that the inflation signals are not consistent with forecasts from either the bank or the RBNZ. Explanations include faster margin recovery or less spare capacity than assumed. ANZ still forecasts the first OCR hike in December, but cautioned that if pricing intentions show up in hard data, tightening could come earlier.
New Zealand exports and imports jump 15% yoy in December
New Zealand recorded a modest but better-than-expected trade surplus of NZD 52m in December, exceeding forecasts for a NZD 40m surplus. According to Stats NZ, goods exports jumped 15% year-on-year to NZD 7.7B, while goods imports rose by a similar 15% to NZD 7.6B, reflecting strong two-way trade flows at year-end.
Export growth was broad-based across key trading partners. Shipments to Australia rose NZD 204m (26% yoy), while exports to the EU increased NZD 120m (31%). Exports to China, New Zealand’s largest market, grew a more modest 4.6%, while gains were also recorded to the US (4.8%) and Japan (15%).
On the import side, increases were led by China, with imports up NZD 381m (27% yoy), followed by the EU (26%) and Australia (27%). In contrast, imports from the US fell -16% yoy, offering some offset to the overall rise.
GBP/USD Mid-Day Outlook
Daily Pivots: (S1) 1.3755; (P) 1.3802; (R1) 1.3854; More...
GBP/USD is extending consolidations below 1.3867 temporary top and intraday bias stays neutral. Downside should be contained by 1.3641 to bring another rally. Firm break of 100% projection of 1.3008 to 1.3567 from 1.3342 at 1.3901 will pave the way to 161.8% projection at 1.4246, which is close to 1.4248 key structural resistance. However, break of 1.3641 will turn bias to the downside for deeper pullback.
In the bigger picture, rise from 1.0351 (2022 low) is resuming by breaking through 1.3787 high. Further rally should be seen to 1.4284 key resistance (2021 high). Decisive break there will add to the case of long term bullish trend reversal. For now, outlook will stay bullish as long as 1.3008 support holds, even in case of deep pullback.
US initial jobless claims tick down to 209k, vs exp 200k
US initial jobless claims fell -1k to 209k in the week ending January 24, above expectation of 200k. Four-week moving average of initial claims rose 2k to 206k.
Continuing claims fell -38k to 1827k in the week ending January 17, lowest since September 21, 204. Four-week moving average of continuing claims fell -7k to 1868k.
BoC Macklem sees forecasts more fragile amid rising uncertainty
In an interview with Reuters, BoC Governor Tiff Macklem warned that the global environment faces an unusually high risk of fresh disruptions. He said geopolitical risks are "elevated" and that the potential for new shocks has increased materially. He also cited attacks on the independence of the Fed as an added source of uncertainty this year.
As a result, he said the Bank of Canada’s latest economic projections are more "vulnerable" than usual, with “more things that can go wrong around that forecast.”
Asked whether risks later this year lean more toward a rate cut or a hike, Macklem declined to assign a directional bias. He said the level of uncertainty makes it difficult to meaningfully assess probabilities. "And, to be honest, I think we're finding that difficult," he added.
Macklem pointed to renewed tariff threats from the White House and the upcoming review of the US-Mexico-Canada trade framework as clear risks to the outlook, on top of broader global uncertainties.
The comments followed the BoC’s decision this week to keep rates on hold and publish updated forecasts that continue to show modest growth in 2026 and 2027, broadly unchanged from October.
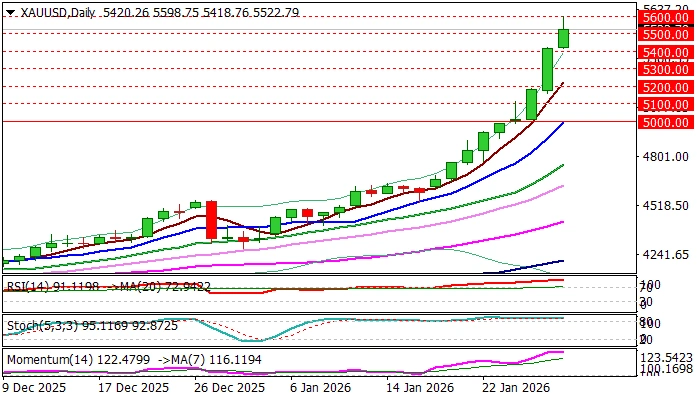
XAU/USD: Gold Price Exploded After Break of $5,000 Barrier and Eye $6,000
When gold broke through magic $5000 barrier on Monday, I was asked whether the metal can reach $5500 in coming months? My answer was that $6000 per ounce is very likely and in a matter of weeks, not by the end of the year, as some analysts predicted.
Four days later, gold touched the high at almost $5600, so if we follow that logic, reaching $6000 may take just few days.
In the current situation when demand grows exponentially, this may look like very likely scenario, but we must know that gold moved in nine-day uninterrupted rally, in which the metal price rose by $980 (around 21%) and the fact that each action produces reaction.
I believe that bulls may take a breather, as investors look to cash in on their huge profits, or at least a part.
The price may dip further in such scenario, as we have already witnessed pullback from new record high to the level below $5500, however, deeper drop is still needed to generate an initial signal of potential formation of Gravestone Doji pattern.
In this case, daily close below $5500 will be the minimum requirement to keep in play hopes of deeper pullback, with extension below $5400 breakpoint zone (near today’s low / Wednesday’s high / psychological) to boost negative signals.
Such scenario is supported by overstretched daily indicators from the technical point of view and slightly eased threats of US attack on Iran (as currently dominant driver of the price), following signals that US army is still in sit and wait mode.
On the other hand, bulls may regain traction like in past two days, when the price was initially in defensive and moved again higher during late US session, with other key factors standing behind the recent strong acceleration higher, being mainly intact and expected to further fuel bulls.
Res: 5600; 5700; 5726; 5807.
Sup: 5500; 5470; 5400; 5350.